for professional investors or advisers only. not for distribution. tel aviv institutional investment...
TRANSCRIPT

For professional investors or advisers only. Not for distribution.
Tel Aviv Institutional Investment Conference 2012
There is a Solution
Tim Matthews
The Illusion of Cheap Beta from ETFs
March 2012
Senior Fund Manager, QEP Investment Team
www.schroders.co.il

Conventional Wisdom 1: Market Cap weighted index funds and ETFs are the safe route

3
The positives and negativesMarket Cap weighted Index Funds (and Passive ETFs)
Positives– Diversification – reduces the risk of single stock damaging your portfolio
– Systematic – creates a repeatable and transparent investment
– Fees for “index” solutions are typically lower – but what about ETFs?
Negatives– Concentrated – excessive stock concentration in certain indices e.g. Vodafone, oil stocks
– Lack of breadth – universe restriction limits opportunities e.g. Emerging Markets
– Anti-Value – encourages investors to buy high and sell low e.g. Tech stocks

0%
10%
20%
30%
40%
50%
1986 1989 1992 1995 1998 2001 2004 2007
MSCI World
% Weight
Japanese stock market bubble of the late 1980s
0%
10%
20%
30%
40%
1994 1996 1998 2000 2002 2004 2006 2008
MSCI World
Technology/Telecoms bubble of 1999/2000% Weight
Source: Schroders, MSCI
36% of MSCI World is comprised of tech stocks here
44% of MSCI World is comprised of Japanese stocks here
Market Cap weights follow momentumBack the winners of yesterday and losers of tomorrow
4

Indices can restrict your investment universe
Emerging markets
Mid caps
Small caps
MSCI World– Typical indices like MSCI World only cover large cap stocks from developed markets
– Significant opportunities from emerging markets, small and mid caps
– We believe there is a global investible universe of 15,000 stocks compared with only 1,613 stocks in MSCI World
Source: Schroders, MSCI. MSCI index constituents as at 31st January 2012.
Significant opportunities exist outside of the index
5

6
Exploiting every opportunity
Source: Schroders, MSCI as at 31st January 2012
All global stocks > 15,000 stocks > 50 countries
MSCI AC World >2,400 stocks 45 countries
MSCI World >1,600 stocks 24 countries
MSCI Europe
Conventional Wisdom 2: Bigger is better
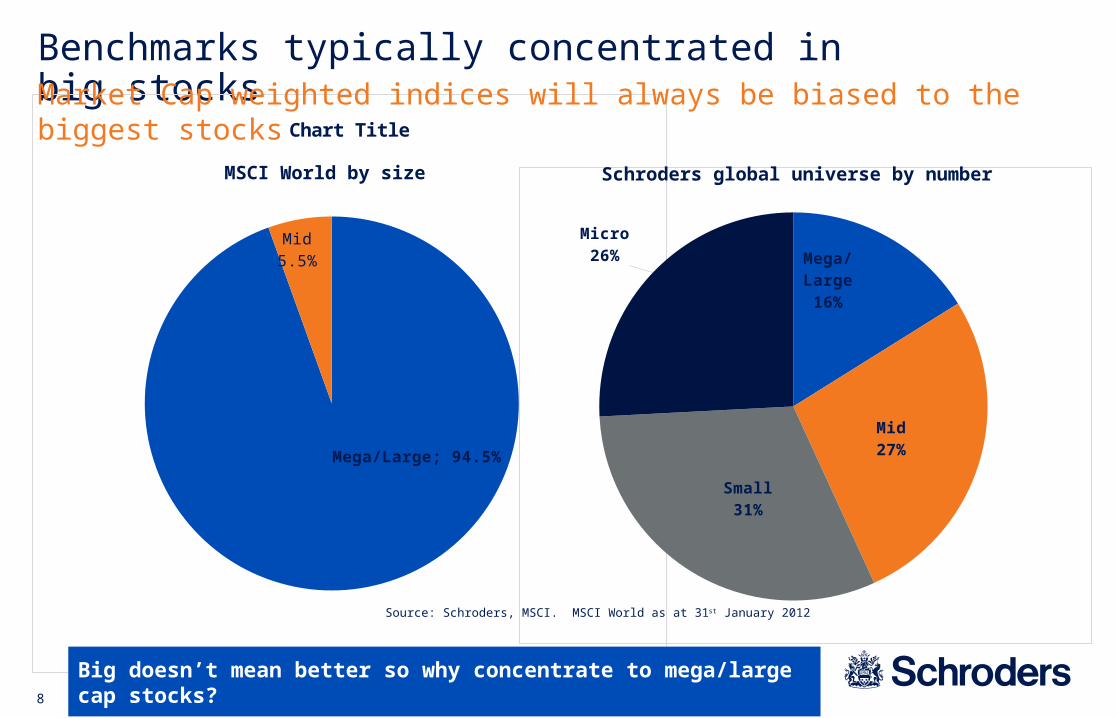
Benchmarks typically concentrated in big stocks
Mega/Large; 94.5%
Mid5.5%
Chart Title
Source: Schroders, MSCI. MSCI World as at 31st January 2012
Mega/Large16%
Mid27%
Small31%
Micro26%
MSCI World by size
Market Cap weighted indices will always be biased to the biggest stocks
Big doesn’t mean better so why concentrate to mega/large cap stocks?
Schroders global universe by number
8

9
-5.0%-5.3%
-7.1%
-3.0%-3.2%-2.9%
-10%
-8%
-6%
-4%
-2%
0%
1 year 5 years 10 years
Largest Stock Largest 10 stocks
Historically, mega caps have underperformed.
From 1926 to 2004, if each year you had bought the 10 largest stocks in the S&P 500 you would have under-performed the market average by 3% pa for the next 10 years
Underperformance of largest stocks
Backing the largest stocks has underperformed
Source: Robert D. Arnott. FAJ March/ April 2005
% pa
Backing yesterday’s winners not necessarily a smart strategy

Challenging Conventional Wisdom in Global Equities
Conventional wisdom
– Follow benchmarks, go passive and use Cap weighted index funds or ETFs
– Only concentrated portfolios give high conviction
– Big stocks are better
Our approach
– Embrace breadth
– Be unconstrained
– Systematically rebalance
– Diversification can increase returns (not reduce them!)
– Focus on Value and Quality
10
11
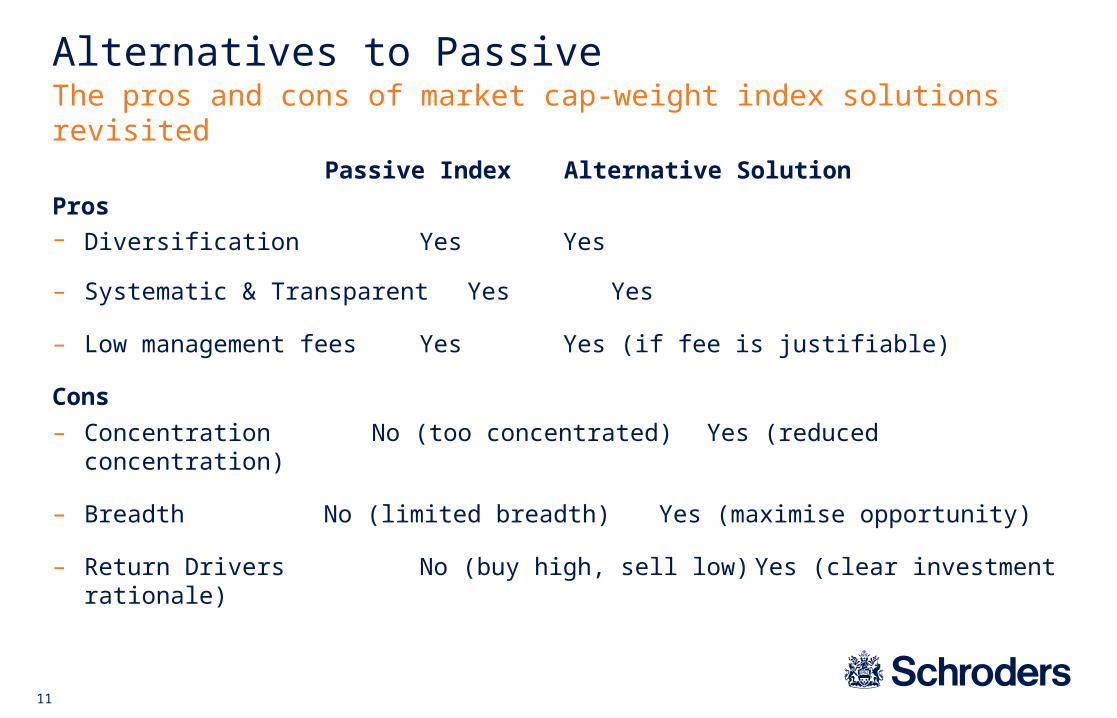
The pros and cons of market cap-weight index solutions revisitedAlternatives to Passive
Passive Index Alternative Solution
Pros– Diversification Yes Yes
– Systematic & Transparent Yes Yes
– Low management fees Yes Yes (if fee is justifiable)
Cons
– Concentration No (too concentrated) Yes (reduced concentration)
– Breadth No (limited breadth) Yes (maximise opportunity)
– Return Drivers No (buy high, sell low) Yes (clear investment rationale)
12
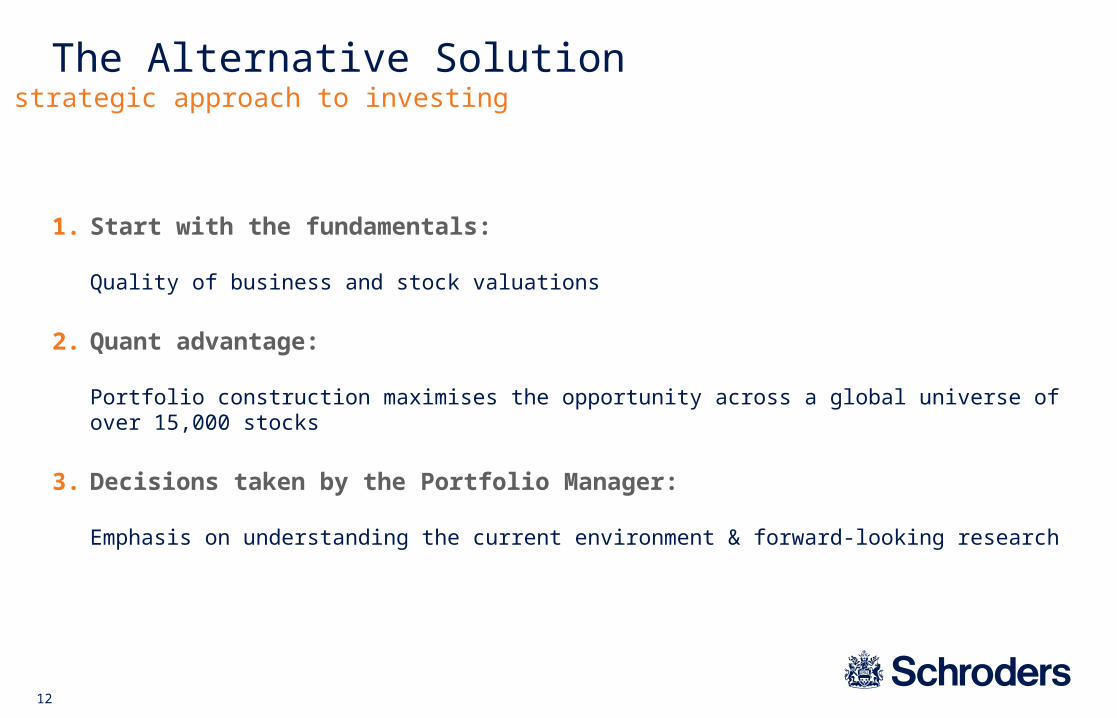
The Alternative SolutionA strategic approach to investing
1. Start with the fundamentals:
Quality of business and stock valuations
2. Quant advantage:
Portfolio construction maximises the opportunity across a global universe of over 15,000 stocks
3. Decisions taken by the Portfolio Manager:
Emphasis on understanding the current environment & forward-looking research
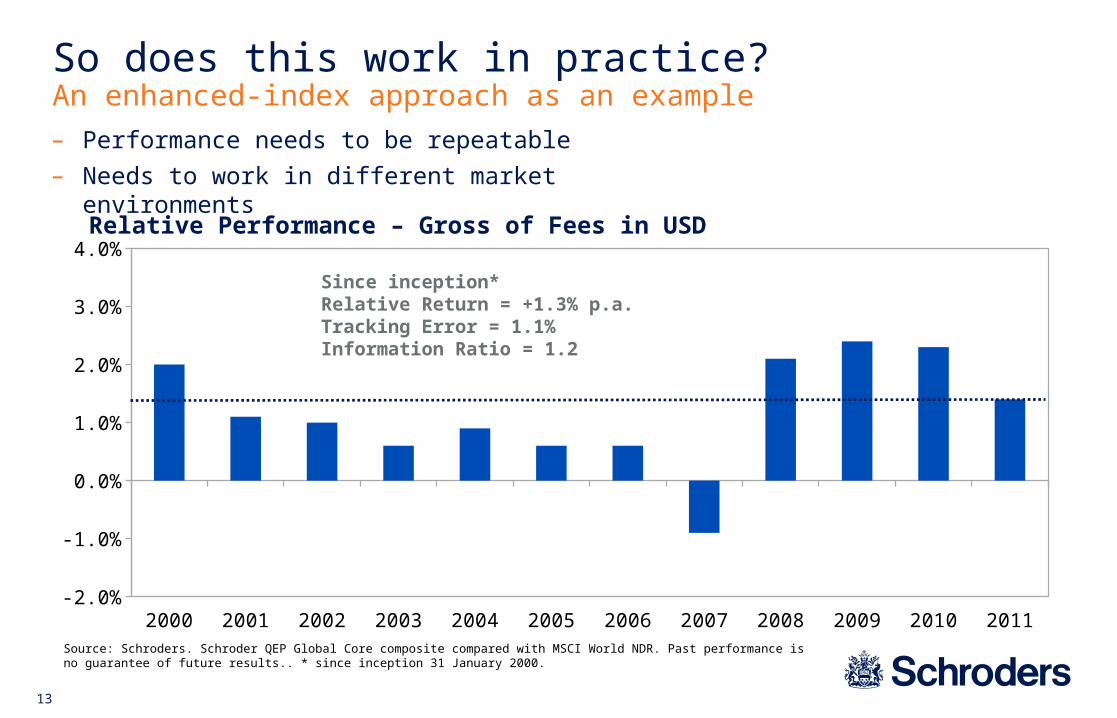
2000 2001 2002 2003 2004 2005 2006 2007 2008 2009 2010 2011-2.0%
-1.0%
0.0%
1.0%
2.0%
3.0%
4.0%
13
Source: Schroders. Schroder QEP Global Core composite compared with MSCI World NDR. Past performance is no guarantee of future results.. * since inception 31 January 2000.
– Performance needs to be repeatable
– Needs to work in different market environments
So does this work in practice?An enhanced-index approach as an example
Relative Performance – Gross of Fees in USD
Since inception* Relative Return = +1.3% p.a.Tracking Error = 1.1%Information Ratio = 1.2
14
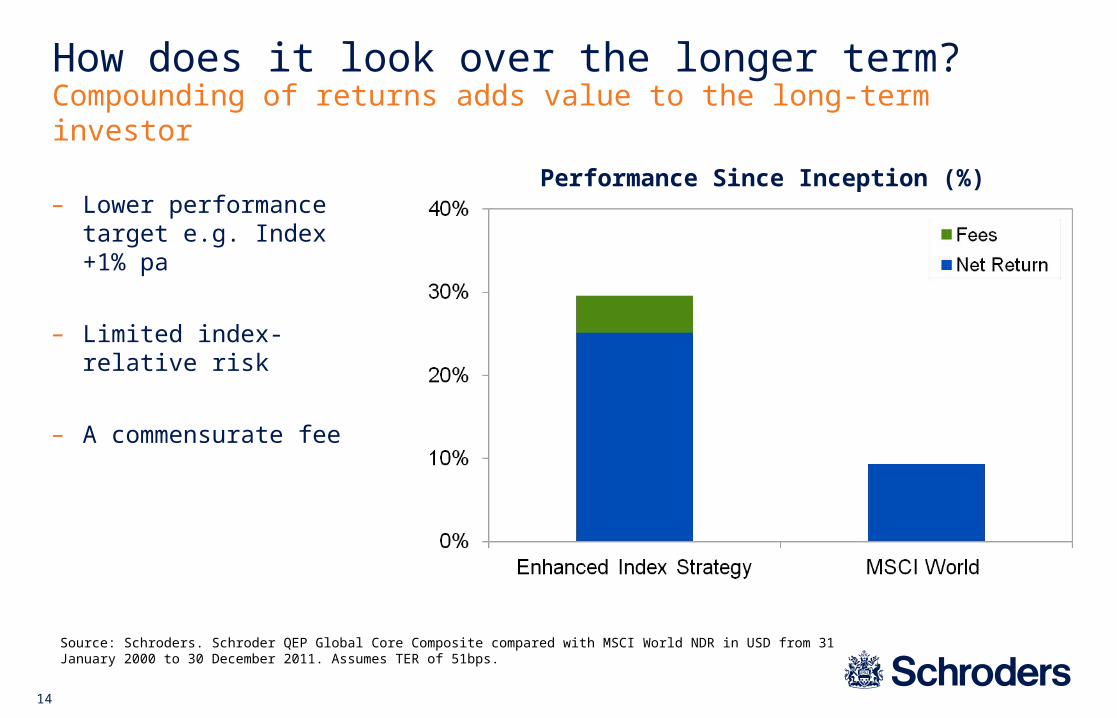
Performance Since Inception (%)
How does it look over the longer term?Compounding of returns adds value to the long-term investor
Source: Schroders. Schroder QEP Global Core Composite compared with MSCI World NDR in USD from 31 January 2000 to 30 December 2011. Assumes TER of 51bps.
– Lower performance target e.g. Index +1% pa
– Limited index-relative risk
– A commensurate fee

15
Source: Bloomberg as at 29th February 2012 with total returns in USD net of fees. Schroder ISF Global Core C Share Class (BB ticker: SCHGLEC) – TER 51bps. Fund inception date: 30th September 2001. iShares MSCI World (BB ticker: IDWR) – TER 50bps, Lyxor ETF MSCI World (BB ticker: LYWLD) – TER 45bps
…with index plus rather than index minus performanceA Superior Alternative to ETFs

16
Rebalancing versus momentum What are the key return drivers?
– Contra-trading against market fads (e.g. rebalancing)
– Need an anchor that is not price sensitive
– This anchor can be anything measurable (equal weighting or even the length of a company’s name)
– How do we define Value? Dividends, Cash, Earnings, Sales & Assets
Source: Schroders, Worldscope, QEP. The Equally weighted index and “Length of company name” indices were both calculated using the same universe as the Fundamental Index (simulated by QEP) Developed 1000 index and rebalanced in March of each year with stocks either weighted equally or weighted by the length of the company name (companies with longer names were assigned higher weights). All returns are local (gross).
0
100
200
300
400
500
600
700
800
90 92 94 96 98 00 02 04 06 08 10
Value-based StrategyEqual WeightedLength of Company NameMarket Cap Weighted
Cumulative return

17
Monthly win rate higher in times of market stress
What are the key return drivers?Quality performs when risk aversion is rising
– An alternative approach to value investing
– Quality is ‘Growth style’ investing without the return drag associated with purchasing glamour stocks
– How do we define it?Profitability, Stability, Financial Strength
55%
0%
25%
50%
75%
100%
49%
Up Markets
82%
Down Markets
61%
Volatile Markets
55%
Stable Markets
Source: Schroders, QEP. Live performance has been included from November 2007 to October 2010 onwards prior to this simulated results are shown back to 1988. They are the result of quantitative back-testing which are based on a number of assumptions. There are a number of limitations on the retroactive reconstruction of any performance results based on simulations and simulated results must be considered as no more than approximate representation of the strategy’s potential performance.
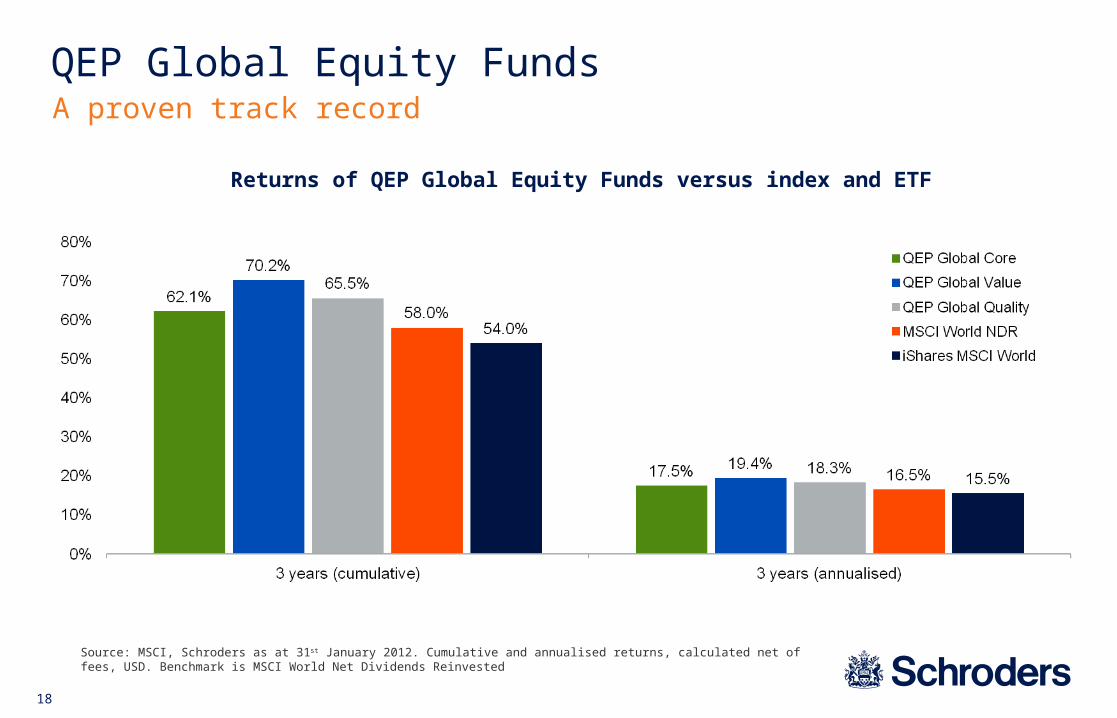
Source: MSCI, Schroders as at 31st January 2012. Cumulative and annualised returns, calculated net of fees, USD. Benchmark is MSCI World Net Dividends Reinvested
QEP Global Equity Funds
Returns of QEP Global Equity Funds versus index and ETF
A proven track record
18

1. Highly Fee-Sensitive Clients with a preference for the Index QEP Global Core
– Incremental, repeatable returns compound over time to be significant
2. Longer Horizon Investors Looking to Harvest the Equity Risk Premium QEP Global Value
– Unconstrained strategies offer higher relative returns to those willing to step away from the index
3. Risk-Averse Equity Investors with a Shorter Investment Horizon QEP Global Quality
– Quality strategies work well in distressed markets which is often when pension fund investors are most interested in their investments
SummaryA range of solutions for different types of client
19
The QEP Investment Team has over US$ 20bn of assets under management
Majority of clients are sophisticated institutional investors who have discovered there is an alternative way to invest in Global Equities
Source: Schroders as at 30th September 2011

20
This presentation is intended to be for information purposes only and it is not intended as promotional material in any respect. The material is not intended as an offer or solicitation for the purchase or sale of any financial instrument. The material is not intended to provide, and should not be relied on for, accounting, legal or tax advice, or investment recommendations.
Information herein is believed to be reliable but Schroders does not warrant its completeness or accuracy. No responsibility can be accepted for errors of fact or opinion. Reliance should not be placed on the views and information in the document when taking individual investment and/or strategic decisions.
Third party data is owned or licensed by the data provider and may not be reproduced or extracted and used for any other purpose without the data provider's consent. Third party data is provided without any warranties of any kind. The data provider and issuer of the document shall have no liability in connection with the third party data. The Prospectus and/or www.schroders.com contains additional disclaimers which apply to the third party data.
Schroders has expressed its own views in this presentation and these may change. Issued by Schroder Investment Management Limited, 31 Gresham Street, London EC2V 7QA, which is authorised and regulated by the Financial Services Authority. For your security, communications may be taped or monitored.
Important Information