for personal use only southern cross austereo · 2014-08-19 · • profit on the sale of sunshine...
TRANSCRIPT

FY14 INVESTOR PRESENTATION
SOUTHERN CROSS AUSTEREO
1
For
per
sona
l use
onl
y

RESULTS SUMMARY • Reported revenues down 0.3%, adjusted revenues up 0.5% • Reported EBITDA of $179.7m is down 14.8%, adjusted EBITDA of $187.8m is down
5.4% • Reported NPAT down 408.4%, adjusted NPAT down 5.6% to $79.7m (in line with
market guidance) • Significant items have impacted FY14 reported results (primarily impairment of
regional business) • Reported EPS of (42.0), adjusted EPS of 11.3 cps down 5.8% on prior year
• Strong cash earnings with 103.8% of adjusted EBITDA converted to cash
• Declared fully franked dividend of 3 cents per share
• Announced DRP shortfall agreement for up to 100% of the DRP shortfall
2
For
per
sona
l use
onl
y

HEADLINE ACHIEVEMENTS
GALEY, MATT & CHARLI, SEA FM 90.9 3
For
per
sona
l use
onl
y
HEADLINE ACHIEVEMENTS Financial • New 5 year $650m debt facility with reduced margins - delivered H2 interest
savings of $4.0m • Further reduction in net debt, down $11.8m to $594.4m • Leverage ratio of 2.93 remains well below covenant levels • Despite significant investment in new content, efficiency drive kept operating cost
increases to 3.2% • Solid cash generation – 103.8% of EBITDA (excluding significant items) converted
to cash • Favourable resolution of outstanding tax issue
4
For
per
sona
l use
onl
y
HEADLINE ACHIEVEMENTS
1 GFK Metro Survey #4, 2 Regional TAM Week 07 – 31 2014
Ratings • Triple M Network
o 2.7m listeners nationally and the #1 network for men around the country 1 o #1 Breakfast show in Melbourne & Perth 1 o Melbourne awarded the world’s most innovative radio station at 2014 Worldwide Radio
Summit • Today network continues to deliver the biggest radio audience in Australia
o Over 3.3m listeners nationwide and the #1 network for females under 40 1 o 1.5m listeners in Drive with Dan & Maz and 1.1m listeners with Hamish and Andy 1
o Fox FM’s Fifi & Dave has the largest audience of any FM Breakfast show 1 o Fox remains the biggest radio station in Australia with over 1.0m listeners 1
o 2DayFM remains the groups number one priority
• SC 7 Affiliates consistently deliver 40%+ audience share weekly 2
5
For
per
sona
l use
onl
y
HEADLINE ACHIEVEMENTS Market Leading Online & Social Media Footprint Driving Listeners & Engagement
• 17.3% year on year growth in Digital revenue
• SCA has 4 of the top 5 most engaging Facebook pages in Australia, and 6 of the top 10 1
• 112% YOY Growth in Australian Average Daily Unique Browsers2
• #7 Australian daily publisher via mobile browser (from #12)2
• #15 Australian daily publisher on all devices (from #22)2
• #1 and #2 radio brands (Today Network & Triple M Network) on Web, Mobile and Social
platforms2 & 3
• SCA’s Group wide Facebook community ranks in the top three in the ASX 2001
1 Cumulative likes/fans Australian Facebook Performance Report (June 2014) 2 Nielsen Online Ratings - Market Intelligence, Avg. Daily UB, June 2013 - June 2014 3 Facebook Insights, Zuum Social Reporting, SCA Facebook Data
6
For
per
sona
l use
onl
y

FY14 FINANCIAL RESULTS
HEIDI, WILL & WOODY, 92.9 7
For
per
sona
l use
onl
y
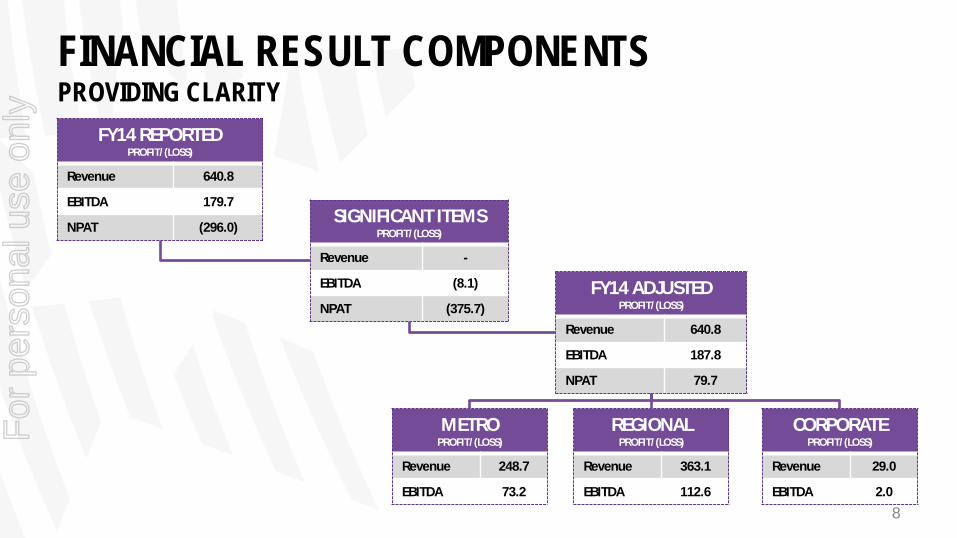
FINANCIAL RESULT COMPONENTS PROVIDING CLARITY
FY14 REPORTED PROFIT/(LOSS)
Revenue 640.8
EBITDA 179.7
NPAT (296.0) SIGNIFICANT ITEMS
PROFIT/(LOSS)
Revenue -
EBITDA (8.1)
NPAT (375.7)
METRO PROFIT/(LOSS)
Revenue 248.7
EBITDA 73.2
REGIONAL PROFIT/(LOSS)
Revenue 363.1
EBITDA 112.6
CORPORATE PROFIT/(LOSS)
Revenue 29.0
EBITDA 2.0
FY14 ADJUSTED PROFIT/(LOSS)
Revenue 640.8
EBITDA 187.8
NPAT 79.7
8
For
per
sona
l use
onl
y
STATUTORY ACCOUNTS
THE GRILL TEAM, SYDNEY 9
For
per
sona
l use
onl
y
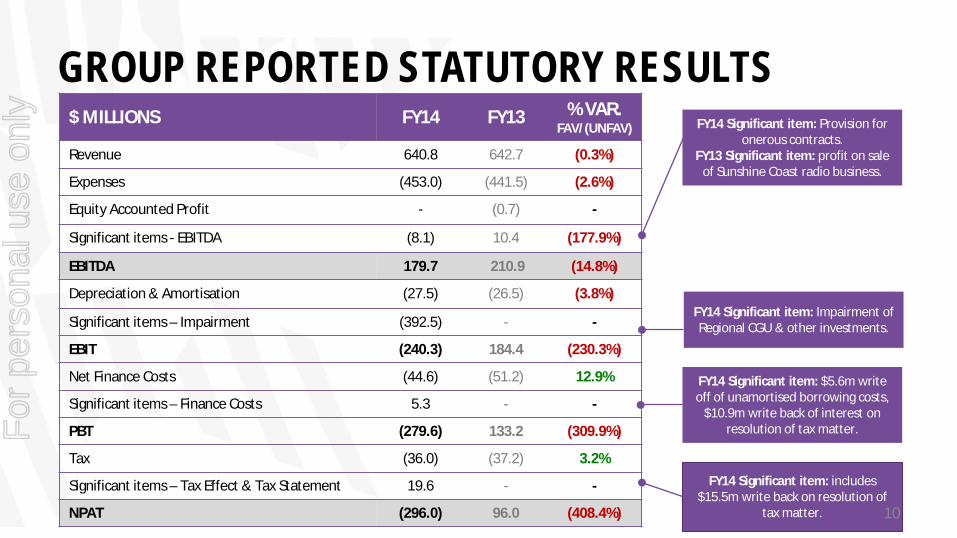
GROUP REPORTED STATUTORY RESULTS $ MILLIONS FY14 FY13 % VAR.
FAV/(UNFAV)
Revenue 640.8 642.7 (0.3%)
Expenses (453.0) (441.5) (2.6%)
Equity Accounted Profit - (0.7) -
Significant items - EBITDA (8.1) 10.4 (177.9%)
EBITDA 179.7 210.9 (14.8%)
Depreciation & Amortisation (27.5) (26.5) (3.8%)
Significant items – Impairment (392.5) - -
EBIT (240.3) 184.4 (230.3%)
Net Finance Costs (44.6) (51.2) 12.9%
Significant items – Finance Costs 5.3 - -
PBT (279.6) 133.2 (309.9%)
Tax (36.0) (37.2) 3.2%
Significant items – Tax Effect & Tax Statement 19.6 - -
NPAT (296.0) 96.0 (408.4%)
FY14 Significant item: $5.6m write off of unamortised borrowing costs,
$10.9m write back of interest on resolution of tax matter.
FY14 Significant item: includes $15.5m write back on resolution of
tax matter.
FY14 Significant item: Provision for onerous contracts.
FY13 Significant item: profit on sale of Sunshine Coast radio business.
FY14 Significant item: Impairment of Regional CGU & other investments.
10
For
per
sona
l use
onl
y
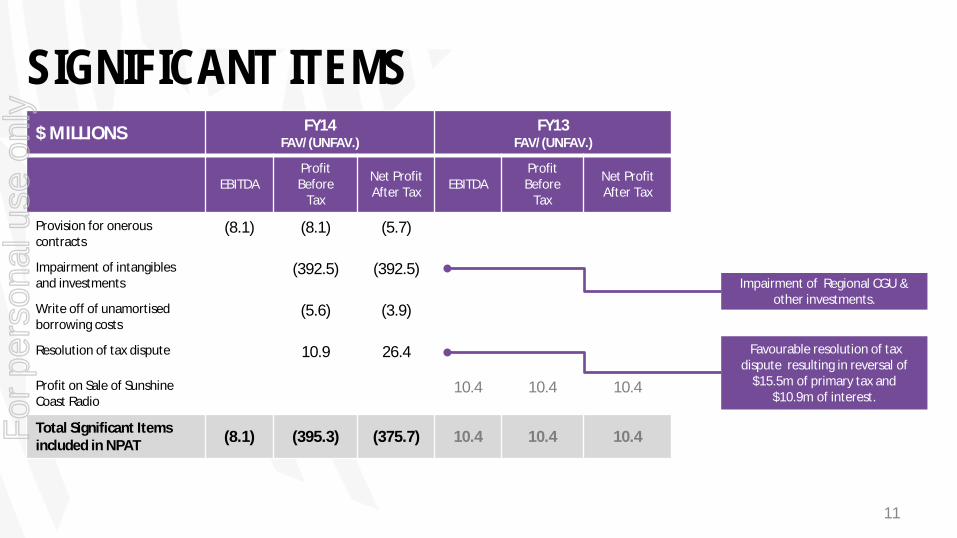
SIGNIFICANT ITEMS $ MILLIONS FY14
FAV/(UNFAV.) FY13
FAV/(UNFAV.)
EBITDA Profit
Before Tax
Net Profit After Tax EBITDA
Profit Before
Tax
Net Profit After Tax
Provision for onerous contracts
(8.1) (8.1) (5.7)
Impairment of intangibles and investments
(392.5) (392.5)
Write off of unamortised borrowing costs
(5.6) (3.9)
Resolution of tax dispute 10.9 26.4
Profit on Sale of Sunshine Coast Radio
10.4 10.4 10.4
Total Significant Items included in NPAT (8.1) (395.3) (375.7) 10.4 10.4 10.4
Favourable resolution of tax dispute resulting in reversal of
$15.5m of primary tax and $10.9m of interest.
Impairment of Regional CGU & other investments.
11
For
per
sona
l use
onl
y
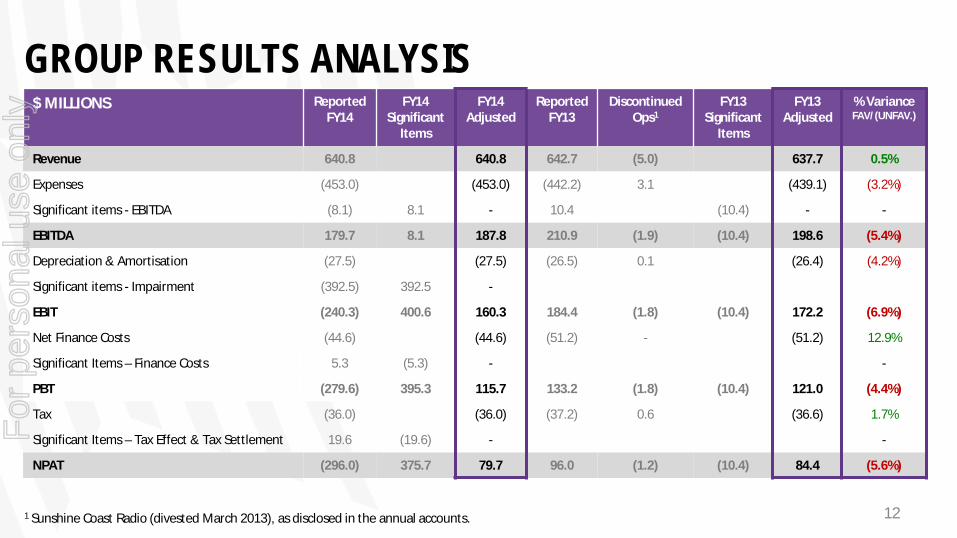
GROUP RESULTS ANALYSIS $ MILLIONS Reported
FY14 FY14
Significant Items
FY14 Adjusted
Reported FY13
Discontinued Ops1
FY13 Significant
Items
FY13 Adjusted
% Variance FAV/(UNFAV.)
Revenue 640.8 640.8 642.7 (5.0) 637.7 0.5%
Expenses (453.0) (453.0) (442.2) 3.1 (439.1) (3.2%)
Significant items - EBITDA (8.1) 8.1 - 10.4 (10.4) - -
EBITDA 179.7 8.1 187.8 210.9 (1.9) (10.4) 198.6 (5.4%)
Depreciation & Amortisation (27.5) (27.5) (26.5) 0.1 (26.4) (4.2%)
Significant items - Impairment (392.5) 392.5 -
EBIT (240.3) 400.6 160.3 184.4 (1.8) (10.4) 172.2 (6.9%)
Net Finance Costs (44.6) (44.6) (51.2) - (51.2) 12.9%
Significant Items – Finance Costs 5.3 (5.3) - -
PBT (279.6) 395.3 115.7 133.2 (1.8) (10.4) 121.0 (4.4%)
Tax (36.0) (36.0) (37.2) 0.6 (36.6) 1.7%
Significant Items – Tax Effect & Tax Settlement 19.6 (19.6) - -
NPAT (296.0) 375.7 79.7 96.0 (1.2) (10.4) 84.4 (5.6%)
1 Sunshine Coast Radio (divested March 2013), as disclosed in the annual accounts.
12
For
per
sona
l use
onl
y
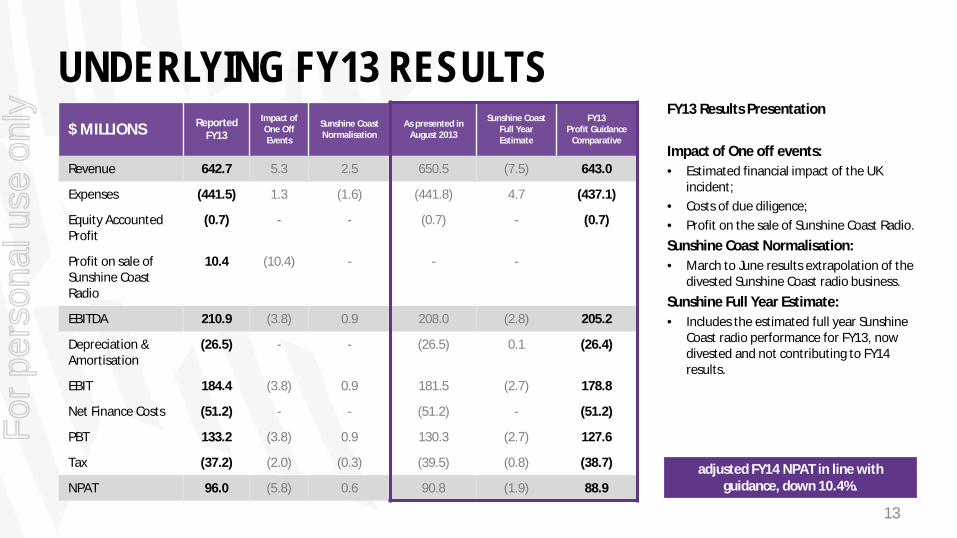
UNDERLYING FY13 RESULTS $ MILLIONS Reported
FY13
Impact of One Off Events
Sunshine Coast Normalisation
As presented in August 2013
Sunshine Coast Full Year Estimate
FY13 Profit Guidance
Comparative
Revenue 642.7 5.3 2.5 650.5 (7.5) 643.0
Expenses (441.5) 1.3 (1.6) (441.8) 4.7 (437.1)
Equity Accounted Profit
(0.7) - - (0.7) - (0.7)
Profit on sale of Sunshine Coast Radio
10.4 (10.4) - - -
EBITDA 210.9 (3.8) 0.9 208.0 (2.8) 205.2
Depreciation & Amortisation
(26.5) - - (26.5) 0.1 (26.4)
EBIT 184.4 (3.8) 0.9 181.5 (2.7) 178.8
Net Finance Costs (51.2) - - (51.2) - (51.2)
PBT 133.2 (3.8) 0.9 130.3 (2.7) 127.6
Tax (37.2) (2.0) (0.3) (39.5) (0.8) (38.7)
NPAT 96.0 (5.8) 0.6 90.8 (1.9) 88.9
FY13 Results Presentation Impact of One off events: • Estimated financial impact of the UK
incident; • Costs of due diligence; • Profit on the sale of Sunshine Coast Radio. Sunshine Coast Normalisation: • March to June results extrapolation of the
divested Sunshine Coast radio business. Sunshine Full Year Estimate: • Includes the estimated full year Sunshine
Coast radio performance for FY13, now divested and not contributing to FY14 results.
adjusted FY14 NPAT in line with guidance, down 10.4%.
13
For
per
sona
l use
onl
y
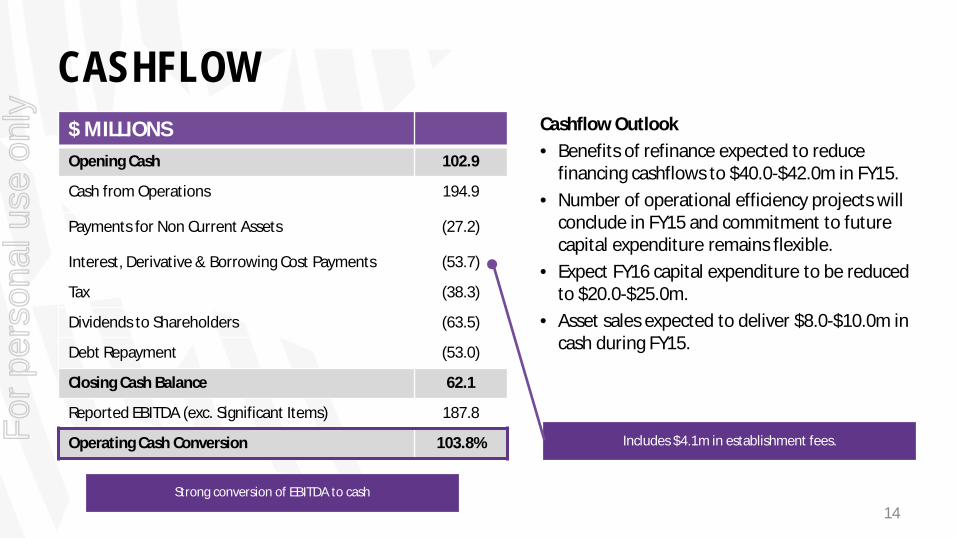
CASHFLOW $ MILLIONS Opening Cash 102.9
Cash from Operations 194.9
Payments for Non Current Assets (27.2)
Interest, Derivative & Borrowing Cost Payments (53.7)
Tax (38.3)
Dividends to Shareholders (63.5)
Debt Repayment (53.0)
Closing Cash Balance 62.1
Reported EBITDA (exc. Significant Items) 187.8
Operating Cash Conversion 103.8%
Cashflow Outlook • Benefits of refinance expected to reduce
financing cashflows to $40.0-$42.0m in FY15. • Number of operational efficiency projects will
conclude in FY15 and commitment to future capital expenditure remains flexible.
• Expect FY16 capital expenditure to be reduced to $20.0-$25.0m.
• Asset sales expected to deliver $8.0-$10.0m in cash during FY15.
Includes $4.1m in establishment fees.
Strong conversion of EBITDA to cash
14
For
per
sona
l use
onl
y
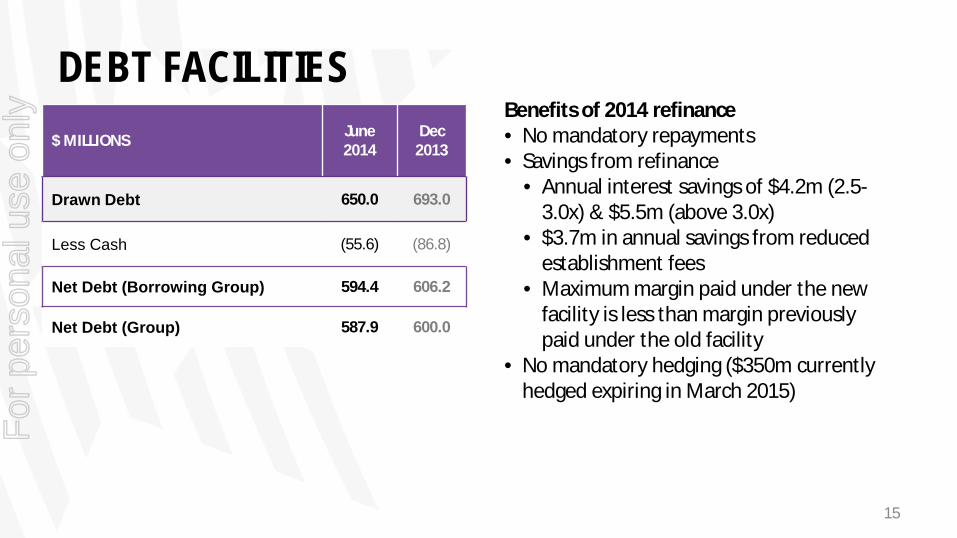
DEBT FACILITIES $ MILLIONS June
2014 Dec
2013
Drawn Debt 650.0 693.0
Less Cash (55.6) (86.8)
Net Debt (Borrowing Group) 594.4 606.2
Net Debt (Group) 587.9 600.0
Benefits of 2014 refinance • No mandatory repayments • Savings from refinance
• Annual interest savings of $4.2m (2.5-3.0x) & $5.5m (above 3.0x)
• $3.7m in annual savings from reduced establishment fees
• Maximum margin paid under the new facility is less than margin previously paid under the old facility
• No mandatory hedging ($350m currently hedged expiring in March 2015)
15
For
per
sona
l use
onl
y
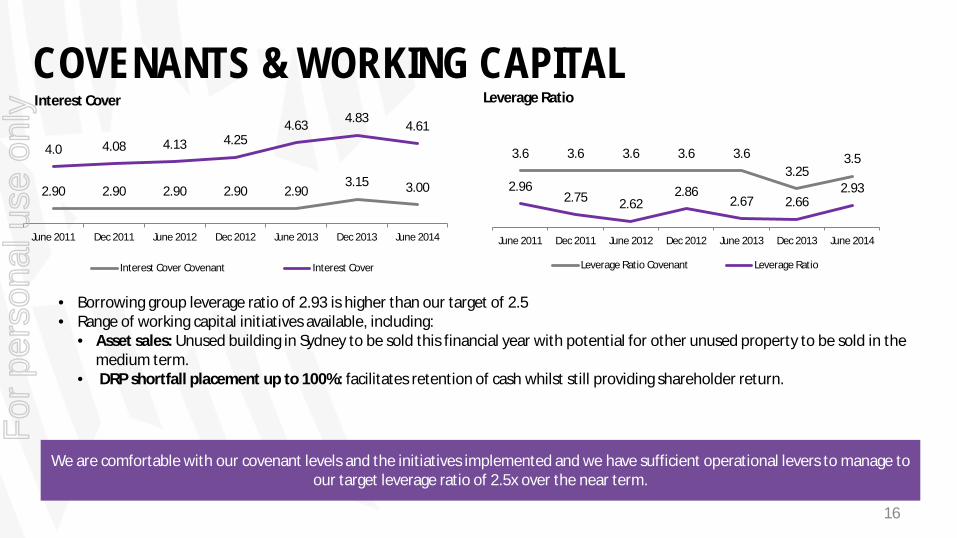
COVENANTS & WORKING CAPITAL
• Borrowing group leverage ratio of 2.93 is higher than our target of 2.5 • Range of working capital initiatives available, including:
• Asset sales: Unused building in Sydney to be sold this financial year with potential for other unused property to be sold in the medium term.
• DRP shortfall placement up to 100%: facilitates retention of cash whilst still providing shareholder return.
We are comfortable with our covenant levels and the initiatives implemented and we have sufficient operational levers to manage to our target leverage ratio of 2.5x over the near term.
2.90 2.90 2.90 2.90 2.90 3.15 3.00
4.0 4.08 4.13 4.25 4.63 4.83 4.61
June 2011 Dec 2011 June 2012 Dec 2012 June 2013 Dec 2013 June 2014
Interest Cover
Interest Cover Covenant Interest Cover
3.6 3.6 3.6 3.6 3.6 3.25
3.5
2.96 2.75 2.62
2.86 2.67 2.66
2.93
2.5
3
3.5
4
4.5
5
June 2011 Dec 2011 June 2012 Dec 2012 June 2013 Dec 2013 June 2014
Leverage Ratio
Leverage Ratio Covenant Leverage Ratio
16
For
per
sona
l use
onl
y
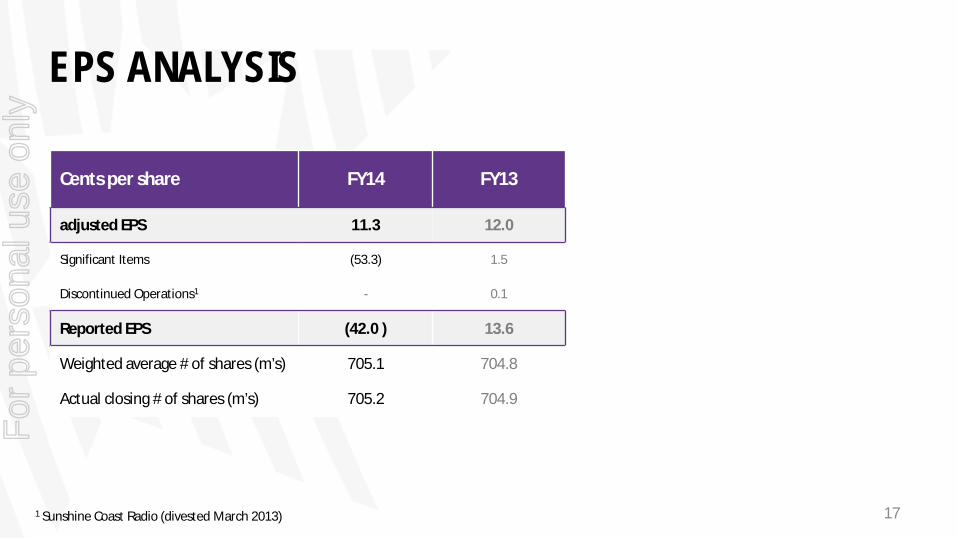
EPS ANALYSIS
Cents per share FY14 FY13
adjusted EPS 11.3 12.0
Significant Items (53.3) 1.5
Discontinued Operations1 - 0.1
Reported EPS (42.0 ) 13.6
Weighted average # of shares (m’s) 705.1 704.8
Actual closing # of shares (m’s) 705.2 704.9
1 Sunshine Coast Radio (divested March 2013)
17
For
per
sona
l use
onl
y

OPERATIONAL REVIEW
FIFI & DAVE, FOX FM 18
For
per
sona
l use
onl
y
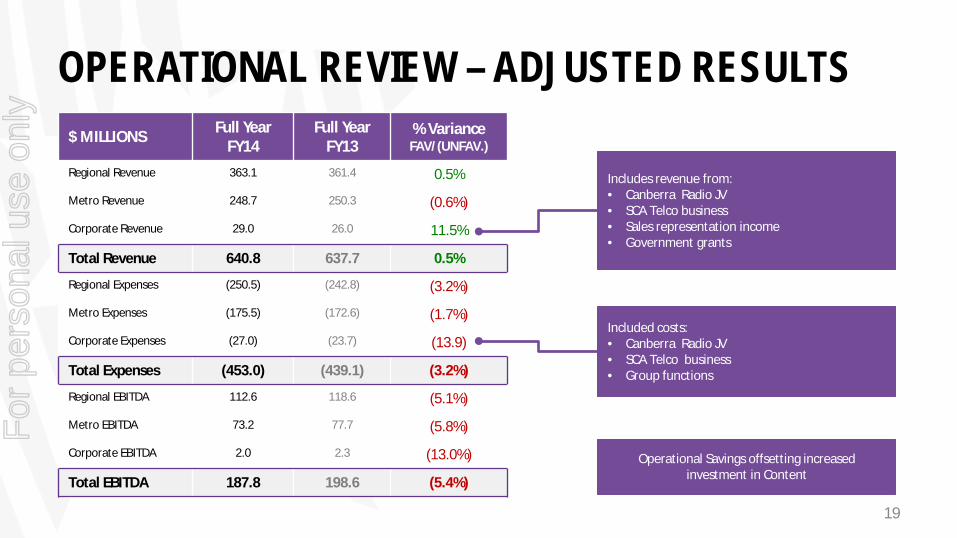
OPERATIONAL REVIEW – ADJUSTED RESULTS
Includes revenue from: • Canberra Radio JV • SCA Telco business • Sales representation income • Government grants
Included costs: • Canberra Radio JV • SCA Telco business • Group functions
$ MILLIONS Full Year FY14
Full Year FY13
% Variance FAV/(UNFAV.)
Regional Revenue 363.1 361.4 0.5%
Metro Revenue 248.7 250.3 (0.6%)
Corporate Revenue 29.0 26.0 11.5%
Total Revenue 640.8 637.7 0.5%
Regional Expenses (250.5) (242.8) (3.2%)
Metro Expenses (175.5) (172.6) (1.7%)
Corporate Expenses (27.0) (23.7) (13.9)
Total Expenses (453.0) (439.1) (3.2%)
Regional EBITDA 112.6 118.6 (5.1%)
Metro EBITDA 73.2 77.7 (5.8%)
Corporate EBITDA 2.0 2.3 (13.0%)
Total EBITDA 187.8 198.6 (5.4%)
Operational Savings offsetting increased investment in Content
19
For
per
sona
l use
onl
y

METRO – ADJUSTED RESULTS • Triple M network strengthening and growing market
share, largely offsetting the revenue impact of the ratings challenges on the Today network
• Digital revenue up 17.3% as our digital ratings continue to dominate
• Focus on efficiency has contained costs, despite increased investment in content
$ MILLIONS Full Year FY14
Full Year FY13
% Variance FAV/(UNFAV.)
Total Revenue 248.7 250.3 (0.6%)
Broadcast & Production (21.8) (22.2) 1.8%
Employee (72.0) (71.9) (0.1%)
Selling, General & Admin
(81.7) (78.5) (4.1%)
Total Expenses (175.5) (172.6) (1.7%)
EBITDA 73.2 77.7 (5.8%)
EBITDA Margin 29.4% 31.0%
Presented as $89.3m last year • $5.0m - Canberra JV moved to Corporate • $6.0m – estimated impact of one off events included
in FY13 underlying (not included in adjusted results) • $0.6m – net cost reallocated to corporate
234.9
229.6
6.0
7.2
4.2
5.8
5.2
6.1 Revenue Breakdown
Advertising Revenues Contra Other Digital
FY14
FY13 250.3
248.7
20
For
per
sona
l use
onl
y
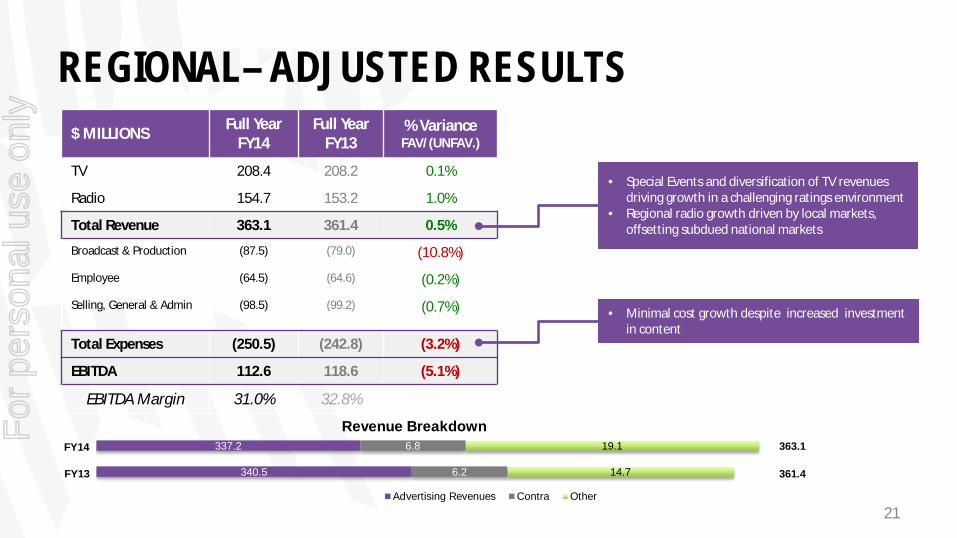
$ MILLIONS Full Year FY14
Full Year FY13
% Variance FAV/(UNFAV.)
TV 208.4 208.2 0.1%
Radio 154.7 153.2 1.0%
Total Revenue 363.1 361.4 0.5%
Broadcast & Production (87.5) (79.0) (10.8%)
Employee (64.5) (64.6) (0.2%)
Selling, General & Admin (98.5) (99.2) (0.7%)
Total Expenses (250.5) (242.8) (3.2%)
EBITDA 112.6 118.6 (5.1%)
EBITDA Margin 31.0% 32.8%
REGIONAL– ADJUSTED RESULTS
• Special Events and diversification of TV revenues driving growth in a challenging ratings environment
• Regional radio growth driven by local markets, offsetting subdued national markets
• Minimal cost growth despite increased investment in content
FY14
340.5
337.2
6.2
6.8
14.7
19.1
Advertising Revenues Contra Other
FY13 361.4
363.1
Revenue Breakdown
21
For
per
sona
l use
onl
y

$ MILLIONS Full Year FY14
Full Year FY13
% Variance FAV/(UNFAV.)
Total Revenue 29.0 26.0 11.5%
Broadcast & Production (2.9) (2.9) -
Employee (32.7) (34.0) 3.8%
Selling, General & Admin 8.6 13.9 (38.1%)
Equity Accounted Profit (0.7)
Total Expenses (27.0) (23.7) (13.9%)
EBITDA 2.0 2.3 (13.0%)
EBITDA Margin 6.9% 8.9%
CORPORATE – ADJUSTED RESULTS
9.2
9.2
16.8
19.8
Revenue Breakdown
Advertising Revenues Other
29.0
26.0
Advertising revenues relate to Canberra JV (50% owned with ARN).
Selling, General and Admin is net of cost recovery charge to Metro and Regional, increase relates to cost recovery
FY14
FY13
22
For
per
sona
l use
onl
y
KEY REVENUE ANALYSIS
CLAIRSY, SHANE & KYMBA 23
For
per
sona
l use
onl
y

METRO RADIO ADVERTISING REVENUES
185.2 177.3 164.8 162.2
76.3 71.8 70.1 67.4
FY11 FY12 FY13 FY14
National/Local Split
Local National
229.6 261.5
249.1 234.9 • Regeneration of the Today network is well underway
with 60% of the revenue decline being offset by the growth of the Triple M network.
34.6% 34.2% 33.3% 35.3% 34.6% 34.3% 33.4% 29.8%
167 179 156
182 176 180 158 183
Q1 FY13 Q2 FY13 Q3 FY13 Q4 FY13 Q1 FY14 Q2 FY14 Q3 FY14 Q4 FY14
Commercial Share
Market Share Market Size (m's) 24
For
per
sona
l use
onl
y

REGIONAL RADIO ADVERTISING REVENUES
37.8 43.1 42.4 42.3
103.0 102.8 104.3 105.3
FY11 FY12 FY13 FY14
National/Local Split
Local National
147.6
• 29 Regional radio stations across 6 states, 20 co- located with Television
• Strong competitive position in many markets
• Represents 26% of all SCA advertising revenues
• Continues to deliver a reliable revenue stream with FY14 advertising revenues up 0.6%
o 70% of revenues are Local, a traditionally less volatile revenue stream
o 93% of our stations account for 78% of local revenues with a broad base of local clients
14% National growth in FY12 resulting from revenue synergies from the Austereo merger.
145.9 140.8 146.7 147.6
25
For
per
sona
l use
onl
y
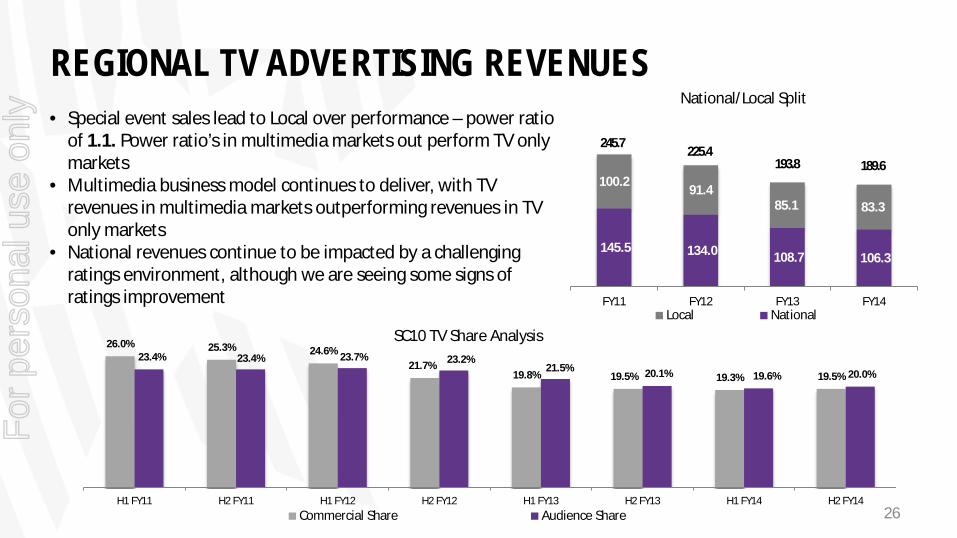
REGIONAL TV ADVERTISING REVENUES
145.5 134.0 108.7 106.3
100.2 91.4
85.1 83.3
FY11 FY12 FY13 FY14
National/Local Split
Local National
189.6
245.7 225.4
193.8
26.0% 25.3% 24.6% 21.7%
19.8% 19.5% 19.3% 19.5%
23.4% 23.4% 23.7% 23.2% 21.5% 20.1% 19.6% 20.0%
H1 FY11 H2 FY11 H1 FY12 H2 FY12 H1 FY13 H2 FY13 H1 FY14 H2 FY14
SC10 TV Share Analysis
Commercial Share Audience Share
• Special event sales lead to Local over performance – power ratio of 1.1. Power ratio’s in multimedia markets out perform TV only markets
• Multimedia business model continues to deliver, with TV revenues in multimedia markets outperforming revenues in TV only markets
• National revenues continue to be impacted by a challenging ratings environment, although we are seeing some signs of ratings improvement
26
For
per
sona
l use
onl
y
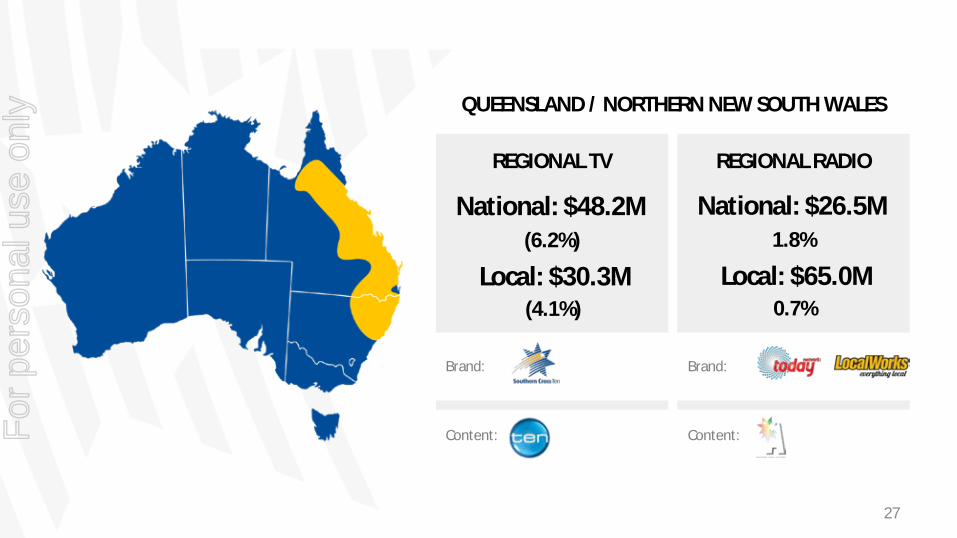
QUEENSLAND / NORTHERN NEW SOUTH WALES
REGIONAL TV
National: $48.2M (6.2%)
REGIONAL RADIO
Brand:
Content:
Brand:
Content:
Local: $30.3M (4.1%)
National: $26.5M 1.8%
Local: $65.0M 0.7%
27
For
per
sona
l use
onl
y
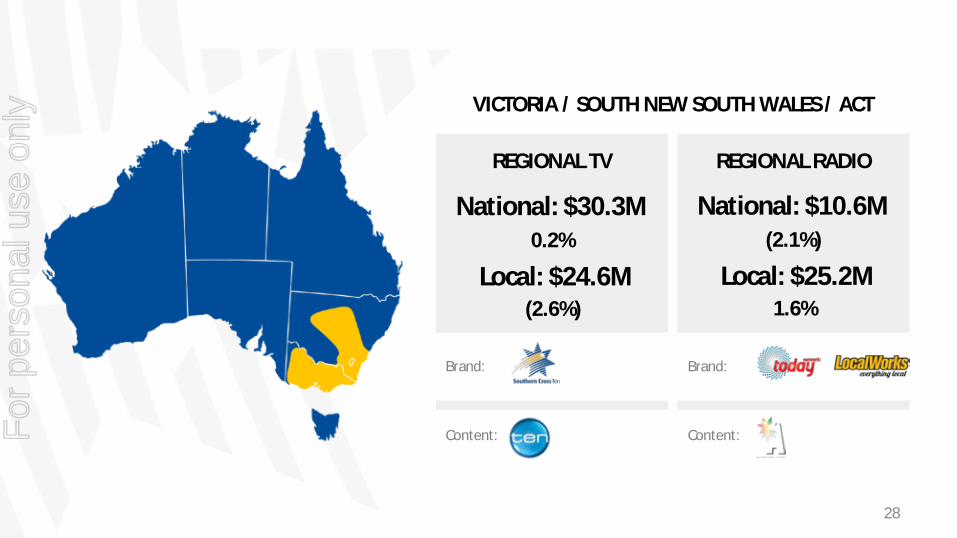
VICTORIA / SOUTH NEW SOUTH WALES / ACT
REGIONAL TV REGIONAL RADIO
Brand: Brand:
Content: Content:
National: $30.3M 0.2%
Local: $24.6M (2.6%)
National: $10.6M (2.1%)
Local: $25.2M 1.6%
28
For
per
sona
l use
onl
y
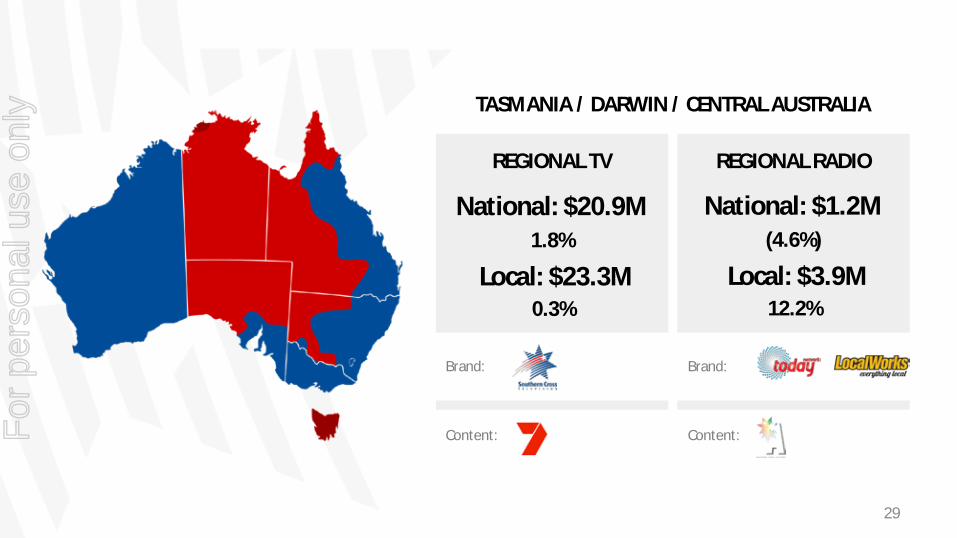
TASMANIA / DARWIN / CENTRAL AUSTRALIA
REGIONAL TV REGIONAL RADIO
Brand: Brand:
Content: Content:
National: $20.9M 1.8%
Local: $23.3M 0.3%
National: $1.2M (4.6%)
Local: $3.9M 12.2%
29
For
per
sona
l use
onl
y
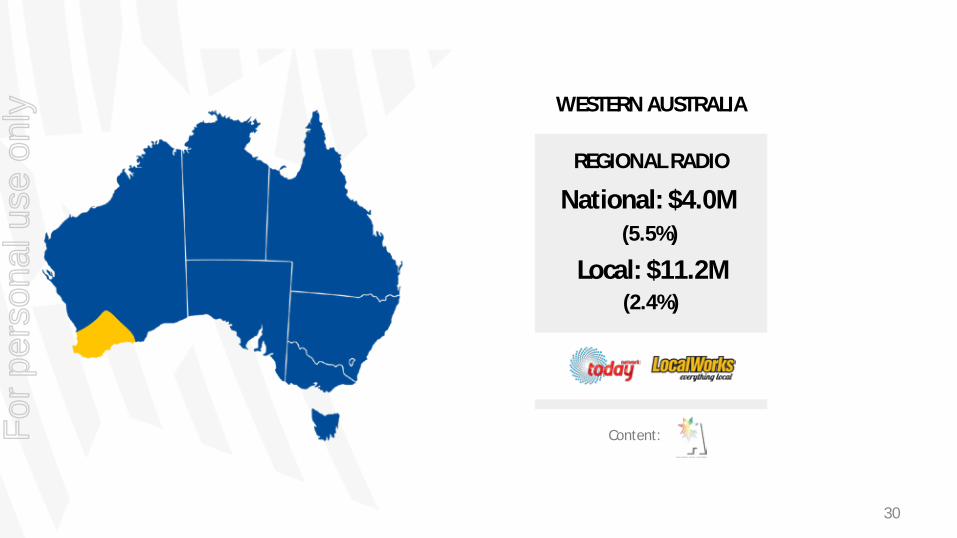
WESTERN AUSTRALIA
REGIONAL RADIO
Content:
National: $4.0M (5.5%)
Local: $11.2M (2.4%)
30
For
per
sona
l use
onl
y
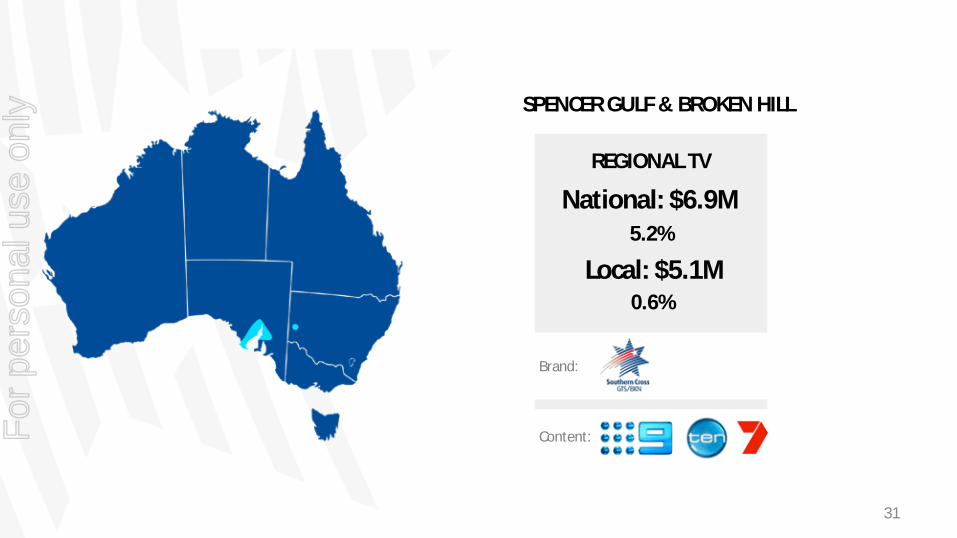
SPENCER GULF & BROKEN HILL
REGIONAL TV
Brand:
Content:
National: $6.9M 5.2%
Local: $5.1M 0.6%
31
For
per
sona
l use
onl
y

OUTLOOK & SUMMARY
CLIFF & DOUGIE, RADIOWEST 32
For
per
sona
l use
onl
y
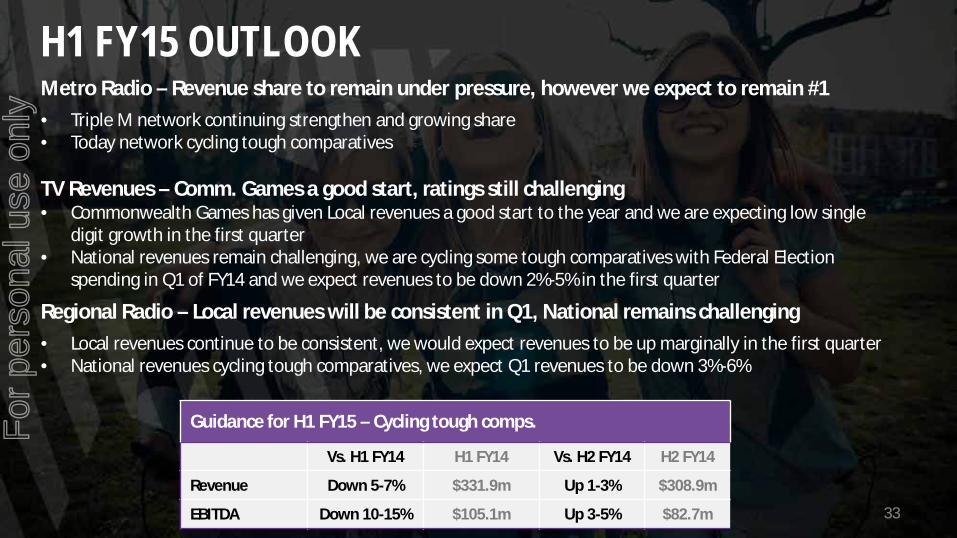
H1 FY15 OUTLOOK Metro Radio – Revenue share to remain under pressure, however we expect to remain #1 • Triple M network continuing strengthen and growing share • Today network cycling tough comparatives TV Revenues – Comm. Games a good start, ratings still challenging • Commonwealth Games has given Local revenues a good start to the year and we are expecting low single
digit growth in the first quarter • National revenues remain challenging, we are cycling some tough comparatives with Federal Election
spending in Q1 of FY14 and we expect revenues to be down 2%-5% in the first quarter
Regional Radio – Local revenues will be consistent in Q1, National remains challenging • Local revenues continue to be consistent, we would expect revenues to be up marginally in the first quarter • National revenues cycling tough comparatives, we expect Q1 revenues to be down 3%-6%
Guidance for H1 FY15 – Cycling tough comps.
Vs. H1 FY14 H1 FY14 Vs. H2 FY14 H2 FY14
Revenue Down 5-7% $331.9m Up 1-3% $308.9m
EBITDA Down 10-15% $105.1m Up 3-5% $82.7m 33
For
per
sona
l use
onl
y

SUMMARY • We have the best content creation team in the radio industry and we are confident that we are
on the right track with the regeneration of the Today network
• We have a broad range of capital management options available and have implemented a strategy to ensure that we continue to operate well within the confines of our debt facility
• Based on the outlook provided, we will not be breaching covenants
• Our growth in digital media will continue and we expect this to make a greater contribution to our future financial results
• We remain committed to our strategy of; • Regeneration of the Today network and continued market dominance • Further improving operational efficiency • Building a valuable digital business
All of which will leave us in a strong position to take advantage of any legislative change
34
For
per
sona
l use
onl
y
CONTENT UPDATE
SOUTHERN CROSS AUSTEREO
35
For
per
sona
l use
onl
y

SCA CONTENT : STRATEGIC OBJECTIVE
• Strengthen Market Leadership in Radio • Capitalize further on National Dominance • Best People – Talent On-Air and Off-Air • Leverage Digital Engagement and Scale
36
For
per
sona
l use
onl
y
AUSTRALIA’S NUMBER ONE RADIO BRAND FOR MEN
Source: GFK Survey 4. Metro & Regional (inc. Mix 94.5)
37
For
per
sona
l use
onl
y

ROCK SPORT COMEDY 38
For
per
sona
l use
onl
y
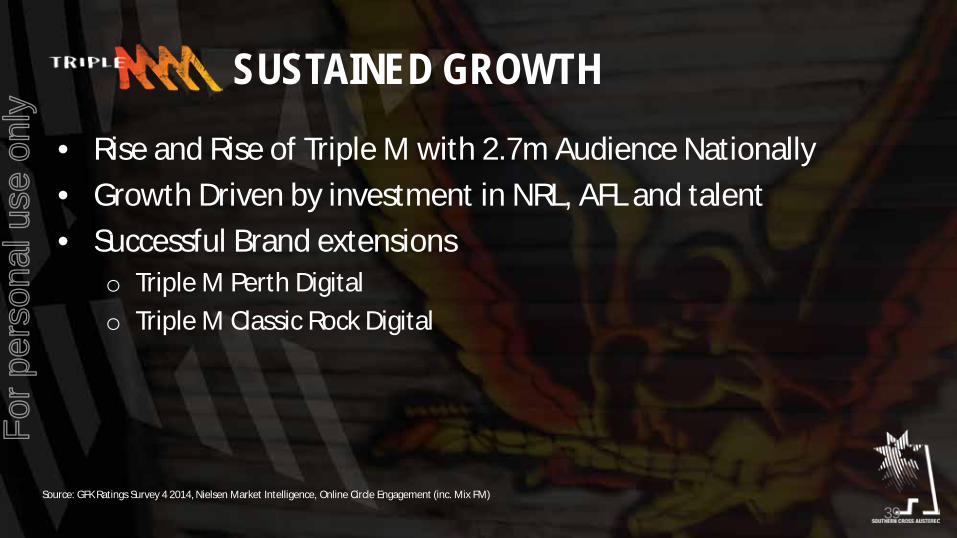
SUSTAINED GROWTH
• Rise and Rise of Triple M with 2.7m Audience Nationally • Growth Driven by investment in NRL, AFL and talent • Successful Brand extensions
o Triple M Perth Digital o Triple M Classic Rock Digital
Source: GFK Ratings Survey 4 2014, Nielsen Market Intelligence, Online Circle Engagement (inc. Mix FM)
39
For
per
sona
l use
onl
y
Australia’s Number One Radio Brand
Source: GFK Survey 4, 2014. Gold Coast Survey 2. Newcastle Survey 2. Canberra Survey 1.
40
For
per
sona
l use
onl
y

POP CELEBS SHOWBIZ 41
For
per
sona
l use
onl
y
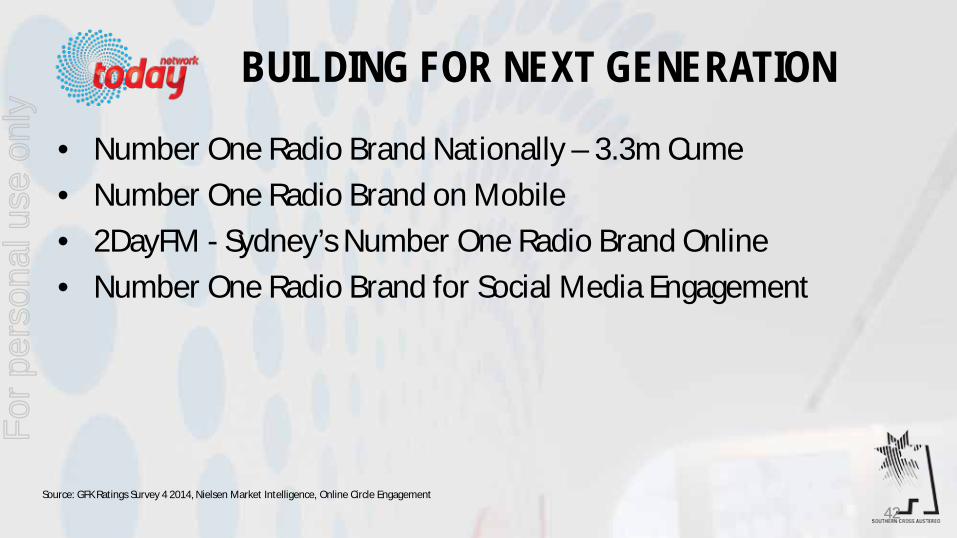
BUILDING FOR NEXT GENERATION
• Number One Radio Brand Nationally – 3.3m Cume • Number One Radio Brand on Mobile • 2DayFM - Sydney’s Number One Radio Brand Online • Number One Radio Brand for Social Media Engagement
Source: GFK Ratings Survey 4 2014, Nielsen Market Intelligence, Online Circle Engagement
42
For
per
sona
l use
onl
y
SCA MELBOURNE
43
For
per
sona
l use
onl
y
SCA MELBOURNE • Fox FM Leading in Under 40 Females for first time in 6 Years • Fox FM 1m Cume - Largest FM Radio Station Australia • Fifi & Dave – 537,000 - Largest FM Audience Cume in Australia • Triple M Melbourne Number One FM Radio Station • Melbourne’s Number One Breakfast Show – Hot Breakfast
Source: GFK Radio Survey 4, 2014.
44
For
per
sona
l use
onl
y
SCA SYDNEY
45
For
per
sona
l use
onl
y
SCA SYDNEY
• Triple M Sydney 585,000 – Highest audience for seven years • Sydney Grill Team growth – third FM Breakfast Show and now
ahead of Nova 96.9 • 2DayFM Rebuilding - Now fourth highest cume in Sydney FM
Radio Market, due to growth of positive perception of new talent
Source: GFK Radio Survey 4, 2014. 46
For
per
sona
l use
onl
y
SCA PERTH
47
For
per
sona
l use
onl
y
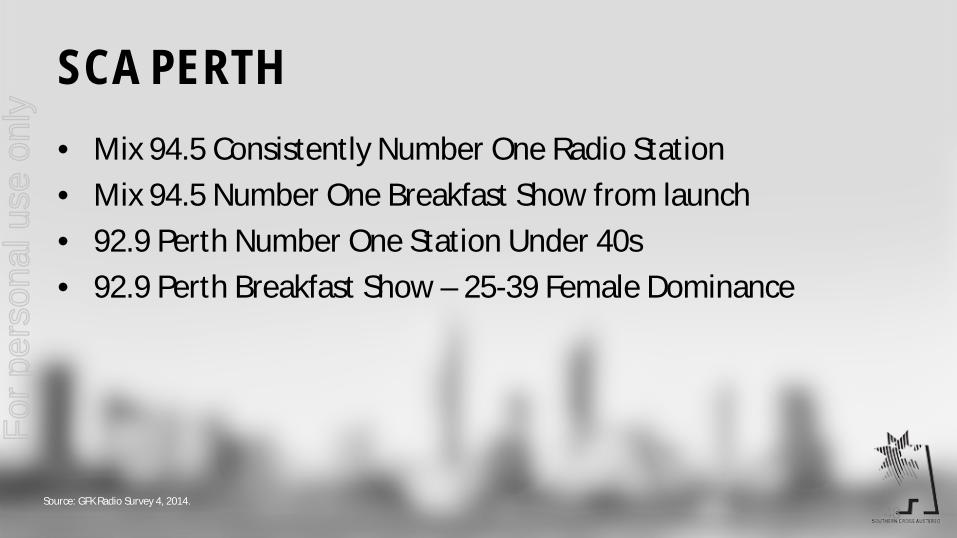
SCA PERTH • Mix 94.5 Consistently Number One Radio Station • Mix 94.5 Number One Breakfast Show from launch • 92.9 Perth Number One Station Under 40s • 92.9 Perth Breakfast Show – 25-39 Female Dominance
Source: GFK Radio Survey 4, 2014. 48
For
per
sona
l use
onl
y

SCA ADELAIDE SCA BRISBANE
49
For
per
sona
l use
onl
y
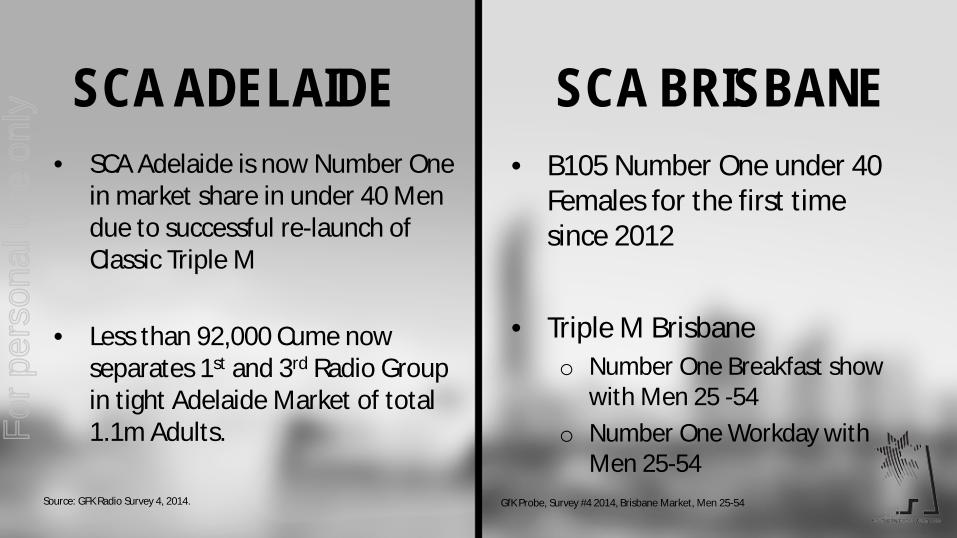
• SCA Adelaide is now Number One in market share in under 40 Men due to successful re-launch of Classic Triple M
• Less than 92,000 Cume now
separates 1st and 3rd Radio Group in tight Adelaide Market of total 1.1m Adults.
• B105 Number One under 40 Females for the first time since 2012
• Triple M Brisbane
o Number One Breakfast show with Men 25 -54
o Number One Workday with Men 25-54
SCA ADELAIDE SCA BRISBANE
Source: GFK Radio Survey 4, 2014. 50
GfK Probe, Survey #4 2014, Brisbane Market, Men 25-54
For
per
sona
l use
onl
y

SCA GOLD COAST SCA NEWCASTLE
51
For
per
sona
l use
onl
y
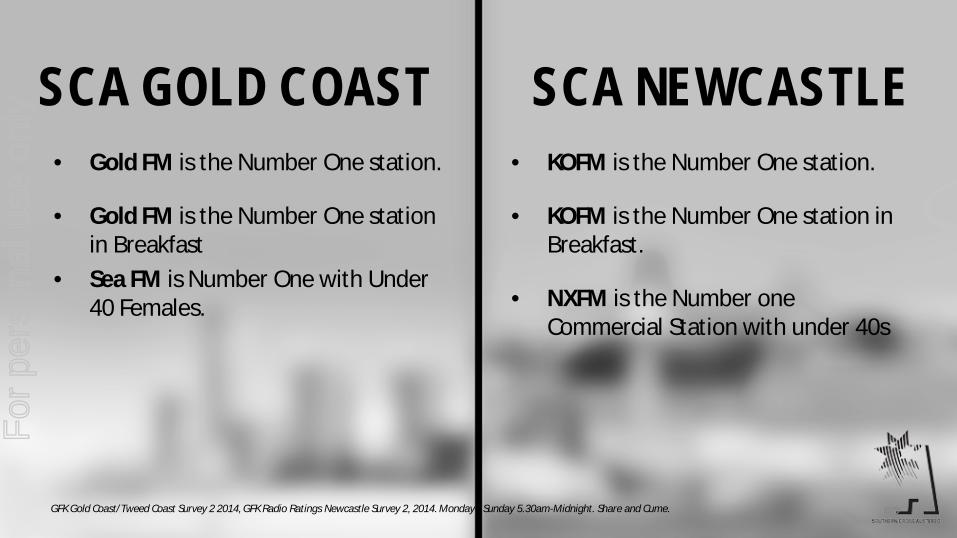
• Gold FM is the Number One station.
• Gold FM is the Number One station in Breakfast
• Sea FM is Number One with Under 40 Females.
• KOFM is the Number One station.
• KOFM is the Number One station in Breakfast.
• NXFM is the Number one Commercial Station with under 40s
SCA GOLD COAST SCA NEWCASTLE
GFK Gold Coast/Tweed Coast Survey 2 2014, GFK Radio Ratings Newcastle Survey 2, 2014. Monday- Sunday 5.30am-Midnight. Share and Cume. 52
For
per
sona
l use
onl
y

1.5m CUME NATIONALLY
Source: GFK Radio Survey 4, 2014. 53
For
per
sona
l use
onl
y

Source: GFK Radio Survey 4, 2014. 54
For
per
sona
l use
onl
y
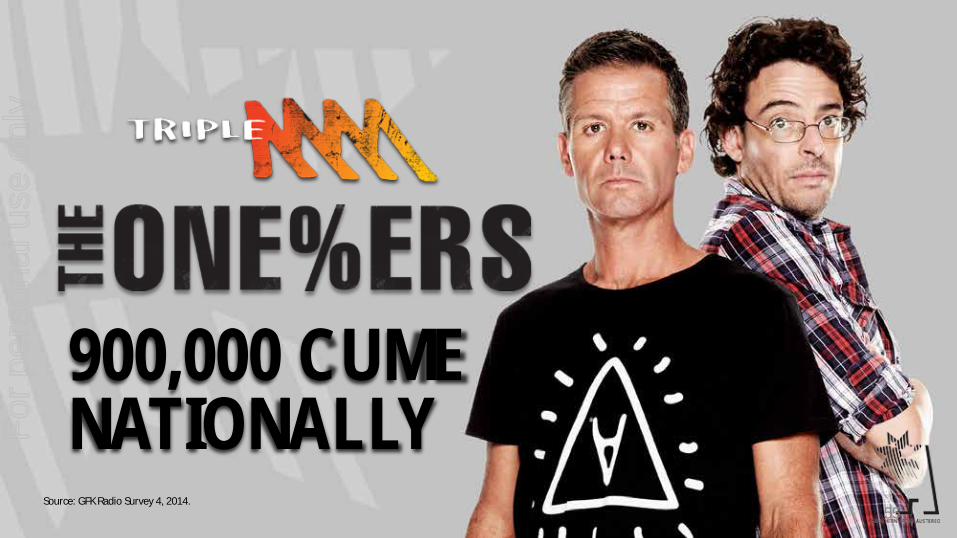
900,000 CUME NATIONALLY
Source: GFK Radio Survey 4, 2014. 55
For
per
sona
l use
onl
y
Source: GFK Radio Survey 4, 2014. 56
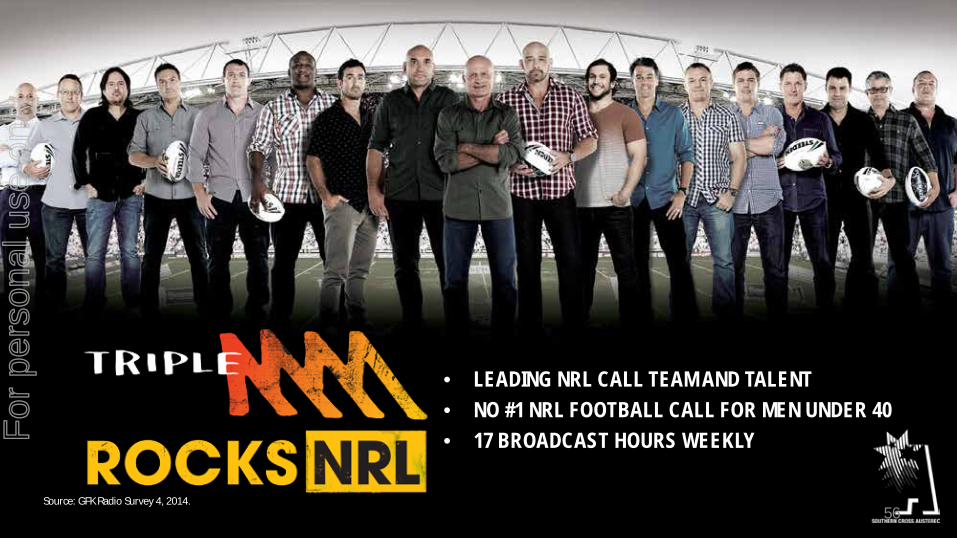
• LEADING NRL CALL TEAM AND TALENT • NO #1 NRL FOOTBALL CALL FOR MEN UNDER 40 • 17 BROADCAST HOURS WEEKLY F
or p
erso
nal u
se o
nly
Source: GFK Radio Survey 4, 2014. 57
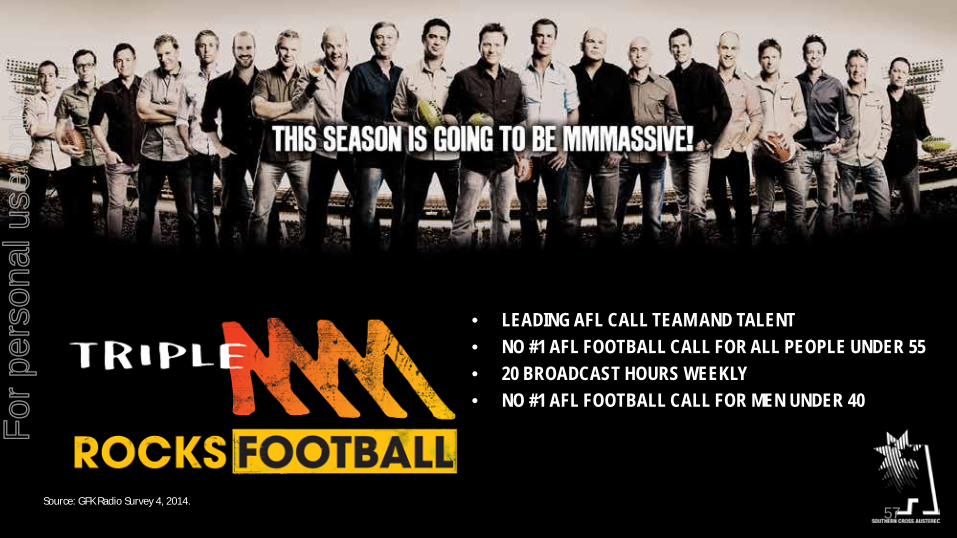
• LEADING AFL CALL TEAM AND TALENT • NO #1 AFL FOOTBALL CALL FOR ALL PEOPLE UNDER 55 • 20 BROADCAST HOURS WEEKLY • NO #1 AFL FOOTBALL CALL FOR MEN UNDER 40
For
per
sona
l use
onl
y

NEW TALENT
58
For
per
sona
l use
onl
y

BIG NAME TALENT
59
For
per
sona
l use
onl
y

SCA DIGITAL STRATEGY Engage with Intimate Scale
• Market Share greater than entire Commercial Radio combined1
• Driven by Engaging Unique Content, Social Media Scale with Mobile first strategy
• Create shareable content for every device • Capture SCA user profile data to personalize content, advertising
and leverage mCommerce via MyLocal Portal
60 Source 1 Nielsen Online Ratings – Market Intelligence, Domestic - Average Daily Unique Browsers (all devices) - June 2014
For
per
sona
l use
onl
y
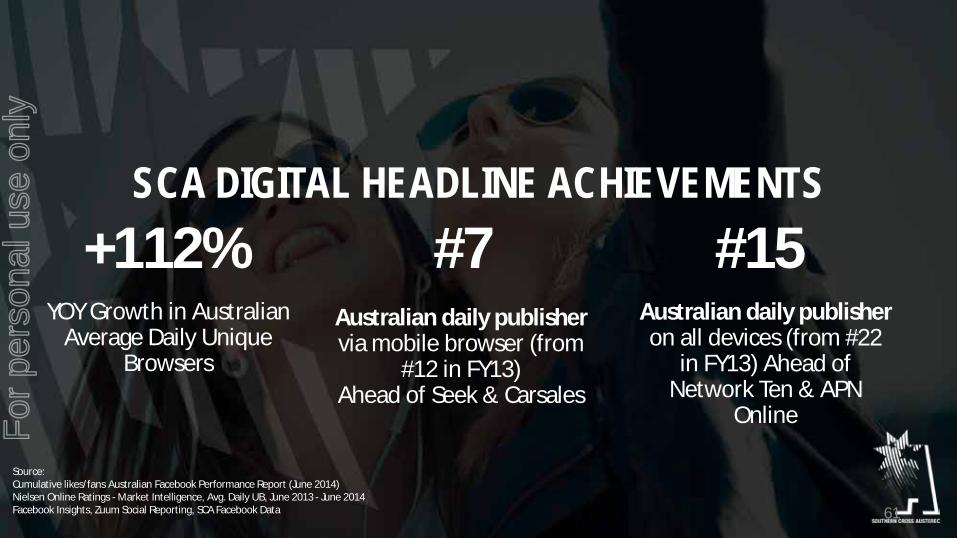
Source: Cumulative likes/fans Australian Facebook Performance Report (June 2014) Nielsen Online Ratings - Market Intelligence, Avg. Daily UB, June 2013 - June 2014 Facebook Insights, Zuum Social Reporting, SCA Facebook Data
SCA DIGITAL HEADLINE ACHIEVEMENTS +112%
YOY Growth in Australian Average Daily Unique
Browsers
#7 Australian daily publisher via mobile browser (from
#12 in FY13) Ahead of Seek & Carsales
#15
Australian daily publisher on all devices (from #22
in FY13) Ahead of Network Ten & APN
Online
61
For
per
sona
l use
onl
y
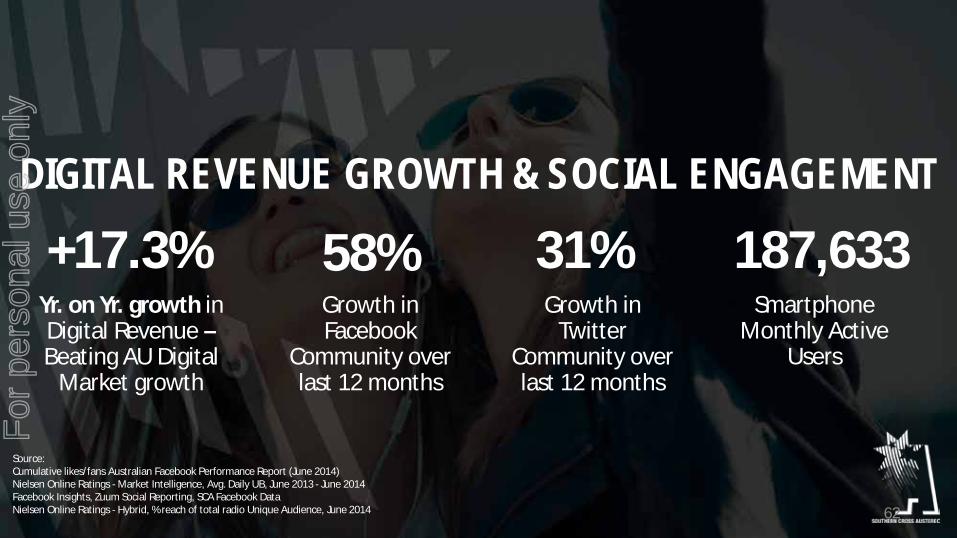
Source: Cumulative likes/fans Australian Facebook Performance Report (June 2014) Nielsen Online Ratings - Market Intelligence, Avg. Daily UB, June 2013 - June 2014 Facebook Insights, Zuum Social Reporting, SCA Facebook Data Nielsen Online Ratings - Hybrid, % reach of total radio Unique Audience, June 2014
DIGITAL REVENUE GROWTH & SOCIAL ENGAGEMENT
+17.3% Yr. on Yr. growth in Digital Revenue – Beating AU Digital
Market growth
187,633 Smartphone
Monthly Active Users
58% Growth in Facebook
Community over last 12 months
31% Growth in
Twitter Community over last 12 months
62
For
per
sona
l use
onl
y
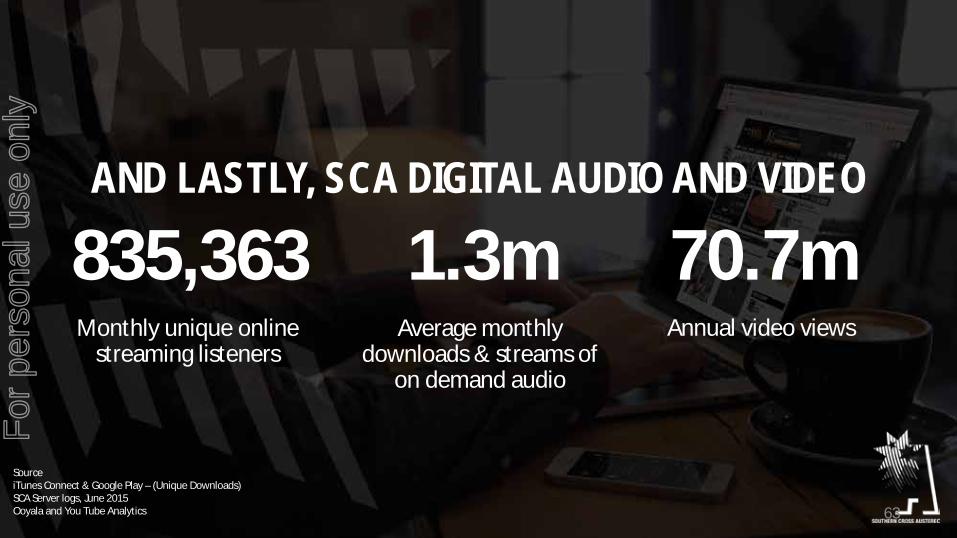
Source iTunes Connect & Google Play – (Unique Downloads) SCA Server logs, June 2015 Ooyala and You Tube Analytics
AND LASTLY, SCA DIGITAL AUDIO AND VIDEO
835,363 Monthly unique online
streaming listeners
1.3m Average monthly
downloads & streams of on demand audio
70.7m Annual video views
63
For
per
sona
l use
onl
y

Appendix
APPENDIX
64
For
per
sona
l use
onl
y
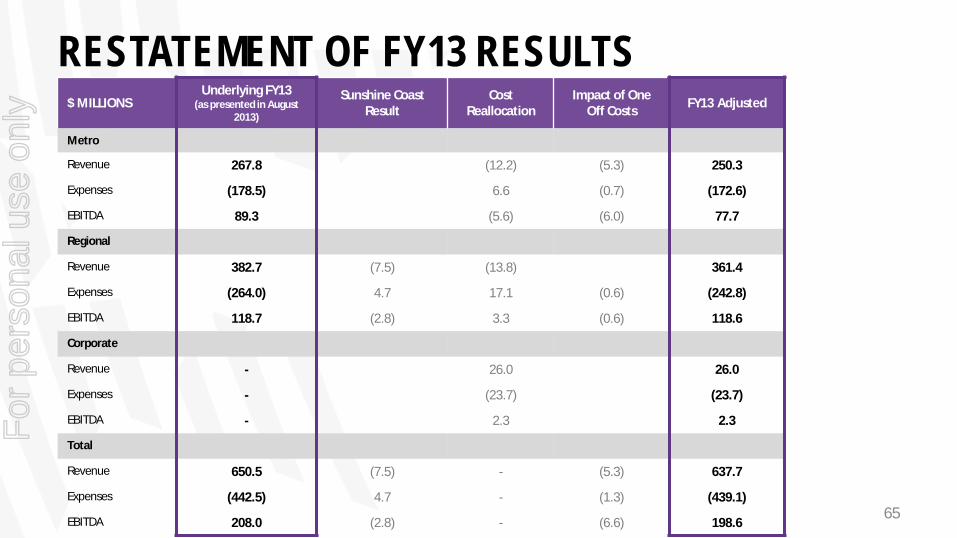
RESTATEMENT OF FY13 RESULTS $ MILLIONS
Underlying FY13 (as presented in August
2013)
Sunshine Coast Result
Cost Reallocation
Impact of One Off Costs FY13 Adjusted
Metro
Revenue 267.8 (12.2) (5.3) 250.3
Expenses (178.5) 6.6 (0.7) (172.6)
EBITDA 89.3 (5.6) (6.0) 77.7
Regional
Revenue 382.7 (7.5) (13.8) 361.4
Expenses (264.0) 4.7 17.1 (0.6) (242.8)
EBITDA 118.7 (2.8) 3.3 (0.6) 118.6
Corporate
Revenue - 26.0 26.0
Expenses - (23.7) (23.7)
EBITDA - 2.3 2.3
Total
Revenue 650.5 (7.5) - (5.3) 637.7
Expenses (442.5) 4.7 - (1.3) (439.1)
EBITDA 208.0 (2.8) - (6.6) 198.6 65
For
per
sona
l use
onl
y
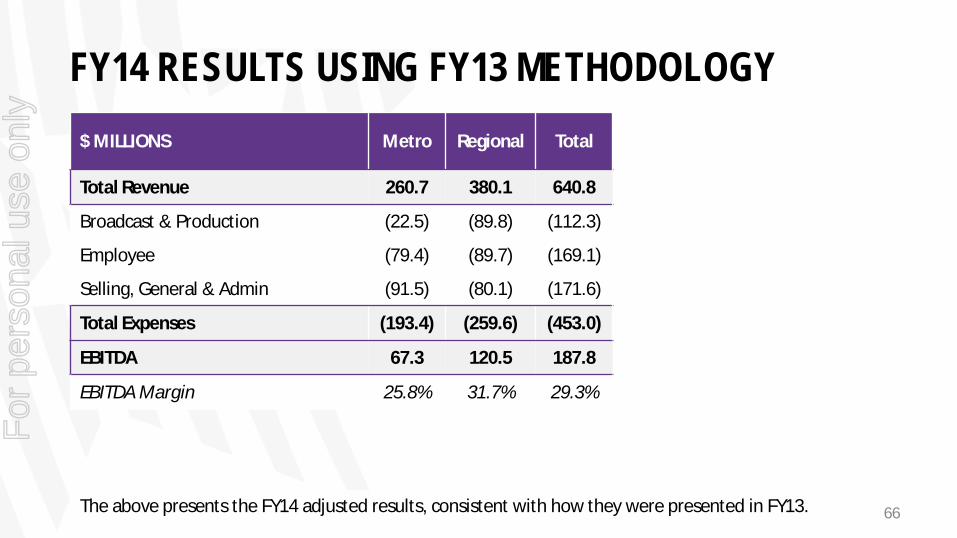
$ MILLIONS Metro Regional Total
Total Revenue 260.7 380.1 640.8
Broadcast & Production (22.5) (89.8) (112.3)
Employee (79.4) (89.7) (169.1)
Selling, General & Admin (91.5) (80.1) (171.6)
Total Expenses (193.4) (259.6) (453.0)
EBITDA 67.3 120.5 187.8
EBITDA Margin 25.8% 31.7% 29.3%
FY14 RESULTS USING FY13 METHODOLOGY
The above presents the FY14 adjusted results, consistent with how they were presented in FY13. 66
For
per
sona
l use
onl
y