for personal use only - asx · 3 financial performance full year 2015 • ebitda of $20.2m •...
TRANSCRIPT

Geoff Lewis, CEO and Dean Langenbach, COO/CFOAugust 2015
FY15 Results
1
For
per
sona
l use
onl
y

Company Overview
2
ASX code: ASZ
Number of Shares on Issue: 206,720,839
Share Price:$1.04
Market Capital: $215 million
Ian Campbell: Chairman
Geoff Lewis: Managing Director, CEO
Stephen Johnston: Non Executive Director
Grant Pestell: Non Executive Director
Peter Torre: Company Secretary
The ASG Board
The ASG Executive Team
Geoff Lewis: Managing Director, CEO
Dean Langenbach: COO, CFO
Gerald Strautins: Executive - Strategy
For
per
sona
l use
onl
y

3
Financial PerformanceFull Year 2015
• EBITDA of $20.2m• Revenue up 3%, services revenue up 4%• EPS up 6.2%• NPAT up 6%• New contract establishment impacts EBITDA• H2 operating cash strong at $14m
Contract wins
Outlook
FY15 – Delivering on the New World
• Over $200m of contracts signed in 12 months:Western PowerCimicDepartment of CommunicationsSynergyState SuperDepartment of Primary & Environment Industries (DEPI)Lockheed Martin (Defence)Australian Transport Safety Bureau (ATSB)AusGroup (AGC)Australian Maritime Safety Authority (AMSA)
• Target EBITDA of 14% • $160m locked in revenue for FY16• FY16 Revenue guidance of $180m - $190m• Net debt of $11.4m, on track for FY16 target
For
per
sona
l use
onl
y

FY15 Financial Summary
4
$m FY15 FY14 Movement
Revenue 164.3 160.1 2.6%
EBITDA 20.2 22.0 (8.1%)
NPBT 11.6 12.6 (7.6%)
NPAT 9.5 9.0 6.3%
EBITDA Margins 12.3% 13.7% (1.4%)
EPS 4.61c 4.34c 6.2%
• Revenue up 3%, services Revenue up 4%• H2 core operating EDITDA stronger than H1• Revenue impacted by new Managed Service commencement
delays, contracted revenue now commencing in Q1 FY16• Additional $2.1m of bid and contract establishment costs as
record amount of contracts signed in FY15
For
per
sona
l use
onl
y

FY15 H1 v H2 Operating EBITDA
5
$m H1 H2 FY15 Total
Reported EBITDA 11.1 9.1 20.2
- Profit on Data Centre(1.0) 0.4 (0.6)
- R&D credit(0.8) 0.0 (0.8)
- Acquisition Payment0.0 0.4 0.4
- Share Based Payments0.1 0.3 0.4
Operating EBITDA 9.4 10.2 19.6
• H2 run rate strong, despite soft old world project revenue and higher contract ramp up costs
• Data Centre profit on sale reduced in H2 due to timing delay of new contracts coming on board.
For
per
sona
l use
onl
y
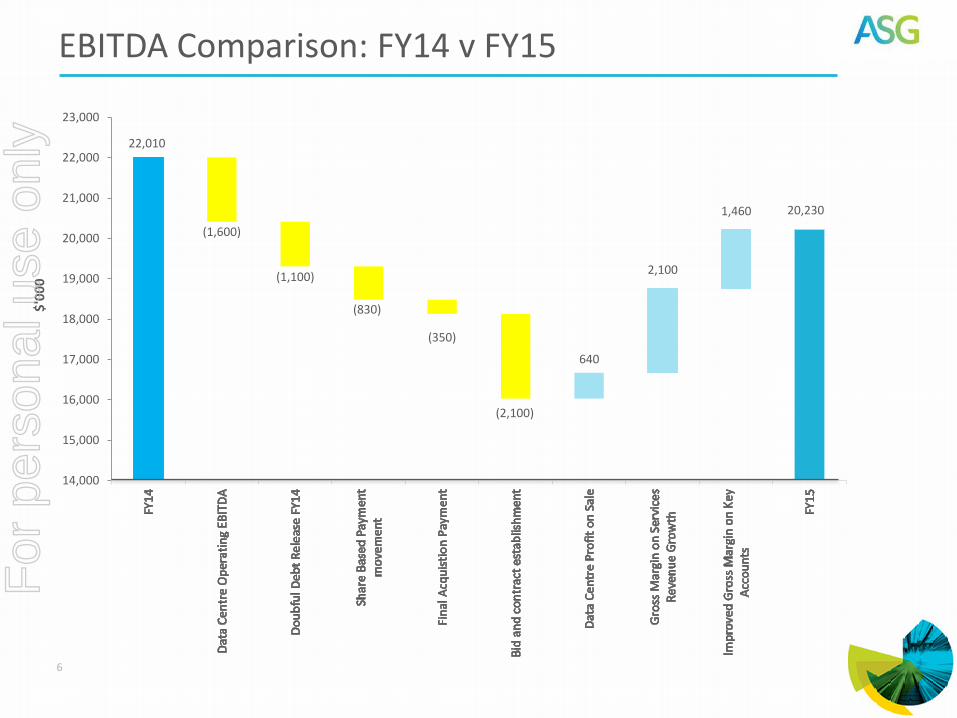
6
22,010
(1,600)
(1,100)
(830)
(350)
(2,100)
640
2,100
1,460 20,230
14,000
15,000
16,000
17,000
18,000
19,000
20,000
21,000
22,000
23,000
EBITDA Comparison: FY14 v FY15 $
'00
0F
or p
erso
nal u
se o
nly

EBITDA to Net Operating Cash
7
$m FY15 FY14
EBITDA 20.2 22.0
Finance Costs (1.7) (2.9)
Income Tax (1.7) (0.0)
R&D credit – non cash (0.8) (0.9)
Data centre profit – investing activity (0.6) 0.0
Debtors: early Govt. payments in June 2014 (4.1) 4.1
Debtors: SAP project milestone delay (2.0) 0.0
Other: sundry non-cash and creditor movement (0.8) (0.3)
Net Operating Cash 8.5 22.0
Net Operating Cash % EBITDA 40% 100%
• ASG targeting 70% - 75% Net Operating Cash % EBITDA • Average over FY14 and FY15 periods = 70%• $14m operating cash turnaround from H1
For
per
sona
l use
onl
y

Operating Cash Flow
8
• $2m milestone payment delay on SAP project. Payment received in August 2015
• Early Debtor receipts of $4.1m in FY14 impacted FY15• Future Operating Cash Flow consistent with EBITDA less interest and tax
53
68
48
73
61
-20
-10
0
10
20
30
40
50
60
70
80
-10.0
-
10.0
20.0
30.0
40.0
FY13 H1 FY14 FY14 H1 FY15 FY15
DA
YS
$M
Debtor Days Operating Cash Flow
For
per
sona
l use
onl
y
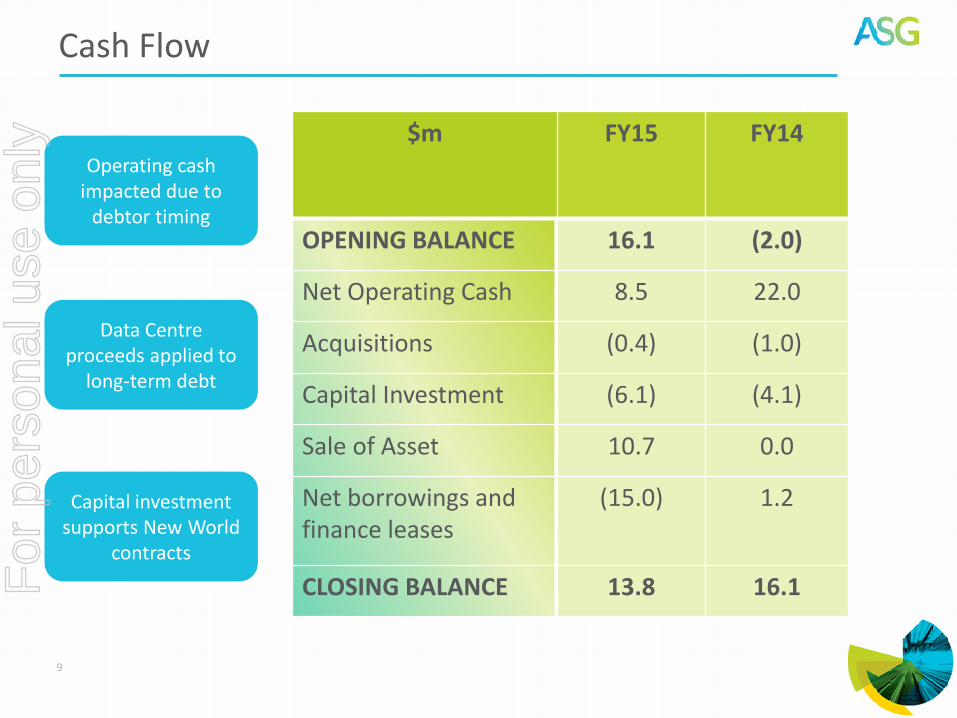
Cash Flow
9
$m FY15 FY14
OPENING BALANCE 16.1 (2.0)
Net Operating Cash 8.5 22.0
Acquisitions (0.4) (1.0)
Capital Investment (6.1) (4.1)
Sale of Asset 10.7 0.0
Net borrowings and finance leases
(15.0) 1.2
CLOSING BALANCE 13.8 16.1
Operating cash impacted due to
debtor timing
Data Centre proceeds applied to
long-term debt
Capital investment supports New World
contracts
For
per
sona
l use
onl
y

Balance Sheet Strengthening
10
$m June 2015 June 2014
Current Assets
Cash 13.8 16.1
Receivables 33.2 28.0
Other Current Assets 1.9 11.9
Total Current Assets 49.0 56.0
TOTAL ASSETS 177.1 179.8
Current Liabilities
Trade and other payables 33.6 33.1
Borrowings 5.9 8.8
Total Current Liabilities 46.4 50.9
Non-Current Borrowings 19.3 29.0
TOTAL LIABILITIES 73.8 86.3
NET ASSETS 103.3 93.5
Strengthened by operating performance
and Data Centre sale
Net Current Asset improvement (excluding
Data Centre sale)
Continued focus on debt reduction and liquidity
improvement
For
per
sona
l use
onl
y

Debt Reduction Focus
11
• FY15 Net Debt of $11.4m against target of <$10m• Higher than anticipated bid costs of $2.1m• Milestone delay on SAP project
• FY16 Target: Surplus cash reserves exceed debt• Remains on track despite unprecedented contract success
FY16 Target
FY14 Target
FY14 Actual
FY15 ActualFY15 Target
-35
-30
-25
-20
-15
-10
-5
0
5
10
$M
For
per
sona
l use
onl
y
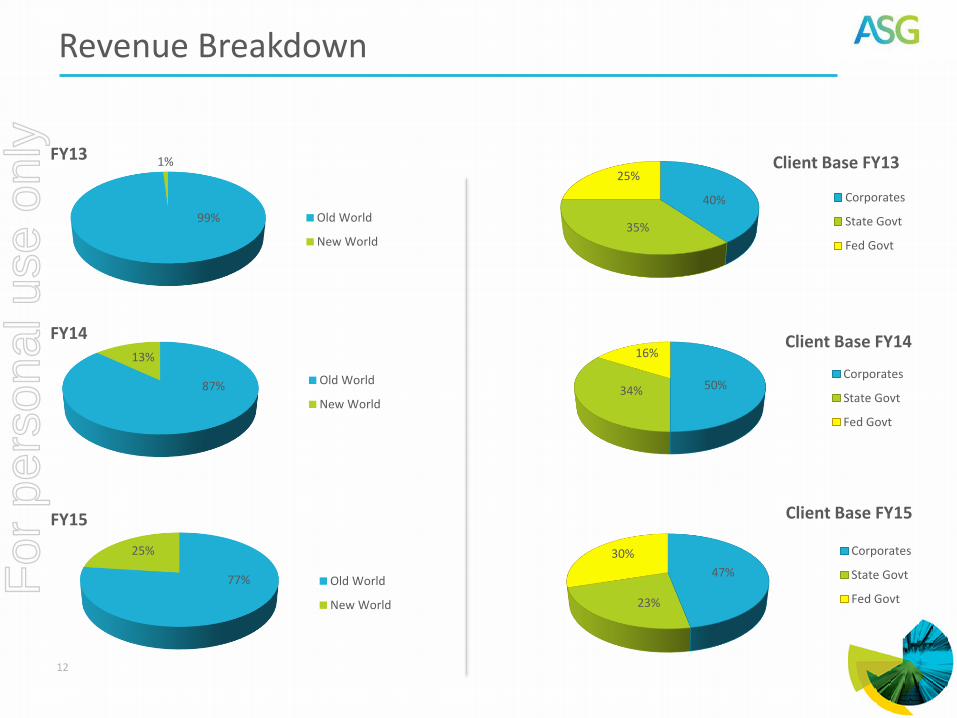
77%
25%
FY15
Old World
New World
Revenue Breakdown
12
99%
1%FY13
Old World
New World
87%
13%
FY14
Old World
New World
50%34%
16%Client Base FY14
Corporates
State Govt
Fed Govt
47%
23%
30%
Client Base FY15
Corporates
State Govt
Fed Govt
40%
35%
25%Client Base FY13
Corporates
State Govt
Fed Govt
For
per
sona
l use
onl
y
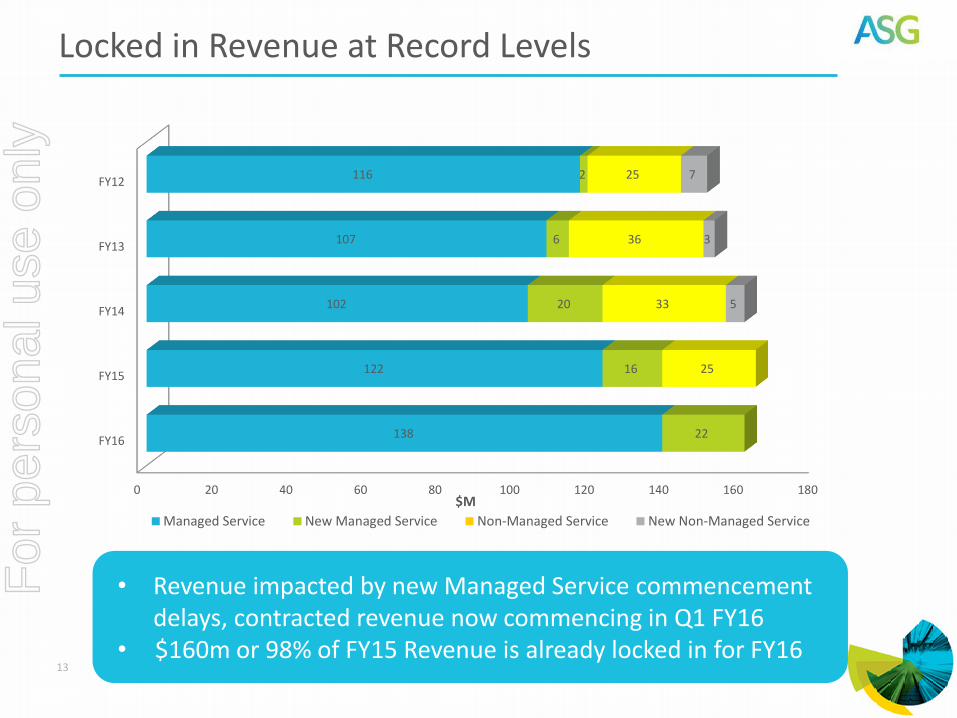
Locked in Revenue at Record Levels
13
• Revenue impacted by new Managed Service commencement delays, contracted revenue now commencing in Q1 FY16
• $160m or 98% of FY15 Revenue is already locked in for FY16
0 20 40 60 80 100 120 140 160 180
FY16
FY15
FY14
FY13
FY12
138
122
102
107
116
22
16
20
6
2
25
33
36
25
5
3
7
Managed Service New Managed Service Non-Managed Service New Non-Managed Service
$M
For
per
sona
l use
onl
y

Record Contract Wins – Over $200m in 12 Months
14
Customer TypeContractPeriod
Western Power Renewal + additional scope 3 + 2 + 2 years
Cimic New 5 years
Department of Communications Renewal + conversion to New World 5 years
Synergy Renewal + additional scope 3 + 3 years
State Super New 3 + 2 years
Department of Primary & Environment Industries (DEPI)
New 3 years
Lockheed Martin (Defence) New 8 years
Australian Transport Safety Bureau (ATSB)
New 4 years
AusGroup (AGC) New 5 + years
Australian Maritime Safety Authority (AMSA)
New 5 + 3 years
• $150m of new clients, $50m of existing clients• Average contract length 4 years plus 4 year renewal
For
per
sona
l use
onl
y

Pipeline
NSW$60m
WA$45m
VIC$85m
ACT$140m
QLD$15m
TOTAL$345m
For
per
sona
l use
onl
y

Transition to the Next Generation Technology Services Model
16
Buyer Side Push:• Pay for results (vs.
efforts)/outcome based• More predictability• Faster time to market
Vendor Side Pull:• Technological advances• Headcount issues• Wage inflation
As software, services and infrastructure continue to converge, buyers and sellers of IT services are moving rapidly towards the adoption of outcome-based services offering where the value proposition is defined
by IP
Traditional Services Offering(Capacity on Demand)
Managed Services Offering(Capability on Demand)
Role
Verticalisation
Intellectual Property
Methods / Tools / Accelerators
Labour
Role
Verticalisation
Intellectual Property
Methods / Tools/Accelerators
Labour
Current State Future State
Role
Verticalisation
Intellectual Property
Methods / Tools / Accelerators
Labour
For
per
sona
l use
onl
y
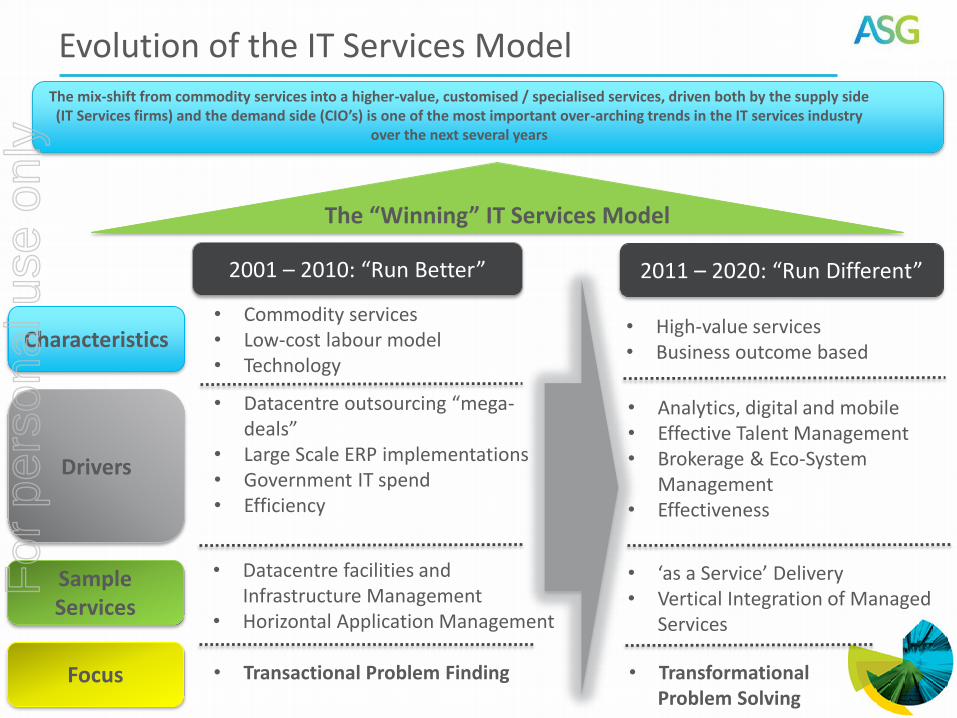
Evolution of the IT Services Model
17
The mix-shift from commodity services into a higher-value, customised / specialised services, driven both by the supply side(IT Services firms) and the demand side (CIO’s) is one of the most important over-arching trends in the IT services industry
over the next several years
The “Winning” IT Services Model
2001 – 2010: “Run Better” 2011 – 2020: “Run Different”
Characteristics
Drivers
SampleServices
Focus
• Commodity services• Low-cost labour model• Technology
• Datacentre outsourcing “mega-deals”
• Large Scale ERP implementations• Government IT spend• Efficiency
• Datacentre facilities and Infrastructure Management
• Horizontal Application Management
• Transactional Problem Finding
• High-value services• Business outcome based
• Analytics, digital and mobile• Effective Talent Management• Brokerage & Eco-System
Management• Effectiveness
• ‘as a Service’ Delivery• Vertical Integration of Managed
Services
• Transformational Problem Solving
For
per
sona
l use
onl
y
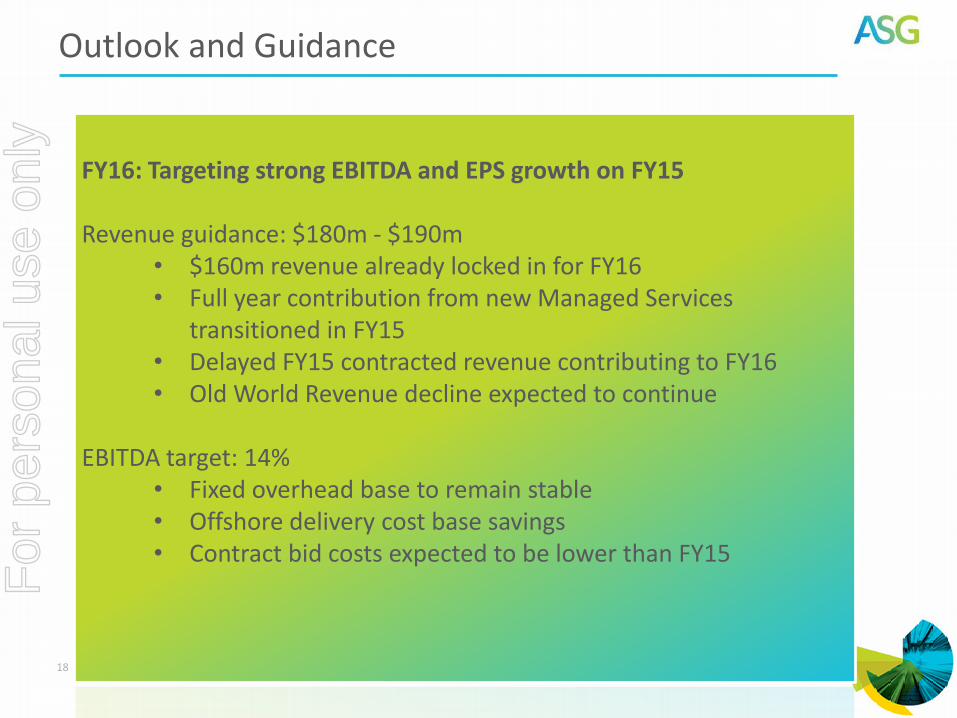
Outlook and Guidance
18
FY16: Targeting strong EBITDA and EPS growth on FY15
Revenue guidance: $180m - $190m• $160m revenue already locked in for FY16• Full year contribution from new Managed Services
transitioned in FY15• Delayed FY15 contracted revenue contributing to FY16• Old World Revenue decline expected to continue
EBITDA target: 14%• Fixed overhead base to remain stable• Offshore delivery cost base savings • Contract bid costs expected to be lower than FY15
For
per
sona
l use
onl
y
Q&A
19
For
per
sona
l use
onl
y