for information composition and structure of the staff · author unit: human resources development...
TRANSCRIPT
This document will be made available in printed form during the GB session only, in order to minimize the environmental impact of the ILO's activities and processes, contribute to climate neutrality and improve efficiency. All GB documents are available on the Internet at www.ilo.org.
INTERNATIONAL LABOUR OFFICE
Governing Body 317th Session, Geneva, 6–28 March 2013
GB.317/PFA/INF/2
Programme, Financial and Administrative Section PFA
FOR INFORMATION
Composition and structure of the staff
Summary: This document provides information on the composition and structure of the staff of the Office.
Author unit: Human Resources Development Department (HRD).
Related documents: None.


GB.317/PFA/INF/2
GB317-PFA_INF_2_[HROPS-130205-1]-En.docx 1
1. This document provides information on the composition and structure of the staff of the Office. It is presented as follows:
Part I. General overview
Table I Distribution of staff according to category, place of assignment, type ofcontract and source of funds on 31 December 2012
Chart I Distribution of staff according to place of assignment, category and type of contract on 31 December 2012
Chart II Number of staff according to staff category and source of funds over the lastsix years (from 31 December 2007 to 31 December 2012)
Chart III Percentage of staff by length of service and source of funds as at 31 December 2012
Chart IV Percentage of staff by length of service as at 31 December 2012 (allcategories of staff)
Part II. Gender and age diversity
Table II (a) Distribution by age, gender and grade of Professional and higher category staff on 31 December 2012, with percentages of women for 2011 and 2012 (regular staff)
(b) Distribution by age, gender and grade on 31 December 2012, with percentages of women for 2011 and 2012 (all categories of staff)
Chart V Distribution by gender and grade of staff newly appointed between1 January and 31 December 2012 in the Professional category and above(regular staff)
Chart VI Distribution by age and gender of staff newly appointed between 1 Januaryand 31 December 2012 in the Professional category and above (regularstaff)
Chart VII Number of Professional and higher category staff, by gender, in serviceover ten years (from 31 December 2002 to 31 December 2012) (regular staff)
Chart VIII (a) Number of Professional and higher category staff by age over ten years (from 31 December 2002 to 31 December 2012) (regular staff)
(b) Number of Professional and higher category staff by age, on 31 December 2012 (regular staff)
Part III. Staff mobility
Table III Number of staff movements including geographical mobility, transferswithin grade, inter-agency mobility, promotions and cessations of service, in2011 and 2012 (regular staff)
Part IV. Geographical diversity
Table IV Overall distribution by region, country of nationality, including staffmovements of staff in the Professional and higher category(1 January–31 December 2012) (regular staff)
Table V Unrepresented nationalities on non-linguistic posts as at 31 December 2012

GB.317/PFA/INF/2
2 GB317-PFA_INF_2_[HROPS-130205-1]-En.docx
Table VI Composition of staff newly appointed between 1 January and 31 December2012 in the Professional category and above (regular staff) (a) Non-linguistic staff subject to geographical distribution (b) Linguistic staff not subject to geographical distribution
Part V. ILO presence
Table VII ILO presence by duty station as at 31 December 2012 (all categories ofstaff)
2. The information in this document for headquarters-based staff and international professional staff based in the field is obtained from the Office’s Integrated Information Resource System (IRIS). The data for field offices in the present document will continue to be derived in large measure from other systems until the IRIS roll-out to the field is completed.
Geneva, 4 February 2013

GB.317/PFA/INF/2
GB317-PFA_INF_2_[HROPS-130205-1]-En.docx 3
Part I. General overview
Table I. Distribution of staff according to category, place of assignment, type of contract and source of funds on 31 December 2012
Category of staff and place of assignment
Officials employed
Regular staff Technical cooperation staff * Total
WLT FT Subtotal FT Subtotal
(a) Headquarters Professional category and above 272 259 531 158 158 689
General Service category 324 123 447 55 55 502
Subtotal (a) 596 382 978 213 213 1 191(b) Field offices Professional category and above 99 149 248 188 188 436
National Officer category 54 55 109 387 387 496
General Service category 250 157 407 453 453 860
Subtotal (b) 403 361 764 1 028 1 028 1 792Grand total (a+b) 999 743 1 742 1 241 1 241 2 983WLT = Without limit of time; FT = Fixed-term * Positions funded by TC, PSI, RBSA and other extra-budgetary resources.
Chart I. Distribution of staff according to place of assignment, category and type of contract on 31 December 2012
Regular staff Technical cooperation staff
Source: Table I.
0
50
100
150
200
250
300
350
400
P GS P NO GS
Headquarters Field offices
259
123149
55
157
272
324
9954
250
FT WLT
050
100150200250300350400450500
P GS P NO GS
Headquarters Field offices
158
55
188
387453
FT

GB.317/PFA/INF/2
4 GB317-PFA_INF_2_[HROPS-130205-1]-En.docx
Chart II. Number of staff according to staff category and source of funds over the last six years (from 31 December 2007 to 31 December 2012)
Regular staff Technical cooperation staff
Source: Table I above and data from previous PFAC documents on composition and structure of the staff.
Chart III. Percentage of staff by length of service and source of funds as at 31 December 2012
Regular staff Technical cooperation staff
779
109
854
0
200
400
600
800
1 000
2007 2008 2009 2010 2011 2012
P NO GS
346
387
508
0
200
400
600
800
1 000
2007 2008 2009 2010 2011 2012
P NO GS
0%
10%
20%
30%
40%
50%
Under 5 years 5 to 9 years 10 to 24 years Over 25 years
6% 8%
26%
8%14%
9%
24%
4%
GS P + NO
0%
10%
20%
30%
40%
50%
Under 5 years 5 to 9 years 10 to 24 years Over 25 years
33%
5%3% 0.0%
46%
10%
3% 0.2%
GS P + NO

GB.317/PFA/INF/2
GB317-PFA_INF_2_[HROPS-130205-1]-En.docx 5
Chart IV. Percentage of staff by length of service as at 31 December 2012 (all categories of staff)
Part II. Gender and age diversity
Table II(a). Distribution by age, gender and grade of Professional and higher category staff on 31 December 2012, with percentages of women for 2011 and 2012 (regular staff)
Grade 35 and under
36–45 46–55 Over 55 Subtotal Grand total
% of women
F M F M F M F M F M 31.12.11 31.12.12
D-G – – – – – – – 1 0 1 1 0.0 0.0
Executive and regional directors
– – – – 2 2 3 2 5 4 9 55.5 55.5
D.2 – – – 1 5 2 2 11 7 14 21 32.0 33.3
D.1 – – 1 5 12 18 19 18 32 41 73 47.6 43.8
P.5 – – 15 19 48 76 28 63 91 158 249 34.5 36.5
P.4 5 5 52 58 50 53 17 25 124 141 265 44.6 46.7
P.3 14 6 32 25 12 16 7 4 65 51 116 56.9 56.0
P.2 13 6 9 1 1 – – – 23 7 30 78.2 76.6
P.1 1 – – – – – – – 1 0 1 0.0 100.0
Other * – 2 1 2 3 3 – 3 4 10 14 28.5 28.5
Subtotal 33 19 110 111 133 170 76 127 352 427 779 43.7 45.2% by gender within age group
63.5 36.5 49.8 50.2 43.9 56.1 37.4 62.6 45.2 54.8
Total by age group (M and F) 52 221 303 203 779
% of total 6.7 28.4 38.9 26.1 100
Average age of staff at 31.12.12 (years) 47.2 (F) 49.6 (M) Global average age (years) 48.5
F = Female M = Male. * National Coordinators and Professional staff in Tokyo Office.
Under 5 years44%
5 to 9 years17%
10 to 24 years32%
Over 25 years
7%

GB.317/PFA/INF/2
6 GB317-PFA_INF_2_[HROPS-130205-1]-En.docx
Table II(b). Distribution by age, gender and grade category on 31 December 2012, with percentages of women for 2011 and 2012 (all categories of staff)
Grade Category
35 and under 36–45 46–55 Over 55 Subtotal % female
% female
F M F M F M F M F M 31.12.11 31.12.12
P 101 50 169 154 151 243 88 169 509 616 44.8 45.2
NO 66 38 109 101 65 64 26 27 266 230 55.1 53.6
GS 187 109 269 188 259 159 119 72 834 528 61.3 61.2
Subtotal 354 197 547 443 475 466 233 268 1 609 1 374 54.1 53.9
% by gender within age group
64.2 35.8 55.3 44.7 50.5 49.5 46.5 53.5 53.9 46.1
Total by age group (F and M)
551 990 941 501 2 983
% of total 18.5 33.2 31.5 16.8 100
Average age of staff at 31.12.12 (years) 43.9 (F) 46.2 (M) Global average age (years) 44.9
F = Female M = Male.
Chart V. Distribution by gender and grade of staff newly appointed between 1 January and 31 December 2012 in the Professional category and above (regular staff)
Total recruitment: 67 Source: Table V below.
1 12
14
9
7
1 12
4
15
8
2
0
2
4
6
8
10
12
14
16
DDG ADG D1 P5 P4 P3 P2
F M

GB.317/PFA/INF/2
GB317-PFA_INF_2_[HROPS-130205-1]-En.docx 7
Chart VI. Distribution by age and gender of staff newly appointed between 1 January and 31 December 2012 in the Professional category and above (regular staff)
Total recruitment: 67 Source: Table V below.
Chart VII. Number of Professional and higher category staff, by gender, in service over ten years (from 31 December 2002 to 31 December 2012) (regular staff)
Source: Table II(a) above and data from previous PFAC documents on composition and structure of the staff.
10
14
8
2
5
16
9
3
02468
1012141618
35 and under 36 to 45 46 to 55 Over 55
F M
427
352
0
100
200
300
400
500
2002 2003 2004 2005 2006 2007 2008 2009 2010 2011 2012
M F

GB.317/PFA/INF/2
8 GB317-PFA_INF_2_[HROPS-130205-1]-En.docx
Chart VIII(a). Number of Professional and higher category staff by age, over ten years (from 31 December 2002 to 31 December 2012) (regular staff)
Source: Table II(a) above and data from previous PFAC documents on composition and structure of the staff.
Chart VIII(b). Number of Professional and higher category staff by age, on 31 December 2012 (regular staff)
Source: Table II(a) above.
203
303
221
52
0
100
200
300
400
2002 2003 2004 2005 2006 2007 2008 2009 2010 2011 2012
Over 55 46 to 55 36 to 45 35 and under
19
111
170
127
33
110
133
76
200 150 100 50 0 50 100 150 200
35 and under
36 to 45
46 to 55
Over 56
F M
GB.317/PFA/INF/2
GB317-PFA_INF_2_[HROPS-130205-1]-En.docx 9
Part III. Staff mobility
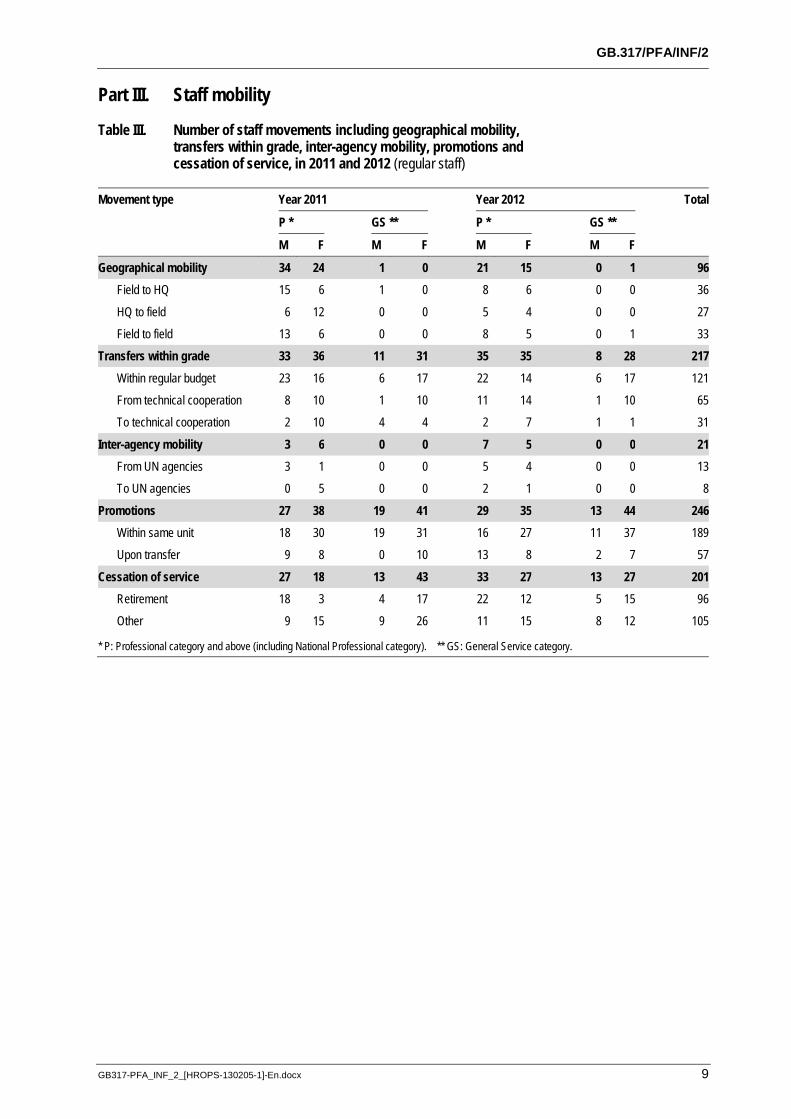
Table III. Number of staff movements including geographical mobility, transfers within grade, inter-agency mobility, promotions and cessation of service, in 2011 and 2012 (regular staff)
Movement type Year 2011 Year 2012 Total
P * GS ** P * GS **
M F M F M F M F
Geographical mobility 34 24 1 0 21 15 0 1 96 Field to HQ 15 6 1 0 8 6 0 0 36
HQ to field 6 12 0 0 5 4 0 0 27
Field to field 13 6 0 0 8 5 0 1 33
Transfers within grade 33 36 11 31 35 35 8 28 217 Within regular budget 23 16 6 17 22 14 6 17 121
From technical cooperation 8 10 1 10 11 14 1 10 65
To technical cooperation 2 10 4 4 2 7 1 1 31
Inter-agency mobility 3 6 0 0 7 5 0 0 21 From UN agencies 3 1 0 0 5 4 0 0 13
To UN agencies 0 5 0 0 2 1 0 0 8
Promotions 27 38 19 41 29 35 13 44 246 Within same unit 18 30 19 31 16 27 11 37 189
Upon transfer 9 8 0 10 13 8 2 7 57
Cessation of service 27 18 13 43 33 27 13 27 201 Retirement 18 3 4 17 22 12 5 15 96
Other 9 15 9 26 11 15 8 12 105
* P: Professional category and above (including National Professional category). ** GS: General Service category.
GB.317/PFA/INF/2
10 GB317-PFA_INF_2_[HROPS-130205-1]-En.docx
Part IV. Geographical diversity
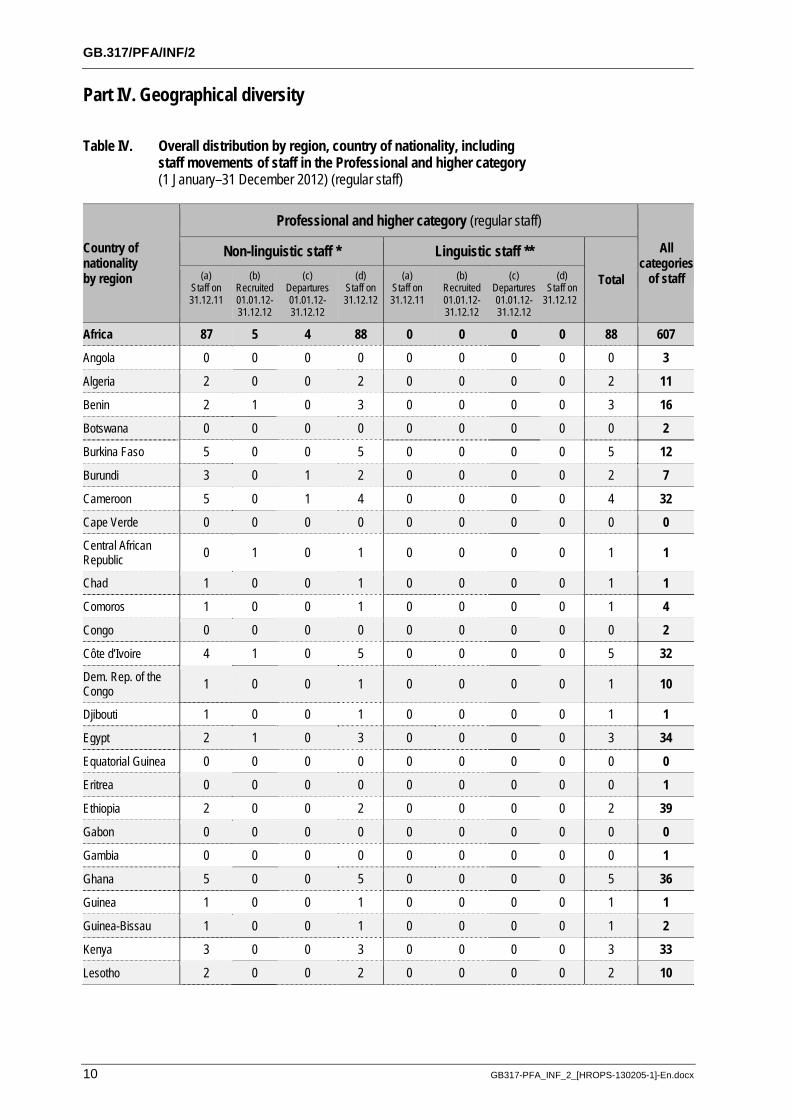
Table IV. Overall distribution by region, country of nationality, including staff movements of staff in the Professional and higher category (1 January–31 December 2012) (regular staff)
Country of nationality by region
Professional and higher category (regular staff)
All categories
of staff
Non-linguistic staff * Linguistic staff **
Total (a) Staff on 31.12.11
(b) Recruited 01.01.12-31.12.12
(c) Departures 01.01.12-31.12.12
(d)Staff on 31.12.12
(a)Staff on 31.12.11
(b)Recruited 01.01.12-31.12.12
(c) Departures 01.01.12-31.12.12
(d) Staff on
31.12.12
Africa 87 5 4 88 0 0 0 0 88 607Angola 0 0 0 0 0 0 0 0 0 3
Algeria 2 0 0 2 0 0 0 0 2 11
Benin 2 1 0 3 0 0 0 0 3 16Botswana 0 0 0 0 0 0 0 0 0 2Burkina Faso 5 0 0 5 0 0 0 0 5 12
Burundi 3 0 1 2 0 0 0 0 2 7
Cameroon 5 0 1 4 0 0 0 0 4 32Cape Verde 0 0 0 0 0 0 0 0 0 0Central African Republic 0 1 0 1 0 0 0 0 1 1
Chad 1 0 0 1 0 0 0 0 1 1Comoros 1 0 0 1 0 0 0 0 1 4
Congo 0 0 0 0 0 0 0 0 0 2
Côte d’Ivoire 4 1 0 5 0 0 0 0 5 32Dem. Rep. of the Congo 1 0 0 1 0 0 0 0 1 10
Djibouti 1 0 0 1 0 0 0 0 1 1
Egypt 2 1 0 3 0 0 0 0 3 34
Equatorial Guinea 0 0 0 0 0 0 0 0 0 0Eritrea 0 0 0 0 0 0 0 0 0 1
Ethiopia 2 0 0 2 0 0 0 0 2 39
Gabon 0 0 0 0 0 0 0 0 0 0Gambia 0 0 0 0 0 0 0 0 0 1
Ghana 5 0 0 5 0 0 0 0 5 36
Guinea 1 0 0 1 0 0 0 0 1 1
Guinea-Bissau 1 0 0 1 0 0 0 0 1 2Kenya 3 0 0 3 0 0 0 0 3 33
Lesotho 2 0 0 2 0 0 0 0 2 10

GB.317/PFA/INF/2
GB317-PFA_INF_2_[HROPS-130205-1]-En.docx 11
Country of nationality by region
Professional and higher category (regular staff)
All categories
of staff
Non-linguistic staff * Linguistic staff **
Total (a) Staff on 31.12.11
(b) Recruited 01.01.12-31.12.12
(c)Departures 01.01.12-31.12.12
(d)Staff on 31.12.12
(a)Staff on 31.12.11
(b)Recruited 01.01.12-31.12.12
(c) Departures 01.01.12-31.12.12
(d) Staff on
31.12.12
Liberia 0 0 0 0 0 0 0 0 0 9
Libya 0 0 0 0 0 0 0 0 0 0Madagascar 1 0 0 1 0 0 0 0 1 32Malawi 1 0 0 1 0 0 0 0 1 9
Mali 2 0 1 1 0 0 0 0 1 15
Mauritania 2 0 0 2 0 0 0 0 2 3Mauritius 4 0 0 4 0 0 0 0 4 8
Morocco 2 0 0 2 0 0 0 0 2 8
Mozambique 0 0 0 0 0 0 0 0 0 7Namibia 0 0 0 0 0 0 0 0 0 1
Niger 1 0 0 1 0 0 0 0 1 2
Nigeria 2 0 0 2 0 0 0 0 2 15
Rwanda 5 0 0 5 0 0 0 0 5 6Sao Tome and Principe 1 0 0 1 0 0 0 0 1 1
Senegal 6 1 1 6 0 0 0 0 6 37
Seychelles 0 0 0 0 0 0 0 0 0 0Sierra Leone 1 0 0 1 0 0 0 0 1 7
Somalia 0 0 0 0 0 0 0 0 0 0
South Africa 2 0 0 2 0 0 0 0 2 34South Sudan 0 0 0 0 0 0 0 0 0 0Sudan 1 0 0 1 0 0 0 0 1 3
Swaziland 0 0 0 0 0 0 0 0 0 2Tanzania, United Rep of 2 0 0 2 0 0 0 0 2 32
Togo 0 0 0 0 0 0 0 0 0 4
Tunisia 4 0 0 4 0 0 0 0 4 12
Uganda 3 0 0 3 0 0 0 0 3 12Zambia 3 0 0 3 0 0 0 0 3 28
Zimbabwe 3 0 0 3 0 0 0 0 3 29
Americas 177 13 10 180 10 0 2 8 188 541Antigua and Barbuda 0 0 0 0 0 0 0 0 0 0
Argentina 10 1 1 10 1 0 0 1 11 28

GB.317/PFA/INF/2
12 GB317-PFA_INF_2_[HROPS-130205-1]-En.docx
Country of nationality by region
Professional and higher category (regular staff)
All categories
of staff
Non-linguistic staff * Linguistic staff **
Total (a) Staff on 31.12.11
(b) Recruited 01.01.12-31.12.12
(c) Departures 01.01.12-31.12.12
(d)Staff on 31.12.12
(a)Staff on 31.12.11
(b)Recruited 01.01.12-31.12.12
(c) Departures 01.01.12-31.12.12
(d) Staff on
31.12.12
Bahamas 0 0 0 0 0 0 0 0 0 0
Barbados 0 0 0 0 0 0 0 0 0 1Belize 0 0 0 0 0 0 0 0 0 0Bolivia, Plurinational State of 2 1 0 3 0 0 0 0 3 8
Brazil 11 0 0 11 0 0 0 0 11 53
Canada 19 2 1 20 0 0 0 0 20 43Chile 4 0 1 3 1 0 1 0 3 22
Colombia 4 0 0 4 0 0 0 0 4 16
Costa Rica 7 1 0 8 0 0 0 0 8 49Cuba 2 0 0 2 0 0 0 0 2 2
Dominica 1 0 0 1 0 0 0 0 1 1
Dominican Republic 1 0 0 1 0 0 0 0 1 6
Ecuador 1 1 0 2 1 0 0 1 3 7El Salvador 2 0 0 2 0 0 0 0 2 10
Grenada 0 0 0 0 0 0 0 0 0 0
Guatemala 0 0 0 0 0 0 0 0 0 3Guyana 0 0 0 0 0 0 0 0 0 3
Haiti 1 0 0 1 0 0 0 0 1 8
Honduras 1 0 0 1 0 0 0 0 1 4Jamaica 2 0 0 2 0 0 0 0 2 4Mexico 9 0 0 9 0 0 0 0 9 23
Nicaragua 0 0 0 0 0 0 0 0 0 8
Panama 1 0 0 1 1 0 0 1 2 6Paraguay 0 0 0 0 0 0 0 0 0 3
Peru 9 2 0 11 0 0 0 0 11 70
Saint Kitts and Nevis 0 0 0 0 0 0 0 0 0 0Saint Lucia 0 0 0 0 0 0 0 0 0 0Saint Vincent and the Grenadines 0 0 0 0 0 0 0 0 0 0
Suriname 1 0 0 1 0 0 0 0 1 1
Trinidad and Tobago 3 0 0 3 0 0 0 0 3 14United States 79 4 6 77 4 0 1 3 80 115

GB.317/PFA/INF/2
GB317-PFA_INF_2_[HROPS-130205-1]-En.docx 13
Country of nationality by region
Professional and higher category (regular staff)
All categories
of staff
Non-linguistic staff * Linguistic staff **
Total (a) Staff on 31.12.11
(b) Recruited 01.01.12-31.12.12
(c)Departures 01.01.12-31.12.12
(d)Staff on 31.12.12
(a)Staff on 31.12.11
(b)Recruited 01.01.12-31.12.12
(c) Departures 01.01.12-31.12.12
(d) Staff on
31.12.12
Uruguay 3 1 1 3 2 0 0 2 5 25Venezuela, Bolivarian Rep. of 4 0 0 4 0 0 0 0 4 8
Arab States 9 3 0 12 3 0 1 2 14 82
Bahrain 0 0 0 0 0 0 0 0 0 1
Iraq 0 0 0 0 0 0 0 0 0 3
Jordan 4 2 0 6 1 0 1 0 6 27Kuwait 0 0 0 0 0 0 0 0 0 0
Lebanon 5 1 0 6 2 0 0 2 8 44
Oman 0 0 0 0 0 0 0 0 0 1Qatar 0 0 0 0 0 0 0 0 0 0
Saudi Arabia 0 0 0 0 0 0 0 0 0 0Syrian Arab Republic 0 0 0 0 0 0 0 0 0 4
United Arab Emirates 0 0 0 0 0 0 0 0 0 0
Yemen 0 0 0 0 0 0 0 0 0 2Asia and the Pacific 111 8 7 112 4 0 0 4 116 706
Afghanistan 1 0 0 1 0 0 0 0 1 8Australia 12 2 0 14 0 0 0 0 14 20
Bangladesh 0 0 0 0 0 0 0 0 0 38
Brunei Darussalam 0 0 0 0 0 0 0 0 0 0Cambodia 0 0 0 0 0 0 0 0 0 49
China 10 2 1 11 3 0 0 3 14 41
Fiji 2 0 0 2 0 0 0 0 2 13India 11 0 0 11 0 0 0 0 11 68
Indonesia 1 0 0 1 0 0 0 0 1 82
Iran, Islamic Rep. of 2 0 0 2 0 0 0 0 2 2
Japan 37 1 4 34 0 0 0 0 34 44Kiribati 0 0 0 0 0 0 0 0 0 0
Korea. Rep. of 6 0 0 6 0 0 0 0 6 10Lao People’s Dem. Rep. 1 0 0 1 0 0 0 0 1 5

GB.317/PFA/INF/2
14 GB317-PFA_INF_2_[HROPS-130205-1]-En.docx
Country of nationality by region
Professional and higher category (regular staff)
All categories
of staff
Non-linguistic staff * Linguistic staff **
Total (a) Staff on 31.12.11
(b) Recruited 01.01.12-31.12.12
(c) Departures 01.01.12-31.12.12
(d)Staff on 31.12.12
(a)Staff on 31.12.11
(b)Recruited 01.01.12-31.12.12
(c) Departures 01.01.12-31.12.12
(d) Staff on
31.12.12
Malaysia 2 0 0 2 0 0 0 0 2 5
Maldives, Rep. of 0 0 0 0 0 0 0 0 0 2Marshall Islands 0 0 0 0 0 0 0 0 0 0Mongolia 2 0 0 2 0 0 0 0 2 4
Myanmar 0 1 0 1 0 0 0 0 1 12
Nepal 2 1 1 2 0 0 0 0 2 25New Zealand 5 0 1 4 0 0 0 0 4 8
Pakistan 4 0 0 4 0 0 0 0 4 38
Palau 0 0 0 0 0 0 0 0 0 0Papua New Guinea 0 0 0 0 0 0 0 0 0 1
Philippines 7 0 0 7 0 0 0 0 7 55
Samoa 0 0 0 0 0 0 0 0 0 0
Singapore 1 0 0 1 0 0 0 0 1 1Solomon Islands 0 0 0 0 0 0 0 0 0 0
Sri Lanka 2 0 0 2 0 0 0 0 2 31
Thailand 3 1 0 4 1 0 0 1 5 70Timor-Leste 0 0 0 0 0 0 0 0 0 26
Tuvalu 0 0 0 0 0 0 0 0 0 0
Vanuatu 0 0 0 0 0 0 0 0 0 0
Viet Nam 0 0 0 0 0 0 0 0 0 48Europe and Central Asia 297 32 21 308 23 6 3 26 334 1 044
Albania 0 1 0 1 0 0 0 0 1 6
Armenia 0 0 0 0 0 0 0 0 0 2Austria 1 0 0 1 0 0 0 0 1 3
Azerbaijan 0 0 0 0 0 0 0 0 0 2
Belarus 1 0 0 1 0 0 0 0 1 2Belgium 12 1 0 13 0 0 0 0 13 26Bosnia and Herzegovina 1 0 0 1 0 0 0 0 1 3
Bulgaria 4 0 1 3 0 0 0 0 3 3
Croatia 3 1 0 4 0 0 0 0 4 5

GB.317/PFA/INF/2
GB317-PFA_INF_2_[HROPS-130205-1]-En.docx 15
Country of nationality by region
Professional and higher category (regular staff)
All categories
of staff
Non-linguistic staff * Linguistic staff **
Total (a) Staff on 31.12.11
(b) Recruited 01.01.12-31.12.12
(c)Departures 01.01.12-31.12.12
(d)Staff on 31.12.12
(a)Staff on 31.12.11
(b)Recruited 01.01.12-31.12.12
(c) Departures 01.01.12-31.12.12
(d) Staff on
31.12.12
Cyprus 0 0 0 0 0 0 0 0 0 0
Czech Republic 2 0 0 2 0 0 0 0 2 2Denmark 6 0 0 6 0 0 0 0 6 15Estonia 1 0 0 1 0 0 0 0 1 1
Finland 4 1 0 5 0 0 0 0 5 12
France 47 6 6 47 8 1 1 8 55 312Georgia 0 0 0 0 0 0 0 0 0 1
Germany 46 3 2 47 1 0 0 1 48 75
Greece 4 0 0 4 0 0 0 0 4 6Hungary 2 0 0 2 0 0 0 0 2 21
Iceland 0 0 0 0 0 0 0 0 0 0
Ireland 3 2 0 5 0 0 0 0 5 23
Israel 3 0 0 3 0 0 0 0 3 3Italy 33 3 1 35 1 0 0 1 36 71
Kazakhstan 0 0 0 0 0 0 0 0 0 2
Kyrgyzstan 0 0 0 0 0 0 0 0 0 4Latvia 0 0 0 0 0 0 0 0 0 1
Lithuania 1 0 0 1 0 0 0 0 1 1
Luxembourg 1 0 0 1 0 0 0 0 1 3
Malta 0 0 0 0 0 0 0 0 0 1Moldova, Rep. of 1 0 0 1 0 0 0 0 1 4
Montenegro 0 0 0 0 0 0 0 0 0 0
Netherlands 15 2 0 17 0 0 0 0 17 30Norway 5 0 0 5 0 0 0 0 5 11
Poland 2 0 0 2 0 0 0 0 2 5
Portugal 4 3 0 7 0 0 0 0 7 22
Romania 3 0 0 3 0 0 0 0 3 5Russian Federation 9 0 3 6 1 0 0 1 7 31
San Marino 0 0 0 0 0 0 0 0 0 0
Serbia 2 0 0 2 0 0 0 0 2 7Slovakia 0 0 0 0 0 0 0 0 0 1
Slovenia 1 0 0 1 0 0 0 0 1 1

GB.317/PFA/INF/2
16 GB317-PFA_INF_2_[HROPS-130205-1]-En.docx
Country of nationality by region
Professional and higher category (regular staff)
All categories
of staff
Non-linguistic staff * Linguistic staff **
Total (a) Staff on 31.12.11
(b) Recruited 01.01.12-31.12.12
(c) Departures 01.01.12-31.12.12
(d)Staff on 31.12.12
(a)Staff on 31.12.11
(b)Recruited 01.01.12-31.12.12
(c) Departures 01.01.12-31.12.12
(d) Staff on
31.12.12
Spain 24 2 3 23 4 2 1 5 28 63
Sweden 6 0 1 5 0 0 0 0 5 16Switzerland 10 1 0 11 1 1 0 2 13 79Tajikistan 0 0 0 0 0 0 0 0 0 4The former Yugoslav Republic of Macedonia
1 0 0 1 0 0 0 0 1 2
Turkey 4 0 0 4 0 0 0 0 4 13Turkmenistan 0 0 0 0 0 0 0 0 0 0
Ukraine 3 1 1 3 0 0 0 0 3 11
United Kingdom 31 5 2 34 7 2 1 8 42 131
Uzbekistan 0 0 0 0 0 0 0 0 0 2Other 0 0 0 0 0 0 0 0 0 3
Total 681 61 42 700 40 6 6 40 740 2 983
Note: The number of regular staff in service (figures shown in columns (a) and (d)) includes staff on leave without pay or on secondment to other organizations; the number excludes the position of the Director-General and staff recruited on a temporary basis.

GB.317/PFA/INF/2
GB317-PFA_INF_2_[HROPS-130205-1]-En.docx 17
Table V. Unrepresented nationalities on non-linguistic posts as at 31 December 2012
The following 67 nationalities were unrepresented on non-linguistic posts as at 31 December 2012.
Angola* Marshall IslandsAntigua and Barbuda MontenegroArmenia* MozambiqueAzerbaijan* NamibiaBahamas Nicaragua*Bahrain* Oman*Bangladesh PalauBarbados Papua New Guinea*Belize Paraguay*Botswana* QatarBrunei Darussalam Saint Kitts and NevisCambodia* Saint LuciaCape Verde Saint Vincent and the Grenadines Congo* SamoaCyprus San MarinoEquatorial Guinea Saudi ArabiaEritrea* SeychellesGabon Slovakia*Gambia* Solomon IslandsGeorgia* SomaliaGrenada South SudanGuatemala* Swaziland*Guyana* Syrian Arab Republic*Iceland Tajikistan*Iraq* Timor-Leste*Kazakhstan* Togo*Kiribati TurkmenistanKuwait TuvaluKyrgyzstan* United Arab EmiratesLatvia* Uzbekistan*Liberia VanuatuLibya Viet Nam*Maldives, Rep. of Yemen*Malta*
* Thirty countries have at least one national among other staff categories (i.e. technicalcooperation or General Service/National Officer categories).

GB.317/PFA/INF/2
18 GB317-PFA_INF_2_[HROPS-130205-1]-En.docx
Table VI. Composition of staff newly appointed between 1 January and 31 December 2012 in the Professional category and above (regular staff)
Total recruitment: 67
(a) Non-linguistic staff subject to geographical distribution: 61
Less than adequate (i) Adequate (ii) More than adequate (iii)
Country Total Country Total Country Total
China 2 Albania 1 Argentina 1
Japan 1 Australia 2 Belgium 1
United States 4 Canada 2 Benin 1
Central African Republic 1 Bolivia, Plurinational State of 1
Ecuador 1 Costa Rica 1
Germany 3 Côte d’Ivoire 1
Italy 3 Croatia 1
Myanmar 1 Egypt 1
Nepal 1 Finland 1
Spain 2 France 6
United Kingdom 5 Ireland 2
Jordan 2
Lebanon 1
Netherlands 2
Peru 2 Portugal 3
Senegal 1
Switzerland 1 Thailand 1
Ukraine 1
Uruguay 1
Total 7 Total 22 Total 32
(i) Number of officials recruited from member States with less than the adequate number of nationals on the staff at the end of 2012. (ii) Number of officials recruited from member States with an adequate number of nationals on the staff at the end of 2012. (iii) Number of officials recruited from member States with more than an adequate number of nationals on the staff at the end of 2012.
(b) Linguistic staff not subject to geographical distribution: 6
Less than adequate (i) Adequate (ii) More than adequate (iii)
Country Total Country Total Country Total
Spain 2 France 1
United Kingdom 2 Switzerland 1
Total 0 Total 4 Total 2
(i) Number of officials recruited from member States with less than the adequate number of nationals on the staff at the end of 2012. (ii) Number of officials recruited from member States with an adequate number of nationals on the staff at the end of 2012. (iii) Number of officials recruited from member States with more than an adequate number of nationals on the staff at the end of 2012.

GB.317/PFA/INF/2
GB317-PFA_INF_2_[HROPS-130205-1]-En.docx 19
Part V. ILO presence
Table VII. ILO presence by duty station as at 31 December 2012 (all categories of staff)
Region Regular staff Technical cooperation staff
Grand total GS NO P GS NO P
Country Duty station F M F M F M F M F M F M
AFRICA Algeria Algiers 4 1 0 1 1 0 0 0 0 0 1 0 8
Angola Luanda 0 0 0 0 0 0 0 0 1 1 0 0 2
Benin Cotonou 0 0 0 0 0 0 1 3 2 4 0 1 11
Botswana Gaborone 0 0 0 0 0 0 1 0 1 0 0 0 2
Burkina Faso Ouagadougou 0 0 0 0 0 0 0 1 1 3 0 0 5
Burundi Bujumbura 0 0 0 0 0 0 0 1 0 2 0 0 3
Cameroon Yaounde 4 7 0 4 2 5 4 2 0 7 1 0 36
Cape Verde Praia 0 0 0 0 0 0 0 0 0 0 1 0 1
Comoros Moroni 0 0 0 0 0 0 0 2 0 1 0 0 3
Congo, Dem. Rep. of the Kinshasa 1 5 0 2 0 1 0 0 0 0 0 0 9
Côte d’Ivoire Abidjan 6 7 0 1 0 0 0 5 0 3 0 1 23
Egypt Cairo 5 4 2 0 2 3 9 5 3 1 2 2 38
Ethiopia Addis Ababa 8 9 6 3 7 8 0 3 1 3 1 4 53
Ghana Accra 0 0 0 0 0 0 4 8 2 5 2 1 22
Koforidua 0 0 0 0 0 0 0 0 0 0 0 1 1
Guinea-Bissau Bissau 0 0 0 0 0 0 0 0 0 1 0 0 1

GB.317/PFA/INF/2
20 GB317-PFA_INF_2_[HROPS-130205-1]-En.docx
Region Regular staff Technical cooperation staff
Grand total GS NO P GS NO P
Country Duty station F M F M F M F M F M F M
Kenya Nairobi 0 0 0 0 0 0 3 8 7 6 2 7 33
Lesotho Maseru 0 0 0 0 0 0 1 2 3 1 1 0 8
Liberia Monrovia 0 0 0 0 0 0 2 4 0 3 0 3 12
Madagascar Antananarivo 5 3 1 1 0 2 2 2 2 1 0 0 19
Antsirabe 0 0 0 0 0 0 3 4 0 4 0 0 11
Malawi Lilongwe 0 0 0 0 0 0 1 3 0 2 0 1 7
Mali Bamako 0 0 0 0 0 0 4 4 2 4 0 0 14
Morocco Rabat 0 0 0 0 0 0 1 0 1 1 1 0 4
Mozambique Maputo 0 0 0 0 0 0 2 1 1 3 0 2 9
Namibia Windhoek 0 0 0 0 0 0 0 0 0 1 0 0 1
Niger Niamey 0 0 0 0 0 0 0 0 0 1 0 0 1
Nigeria Abuja 3 6 0 1 1 1 1 0 1 0 0 1 15
Senegal Dakar 7 8 0 2 6 9 4 7 3 6 2 5 59
Sierra Leone Freetown 0 0 0 0 0 0 1 1 1 2 0 0 5
Makeni 0 0 0 0 0 0 0 0 0 0 0 2 2
South Africa Bisho 0 0 0 0 0 0 0 0 0 0 0 1 1
Bloemfontein 0 0 0 0 0 0 0 0 0 0 0 1 1
Durban 0 0 0 0 0 0 0 0 0 0 0 1 1
Pietermaritzburg 0 0 0 0 0 0 0 0 0 0 0 1 1
Polokwane 0 0 0 0 0 0 0 0 0 0 0 3 3
Pretoria 7 3 1 2 3 11 7 3 7 4 3 6 57
South Sudan Juba 0 0 0 0 0 0 0 0 0 0 0 1 1
Sudan Khartoum 0 0 0 0 0 0 0 0 1 1 0 0 2
Swaziland Mbabane 0 0 0 0 0 0 1 0 1 0 0 0 2
Tanzania, United Rep. of Dar es Salaam 5 3 0 2 1 1 1 5 4 6 1 2 31
Zanzibar 0 0 0 0 0 0 0 0 1 0 0 0 1
Togo Lome 0 0 0 0 0 0 1 1 0 1 0 1 4
Tunisia Tunis 0 0 0 0 0 0 4 1 1 0 0 2 8
Uganda Kampala 0 0 0 0 0 0 1 2 2 3 0 0 8
Zambia Lusaka 3 5 1 1 0 1 5 2 5 3 1 1 28
Zimbabwe Harare 5 2 2 0 0 1 2 2 2 2 0 1 19
Subtotal 63 63 13 20 23 43 66 82 56 86 19 52 586
AMERICAS
Argentina Buenos Aires 5 1 3 0 0 2 0 0 0 1 0 0 12
Bolivia La Paz 0 0 0 0 0 0 2 1 1 1 0 0 5
Brazil Brasilia 5 1 1 2 2 1 5 5 9 5 0 1 37
Sao Paulo 0 0 0 0 0 0 0 0 0 1 0 0 1

GB.317/PFA/INF/2
GB317-PFA_INF_2_[HROPS-130205-1]-En.docx 21
Region Regular staff Technical cooperation staff
Grand total GS NO P GS NO P
Country Duty station F M F M F M F M F M F M
Chile Santiago 9 3 3 1 5 6 1 0 2 0 0 1 31
Colombia Bogota 0 0 0 0 0 0 1 1 2 0 1 0 5
Medellin 0 0 0 0 0 0 1 0 0 0 0 0 1
Costa Rica San Jose 14 3 1 3 2 8 8 0 11 2 5 0 57
Dominican Republic Santo Domingo 0 0 0 0 0 0 1 0 3 0 0 0 4
Ecuador Quito 0 0 0 0 0 0 1 0 0 1 0 0 2
El Salvador San Salvador 0 0 0 0 0 0 1 0 2 2 0 2 7
Guatemala Guatemala City 0 0 0 0 0 0 1 0 0 2 0 0 3
Guyana Georgetown 0 0 0 0 0 0 1 0 1 1 0 0 3
Haiti Port au Prince 0 0 0 0 0 0 1 1 3 2 1 3 11
Honduras Tegucigalpa 0 0 0 0 0 0 0 0 2 0 0 0 2
Jamaica Kingston 0 0 0 0 0 0 1 0 1 0 0 0 2
Mexico Mexico City 5 2 2 0 1 1 2 0 1 1 1 0 16
Nicaragua Managua 0 0 0 0 0 0 2 0 4 1 1 0 8
Panama Panama City 0 0 0 0 0 1 1 2 0 1 0 0 5
Paraguay Asuncion 0 0 0 0 0 0 3 0 0 1 0 0 4
Peru Lima 21 5 7 2 5 11 3 0 5 2 1 5 67
Trinidad and Tobago Port of Spain 8 1 2 0 3 6 1 0 0 0 1 0 22
United States New York 2 0 0 0 2 2 0 0 0 0 1 0 7
Washington 3 0 0 0 1 1 0 0 0 0 0 0 5
Uruguay Montevideo 5 5 3 0 1 1 1 1 0 1 0 0 18
Subtotal 77 21 22 8 22 40 38 11 47 25 12 12 335
ARAB STATES
Bahrain Manama 0 0 0 0 0 0 0 0 0 1 0 0 1
Jordan Amman 0 0 0 0 0 0 6 1 6 6 1 5 25
Kuwait Kuwait 1 0 0 0 0 0 0 0 0 0 0 0 1
Lebanon Beirut 11 4 2 0 6 8 8 3 4 2 3 2 53
Occupied Palestinian Territories 1 1 1 0 0 1 1 0 0 0 0 0 5
Oman Muscat 0 0 0 0 0 0 0 0 0 1 0 0 1
Yemen Sanaa 0 0 0 1 0 0 0 1 0 0 0 0 2
Subtotal 13 5 3 1 6 9 15 5 10 10 4 7 88
ASIA
Afghanistan Kabul 0 1 0 0 0 0 1 3 0 1 0 1 7
Bangladesh Dhaka 1 7 0 3 0 1 3 12 2 8 2 5 44
Cambodia Phnom Penh 0 1 0 1 0 0 15 15 2 8 1 0 43
China Beijing 6 2 0 1 3 1 3 1 4 3 0 0 24
Fiji Suva 4 4 1 0 0 1 0 1 1 1 2 0 15

GB.317/PFA/INF/2
22 GB317-PFA_INF_2_[HROPS-130205-1]-En.docx
Region Regular staff Technical cooperation staff
Grand total GS NO P GS NO P
Country Duty station F M F M F M F M F M F M
India Chennai 0 0 0 0 0 0 0 1 0 0 0 0 1
New Delhi 11 10 3 1 5 7 7 6 6 2 0 2 60
Indonesia Ambon 0 0 0 0 0 0 0 1 0 1 0 0 2
Banda Aceh 0 0 0 0 0 0 1 0 0 0 0 0 1
Gunung Sitoli 0 0 0 0 0 0 3 22 2 6 0 1 34
Jakarta 5 3 3 1 1 1 6 5 8 9 1 1 44
Jayapura 0 0 0 0 0 0 1 0 1 0 0 0 2
Padang 0 0 0 0 0 0 1 0 0 0 0 0 1
Sikakap 0 0 0 0 0 0 0 0 0 1 0 0 1
Teluk Dalam 0 0 0 0 0 0 0 4 0 0 0 0 4
Japan Tokyo 5 0 0 0 2 1 0 0 0 0 0 0 8
Lao People’s Democratic Republic
Luang Prabang 0 0 0 0 0 0 0 0 2 0 0 0 2
Vientiane 0 0 0 0 0 0 1 0 1 1 0 1 4
Malaysia Kuala Lumpur 0 0 0 0 0 0 0 0 1 0 0 0 1
Maldives, Rep. of Male 0 0 0 0 0 0 1 0 1 0 0 0 2
Mongolia Ulan Bator 0 0 0 0 0 0 0 0 1 0 0 0 1
Myanmar Yangon 0 2 1 1 1 1 3 3 0 0 0 0 12
Nepal Kathmandu 2 4 2 1 0 1 1 5 3 2 0 0 21
Pakistan Islamabad 2 6 0 2 1 1 1 9 5 3 0 1 31
Sahiwal 0 0 0 0 0 0 0 0 0 1 0 0 1
Sukkur 0 0 0 0 0 0 0 0 0 1 0 0 1
Papua New Guinea Port Moresby 0 0 0 0 0 0 0 0 0 1 0 0 1
Philippines Catarman 0 0 0 0 0 0 0 1 0 0 0 0 1
Iligan 0 0 0 0 0 0 1 1 0 0 0 0 2
Lucena 0 0 0 0 0 0 1 1 0 0 0 0 2
Malaybalay 0 0 0 0 0 0 0 1 0 0 0 0 1
Manila 9 1 3 0 0 1 5 2 7 3 1 1 33
Masbate 0 0 0 0 0 0 0 1 0 0 0 0 1
Sri Lanka Batticaloa 0 0 0 0 0 0 0 3 0 1 0 0 4
Colombo 4 3 2 0 0 1 1 3 2 1 0 0 17
Kilinochchi 0 0 0 0 0 0 0 1 0 0 0 0 1
Vavuniya 0 0 0 0 0 0 1 5 0 1 0 1 8
Thailand Bangkok 25 11 7 1 15 22 8 1 4 1 5 10 110
Samut Sakhon 0 0 0 0 0 0 1 0 1 0 0 0 2
Surat Thani 0 0 0 0 0 0 0 0 1 0 0 0 1

GB.317/PFA/INF/2
GB317-PFA_INF_2_[HROPS-130205-1]-En.docx 23
Region Regular staff Technical cooperation staff
Grand total GS NO P GS NO P
Country Duty station F M F M F M F M F M F M
Timor-Leste Baucau 0 0 0 0 0 0 0 1 0 0 0 1 2
Dili 0 0 0 0 0 0 7 9 1 0 8 14 39
Maliana 0 0 0 0 0 0 0 2 0 0 0 0 2
Manatuto 0 0 0 0 0 0 0 1 0 0 0 0 1
Oecusee 0 0 0 0 0 0 0 1 0 0 0 1 2
Same 0 0 0 0 0 0 0 0 0 0 0 1 1
Viet Nam Hanoi 3 1 2 1 0 1 13 3 16 7 1 2 50
Ho Chi Minh City 0 0 0 0 0 0 0 0 0 0 2 0 2
Tam Ky 0 0 0 0 0 0 0 0 0 0 1 0 1
Subtotal 77 56 24 13 28 40 86 125 72 63 24 43 651
EUROPE
Albania Tirana 0 0 0 0 0 1 1 0 0 0 1 2 5
Armenia Yerevan 0 0 0 0 1 0 1 0 0 0 0 0 2
Azerbaijan Baku 0 0 0 0 0 1 0 1 0 0 0 0 2
Belarus Minsk 0 0 0 0 0 1 0 0 0 0 0 0 1
Belgium Brussels 3 0 0 0 1 1 0 0 0 0 1 0 6
Bosnia and Herzegovina Sarajevo 0 0 0 0 1 0 0 0 1 0 0 0 2
France Paris 0 1 0 0 0 1 0 0 0 0 0 0 2
Georgia Tbilisi 0 0 0 0 0 0 0 0 0 1 0 0 1
Germany Berlin 2 0 0 0 1 0 0 0 0 0 0 0 3
Hungary Budapest 11 2 1 0 4 4 4 0 1 0 0 0 27
Italy Rome 1 1 0 0 0 1 1 0 0 0 2 4 10
Turin 0 0 0 0 1 1 0 0 0 0 2 0 4
Kazakhstan Astana 0 0 0 0 0 1 1 0 0 0 0 0 2
Kyrgyzstan Bishkek 0 0 0 0 0 1 0 2 1 0 0 0 4
Macedonia, The former Yugoslav Republic of
Skopje 0 0 0 0 0 1 0 0 0 0 0 0 1
Moldova, Rep. of Chisinau 0 0 0 0 1 0 1 0 1 0 0 0 3
Portugal Lisbon 0 0 0 0 1 0 0 0 0 0 1 0 2
Russian Federation Moscow 6 3 3 0 5 2 5 0 4 1 1 1 31
Serbia Belgrade 0 0 0 0 0 1 0 1 1 0 0 0 3
Serbia and Montenegro Pristina 0 0 0 0 0 0 0 0 1 0 0 0 1
Spain Madrid 0 0 0 0 0 1 1 0 0 0 0 0 2
Switzerland Geneva 311 136 0 0 256 275 44 11 0 0 90 68 1 191

GB.317/PFA/INF/2
24 GB317-PFA_INF_2_[HROPS-130205-1]-En.docx
Region Regular staff Technical cooperation staff
Grand total GS NO P GS NO P
Country Duty station F M F M F M F M F M F M
Tajikistan Dushanbe 0 0 0 0 0 1 1 0 2 0 0 0 4
Turkey Ankara 1 1 1 0 1 0 2 1 0 0 0 0 7
Ukraine Kiev 0 0 0 0 0 1 2 0 2 1 0 0 6
Uzbekistan Tashkent 0 0 0 0 0 0 0 0 0 1 0 0 1
Subtotal 335 144 5 0 273 295 64 16 14 4 98 75 1 323
Grand total 565 289 67 42 352 427 269 239 199 188 157 189 2 983