for future generations
TRANSCRIPT

FOR FUTURE GENERATIONS
ANNUAL REPORT 2021

Disclaimer:This Annual Report is a summary of the operations, activities and performance of South32 Limited (ABN 84 093 732 597) and its controlled entities and joint arrangements(1) for the year ended 30 June 2021 and its financial position as at 30 June 2021.
South32 Limited is the parent company of the South32 Group of companies. In this report, unless otherwise stated, references to South32, the South32 Group, the Company, we, us and our refer to South32 Limited and its controlled entities and South32-operated joint arrangements, as a whole. Unless otherwise stated, financial information in this report is presented on the basis as described in the Notes to the Financial Statements basis of preparation on page 100 and includes South32 and its controlled entities and joint arrangements (including operated and non-operated joint arrangements). South32 Limited shares trade on the ASX, JSE and LSE under the listing code of S32. Monetary amounts in this document are reported in US dollars, unless otherwise stated.
Metrics describing sustainability and HSEC performance apply to operated operations that have been wholly owned and operated by South32, or that have been operated by South32 in a joint arrangement, from 1 July 2020 to 30 June 2021. South32’s Sustainability Databook is available at www.south32.net.
Forward-looking statementsThis report contains forward-looking statements. While these forward-looking statements reflect South32’s expectations at the date of this report, they are not guarantees or predictions of future performance or statements of fact. They involve known and unknown risks and uncertainties, which may cause actual results to differ materially from those expressed in the statements contained in this Annual Report. For further information regarding South32’s approach to risk, please see page 24 of this Annual Report. South32 makes no representation, assurance or guarantee as to the accuracy or likelihood or fulfilment of any forward-looking statement or any outcomes expressed or implied in any forward-looking statement. Except as required by applicable laws or regulations, the South32 Group does not undertake to publicly update or review any forward-looking statements, whether as a result of new information or future events. Past performance cannot be relied on as a guide to future performance. South32 cautions against reliance on any forward-looking statements or guidance, particularly in light of the current economic climate and the significant volatility, uncertainty and disruption arising in connection with COVID-19.
Information on likely developments in the Group’s business strategies, prospects and operations for future financial years and the expected results that could result in unreasonable prejudice to the Group (for example, information that is commercially sensitive, confidential or could give a third party a commercial advantage) has not been included below in this report. The categories of information omitted include forward-looking estimates and projections prepared for internal management purposes, information regarding the Group’s operations and projects, which are developing and susceptible to change, and information relating to commercial contracts.
Non-IFRSThis report includes certain non-IFRS financial measures, including underlying measures of earnings, effective tax rate, returns on invested capital, cash flow and net debt. Non-IFRS measures should not be considered as alternatives to an IFRS measure of profitability, financial performance or liquidity.
For an explanation of how South32 uses non-IFRS measures, see page 34.
The meanings of individual non-IFRS measures used in this report are set out in the Glossary on page 165.
OPERATING AND FINANCIAL REVIEW
About us 1
Overview 2
South32 at a glance 4
From the Chair 6
From the CEO 8
Our business model 10
Our strategy 12
Progress against our strategy 14
Our contribution 20
Risk management 24
Financial and operational performance summary 34
GOVERNANCE
Board of Directors 58
Directors’ report 62
Lead Team 66
Remuneration report 68
Contents
See the documents that make up the rest of our reporting suite at https://www.south32.net/investors-media/investor-centre/annual-reporting-suite, including:
Corporate Governance Statement
Sustainable Development Report
Sustainability Databook
Modern Slavery Statement
Tax Transparency and Payments to Governments Report
www.south32.net
ACKNOWLEDGEMENTFINANCIAL REPORT
Consolidated income statement 95
Consolidated statement of comprehensive income 96
Consolidated balance sheet 97
Consolidated cash flow statement 98
Consolidated statement of changes in equity 99
Notes to the financial statements 100
Directors' declaration 147
Lead auditor’s independence declaration 148
Independent auditor’s report 149
RESOURCES AND RESERVES
Information 153
Competent persons 154
Accompanying tables 155
INFORMATION
Shareholder information 161
Glossary of terms and abbreviations 164
Corporate directory 169
(1) In this Annual Report, references to ‘joint arrangements’ mean operations that are not wholly owned by South32, such as joint ventures and joint operations. Joint arrangements are classified in accordance with IFRS 11 Joint Arrangements.
We acknowledge and pay our respects to the Indigenous and Tribal Peoples of the lands, waters and territories on which South32 is located and where we conduct our business around the world.
We respect and acknowledge the unique cultural and spiritual relationships that Indigenous and Tribal Peoples have to the land, waters and territories, and their rich contribution to society.
In the spirit of respect and reconciliation, we will continue to support initiatives that strengthen culture and ways of life so that their legacy continues and extends to future generations.
Sou
th32
Ann
ual R
epor
t 20
21O
per
atin
g a
nd F
inan
cial
Rev
iew

Optimise, Unlock, Identify
Our purpose is underpinned by a simple strategy which is focused on optimising the performance of our operations, unlocking their potential and identifying new opportunities to create value for all our stakeholders.
Read more about our strategy on page 12
Making a difference
Our purpose is to make a difference by developing natural resources, improving people’s lives now and for generations to come. We are trusted by our owners and partners to realise the potential of their resources.
See some of the ways we make a difference on page 20
Care, Trust, Togetherness and Excellence
While our strategy outlines what we do to achieve our purpose, our values of care, trust, togetherness and excellence guide how we do it. Every day, our values shape the way we behave and the standards we set for ourselves and others.
Learn more about our people on page 20 of our Sustainable Development Report
SOUTH32 IS A GLOBAL MINING AND METALS COMPANYWe produce bauxite, alumina, aluminium, metallurgical coal, manganese, nickel, silver, lead and zinc at our operations in Australia, Southern Africa and South America. With a focus on growing our base metals exposure, we also have two development options in North America and several partnerships with junior explorers around the world.
About us
1S
outh32 Annual R
eport 2021
Op
erating and
Financial Review

Total Recordable Injury Frequency (TRIF)(1)
4.3FY21 Scope 1 greenhouse gas emissions against FY15 baseline
16% below4.3 16% below
4.2 10% below
4.5 9% below
Payment of taxes and royalties
US$569mCommunity investment(2)
US$22.2m
Underlying EBITDA(3)
US$1,564mShareholder returns(4)
US$670mFY21 FY21
FY21
FY20 FY20
FY20
FY19 FY19
FY19
US$1,564m
US$22.2m
US$670m
US$569m
US$1,185m
US$24.5m
US$426m
US$751m
US$2,197m
US$17.3m
US$765m
US$981m
FY21
FY20
FY19
FY21
FY20
FY19
FY21
FY20
FY19
Overview
YEAR IN REVIEW
(1) TRIF was adversely affected by a reduction in the total number of hours worked, see page 14.(2) Community investment consists of direct investment, in-kind support and administrative costs, see page 22.(3) This is a non-IFRS measure. For an explanation of how South32 uses non-IFRS measures, see page 34.(4) In respect of the June 2021 financial year. Includes fully franked dividends (interim ordinary US$67 million, final ordinary US$164 million and final
special US$93 million) and on-market share buy-back of US$346 million.
2S
outh
32 A
nnua
l Rep
ort
2021
Op
erat
ing
and
Fin
anci
al R
evie
w

“ We plan to deliver our medium-term emissions reduction target by investing in efficiency projects, shifting to low-carbon energy and adopting new technologies. At the same time we are increasing our exposure to the base metals required for a low-carbon future."Graham Kerr, CEO
Highlights
〉 Announced a new medium-term target to halve our operational carbon emissions by 2035 from our FY21 baseline.
〉 Reshaped our portfolio by completing the divestment of South Africa Energy Coal and the TEMCO manganese alloy smelter.
〉 Achieved record production at Worsley Alumina, Brazil Alumina and Australia Manganese.
〉 Exceeded our initial production guidance at South Africa Manganese, Cerro Matoso and Cannington.
〉 Progressed the pre-feasibility study for the Taylor Deposit and a scoping study for the Clark Deposit at Hermosa.
〉 Delivered first ore from the higher-grade Queresas and Porvenir project at Cerro Matoso.
3O
perating
and Financial R
eviewS
outh32 Annual R
eport 2021

CERRO MATOSO
Nickel
AUSQUEST
Copper & Gold
SABLE RESOURCES
Copper & Gold
MINSUD RESOURCES
Copper, Gold & Molybdenum
AMBLER METALS
Copper, Lead, Gold, Silver & Zinc
SILVER BULL RESOURCES
Zinc, Silver, Lead & Copper
HERMOSA
Zinc, Lead, Silver & Manganese
VANCOUVER
FREEGOLD VENTURES
Copper & Gold
ROOSEVELT PROJECT
Copper, Zinc, Lead, Silver & Gold
EMX ROYALTY CORP
Copper & Gold
JUPITER PROJECT
Copper, Zinc, Lead, Silver & Gold
Upstream operations
Office
Downstream processing facilities
Development option
Exploration partnership/project
South32 investment
Australia
Africa
Americas
By Geography
27%58%
15%
FY21 Key Commodity Underlying EBITDA
US$2.1b(1)
Aluminium value chain
Base & precious metals
Manganese ore
Metallurgical coal
By Commodity
4%
29%
23%
44%BRAZIL ALUMINA
Alumina
MINERAÇÃO RIO DO NORTE (MRN)
Bauxite
DIVERSIFIED PORTFOLIO WITH A BIAS TO BASE METALS
South32 at a glance
See Segment Reporting in Note 4 to the financial statements for more information
(1) Includes manganese on a proportional consolidation basis and excludes South Africa Energy Coal (-US$123 million), manganese alloys (-US$24 million), the Brazil Alumina aluminium smelter (-US$3 million), Hermosa (-US$6 million), Group and unallocated costs (-US$93 million) and statutory adjustments (-US$300 million).
(2) During FY21, we divested our interest in South Africa Energy Coal and the TEMCO manganese alloy smelter.
4S
outh
32 A
nnua
l Rep
ort
2021
Op
erat
ing
and
Fin
anci
al R
evie
w

IFFLEY PROJECT
Zinc, Lead & Silver
HARRY'S LAKE PROJECT
Nickel
PEGMONT MINES
Copper
NORTH QUEENSLAND RESOURCES
Copper, Zinc, Lead, Silver & Gold
CANNINGTON
Silver, Lead & Zinc
WORSLEY ALUMINA
Alumina
AUSQUEST
Nickel
GEMCO
Manganese ore
AUSQUEST
Copper, Lead, Silver & Zinc
AUSQUEST
Copper & Gold
JOHANNESBURG
SINGAPORE
PERTH HEAD OFFICE
HOTAZELMANGANESE MINES
Manganese ore
LONDON
MOZALALUMINIUM
Aluminium
HILLSIDE ALUMINIUM
Aluminium
ADVENTUS MINING CORPORATION
Zinc, Lead & Silver
ILLAWARRAMETALLURGICAL COAL
Metallurgical coal
Portfolio outlookWe are actively reshaping our portfolio to increase our exposure to the base metals critical in the transition to a low-carbon world. In addition, we are building our pipeline of opportunities by investing through the drill bit. We currently have more than 20 greenfield exploration partnerships and projects targeting base metals around the world.(2)
Discover more about our strategy on page 12
Our commoditiesWe produce alumina, aluminium, ferronickel, silver, lead and zinc, which have applications in construction, transport, consumer goods, renewable energy generation and battery storage and we mine metallurgical coal and manganese ore which are used to produce steel. We have operations and development options in Australia, Africa and the Americas and a geographically diverse customer base.
Discover more about our business model on page 10
5S
outh32 Annual R
eport 2021
Op
erating and
Financial Review

From the Chair
A TRANSFORMATIVE YEAR FOR SOUTH32The challenges presented by COVID-19 have remained with us throughout the last year. We have lost colleagues and our people have faced incredibly difficult times with the loss of loved ones and the many other impacts associated with the virus.
Through it all our people have continued to work tirelessly to protect and support our people, our communities and our business. The Board pays tribute to everyone at South32, in particular the teams at our operations, for their continued focus on minimising the risk of infection and for the way they have stepped up to support each other and their communities in this challenging time. We are truly grateful to them all.
In May 2021 we were deeply saddened by the death of Mr Petros Sibeko, a contractor who was working at the Klipspruit Extension Project at South Africa Energy Coal. We express our sympathies to Mr Sibeko’s family, friends and colleagues. Following Mr Sibeko’s death an investigation was undertaken to establish the cause and, most importantly, identify what steps we need to take to learn and improve. The Board has reviewed the findings and heard from management on the changes which were implemented in response.
After some volatility early in the financial year, commodity prices improved by the end of FY21. Our operations performed well throughout the year and delivered Underlying earnings before interest, tax, depreciation and amortisation of US$1.564 billion and free cash flow of US$825 million(1). The Group’s statutory profit after tax declined by US$130 million to a loss of US$195 million following the recognition of impairment charges totalling US$728 million (US$510 million after tax) in relation to Illawarra Metallurgical Coal and a loss on the sale of South Africa Energy Coal of US$159 million.
We ended the financial year with a net cash balance of US$406 million. We returned US$670 million to our shareholders in respect of the period. This included US$439 million as part of our ongoing capital management program, with US$346 million allocated to our on-market share buy-back and US$93 million returned in the form of a special dividend to be paid in October 2021.
During the year we completed the divestment of South Africa Energy Coal, marking a pivotal step in the transformation of our portfolio and the delivery of our strategy. Throughout the divestment process, the Board and management team focused on our vision of making the business sustainable for the long-term and transitioning it to become Black-owned and operated, consistent with South Africa’s transformation agenda. We are pleased to have completed the sale and fulfilled these objectives for the benefit of all those who depend on the business. We also divested the TEMCO manganese alloy smelter in Australia and placed the Metalloys manganese alloy smelter in South Africa on care and maintenance.
Climate change has remained a strong focus for the Board as part of its oversight of material sustainability issues, and also remains an area of significant interest for many of our stakeholders. This year we achieved our first short-term target and set a medium-term target to halve our operational carbon emissions (Scope 1 and 2) by 2035, based on our FY21 baseline. This is both ambitious – which is necessary to achieve our net zero goal – and realistic, recognising that there is no definitive ‘best pathway’ to net zero and some of the innovations we will need are not yet fully developed.
Our approach to climate change is aligned with our purpose, integrated with our strategy and is focused on two key objectives – decarbonising our existing business and reshaping our portfolio for a low-carbon future by increasing our exposure to base metals. We will deliver this through decarbonising our existing operations, securing green energy, designing our growth projects to be carbon neutral and supporting the development of low-carbon technology. The Board sees this commitment as fundamental to the future of South32 and as a result has modified the executive long-term incentive (LTI) plan to include performance on our climate change commitments, with 10 per cent of the LTI awards to be determined by the Board based on our action and progress.
In recent years, we have added a number of growth options to our portfolio with a bias to base metals. We have also reassessed our portfolio’s resilience to transition risk using a scenario in which global warming is assumed to be limited to 1.5°C above pre-industrial levels, to illustrate the resilience of our portfolio in a rapid transition. Our analysis shows demand growth for most of our commodities in a 1.5°C aligned scenario.
In line with our purpose, we want to make sure we are developing natural resources in a way that benefits our stakeholders. Trust and transparency are essential to the way we operate and we work closely with all of our stakeholders, considering different perspectives and working together to create shared value.
(1) Free cash flow from operations including net distributions from our manganese equity accounted investments (EAI).
6S
outh
32 A
nnua
l Rep
ort
2021
Op
erat
ing
and
Fin
anci
al R
evie
w

Many of our operations and projects intersect areas of cultural significance and in FY21 we completed a review of our cultural heritage performance in Australia. The review informed where we need to update our approach to Aboriginal and Torres Strait Islanders’ Cultural Heritage and led to the development of a set of principles to guide our engagements on this important topic. The Board was briefed on the review findings and will continue to receive reports on progress towards addressing areas identified for improvement. Similar reviews in other jurisdictions where we operate are planned for FY22.
Our Innovate Reconciliation Action Plan, launched in September 2020, set new, more ambitious goals to build constructive relationships with Aboriginal and Torres Strait Islander Peoples. It is based on mutual trust and the recognition that we need to be an active partner to create positive, mutually beneficial outcomes. Good progress has been made in several areas including procurement, engagement and training.
Workplace culture is an important part of driving long-term value creation for all stakeholders. The Board, CEO and Lead Team set the direction and tone for our culture. We work to create clarity and shared understanding with our people through regular connection and engagement, so that we are all working together to fulfil our purpose, deliver on our strategy and live our values.
The pandemic has continued to disrupt the Board’s practice of regularly visiting operations and offices in the nine countries in which we work. These visits provided the opportunity for Directors to better understand the daily experiences of our people, the workforce culture and the communities we operate in. The Board is staying connected with our operations by way of virtual operational overviews and briefing sessions conducted as part of the scheduled Board programs.
We are committed to providing a safe and inclusive workplace, one in which no form of harassment is tolerated. It has been concerning to see recent reports of incidents of harassment in our industry, and across society more broadly. We treat harassment, in all its forms, as a serious risk and we are aware that it is often under-reported. Victims and observers are strongly encouraged to report any incidents, knowing they will be treated with confidentiality, respect and sensitivity. We have reviewed the risk of sexual harassment at all our locations and identified several improvement opportunities including targeted campaigns that are underway to confirm our zero-tolerance approach.
Inclusion supports a culture where people feel free to speak up, and we believe in the benefits of building an inclusive and diverse team in South32. We continue to measure our progress against several targets to improve the representation of women across the business and Black People in
South Africa. We are pleased to report that the representation of women on our Operational Leadership Team increased year-on-year, however there is more work to do to meet our target of 20 per cent. During the year, we became a signatory to 40:40 Vision, an investor-led initiative to achieve gender balance in executive leadership across all ASX200 companies by 2030. The global response to the COVID-19 pandemic has changed perceptions of flexible work and highlighted the benefits it can bring to our business and our people. We are leveraging this shift across all our locations as we believe it will help strengthen our employee value proposition.
Looking ahead, we are strongly positioned to continue to deliver against our strategy despite the ongoing impacts of the COVID-19 pandemic. We will continue to prioritise work to protect our people, our assets and our communities. The work that was completed this year to reshape our portfolio will enable Graham and his team to focus on future growth opportunities that will create sustainable long-term value.
On behalf of the Board, I would like to thank our shareholders for their ongoing support and reiterate our thanks to our people for their unwavering commitment in these most difficult of times.
Karen Wood Chair
“ The divestment of South Africa Energy Coal marked a pivotal step in the transformation of our portfolio and the delivery of our strategy.”
7S
outh32 Annual R
eport 2021
Op
erating and
Financial Review

From the CEO
RESILIENCE IN CHALLENGING TIMESThis year has come with many challenges – for our people, our communities, and our business. No one has been immune to the devastating impacts of COVID-19. I’ve been immensely proud to see our people around the world unite and show courage and resilience during these difficult times.
We are deeply saddened by the death of our colleague, Mr Petros Sibeko, a contractor working at South Africa Energy Coal's Klipspruit Extension Project, following an incident involving the use of an Elevated Work Platform in May this year. It's devastating that Mr Sibeko did not return home at the end of his shift and our thoughts are with his family, friends and colleagues. We completed an investigation into the incident and shared learnings across the company, so that a similar event does not happen again, at any of our sites.
In FY20, we commenced our reporting practices to disclose fatalities for contractor activities associated with our operations that take place in locations where we do not have control. Sadly, one person from a contracting company was fatally injured while carrying out work to pave the public road between the municipality of Planeta Rica and our Queresas and Porvenir Project.
Our teams have been working hard to improve our safety performance, and four of our operations recorded their lowest Total Recordable Injury Frequency (TRIF) to date. We also saw a reduction in recordable injuries for the period, however our TRIF increased to 4.3 and our year-on-year performance did not meet our 20 per cent reduction target. We will never be truly successful until we eliminate fatalities and significant incidents. We are focused on improving our safety systems, as well as influencing the organisations we work with to improve safety outcomes, so that everyone goes home safe and well. During the year our people and communities continued to face the many challenges brought about by COVID-19 – illness, the loss of loved ones, uncertainty and isolation – to name but a few. Our response to the pandemic remained unchanged and we focused on keeping
our people safe and well, maintaining safe and reliable operations and supporting our communities.
Among our workforce, many people contracted COVID-19, and encouragingly, most of them recovered. Sadly we lost some of our colleagues to the virus during the year, and on behalf of everyone at South32, my thoughts remain with their families, friends and colleagues. We continue to uphold the necessary controls to protect our people and minimise the risk of exposure to COVID-19. We have supported government vaccination programs by procuring vaccines for our workforces in Colombia and Mozambique and at our GEMCO operation in the Northern Territory, Australia. To support employees through the COVID-19 pandemic, we increased engagement activities across the business and shared resources to help our leaders engage their teams during a period of great uncertainty.
We worked with our communities to provide support when and where it was needed most and implemented community response plans at all sites. We invested an additional US$2.5 million in our COVID-19 Community Investment Fund this year, taking the total invested since the start of the pandemic to US$7.6 million. Our contributions have supported local health clinics with medical equipment and improved water supply, mobile classrooms for schools, relief for small businesses, essential supplies and improved access to water for families. We are actively engaged with governments and health authorities regarding the vaccine roll-out plans and have supported community vaccination programs in South Africa, Colombia, Mozambique, Arizona and on Groote Eylandt in the Northern Territory.
We delivered a strong operating result for the year and achieved several production highlights, including records at Worsley Alumina, Brazil Alumina and Australia Manganese, where the refinery finished the year strongly, operating above nameplate capacity. Volumes improved by 21 per cent at our South Africa Manganese operation, following its recovery from COVID-19 related disruptions in the prior year.
We made significant progress reshaping our portfolio during the year, completing the divestment of South Africa Energy Coal to Seriti Resources and two trusts for the benefit of employees and communities in June 2021. This is a transformative step for South32, as it simplifies our business and substantially reduces our capital intensity. Through the divestment, we achieved our vision of putting South Africa Energy Coal on a pathway to becoming a sustainable business and transitioning it to Black ownership consistent with South Africa’s transformation agenda.
We are actively repositioning our portfolio to increase our exposure to the base metals critical in a low-carbon world. At Hermosa, following work on the pre-feasibility study through the year, we released an updated Mineral Resource estimate for Taylor, which confirms the potential for a long-life zinc-lead-silver project, with study work confirming a preference for a dual shaft development that prioritises early access to higher grade ore. The Taylor Deposit pre-feasibility study was scheduled for completion prior to the end of the June 2021 quarter but has been delayed given the impact of ongoing COVID-19 related workforce restrictions. We expect to report outcomes of a scoping study for the Clark Deposit, which is evaluating the potential for a manganese product for use in electric vehicle batteries, in the first half of FY22.
8S
outh
32 A
nnua
l Rep
ort
2021
Op
erat
ing
and
Fin
anci
al R
evie
w

The Ambler Metals joint venture in Alaska, where we have a 50 per cent shareholding, is progressing a pre-feasibility study for the high-grade Arctic copper and zinc deposit. Earlier this year, Ambler Metals entered into an agreement with the Alaska Industrial Development and Export Authority (AIDEA) to jointly fund pre-development activity for the Ambler Access Road after the AIDEA received Federal permits. The road has potential to unlock the region and pre-development activities are under way.
In addition, we are building our pipeline of opportunities by investing through the drill bit. We currently have more than 20 greenfield exploration partnerships and projects targeting base metals predominantly in the Americas and Australia.
In February, the New South Wales Independent Planning Commission (IPC) refused the application for the Dendrobium Next Domain (DND) project at Illawarra Metallurgical Coal. We have requested a judicial review of the IPC’s decision. Separately, the State Legislative Council has passed a motion requesting that any future development of DND be declared as state significant infrastructure. This would enable the Minister to determine the project upon the submission of an alternative mine plan by South32. We continue to assess options for the project, including a revised mine plan, and we expect to be able to provide a further update relating to the project by the end of the 2021 calendar year.
In May 2021 we announced our target to halve our operational carbon emissions (Scope 1 and 2) by 2035 compared with our FY21 baseline. We have a plan to deliver this target through decarbonising our existing operations, securing green energy, designing our growth projects to be carbon neutral and adopting low carbon technology.
Our decarbonisation plans are focused on the operations which accounted for 90 per cent of our Scope 1 and 2 emissions in FY21 – Worsley Alumina, Illawarra Metallurgical Coal and our aluminium smelters. We are undertaking short-term emissions reduction activities focused on process and energy efficiency projects as well as studying the transition of our energy intensive assets to lower carbon alternatives over the medium-term. Our prefeasibility study for the Taylor Deposit at Hermosa incorporates low-carbon design initiatives and we are focusing our exploration activities on the commodities needed to support the energy transition.
As part of our broader strategy, this plan will shift the carbon intensity of our business and re-position our portfolio for a low-carbon future.
Wherever we operate we proudly support our local communities and during FY21, we invested US$22.2 million in community initiatives and activities in line with our four strategic community investment priorities. We also rolled out our Community Investment Impact Measurement Framework to improve how we measure the outputs and outcomes of our community investment.
In Australia, we partnered with the Australian Indigenous Leadership Centre and Anindilyakwa Land Council, to launch a program designed to enable and empower young people on Groote Eylandt, where GEMCO is located. The Anindilyakwa Future Leaders Program was developed in collaboration with Traditional Owners and is focused on developing leadership capability and governance skills – two areas that will enable this community to thrive long into the future.
When I reflect on the year that’s been, it’s important to recognise that it has been incredibly challenging for each of us. I’ve been proud to see our people around the world unite and show immense courage and resilience in the face of COVID-19. As we look to the future, we have a strong foundation to build from with our operations performing well, a strong balance sheet, high quality growth options in attractive commodities and a plan to decarbonise our business.
Graham Kerr Chief Executive Officer
“ We have a strong foundation to build from with our operations performing well, a strong balance sheet, high quality growth options in attractive commodities and a plan to decarbonise our business.”
9S
outh32 Annual R
eport 2021
Op
erating and
Financial Review

MIN
E
Bauxite(1) Manganese ore Metallurgical coal Nickel ore(1)
LeadSilver Zinc
REF
INE Alumina
SMEL
T Aluminium Ferronickel
Our marketing team generates revenue from the sale of our commodities and purchases raw materials from global markets. They also build a view of commodities and their markets that informs our strategy, business planning and investment decisions.
Construction Transport Energy Consumer goods
Our operations focus on safe and reliable production, minimising their impact and continually improving their competitiveness.
Our pipeline of development options and early stage exploration partnerships is central to our strategy to reshape and improve our portfolio to create long-term value.
Our business model
CREATING LONG-TERM VALUEAs a global mining and metals company, we create value by producing commodities that are used in all aspects of modern life. Our operations, development options and exploration projects and partnerships are diversified by commodity and geography. We work to minimise the impact of our operations and aim to create enduring social, environmental and economic value.
(1) We mine and refine bauxite to produce alumina; we mine and smelt nickel ore to produce ferronickel.
Our strategy guides how we optimise the performance of our operations, unlock their potential and identify new opportunities to create value for all our stakeholders.For more information on Progress against our strategy in FY21, see page 14
Sou
th32
Ann
ual R
epor
t 20
2110
Op
erat
ing
and
Fin
anci
al R
evie
w

ConstructionSteel produced from manganese ore and
metallurgical coal is essential in construction. Modern steel supports energy efficiency solutions to enable
low-carbon operation of buildings. Aluminium is also key in construction
as it is lightweight, structurally strong and is resistant to corrosion. Zinc is
instrumental in protecting key elements of essential infrastructure from
corrosion.
Consumer goodsSilver is widely used in consumer electronics, including mobile phones and computer equipment. Aluminium can substitute single-use plastics for packaging, such as in the food and beverage industry and is also widely used in electronics. Nickel-containing stainless steel and aluminium have various applications in household items.
TransportThe use of aluminium instead of other
materials can reduce the carbon emissions of a vehicle given its relatively
light weight. Lead is a key material for the starter or auxiliary batteries in vehicles. Almost every electrical connection in a
vehicle uses silver and its intensity in electric vehicles is around two times
higher compared to vehicles with internal combustion engines.
Nickel-containing stainless steel is found in passenger
trains and subway systems.
EnergySilver is a key component for the production of solar photovoltaic cells, which have become the leading option in renewable energy. Lead batteries are the mainstay of storage technologies for renewable energy sources. Zinc is used to protect steel components of wind turbines from corrosion and exposure to harsh weather conditions. Nickel-containing materials are increasingly being used to generate, transmit and store power in modern battery polymers in renewable energy generation.
Our commodities in a low-carbon future
MineManganese ore and metallurgical coal are used to produce steel for construction of buildings and infrastructure. Manganese is also required for steel recycling. We are the world’s largest producer of manganese ore from our operations in Australia and South Africa.
We produce premium hard coking coal from Illawarra Metallurgical Coal in Australia and supply approximately two per cent of the seaborne market as well as the domestic steel industry.
Lead, silver and zinc from our Cannington mine have a range of applications. Approximately 65 per cent of global lead production is used in batteries. Silver is widely used in solar power and electronics and zinc protects steel from corrosion.
RefineAlumina is the key raw material used to produce primary aluminium. Worsley Alumina and Brazil Alumina mine and refine bauxite which is used to produce alumina. Approximately 60 per cent of the production from Worsley Alumina is shipped to our aluminium smelters in South Africa and Mozambique, with the remainder going into the seaborne market. Worsley Alumina is one of the world’s largest alumina refineries.
SmeltAluminium is often referred to as the metal of the future. It is lightweight, durable, strong, resistant to corrosion, and recyclable and it can conduct electricity, meaning it has a wide range of applications including construction, electrical wiring, transportation, packaging and consumer goods such as electronics and household items. Hillside Aluminium in South Africa is the largest aluminium smelter in the southern hemisphere.
Cerro Matoso mines nickel ore which is smelted in electric arc furnaces to produce ferronickel. The majority of ferronickel is used to make stainless steel for household items, surgical instruments and vehicle parts.
11S
outh32 Annual R
eport 2021
Op
erating and
Financial Review

Our strategy
We optimise our business by working safely, minimising our impact, consistently delivering stable and predictable performance, and continually improving our competitiveness.
OP
TIM
ISE We unlock the full
value of our business through our people, innovation, projects and technology.
UN
LOC
K
IDEN
TIF
Y
We identify and pursue opportunities to sustainably reshape our business for the future, and create enduring social, environmental and economic value.
A STRATEGY TO ACHIEVE OUR PURPOSE
At South32 we believe that, when done sustainably, the development of natural resources can change people’s lives for the better.
This is integral to our purpose – to make a difference by developing natural resources, improving people's lives now and for generations to come. We are trusted by our owners and partners to realise the potential of their resources.
Our purpose is underpinned by a simple yet powerful strategy:
12S
outh
32 A
nnua
l Rep
ort
2021
Op
erat
ing
and
Fin
anci
al R
evie
w

21%
36%
20%
17%
3% 3%
US$9.4ballocated
Our strategy outlines what we do to achieve our purpose and our values of Care, Trust, Togetherness and Excellence guide how we do it. Our values shape the way we behave and the standards we set for ourselves and others.
Capital allocation(Capital allocation since FY16)
We deliver on our purpose and strategy by aligning our workforce behind seven ‘breakthroughs’ – commitments which shape our business plans across South32, enabling us to focus on what’s important.
FY21 was a significant year for the company, as the divestment of South Africa Energy Coal (SAEC) had a transformational impact on the business. We have also continued to respond to the COVID-19 pandemic with our focus on keeping our people safe and well, maintaining safe and reliable operations, and supporting our communities.
Our approach to climate change is integrated with our strategy and is focused on decarbonising our existing business and adding growth options to increase our exposure to the base metals required in a low-carbon world.
Within 12 months of South32 being established, we committed to support the Paris Agreement and set a long-term goal of achieving net zero operational carbon emissions by 2050. This year we achieved our first short-term target of keeping our Scope 1 emissions below our FY15 baseline. In May 2021, we announced a new medium-term target to halve our operational carbon emissions (Scope 1 and 2) by 2035, compared to the FY21 baseline.
We are working towards our target considering the needs of all our stakeholders. This includes assessing the physical resilience of our operations to the impacts of climate change, investing in decarbonisation in line with our capital allocation framework and planning for a Just Transition where our people and communities may be affected by the changes needed for a low-carbon future. Our performance on climate change now forms part of our executive long-term incentive plans so remuneration outcomes reflect the achievement of significant milestones and long-term value protection and creation.
Our FY21 commitments and performance against those commitments, including our actions on climate change, reshaping our portfolio and our COVID-19 response, are summarised on the following pages.
Net cash to balance sheetCapital expenditure (including equity accounted investments)Ordinary dividends
Capital management program
Acquisitions
Greenfield exploration
Risk framework and corporate governance We are governed by robust risk management and corporate governance frameworks. For more information, see pages 24 to 33 for our Risk management section and our Corporate Governance Statement which can be found at www.south32.net.
Capital management frameworkOur capital allocation priorities are to maintain safe and reliable operations and an investment grade credit rating throughout the cycle. We intend to distribute a minimum 40 per cent of Underlying earnings as dividends to our shareholders following each six-month reporting period. We encourage internal competition for excess capital, which can include further investment in new projects, acquisitions, greenfield exploration, share buy-backs or special dividends.
After a suspension of the capital management program in FY20 due to COVID-19 related uncertainty, we recommenced our on-market share buy-back in October 2020. We returned US$670 million to our shareholders in respect of FY21 via ordinary dividends, a special dividend and our on-market share buy-back. The Board further expanded our capital management program to US$2 billion in August, leaving US$252 million to be returned by 2 September 2022.
Our values
CareWe care about people, the communities we’re a part of and the world we depend on.
TrustWe deliver on our commitments and rely on each other to do the right thing.
TogethernessWe value difference and we openly listen and share, knowing that together we are better.
ExcellenceWe are courageous and challenge ourselves to be the best in what matters.
13S
outh32 Annual R
eport 2021
Op
erating and
Financial Review

Working safely
Our FY21 commitments: – A 20 per cent reduction in Total Recordable Injury Frequency (TRIF) compared to FY20;
– A reported significant hazard frequency of "30"; and
– A 10 per cent reduction in material health exposures from adjusted baseline.
Progress during the year: We are deeply saddened by the death of our colleague, Mr Petros Sibeko, a contractor working at South Africa Energy Coal’s (SAEC) Klipspruit Extension Project, following an incident involving the use of an Elevated Work Platform (EWP) on 12 May 2021. We express our deepest sympathies to Mr Sibeko’s family and colleagues to whom we provided counselling and support. We completed an investigation into the incident and shared learnings across the company. Following this incident, we also commenced a global review of the safety features of EWPs and the way we use them in our operations and projects.
In FY20, we commenced our reporting practices to disclose fatalities for contractor activities associated with our operations that take place in locations where we do not have control. Sadly, one person from a contracting company appointed by Cerro Matoso was fatally injured while carrying out work to pave the public road between the municipality of Planeta Rica and our Queresas and Porvenir project. We offered our support to the contractor company following the incident.
Our TRIF increased to 4.3 despite a reduction in recordable injuries and four operations reporting their lowest TRIF to date. Our year-on-year performance did not meet our 20 per cent reduction target. Our TRIF was adversely impacted by a reduction in the total number of hours worked following the sale of SAEC and Tasmanian Electro Metallurgical Company (TEMCO) and a reduction in the workforce at Metalloys. To set our TRIF target for FY22, we have adjusted the baseline to account for the removal of SAEC and TEMCO from the portfolio which will mean we measure our FY22 performance against a TRIF of 6.0.
Proactive hazard reporting is key to our approach to safety, and we exceeded our target with a reported significant hazard frequency of "41". We also saw a reduction in near misses and actual significant impact events.
We achieved a reduction in the number of people exposed above the Occupational Exposure Limits (OEL) at South Africa Manganese and Hillside Aluminium, contributing to a six per cent overall reduction in potential material exposures greater than 100 per cent of the OEL. Unfortunately, planned exposure reduction measures at Mozal Aluminium were delayed due to COVID-19. Our occupational exposure data represents the workplace exposures determined through our hygiene monitoring program. Sampling was concluded in June 2021 and therefore excludes the divested SAEC and TEMCO operations.
Our response to the COVID-19 pandemic continued throughout FY21 and critical controls remain in place at all our operations, offices and projects, as we are still experiencing waves of coronavirus infections in some locations. We are actively engaged with governments and health authorities regarding their vaccine rollout plans and have offered our support, providing access to our facilities to store and deliver vaccines and opening vaccination centres at some of our operations. Read more about our response to COVID-19 in our Sustainable Development Report on page 12.
Progress against our strategy
OPTIMISE OUR BUSINESS
Total Recordable Illness Frequency (TRILF)
1.1
Total Recordable Injury Frequency (TRIF)
4.3
14S
outh
32 A
nnua
l Rep
ort
2021
Op
erat
ing
and
Fin
anci
al R
evie
w

Stable and predictable performance while minimising impact
Our FY21 commitments: – Production within 97-103 per cent of budget;
– Cost within US$50 million of FY21 budget;
– Capital expenditure within five per cent of capital budget and less than 20 per cent break-in projects;
– Achieve the emissions forecast of 24,649kt CO2-e (inclusive of Scope 1 and 2); and
– Implement community investment plans for each operation.
Progress during the year: In FY21, we achieved production at 101 per cent of budget (including SAEC until it was divested on 1 June 2021). Three operations – Worsley Alumina, Brazil Alumina and Australia Manganese – achieved record production. We also beat our initial production guidance at South Africa Manganese, Cerro Matoso and Cannington. For more information on our operating performance, see pages 44 to 53.
Costs were US$3 million above budget and we achieved 84 per cent of budget for sustaining capital and major capital. We had 18 per cent break-in projects compared to the sustaining capital plan at the start of FY21.
In FY21, our Scope 1 and 2 emissions were 21.6Mt CO2-e, a seven per cent reduction compared to FY20 with lower fugitive emissions from Illawarra Metallurgical Coal (IMC) as we realised higher rates of post-drainage gas capture efficiency, and curtailed production from SAEC and the manganese alloy smelters. We achieved our first short-term target of keeping our Scope 1 emissions below our FY15 baseline.
We completed a review of the water target for Hillside Aluminium to support the needs of the water catchment, including local communities. Mozal Aluminium and Worsley Alumina remained on track to meet their water targets.
During FY21, we invested US$22.2 million in community initiatives and activities, which includes US$2.5 million invested in our targeted COVID-19 Community Investment Fund in FY21, in addition to the US$5.1 million from FY20. The funds were used to support health and education, social and economic recovery, community resilience, vaccine roll-out and addressing the risk of gender-based violence. For more information on how we are supporting communities through the pandemic, see pages 20 to 23.
We concluded a comprehensive review of the way we manage Aboriginal and Torres Strait Islanders’ cultural heritage in Australia and led to the development of a set of principles to guide our engagements on this important topic. We plan to undertake similar reviews in other jurisdictions where we operate in FY22. We also rolled out cultural awareness and heritage training for employees across the company.
OPTIMISE OUR BUSINESS
FY21 community investment
US$22.2m
Scope 1 and 2 emissions (CO2-e)
21.6Mt
Production vs budget
101%
15S
outh32 Annual R
eport 2021
Op
erating and
Financial Review

Progress against our strategy continued
UNLOCK THE VALUE OF OUR BUSINESS
Our people are connected and engaged
Our FY21 commitments: – Meet our measurable objectives to increase the representation of employees and leaders who are women; and
– Meet our measurable objectives for representation of Black People in our South African workforce and leadership.
Progress during the year: This year, our performance either improved against or remained consistent for four of our seven diversity commitments(1).
Several changes, including the divestments of TEMCO and SAEC during the period have directly impacted the employee profile for a number of our metrics. The representation of women across the company decreased to 18 per cent, down from 19 per cent in FY20, while the representation of women on our Board and Lead Team was stable year-on-year. Representation of women on our Operational Leadership Team increased year-on-year, however there is more work to do to meet our target of 20 per cent. Thirty-seven per cent of all our new hires were women and we achieved gender-balanced recruitment into our development roles, with 44 per cent offered to women.
Representation of Black People in our workforce in South Africa improved in FY21, reaching 86 per cent and meeting our target, however representation of Black People in management roles declined three per cent to 52 per cent.
A global inclusion and diversity working group was formed to undertake a diagnostic review and assess actions to achieve an immediate and a longer-term improvement in our people’s experience of inclusion and diversity in the workplace, with an action plan being implemented in FY22. We became a signatory to 40:40 Vision, an investor-led initiative to achieve gender balance in executive leadership across all ASX200 companies by 2030.
We launched our global flexible work standard in December 2020, which supports our efforts to attract and retain diverse talent. We also launched our new leadership model, which sets out the core leadership accountabilities, competencies, and behaviours expected of all our people.
Due to the impact of COVID-19, our annual employee survey did not take place in FY21 but we will undertake more regular employee ‘pulse’ surveys in FY22. With limited opportunities for leadership to visit operations during the COVID-19 pandemic, we increased other engagement activities to support employees through this challenging time, including global calls that gave employees an opportunity to hear from and ask questions of our senior leaders in an open forum.
(1) Our inclusion and diversity performance has been measured in our scorecard from FY20. All scorecard metrics have consistently excluded the contribution of SAEC as this operation has been managed as a standalone business since the June 2019 quarter.
Technology and innovation unlock value
Our FY21 commitments: – Implement South32’s approach to innovation, improvement and technology;
– Implement technology enabler programs focused on adoption of critical technology across South32; and
– Implement cyber security improvements to reduce material risk across South32.
Progress during the year: In response to COVID-19, our technology and health teams collaborated to rapidly develop and deploy a fast and effective pre-shift screening tool, which is being used across our sites globally. The tool helps identify employees with potential COVID-19 risk factors, so they do not enter the workplace to carry out their shift – helping to keep our people and local communities safer. In 12 months, more than one million screening assessments were completed.
This year, we’ve made progress in advancing our Cyber Security Program to improve our cyber resilience. We defined and implemented a model to help embed best practice cyber security capabilities, including skills, governance, controls, and behaviours. We also deployed solutions to mature our capability and continued our ongoing work to build a cyber-aware culture throughout the company. We have reduced our cyber risks and consider our Cyber Security Program fit for purpose given our current risk profile.
Technology and innovation will be key enablers for mining in the transition to a low-carbon future. Our Innovate32 process has been designed to enable the assessment, development and deployment of low-carbon technologies for our existing operations and for the design of the carbon neutral Next Generation Mine, including at Hermosa.
In FY21 we became a founding member of the Electric Mine Consortium, which aims to accelerate progress towards a fully electrified zero carbon, zero particulates mine. Our participation in the Consortium helps us make informed decisions about technology options and readiness, while also accelerating the rate at which we learn, through direct and indirect trials.
We are also a founding member of the Heavy Industry Low-carbon Transition Cooperative Research Centre (HILT CRC) which brings together industry, education and government partners to fund research into technology driven solutions for a low-carbon industry transformation. The HILT CRC was recently awarded A$39 million from the Australian Government over ten years which is backed by an additional A$176 million of funding and in-kind support from industry, government and research institutions.
16S
outh
32 A
nnua
l Rep
ort
2021
Op
erat
ing
and
Fin
anci
al R
evie
w

UNLOCK THE VALUE OF OUR BUSINESS
Project execution
Our FY21 commitments: – Complete the pre-feasibility study (PFS) for the Taylor Deposit at Hermosa;
– Unlock the value in our portfolio by delivering on key projects across our operations; and
– Complete the feasibility study for Eagle Downs.
Progress during the year: Following work on the Taylor PFS through the year, we released an updated Mineral Resource estimate for the deposit in July 2021 which confirmed higher zinc, silver and lead grades, partially offsetting a reduction in tonnage. The Taylor Deposit PFS was scheduled for completion prior to the end of the June 2021 quarter but has been delayed given the impact of ongoing COVID-19 related workforce restrictions. Study work to date has confirmed a preference to pursue a dual shaft development that prioritises early access to higher grade ore, identified through our improved understanding of the updated Taylor Mineral Resource estimate(1). Preliminary outcomes of a scoping study for the Clark Deposit indicate the technical viability to produce battery grade manganese and we are advancing marketing studies to evaluate customer opportunities for these products.
The PFS at the Ambler Metals Joint Venture continued during FY21. Earlier this year, Ambler Metals entered into an agreement with the Alaska Industrial Development and Export Authority (AIDEA) to jointly fund pre-development activity for the Ambler Access Road after AIDEA received Federal permits. The road has potential to unlock the region and pre-development activities are underway.
We approved development of the Queresas and Porvenir project at Cerro Matoso, which is a high returning, low capital option that is expected to contribute to higher average ore grades over the next six years. We also approved the Ore Sorting and Mechanical Ore Concentration project at Cerro Matoso which is expected to maintain payable nickel production by offsetting natural grade decline beyond FY23.
In February 2021, the New South Wales Independent Planning Commission (IPC) refused the application for the Dendrobium Next Domain (DND) project at IMC. We have commenced proceedings to seek a judicial review of the IPC’s assessment and the State Legislative Council has supported a Private Members’ Bill requesting the Minister for Planning and Public Spaces make an order declaring any future development for the Dendrobium mine extension project be declared state significant infrastructure under New South Wales law. This would enable the Minister to determine the project upon the submission of an alternative mine plan by South32. We are assessing options for the broader IMC complex, including a revised DND mine plan, and expect to provide an update by the end of the 2021 calendar year.
Following completion of the Eagle Downs Metallurgical Coal feasibility study in the December 2020 quarter, we determined not to proceed with the project at this time. The study indicated the potential for a long-life operation, however the expected returns did not support the allocation of capital in accordance with our capital management framework. The project has been placed on hold while the partners assess options.
(1) For more information refer to the market announcement "Hermosa Project – Mineral Resource Estimate Update" dated 21 July 2021.
17S
outh32 Annual R
eport 2021
Op
erating and
Financial Review

Progress against our strategy continued
Create enduring social, environmental and economic value
Our FY21 commitments: – Define medium-term operational carbon emissions reduction target and glidepath;
– Progress decarbonisation studies and energy planning; and
– Implement our Community Investment Impact Measurement Framework.
Progress during the year: We have set a new medium-term target to halve our Scope 1 and 2 carbon emissions by 2035 from a FY21 baseline, and we have defined short-term activities to progress and broaden our decarbonisation studies.
At Worsley Alumina, our efficiency projects to reduce energy consumption are progressing through study phases. Mud-washing, the most advanced efficiency project, is in pre-feasibility study (PFS) and is on-track for completion in FY22. Transitioning the energy source from predominantly coal to lower carbon alternatives will be the most significant driver of emissions reduction and a PFS for conversion of the existing coal-fired boilers to natural gas is also on-track for completion in FY22. The shift from energy coal to natural gas is designed as an interim step until renewable energy options such as hydrogen or electrification are commercially viable at scale. We are working with government and industry to support the development of low-carbon energy markets in Western Australia.
Our key decarbonisation actions at IMC relate to increasing the efficiency of gas drainage and assessing technologies for reducing methane associated with ventilation. In partnership with Commonwealth Scientific and Industrial Research Organisation (CSIRO), we are supporting the development of ventilation air methane abatement technologies that aim to increase the effectiveness of methane capture at low concentrations. A trial of the technology is expected to be completed by March 2022, which will inform the technical capability of its potential deployment.
At Hillside Aluminium we are conducting a trial of the AP3XLE technology, currently being deployed at Mozal Aluminium, to increase energy efficiency. We are fast-tracking studies of ways to obtain affordable, low-carbon electricity for Hillside Aluminium. The initial outcomes suggest that renewable energy could be technically feasible. Work is ongoing, with PFS outcomes expected in mid-2022. While we complete these studies, we will engage with the South African Government, Eskom and other potential partners to identify options for new renewable energy infrastructure.
During FY21, our investments in community initiatives and activities were in line with our four strategic community investment priorities. We invested US$22.2 million with 32 per cent to support education and leadership; 41 per cent to support good health and social wellbeing; 20 per cent to widen economic participation; and seven per cent to strengthen natural resource resilience. We also introduced our Community Investment Impact Measurement Framework to improve how we measure the outputs and outcomes of our community investment.
We made good progress implementing our Innovate Reconciliation Action Plan following its launch in September 2020, including an increase in procurement of goods and services from Aboriginal and Torres Strait Islander businesses by 18 per cent year-on-year.
IDENTIFY OPPORTUNITIES
18S
outh
32 A
nnua
l Rep
ort
2021
Op
erat
ing
and
Fin
anci
al R
evie
w

Sustainably reshape our business for the future
Our FY21 commitments: – Complete divestment of SAEC; and
– Complete the review of our manganese alloy smelters.
Progress during the year: We completed the divestment of SAEC to Seriti Resources, and two trusts for the benefit of employees and communities, in June 2021. This is a transformative step for South32. We achieved our two-fold vision through the divestment, by positioning the business to be sustainable for the long-term, for the benefit of its employees, customers and local communities and transitioning it to become a Black-owned and operated business, consistent with South Africa’s transformation agenda.
We also completed the divestment of the TEMCO manganese alloy smelter in Australia, with an effective accounting date of 31 December 2020, and concluded a restructure of the workforce at Metalloys in July 2020 after the smelter was placed on care and maintenance during the 2020 financial year.
Taken together these actions substantially reduce our Scope 3 emissions and our capital intensity, increase group margins and provide greater balance sheet flexibility.
We also progressed our strategy of investing in exploration partnerships and our own portfolio of 100 per cent owned projects. We invested US$18 million during FY21 in early stage greenfield exploration opportunities. While COVID-19 restrictions persist across the majority of our exploration jurisdictions, critical controls permit continued activity globally with multiple programs underway in Australia, USA, Canada, Argentina, Peru and Ireland. We also directed US$39 million towards exploration programs at our existing operations and development options during FY21.
IDENTIFY OPPORTUNITIES
Invested in early stage greenfield exploration opportunities
US$18m
19S
outh32 Annual R
eport 2021
Op
erating and
Financial Review

Our contribution
MAKING A DIFFERENCE NOW AND FOR GENERATIONS TO COMEWe’re committed to creating value through environmental and social leadership. We work hard to be responsible stewards of the environment and treat natural resources with care so that they are available for future generations. We care about the people and groups who are interested in what we do and want to have a say, or who are impacted by our operations.
20S
outh
32 A
nnua
l Rep
ort
2021
Op
erat
ing
and
Fin
anci
al R
evie
w

At South32 we believe that, when done sustainably, the development of natural resources can change people’s lives for the better. From supporting our communities through COVID-19, to providing jobs and business opportunities, contributing to governments through paying taxes and royalties, developing local suppliers and supporting community programs we can make a significant contribution to the way people live and work.
Supporting our diverse communitiesThere is socio-economic diversity across the communities, regions and countries where we work.
We understand the value of creating opportunities in our communities. We want our communities to benefit from our presence, providing employment and business opportunities, supporting community programs, empowering suppliers and supporting the South African Government’s transformation objectives.
Governance and transparencyIn line with our Code of Business Conduct, we are committed to the highest standards of integrity and accountability and conduct our business in a way that respects human rights.
This includes transparency in how community investment is allocated, supporting sound governance of partner organisations, sourcing responsibly, and encouraging capacity building so resources reach those who need it most.
Read more about our Code of Business Conduct at www.south32.net and our approach to human rights
in our Sustainable Development Report
Indigenous and Tribal Peoples cultural heritage We respect the unique cultural and spiritual relationships that Indigenous and Tribal Peoples have to the land, waters and seas, and their rich contribution to society and we are committed to working together to build lasting, meaningful relationships for the benefit of all.
Many of our operations and projects intersect areas of cultural significance and we understand we have a critical role to play in preserving cultural heritage. Guided by our values of care, trust, togetherness and excellence we continually work to strengthen and enhance our approach to preserving cultural heritage.
Read more about our approach to Indigenous and Tribal Peoples cultural heritage at www.south32.net
Building relationships based on trustDelivering on our commitments and being a trusted partner is essential to the way we operate.
We believe trust and transparency are essential to the way we operate. That means being in touch with the broader community – considering different perspectives and working together to create shared value. We manage our impacts and create enduring social, environmental and economic value in our communities by developing tailored community investment and stakeholder engagement plans based on research and engagement. We address community concerns through local complaints and grievance processes.
Read more about our work with communities at www.south32.net
21S
outh32 Annual R
eport 2021
Op
erating and
Financial Review

Our community investment in FY21(1)
US$22.2m
Our contribution continued
Education and leadership
Economic participation
Good health and social wellbeing
(1) Community investment consists of direct investment, in-kind support and administrative costs and includes US$1.3 million in community investment made through our corporate functions, US$19.9 million in community investment made through operations (see pages 44 to 53 for further information) and US$1.0 million in community investment made through Hermosa.
Investing in what matters most
In FY21, we implemented our Community Investment Impact Measurement Framework to measure the outputs and outcomes of our community investment and allow us to understand how projects are contributing to desired outcomes. It has also become a monitoring tool to make program adjustments, upscale or replicate successful initiatives, and overall improve our investment approach.
We are proud of our community investment programs, designed in collaboration with our communities and stakeholders to reflect their priorities.
Economic opportunity and participation ensure that local and regional economies are resilient now and sustainable into the future.
20%directed towards projects that support local employment, sustainable livelihoods and diversified local economies.
US$100,000in COVID-19 relief grants were provided to locally owned and operated small businesses and non-profit organisations near our Hermosa project, helping them to continue to operate and retain their workforce.
5 times more income was earned by farmers near our Mozal operation in Mozambique in FY21, when compared to 2018. This was made possible by their participation in our AGROMOZAL program.
Health and social wellbeing are integral to sustainable development and contribute to vibrant communities.
41%directed towards projects that support community health and social wellbeing and promote inclusion.
R2 millionwas invested with the Gender Based Violence and Femicide Response Fund1, who are working to raise awareness and inspire change, to address gender-based violence and femicide in South Africa.
62Hispanic and Latino women at Hermosa engaged in a mental health support group, with members reporting an improvement in resiliency outcomes.
Quality education is the foundation of economic and social prosperity and supports the development of emerging and future community leaders.
32%directed towards projects that support learning and development, nurture future leaders and promote equal access to education.
10emerging Indigenous leaders are taking part in the Anindilyakwa Future Leaders Program on Groote Eylandt helping them to gain leadership and governance qualifications and pursue meaningful careers in their communities.
450students participated in the Star Schools program, supported by Hotazel Manganese Mines. The program is designed to improve education outcomes for high school students.
22S
outh
32 A
nnua
l Rep
ort
2021
Op
erat
ing
and
Fin
anci
al R
evie
w

Natural resource resilience
US$7.6m invested to support our communities through COVID-19.
We have been working closely with our communities through the COVID-19 pandemic to identify and address health and economic risks. In FY20 we set up our COVID-19 Community Investment Fund and invested US$5.1 million to aid our local communities in COVID-19 prevention, preparedness, response and recovery. In FY21 we invested an additional US$2.5 million to support health and education, social and economic recovery, community resilience, vaccine roll out and the societal response to combat gender-based violence. The support we have provided includes medical equipment, personal protective equipment and improved water supply to health facilities, financial relief to small businesses, funding for food parcels and water distribution, and setting up mobile classrooms and providing mental health support for teachers and school staff.
Read more about our response to COVID-19 in our Sustainable Development Report
on page 12
Communities that live in balance with their natural environments are resilient and sustainable.
7%directed towards projects that support communities to thrive within their environments and use natural resources in responsible and sustainable ways.
22,000hectares of land at our Cannington operation has been treated to reduce, eradicate and prevent weeds. This contributed to biodiversity conservation and protection, as well as improved economic wellbeing and increased capacity of local landholders.
882households located near our African operations have received improved access to water and sanitation services.
23S
outh32 Annual R
eport 2021
Op
erating and
Financial Review

Risk management
Our approach to risk management is governed by our risk management framework, which has been in place since the Demerger of South32 from BHP in 2015. The minimum mandatory requirements for the management of risks that have a material impact on our purpose, strategy and business plans are defined in our material risk management standard.
The framework and the standard are delivered through our System of Risk Management which is aligned to the principles of the International Standard for Risk Management AS/NZS ISO 31000:2018. This approach applies to all employees, Directors and contractors of the company and its subsidiaries. Our risks are regularly assessed and managed at both a company-wide strategic level and at a material tactical level for operations, functions and projects.
Material risksOur System of Risk Management and assurance processes are based on the three lines model, which describes how key organisational roles work together to facilitate strong risk management and assurance. This approach is used to manage our material risks and enables us to:
– Provide stable and consistent processes, tools and routines to identify and regularly assess the most impactful risk and opportunities;
– Ensure predictable outcomes and prevent unforeseen events with material impacts;
– Ensure risks are well understood and managed at all levels of the organisation; and
– Eliminate risks where appropriate or improve our processes using a risk-based approach.
Risks assessed as material are routinely reported to the South32 Lead Team and reviewed by the Risk and Audit Committee as well as the Sustainability Committee; assisting the Board to carry out its role in overseeing our risk management and assurance practices.
Risk management is fundamental to maximising the value of our business and informing its strategic direction. Effective risk management enables us to identify priorities, allocate resources, demonstrate due diligence in discharging legal and regulatory obligations, and meet the standards and expectations of our stakeholders.
We report transparent real-time risk data through our risk management tool, Global360. This software connects data relating to the management of our risks, events, hazards and assurance actions. Aside from helping us manage our operations and functions, reliable data on material risks contributes towards the monitoring and management of our strategic risks. This provides insight into trends and emerging themes that can trigger a review of our business plans or inform a change in strategic direction.
Strategic risksOur strategic risks are risks which can affect our ability to achieve our strategic objectives. They have the capacity to affect the whole, or a significant part of our organisation and therefore tend to have significant impacts, both negative and positive. With that in mind, our strategic risks and associated management responses are evaluated every year. The review process is informed by external and internal events that could have a potential impact on our organisation, as well as emerging themes across our material risks. In FY21, we identified 12 strategic risks which could influence our plans and the sustainability of our business.
MANAGING OUR RISKS TO PROTECT OUR PEOPLE AND MAXIMISE VALUE
24S
outh
32 A
nnua
l Rep
ort
2021
Op
erat
ing
and
Fin
anci
al R
evie
w

Climate change
Climate change and the response of South32, our markets and broader society to it, poses a risk to both our portfolio (i.e. demand for our commodities, costs and profit margins, social licence, regulatory exposure) and to our physical assets, infrastructure, supply chains and people.
We regularly assess these dynamic risks through a framework that includes policy, market and physical factors, and use climate change scenarios to stress test these risks and opportunities against our portfolio, operations and communities.
Risk exposure trend 2021
↑Mapping to strategic objectives(1)
– Stable and predictable performance while minimising impact
– Create enduring social, environmental and economic value
– Technology and innovation deliver value
– Sustainably reshape our business for the future
OpportunitiesAligning our business strategy, including how we operate and what we produce, with stakeholder expectations, future technologies and evolving climate policy and regulation, ensures our portfolio sustains a favourable outlook in a low-carbon future as we shift towards base metals.
Identifying and implementing energy efficiency projects to reduce our emissions, has the potential to deliver financial and other environmental benefits through reduced operating costs (e.g. less purchased electricity) and related inputs (e.g. reduced water consumption).
ThreatsIf we do not manage our portfolio to be resilient to changing commodity demands, climate policies (including greenhouse gas emission restrictions, pricing, taxation and trade regulations) and developments in technology (including energy sources and commodity substitution), nor reduce our emissions in line with the goals of the Paris Agreement, our reputation and social licence will be negatively impacted, our costs may increase, profit margins decrease, and demand for our products may reduce. This may result in ‘stranded asset exposures’ in relation to emissions-intensive commodities and our associated assets.
Similarly, failure to build the resilience of our business and operations to the physical impacts of climate change (including both the increase in the frequency and intensity of extreme weather events, and gradual onset impacts such as increases in average temperatures and changing precipitation patterns) could negatively impact the health and safety of our people, our supply chains, communities, access to key operational inputs (e.g. water), business continuity and distribution to market, while incurring additional costs to maintain, adapt, repair or replace our assets and infrastructure.
Failure to manage the above risks may increase our legal exposures, while limiting our ability to access capital and insurances, retain and attract employees and grow our business in existing and new jurisdictions.
Climate change may also impact our ability to secure development approvals, permits or licences, or their extension.
Refer to related risks of ‘Portfolio reshaping’, ‘Major events or natural catastrophes’ and ‘Security of supply of logistics chains, and critical goods and services’.
Our response includes: – We are actively shifting our portfolio towards those commodities
that will be required in a low-carbon future (with a bias to base metals);
– We support the objectives of the Paris Agreement and have set a medium-term operational carbon emissions reduction target of 50 per cent by 2035, and a goal of net zero carbon emissions by 2050;
– We seek to understand and stress-test our portfolio performance in a range of future climate scenarios (inclusive of a 1.5°C aligned scenario in FY21), considering both opportunities and threats, to inform our business strategy;
– We use climate modelling data to inform us of the level of risk to our operations and operational plans and identify controls in the short-, medium- and long-term to address these risks;
– We engage regularly with investors, governments, industry partners, membership-based sustainability organisations, Environmental Social Governance (ESG) proxy advisors and ESG activist groups to identify and monitor emerging climate risks, opportunities and trends;
– The achievement of our emissions reduction targets is linked to remuneration;
– We invest in research and development, both directly and through partnerships, to develop technology and innovative solutions necessary for the transition to a low-carbon future;
– We develop and implement energy efficiency, carbon abatement and renewable and low carbon energy projects to reduce our operational emissions; and
– We’re transparent in our disclosure of climate change-related opportunities and threats in our annual reporting, in accordance with the recommendations of the Task Force on Climate-related Financial Disclosures. Further detail on this risk and its management is detailed in our Sustainable Development Report.
(1) As referenced in the Progress against our strategy section on pages 14 to 19.
25S
outh32 Annual R
eport 2021
Op
erating and
Financial Review

Risk management continued
Actions by government, tax authorities and political risks
Changes in legislation, regulation and policy have the potential to impact our strategic objectives and the way we work. This includes broader policy decisions and regulatory changes, related but not limited to, changes to royalty and taxation policy, nationalisation of mineral resources, renegotiation or nullification of contracts, leases, permits or agreements, and environmental and social performance requirements.
We aim to effectively manage this uncertainty through engagement with key stakeholders and industry associations, monitoring of political activity, policy, legislative and regulatory changes, and by ensuring we have access to specialised knowledge.
Risk exposure trend 2021
↑Mapping to strategic objectives
– Stable and predictable performance while minimising impact
– World class project execution
– Sustainably reshape our business for the future
– Create enduring social, environmental and economic value
OpportunitiesProactive engagement leading to strong relationships with governments provides a mutual understanding of drivers for decision-making. This increases clarity around policy and regulatory environments, enables appropriate and tailored responses to issues, and provides investment certainty.
ThreatsLegislation adverse to our business and regulatory or policy decisions taken by governments can result in operational disruption, affect future planning or lead to cessation of operations or non-investment in operations or projects.
Our response includes: – We have specialised knowledge through in-house expertise
or the use of external experts, including tax management capability, tax advice and external affairs advice;
– We monitor political activity, policy, legislative and regulatory changes in the jurisdictions we operate in, and we also engage with relevant authorities;
– We engage with key stakeholders in all jurisdictions where we operate, in accordance with our Stakeholder Engagement Plans;
– We work through selected industry associations to influence how the industry is positioned; and
– We produce an annual Tax Transparency and Payments to Governments Report, which shows how we meet our regulatory tax obligations.
Ensuring that our people go home safe and well
A safe and healthy working environment is fundamental to living our values.
Risk exposure trend 2021
←→Mapping to strategic objectives
– Working safely
OpportunitiesEnsuring that our people go home safe and well drives the culture we aspire to and sets our expectations of each other.
ThreatsThe impact of not having a safe working environment can be devastating for our employees, contractors and communities. It can alter lives, impact shareholder returns, stakeholder confidence and ultimately our licence to operate.
Our response includes: – In everything we do, we focus on the health and safety of our
people, contractors and communities;
– We have a system of risk management, comprehensive internal health and safety policies, standards and systems with associated performance requirements designed to prevent and mitigate potential exposure to health and safety risks;
– We engage, develop and train our people so that our work is well designed and executed;
– We investigate actual and potential significant events, ensure controls are in place, and share our learnings across the organisation;
– We continuously improve our work environment to make it safer, healthier and more productive for our people; and
– We have an independent assurance function, following the three lines model, that reviews our material risks and the associated controls, to test how effective they are.
26S
outh
32 A
nnua
l Rep
ort
2021
Op
erat
ing
and
Fin
anci
al R
evie
w
Global economic uncertainty and liquidity
Our aim is to manage uncertainty related to changing macroeconomic conditions. We do the same when it comes to the volatility in commodity, currency and capital markets, given the impact they can have on our earnings, balance sheet and ability to pursue our strategy.
Risk exposure trend 2021
←→Mapping to strategic objectives
– Sustainably reshape our business for the future
– Create enduring social, environmental and economic value
OpportunitiesWe prioritise an investment grade credit rating and a disciplined approach to allocating capital, which keeps our balance sheet strong, providing us with financial flexibility regardless of market conditions. By creating competition for capital and investing selectively in our existing operations and growth options, external opportunities, or by making returns to shareholders, we aim to maximise total shareholder returns over time.
ThreatsA significant or sharp deterioration in economic conditions can adversely impact market demand, commodity prices, and/or exchange rates which has the potential to significantly reduce profitability, cash flow and returns to shareholders. A reduction in liquidity available in capital markets has the potential to impact our balance sheet and ability to pursue our strategy.
Our response includes: – We have a diverse portfolio of operations, commodities and end
markets which strengthens our resilience to the disruption of any one commodity, geography or operation;
– We prioritise a strong balance sheet and an investment grade credit rating, so that we remain in control through economic cycles;
– We test our financial strength across a range of scenarios, including a depressed demand and pricing environment. We also maintain a minimum liquidity buffer;
– We adjust our capital allocation plans according to market conditions;
– We maintain strong relationships with high-quality customers and suppliers from all around the world;
– We mostly sell our products with reference to floating, market-based prices, which are broadly correlated with floating global currency markets and the input costs we’re exposed to; and
– We carry out an annual review of commodity prices and exchange rates, which we use to inform our operational plans. This process is supplemented by tri-annual updates.
Portfolio reshaping
Our objective is to outperform by offering our shareholders exposure to high-quality operations in commodities with a strong and sustainable outlook, in jurisdictions where we believe we can operate – in line with our values.
Risk exposure trend 2021
↑Mapping to strategic objectives
– World class project execution
– Sustainably reshape our business for the future
OpportunitiesWe invest for value in our preferred commodities and jurisdictions. We do this by progressing our internal development options, by acquiring exploration opportunities, development projects or existing operations and by divesting non-preferred exposures that we believe will not generate an acceptable shareholder return.
ThreatsIf we don’t invest in a disciplined way, execute projects to budget and plan or divest non-preferred exposures for value, we could reduce shareholder returns. Climate change, and the transition to a low-carbon economy, may present both risks and opportunities for our portfolio commodity composition. This is discussed under 'Climate change' on page 25.
Our response includes: – Our strategy informs the decisions we make about portfolio
composition. We formally evaluate our strategic positioning annually with the Board and provide updates throughout the year;
– We have a dedicated greenfields exploration team focused on building a pipeline of low-cost, high-quality resource development options;
– We maintain a life of operations planning process. By evaluating the embedded options in our operations, we can progress with selected organic options at the right time;
– We apply a rigorous project development process and have experienced and dedicated project execution capability;
– We follow strong due diligence processes for acquisitions and new business ventures;
– We carry out an annual review of commodity prices and exchange rates, to develop long-term views for our portfolio commodities and foreign exchange rates for the jurisdictions where we operate;
– We apply a standardised valuation methodology with consistent key macroeconomic assumptions;
– We have a mature and independent peer review process, which we rigorously follow to inform key investment decisions; and
– We actively manage portfolio change with dedicated specialists to deliver integration and separation benefits.
27S
outh32 Annual R
eport 2021
Op
erating and
Financial Review

Risk management continued
Major events or natural catastrophes
Our operations and logistics networks can be disrupted by events such as pandemics, natural disasters, extreme weather events and major process or infrastructure failures.
Risk exposure trend 2021
↑Mapping to strategic objectives
– Working safely
– Stable and predictable performance while minimising impact
OpportunitiesAchieving stable and predictable performance enhances the value proposition to our shareholders, other stakeholders and the communities in which we operate. The better we prepare for and learn from events, the better we are placed to respond and reduce the impact of future events – strengthening our organisational resilience.
ThreatsFailure to manage major events or natural catastrophes could result in a significant event or other long-term damage that could harm the company’s financial performance and licence to operate. The role of climate change in increasing the frequency and severity of natural catastrophes is addressed under 'Climate change’ on page 25.
Our response includes: – When facing potential catastrophes, we put safety and wellbeing
at the heart of everything we do;
– We use a system of risk management in design, construction and operation phases, to analyse risks, and design and implement plans that prevent or limit business impacts;
– We utilise climate modelling data to inform our long-term plans and project pipelines, and conduct risk assessments of the physical impacts of climate change for our assets;
– We have business continuity and disaster response plans in place with trigger action response scenarios. We’ve tested these to make sure we can respond rapidly to major events and safely restore our operations, protecting the health and safety of people and the communities in which we operate;
– We have assurance functions independent of our operating activities, in line with the three lines model, that provide assurance against our own comprehensive internal standards including equipment integrity, tailings dam management and technical stewardship. Where relevant, we work with external experts, relevant industry bodies and technology suppliers, to provide additional assurance and input; and
– We purchase insurance coverage against many, but not all, potential losses or liabilities arising from major events or natural catastrophes. This coverage has a deductible cost to the company and limits that mean full financial coverage cannot be achieved.
28S
outh
32 A
nnua
l Rep
ort
2021
Op
erat
ing
and
Fin
anci
al R
evie
w

Predictable operational performance
Loss of predictable operational performance will prevent us from reliably delivering on our strategic objectives. We build resilience and predictability into our business by sustaining our ability to keep our people safe and well, meeting our regulatory and social obligations, managing cost inflation and consistently providing quality products to our customers.
Risk exposure trend 2021
↑Mapping to strategic objectives
– Working safely
– Stable and predictable performance while minimising impact
OpportunitiesWe mature our Operating System to control and continuously improve our operations and processes, delivering stable and predictable performance and unlocking the full value of our business. We invest in our operations to sustain and improve production capacity that generates reliable cash flow to deliver on our strategic objectives.
ThreatsIf we can’t safely and consistently achieve our production, cash flow or profitability targets, it could negatively impact our ability to deliver on our strategic objectives and negatively impact shareholder returns.
Our response includes: – We have embedded, and continuously verify and improve our
safety and risk management systems across our business (including our pandemic response);
– We have an effective Asset Management system in place at each operation and review our asset health, asset integrity and capital investments on a regular basis;
– We actively verify, and improve, the effectiveness of our Operating System by embedding best operating practices including operational planning, work design and standards, process control and improvement practices;
– We actively manage risks to our resource and reserve, mine and operational planning including reconciliation of Mineral Resources and Ore Reserves to production, plan and spatial compliance and management of geotechnical risks;
– We manage an integrated system of long- and short-term planning and scheduling processes that considers environmental, social and governance (ESG) themes and optimises the value from our resources;
– We actively manage product delivery and supply chain risks including effective sales and operational planning processes, monitoring of raw material supply, and management of target inventory operating windows; and
– We carry out rigorous quality assurance programs over our products and operations.
29S
outh32 Annual R
eport 2021
Op
erating and
Financial Review

Risk management continued
Shaping our culture and managing diverse talent
To deliver our strategic objectives, we must actively shape our culture to attract, leverage and retain our diverse talent. Culture and talent are fundamental aspects of an empowered workforce that delivers predictable operational performance and continuous improvement.
Risk exposure trend 2021
↑Mapping to strategic objectives
– Our people are connected and engaged
OpportunitiesBy fostering an environment that is conducive to our aspired culture, we will have even higher levels of employee engagement and teams that are empowered to innovate and drive performance.
By having an inclusive and diverse workplace, in every aspect, we can improve our ability to attract and retain talent, and better deliver safety and operational performance, together.
Our flexible work practices and global operating model provides greater access to talent which can be positioned across the company to better meet business challenges and capture opportunities.
ThreatsIf we are unable to embed our preferred culture, we will likely have lower levels of engagement, disconnected teams that lack diversity and operate in silos, and relationship rather than performance-based decision making. Over time, this would likely constrain innovative thinking and may lead to significant shareholder value erosion and reputational damage.
A stimulus related recovery in commodity markets has seen competition for talent rise and voluntary turnover rates increase, whilst COVID-19 has restricted travel and limited face-to-face interaction between our key leaders and geographically disperse talent pool.
Our response includes: – Our Board and Lead Team actively measure and discuss culture
using a Culture Tensions framing model. This process acts as a health check and allows us to assess positive or negative change, and test whether we are making progress towards our preferred culture that better balances relationships with performance, and systems and processes with innovation and empowerment. This process is supplemented by periodic employee 'pulse' surveys that measure employee engagement and test whether our culture is enabling the delivery of our strategic objectives;
– We have an Inclusion and Diversity Policy and Framework which sets out our commitments, strategy, measurable objectives and approach to performance reporting;
– We have a Code of Business Conduct which sets out our expected standards of conduct, with formal training and assessment routines in place. Anyone can report a business conduct concern, anonymously if preferred, or by using our confidential and independently administered EthicsPoint reporting hotline;
– We have a new leadership model which strengthens alignment to our preferred culture and behaviours, and is integrated across our people systems and processes;
– We design our reward elements to position ourselves relative to the market, enabling us to attract appropriate skills and experience, engage employees and drive performance;
– We have a Performance and Goals Process which supports our reward philosophy and ensures that aligned leadership behaviours and performance are recognised and rewarded;
– We routinely review our talent, creating individualised plans to further their development;
– We support employees who undertake further education and training related to their current or future career with South32;
– We utilise secondments to support the delivery of business objectives while also providing employees with development opportunities and exposure to other roles or areas of the business; and
– We have an internal Flexible Work Standard which empowers our leaders to engage with their teams to determine the ways of working that balance individual, team and business requirements.
30S
outh
32 A
nnua
l Rep
ort
2021
Op
erat
ing
and
Fin
anci
al R
evie
w

Maintain competitiveness through innovation and technology
Technology and innovation are advancing at a rapid pace. Companies which are unable to effectively leverage technology and innovation will find themselves failing to deliver against shareholder expectations on returns, unable to attract and retain talent, or in the example of decarbonisation, failing to maintain a licence to operate.
Risk exposure trend 2021
↑Mapping to strategic objectives
– Technology and innovation deliver value
– Create enduring social, environmental and economic value
OpportunitiesTo stay competitive, we position our organisation to effectively identify, develop and adopt sustainable business models for technology and innovation in our operations and projects. Priority innovation opportunities for South32 are identified and delivered through Innovate32, our strategy-aligned, value-focused, innovation portfolio. This approach will enable us to deliver on shareholder return expectations and position us for future business opportunities.
ThreatsFailure to keep pace with, and leverage advances in technology and innovation could result in reduced shareholder returns and impact our licence to operate.
Cyber security incidents could pose multiple risks including disruption to new projects and operations, theft, disclosure or corruption of information.
Failure to adopt automation, electrification and digital systems could result in deteriorating performance across safety, productivity, returns and carbon emissions.
Our response includes: – We have a clearly defined approach to innovation, improvement
and technology;
– We have organised to deliver specific programs focused on adoption and improvement of critical technology capabilities across multiple time horizons including cyber security, connectivity, underground mine automation and decarbonisation;
– We have a value-based ‘portfolio’ approach to testing and scaling up innovation across the company;
– We have rigorous internal technology standards and processes (technology ‘ways of working’);
– We benchmark our digital technology performance against industry best practice and have organised the coordination and integration of technology advances into South32’s growth portfolio;
– We actively manage cyber security and data centre risks through a system of risk management and have increased our cyber security controls in response to COVID-19 and an increase in remote working; and
– We monitor internal customer satisfaction and manage customer support.
31S
outh32 Annual R
eport 2021
Op
erating and
Financial Review

Risk management continued
Maintain, realise or enhance the value of our Mineral Resources and Ore Reserves
We intend to realise the potential of the resources and reserves we are entrusted to develop. We work to continually optimise our operations through sound technical and economic understanding of our resources and reserves.
Risk exposure trend 2021
←→Mapping to strategic objectives
– Stable and predictable performance while minimising impact
– World class project execution
– Create enduring social, environmental and economic value
OpportunitiesWe continue to enhance our understanding of our resources and reserves. We leverage this enhanced understanding through the annual planning cycle to define and assess additional opportunities to add value to our business.
ThreatsIf we fail to continually optimise our operations and projects, it will have a significant impact on shareholder returns, the benefits our stakeholders receive and ultimately, the sustainability of the company.
Our response includes: – We report Mineral Resources and Ore Reserves (including Coal
Resources and Coal Reserves) in accordance with the JORC Code as required in Chapter 5 of the ASX Listing Rules;
– We apply an annual planning process, that considers the impact of climate change on our Ore Reserves, structured to maximise value throughout the life of our operations;
– We have capital prioritisation, capital allocation and planning processes which prioritise the highest-value options across our portfolio;
– We apply a rigorous project development process that includes independent peer review of project risks and approval tollgates; and
– We have an internal closure standard which requires that our full-life of operations value incorporates closure and rehabilitation liabilities.
Security of supply of logistics chains, and critical goods and services
Together with our customers and suppliers we manage our inbound and outbound supply chains. Critical goods and services include raw materials, energy, water, gas, heavy mobile equipment, tyres, technology, corporate services and logistics (which includes road, rail, air and shipping).
Risk exposure trend 2021
↑Mapping to strategic objectives
– Stable and predictable performance while minimising impact
– Create enduring social, environmental and economic value
OpportunitiesOptimal and sustainable management of supply chain risk positions our business to operate safely and reliably, at the lowest possible cost and in a manner that meets or exceeds societal expectations.
ThreatsThe disruption of our supply chains could materially impact our operations by affecting production, operating costs and damaging our reputation.
The impact of a global pandemic and geopolitical tension are more difficult to manage and have the potential to significantly disrupt trade flows.
Failure to meet minimum ethical supply chain standards has the potential to damage our social licence to operate (this is further addressed under ‘Evolving societal expectations’ on page 33).
Climate change has the potential to increase the frequency and severity of extreme weather events which may threaten our supply chains, particularly logistics and the availability of critical goods and services (this is addressed under 'Climate change’ on page 25).
Our response includes: – We understand, assess and continually monitor the risks in
our supply chains through embedded routines and processes. This extends to the risks associated with the supply of critical goods and services; materials with potential shortage risk; critical suppliers and categories; vendor liquidity; and outbound logistics providers. Internal and external data is integrated so we have an accurate understanding of existing and emerging risks;
– We use this understanding of risk to deploy controls to support predictable operations. This includes working closely with our vendors and operations to better match availability with demand; developing alternative sources of supply; optimising inventory levels; flexing commercial terms and adjusting our business continuity plans;
– We build strong strategic partnerships with key in and outbound supply chain partners on a long-term, mutually beneficial basis;
– We have a clearly defined transformation strategy and enterprise and supplier development programs in South Africa aimed at building and growing small and medium enterprises;
– We have Reconciliation Action Plan targets to develop and support Aboriginal and Torres Strait Islander enterprises in Australia;
– We have local procurement initiatives designed to increase opportunities for local suppliers;
– We actively review and manage payment terms to support small and local businesses in all jurisdictions in which we operate; and
– We understand the risk of modern slavery in our supply chains and have processes in place to manage this risk.
32S
outh
32 A
nnua
l Rep
ort
2021
Op
erat
ing
and
Fin
anci
al R
evie
w

Evolving societal expectations
The expectations of resource companies by employees, government, investors, lenders, host communities, non-governmental organisations (NGOs) and broader society continue to evolve. Our stakeholders may have divergent views and wants.
We actively engage our stakeholders to understand and respond to their views and identify ways we can create enduring social, environmental and economic value.
We aim to effectively manage this through regular stakeholder engagement and external monitoring on a wide range of financial and ESG issues (including climate change).
Risk exposure trend 2021
↑Mapping to strategic objectives
– Stable and predictable performance while minimising impact
– Create enduring social, environmental and economic value
OpportunitiesProactive, collaborative and transparent engagement with our stakeholders builds relationships based on trust and shared understanding. Our ongoing licence to operate is built on our contribution to our stakeholders and broader society.
ThreatsFailure to meet evolving societal expectations for ESG performance could damage our reputation and negatively impact our licence to operate, limiting our ability to access capital, retain and attract employees and grow our business in existing and new jurisdictions.
Our response includes: – Our purpose and strategy expressly balance economic
outcomes with social and environmental outcomes, now and into the future. In the decisions we take, we look to minimise impact, respect human rights and create enduring social, environmental and economic value for all our stakeholders;
– We undertake internal and external stakeholder analysis and engagement on a wide range of financial and ESG issues, including an annual materiality analysis to understand our material ESG issues. Our approach is aligned with the International Council on Mining and Metals (ICMM) Mining Principles, The United Nations Global Compact Ten Principles and Global Reporting Initiative Sustainability Reporting Standards;
– We work to build strong, positive and meaningful relationships with local communities, and we listen to their views. We regularly complete and review community perception surveys, human rights impact assessments, social baseline studies and impact and opportunity assessments;
– We review and amend our community investment program annually to align with community and stakeholder priorities. We measure the outputs and outcomes of our community investments to ensure they are having the desired impact;
– We engage with Indigenous and Tribal Peoples across our operations to ensure we understand our commitments to manage cultural areas of significance. Our engagement with Indigenous and Tribal Peoples throughout the life of our operations is sensitive to and respects cultural protocols;
– We participate in sustainability reporting transparency initiatives and ESG rating agencies reviews that assess and score our performance; and
– We transparently report on our risks, opportunities, regulatory obligations, commitments and areas where we’re working that are relevant to our stakeholders.
33S
outh32 Annual R
eport 2021
Op
erating and
Financial Review

Financial and operational performance summary
DELIVERING STRONG OPERATING RESULTS IN CHALLENGING TIMESWe set production records at three operations, progressed our portfolio transformation and increased returns to our shareholders.
The Group uses both International Financial Reporting Standards (IFRS) and non-IFRS financial measures such as underlying measures of earnings, effective tax rate (ETR), return on invested capital (ROIC), cash flow and net cash, to assess the Group’s performance. The Directors believe that the non-IFRS measures are important when assessing the underlying financial and operating performance of the Group and its operations. The meanings of individual non-IFRS measures used in this report are set out in the Glossary on page 164.
Underlying earnings, Underlying earnings before interest and tax (EBIT) and Underlying earnings before interest, tax, depreciation and amortisation (EBITDA) are included on page 102 in note 4 to the financial statements. We believe that Underlying earnings, Underlying EBIT and Underlying EBITDA provide useful information, but should not be considered as an indication of, or an alternative to, profit/(loss) after tax as an indicator of actual operating performance or as an alternative to cash flow as a measure of liquidity.
In discussing the operating results of the Group, the focus is on Underlying earnings and ROIC. Underlying earnings is the key measure that is used by the Group to assess its performance, make decisions on the allocation of resources and assess senior management’s performance.
In addition, the performance of each of the Group’s operations and operational management is assessed based on Underlying EBIT. Management uses this measure because financing structures and tax regimes differ across the Group’s operations and substantial components of tax and interest charges are levied at a Group level rather than an operational level.
In order to calculate Underlying earnings, Underlying EBIT and Underlying EBITDA, the following items are adjusted as applicable each period, irrespective of materiality:
– Exchange rate (gains)/losses on restatement of monetary items;
– Impairment losses/(reversals);
– Net (gains)/losses on disposal and consolidation of interests in businesses;
– (Gains)/losses on non-trading derivative instruments and other investments measured at fair value through profit or loss;
– Major corporate restructures;
– Earnings adjustments included in profit/(loss) of equity accounted investments;
– Exchange rate variations on net debt; and
– Tax effect of earnings adjustments.
In addition, South32 management retains the discretion to adjust for other significant non-recurring items that are not considered reflective of the underlying performance of the Group’s operations.
34S
outh
32 A
nnua
l Rep
ort
2021
Op
erat
ing
and
Fin
anci
al R
evie
w

Financial key performance indicators for FY21Financial highlights
US$M FY21(5) FY20 Change
Revenue(1) 6,337 6,075 4%Profit/(loss) before tax and net finance costs (94) 261 (136%)Profit/(loss) after tax and net finance costs (195) (65) N/ABasic earnings per share (US cents)(2) (4.1) (1.3) N/AOrdinary dividends per share (US cents)(3) 4.9 2.1 133%Special dividends per share (US cents)(4) 2.0 1.1 82%Other financial measuresUnderlying EBITDA 1,564 1,185 32%Underlying EBITDA margin 26.4% 21.9% 4.5%Underlying EBIT 844 446 89%Underlying EBIT margin 14.1% 8.4% 5.7%Underlying earnings 489 193 153%Basic Underlying earnings per share (US cents)(2) 10.3 3.9 164%ROIC 6.2% 2.4% 3.8%Ordinary shares on issue (million) 4,675 4,846 (4%)
(1) Revenue includes revenue from third party products and services.(2) FY21 basic earnings per share is calculated as Profit/(loss) after tax divided by the weighted average number of shares for FY21 (4,771 million). FY21 basic Underlying earnings
per share is calculated as Underlying earnings divided by the weighted average number of shares for FY21. FY20 basic earnings per share is calculated as Profit/(loss) after tax divided by the weighted average number of shares for FY20 (4,892 million). FY20 basic Underlying earnings per share is calculated as Underlying earnings divided by the weighted average number of shares for FY20.
(3) FY21 ordinary dividends per share is calculated as H1 FY21 ordinary dividend announced (US$67 million) divided by the number of shares on issue at 31 December 2020 (4,781 million) plus H2 FY21 ordinary dividend announced (US$164 million) divided by the number of shares on issue at 30 June 2021 (4,675 million).
(4) FY21 special dividends per share is calculated as H2 FY21 special dividend announced (US$93 million) divided by the number of shares on issue at 30 June 2021 (4,675 million).(5) FY21 includes the discontinued operation South Africa Energy Coal for 11 months.
External factors and trends affecting the Group’s resultThe following describes the main external factors and trends that have had a material impact on the Group’s financial position and results of operations. Details of the Group’s most significant risk factors and how they are mitigated can be found in Risk management on pages 24 to 33 of the Annual Report.
Management monitors particular trends arising from external factors with a view to managing the potential impact on the Group’s future financial position and results of operations.
Commodity prices and changes in product demand and supplySouth32 produces metals and ores, prices of which are driven by global demand and supply for each of these commodities. Commodity prices were generally higher in FY21 compared to FY20 as most physical markets strengthened on the back of a solid global economic recovery and easing of COVID-19 restrictions. The prices that the Group obtains for its products are a key driver of business performance, and fluctuations in these markets affects its results, including cash flows and shareholder returns.
Estimated impact on Underlying EBIT of a +/- 10% change in commodity price
US$M FY21
Aluminium(1) 208Alumina 155Manganese ore(2) 91Metallurgical coal 71Nickel 43Silver 33Lead 23Zinc 16
(1) Aluminium sensitivity shown without any associated increase in alumina pricing.
(2) The sensitivity impacts for manganese ore are on a pre-tax basis. The Group’s manganese operations are reported as an equity accounted investment. As a result, the profit after tax for manganese is included in the Underlying EBIT of South32.
35S
outh32 Annual R
eport 2021
Op
erating and
Financial Review

Financial and operational performance summary continued
The following table shows the quoted market prices of the Group’s most significant commodities in FY21 and FY20. These prices differ from the realised prices on the sale of production due to contracts to which the Group is a party, differences in quotational periods, quality of products, delivery terms and the range of quoted prices that are used for contracting sales in different markets.
Quoted commodity prices
Average Value Closing Value
Year ended 30 June FY21 FY20 Change FY21 FY20 Change
Alumina(1) (US$/t) 283 277 2% 286 262 9%Aluminium (LME Cash)(2) (US$/t) 2,023 1,678 21% 2,523 1,602 57%Metallurgical coal(3) (US$/t) 122 144 (15%) 194 116 67%Manganese ore(4) (US$/dmtu) 4.63 4.96 (7%) 5.15 5.02 3%Nickel (LME Cash)(2) (US$/t) 16,241 14,009 16% 18,450 12,790 44%Silver(5) (US$/toz) 25.4 16.9 50% 25.8 17.8 45%Lead (LME Cash)(2) (US$/t) 1,978 1,901 4% 2,320 1,789 30%Zinc (LME Cash)(2) (US$/t) 2,653 2,211 20% 2,946 2,057 43%
(1) Platts Alumina Index (PAX) Free on Board (FOB) Australia – market price assessment of calcined metallurgical/smelter grade alumina.(2) LME Cash represents the Official Seller price for nickel, zinc and lead and the A.M. Official price for aluminium.(3) Platts Low-Vol Hard Coking Coal Index FOB Australia – representative of high-quality hard coking coals.(4) FastMarkets Manganese Ore 44 per cent Mn CIF Tianjin China.(5) Daily London Bullion Market Association (LBMA) Silver Fix.
The following summarises the pricing trends of our most significant commodities for FY21. The price change reflects the average of FY21 over FY20.
Alumina: The average FOB Australia price for the year was two per cent higher than FY20. While a strong recovery in global aluminium demand supported the market in FY21, it remained well supplied due to increased production from China.
Aluminium: The average LME cash settlement price for the year was 21 per cent higher than FY20. The price increase was driven by the global demand recovery, tight scrap availability and a ceiling for Chinese primary capacity at around 45 million tonnes per year, which led to domestic supply growing at a slower pace than demand.
Metallurgical coal: The FY21 average Platts Premium Low Vol Hard Coking Coal price was 15 per cent lower than FY20. The price declined as China’s tight import regulations led to the diversion of Australian export volumes, which created an oversupplied ex-China market before trade flows rebalanced through the year.
Manganese ore: The average Manganese Ore Metal Bulletin 44 per cent CIF China price was seven per cent lower than FY20. While the global demand recovery remained a key driver, an increase in seaborne supplies followed an easing of post-COVID-19 restrictions which impacted the market balance.
Nickel: The FY21 average LME cash settlement price was 16 per cent higher than FY20, driven by strong global demand growth from both the stainless steel and electric vehicle battery segments.
Silver: The FY21 average LBMA silver price was 50 per cent higher than FY20. The significant price gain was underpinned by a sharp rebound in industrial demand and strong investor appetite for silver.
Lead: The FY21 average LME cash settlement price was four per cent higher than FY20. Tight concentrate supply and a post-pandemic rebound in battery demand in North America and Europe provided price support.
Zinc: The FY21 average LME cash settlement price was 20 per cent higher than FY20, as a prolonged supply disruption stemming from COVID-19 related impacts helped to underpin prices.
Other external factorsA recovery in global demand as countries emerged from COVID-19 lockdowns, coupled with supply restraint by major producers, led to a recovery in oil prices in FY21. Oil prices were approximately five per cent higher in FY21 compared to FY20. This contributed to inflationary pressure in mining costs.
While there remains a gap between climate change ambition and action, activity in carbon offset and credit markets was supported by more countries and companies pledging long-term net zero targets or strengthening short-term emission reduction goals. Australian carbon credit units (“ACCUs”) were, on average, five per cent higher in FY21 as compared to FY20, reaching a new high of A$19.30/t at the close of FY21. Both our Australian and South African operations are subject to emissions reporting and domestic carbon pricing regimes. Carbon
pricing policies and associated regulatory mechanisms may restrict emissions or increase costs for companies with liable emissions. We annually review the signposts for changes in carbon pricing policy and how it affects us.
Exchange ratesThe Group is exposed to exchange rate risk on foreign currency sales, purchases and expenses, as no active currency hedging is undertaken. As the majority of sales are denominated in US dollars, and the US dollar plays a dominant role in the Group’s business, funds borrowed and held in US dollars provide a natural hedge to currency fluctuations. Operating costs and costs of locally-sourced equipment are influenced by fluctuations in local currencies, primarily the Australian dollar, Brazilian real, Colombian peso, Euro and South African rand.
The Group is also exposed to exchange rate translation risk in relation to net monetary liabilities, being foreign currency denominated monetary assets and liabilities, including debt, tax and other long-term liabilities. Details of the exposure to foreign currency fluctuations are set out in note 19 to the financial statements on pages 126 to 133.
36S
outh
32 A
nnua
l Rep
ort
2021
Op
erat
ing
and
Fin
anci
al R
evie
w
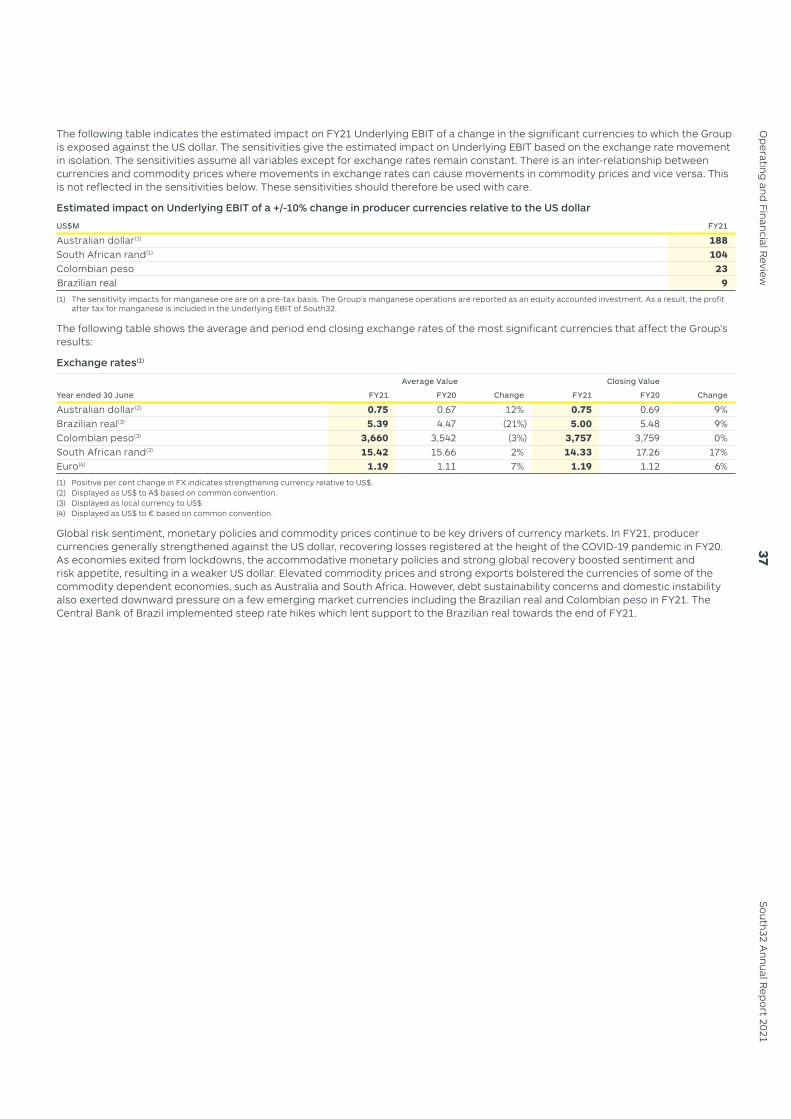
The following table indicates the estimated impact on FY21 Underlying EBIT of a change in the significant currencies to which the Group is exposed against the US dollar. The sensitivities give the estimated impact on Underlying EBIT based on the exchange rate movement in isolation. The sensitivities assume all variables except for exchange rates remain constant. There is an inter-relationship between currencies and commodity prices where movements in exchange rates can cause movements in commodity prices and vice versa. This is not reflected in the sensitivities below. These sensitivities should therefore be used with care.
Estimated impact on Underlying EBIT of a +/-10% change in producer currencies relative to the US dollar
US$M FY21
Australian dollar(1) 188South African rand(1) 104Colombian peso 23Brazilian real 9
(1) The sensitivity impacts for manganese ore are on a pre-tax basis. The Group’s manganese operations are reported as an equity accounted investment. As a result, the profit after tax for manganese is included in the Underlying EBIT of South32.
The following table shows the average and period end closing exchange rates of the most significant currencies that affect the Group’s results:
Exchange rates(1)
Average Value Closing Value
Year ended 30 June FY21 FY20 Change FY21 FY20 Change
Australian dollar(2) 0.75 0.67 12% 0.75 0.69 9%Brazilian real(3) 5.39 4.47 (21%) 5.00 5.48 9%Colombian peso(3) 3,660 3,542 (3%) 3,757 3,759 0%South African rand(3) 15.42 15.66 2% 14.33 17.26 17%Euro(4) 1.19 1.11 7% 1.19 1.12 6%
(1) Positive per cent change in FX indicates strengthening currency relative to US$.(2) Displayed as US$ to A$ based on common convention.(3) Displayed as local currency to US$.(4) Displayed as US$ to € based on common convention.
Global risk sentiment, monetary policies and commodity prices continue to be key drivers of currency markets. In FY21, producer currencies generally strengthened against the US dollar, recovering losses registered at the height of the COVID-19 pandemic in FY20. As economies exited from lockdowns, the accommodative monetary policies and strong global recovery boosted sentiment and risk appetite, resulting in a weaker US dollar. Elevated commodity prices and strong exports bolstered the currencies of some of the commodity dependent economies, such as Australia and South Africa. However, debt sustainability concerns and domestic instability also exerted downward pressure on a few emerging market currencies including the Brazilian real and Colombian peso in FY21. The Central Bank of Brazil implemented steep rate hikes which lent support to the Brazilian real towards the end of FY21.
37S
outh32 Annual R
eport 2021
Op
erating and
Financial Review

Financial and operational performance summary continued
2021 Financial year summary
Our response to COVID-19Our response to the COVID-19 pandemic continued throughout FY21 and the Group took significant measures to safeguard our communities, employees and contractors, and keep our operations running. Our critical controls remain in place at all our operations, offices and projects, as waves of COVID-19 infections continue in some of the locations where we operate. We are actively engaged with governments and health authorities on their vaccine roll-out plans and have offered the use of our facilities and logistics support.
During FY21 we adapted the way that we work to deliver a solid operating performance while navigating the ongoing challenges of COVID-19. We continued to focus on cost control and productivity improvements, simplifying our functional structures, reducing our corporate costs, and delivering production broadly in line with guidance.
As we look to FY22, we continue to monitor the ongoing impacts of the pandemic closely. Accordingly our FY22 production, Operating unit cost and capital expenditure guidance is subject to further potential impacts from COVID-19.
Performance summaryThe Group’s statutory profit after tax declined by US$130 million to a loss of US$195 million in FY21 following the recognition of impairment charges totalling US$728 million (US$510 million post-tax) in relation to Illawarra Metallurgical Coal and a loss on sale of US$159 million following our divestment of South Africa Energy Coal.
The Illawarra Metallurgical Coal impairment charge reflects the increased approval uncertainty created by the New South Wales Independent Planning Commission’s (IPC) decision to refuse our application for the Dendrobium Next Domain (DND) life extension project and the resultant potential impact on the economics of the broader complex. We have scaled back activity on the project while we consider alternative options following the IPC decision. The loss incurred on the divestment of South Africa Energy Coal reflects the recognition of the vendor support package (refer to note 31 on page 144 for further details) that we provided to Seriti Resources Holdings Proprietary Limited (Seriti) to underpin the sustainability of the business.
Excluding these one-off charges, strong operating performance and higher prices for most of our commodities translated into a 153 per cent increase in Underlying earnings to US$489 million. Our production performance, including three records, partially offset cyclical inflation and stronger producer currencies.
Specific highlights for FY21 included:
– Record production at Worsley Alumina and Brazil Alumina with both refineries benefitting from higher plant availability;
– Record production at Australia Manganese and a 21 per cent year-on-year increase at South Africa Manganese with both operations exceeding guidance;
– A 14 per cent increase in zinc equivalent production at Cannington with strong underground performance enabling the acceleration of a higher-grade mining sequence during the year;
– A nine per cent increase in production at Illawarra Metallurgical Coal with the return to a three longwall configuration delivering greater efficiencies;
– First ore from the higher-grade Queresas and Porvenir project (Q&P project) and successful refurbishment of a furnace at Cerro Matoso, laying the foundation for a 28 per cent increase in nickel production in FY22;
– The announcement of our target to achieve a 50 per cent reduction in operational carbon emissions (Scope 1 and 2) by 2035, which steps up our ambition on climate change and supports a pathway to net zero by 2050; and
– Successful divestment of South Africa Energy Coal, the TEMCO manganese alloy smelter and a portfolio of non-core precious metals royalties during FY21, simplifying and improving our portfolio.
We finished the period with net cash of US$406 million, having generated free cash flow from operations, including distributions from our manganese equity accounted investments, of US$825 million. Reflecting our strong financial position and demonstrating the continuation of the disciplined and flexible approach we are taking to our capital management program, we returned US$670 million to our shareholders in respect of FY21 comprised of:
– A US$66.5 million fully franked interim ordinary dividend paid in April 2021 in respect of H1 FY21, and the Board resolving to pay a US$164 million fully franked final ordinary dividend in respect of H2 FY21; and
– US$439 million as part of our ongoing capital management program, with US$346 million allocated to our on-market share buy-back (172 million shares at an average price of A$2.68 per share), and the Board resolving to pay a US$93 million fully franked special dividend in October 2021.
Having returned seven per cent of our market capitalisation to shareholders in respect of FY21, and having also established a strong track record of returning excess capital in a timely and efficient manner, the Board has further expanded our capital management program by US$120 million to US$2 billion, leaving US$252 million to be returned by 2 September 2022.
EarningsThe Group’s statutory profit after tax declined by US$130 million to a loss of US$195 million in FY21. Consistent with our accounting policies, various items are excluded from the Group’s statutory profit to derive Underlying earnings including: impairment losses (US$764 million pre-tax) primarily at Illawarra Metallurgical Coal; net losses on the disposal of our interest in South Africa Energy Coal (US$159 million pre-tax); exchange rate losses on restatement of monetary items (US$69 million pre-tax); gains made from the sale of a portfolio of non-core precious metals royalties (US$55 million pre-tax); gains on non-trading derivative instruments and other investments measured at fair value through profit or loss (US$37 million pre-tax); major corporate restructures (US$23 million pre-tax); losses associated with earnings adjustments included in our equity accounted investments (US$15 million pre-tax); exchange rate losses associated with the Group’s non US dollar denominated net debt (US$52 million pre-tax); and the tax expense for all pre-tax earnings adjustments and exchange rate variations on tax balances (US$306 million). Further information on these earnings adjustments is included on page 108.
The Group’s Underlying EBITDA increased by US$379 million (or 32 per cent) to US$1.6 billion in FY21, with Revenue four per cent higher, as sales volumes increased and our realised prices for aluminium, silver, zinc and nickel all improved. Higher base metals prices were partially offset by lower realised prices for our bulk commodities, with metallurgical coal and manganese ore prices declining.
38S
outh
32 A
nnua
l Rep
ort
2021
Op
erat
ing
and
Fin
anci
al R
evie
w

Our strong operating result and higher prices translated into an improved Group operating margin of 26 per cent. Our cost base (excluding third party product cost and ceased & sold operations) remained largely unchanged, despite higher power costs at Hillside Aluminium and the inflationary impact of global freight rates and stronger producer currencies. Savings in our corporate spend and inventory movements meant our controllable cost base reduced, offsetting the impact of the cyclical cost pressures.
Underlying EBIT increased by US$398 million (or 89 per cent) to US$844 million as depreciation and amortisation decreased by US$19 million to US$720 million. Underlying earnings increased by US$296 million (or 153 per cent) to US$489 million despite the de-recognition of tax assets at South Africa Energy Coal associated with its divestment, meaning our Underlying ETR remained elevated in FY21. The divestment of South Africa Energy Coal was completed on 1 June 2021, with the operation contributing an Underlying earnings loss of US$194 million to the Group’s result for FY21 (FY20: US$208 million loss).
Operating costsFY21 and FY20 comparative underlying operating costs are set out below, excluding earnings adjustment items impacting operating costs. Earnings adjustment items are detailed on page 108 in note 4(b)(i) to the financial statements.
US$M FY21 FY20
Operating cash costs 4,616 4,711Third party commodity purchases 468 585Depreciation and amortisation expense 720 739Total operating costs included in Underlying EBIT 5,804 6,035
Capital expenditureWe allocate capital in line with our strategy and capital management framework to optimise our business, unlock the full value of operations and identify and pursue opportunities to create value. In FY21 the Group continued to prioritise capital to ensure the safety and reliability of our operations, progress life extension and innovation and improvement projects, and fund our current and future greenfield growth to sustainably grow ROIC.
US$M FY21 FY20
Safe and reliable capital expenditure (325) (364)Improvement and life extension capital expenditure (63) (33)Growth capital expenditure (72) (115)Intangibles and the capitalisation of exploration expenditure (30) (69)Divested operation – South Africa Energy Coal (76) (164)Total capital expenditure (excluding equity accounted investments) (566) (745)Equity accounted investment capital expenditure (including intangibles and capitalised exploration) (72) (91)Total capital expenditure (including equity accounted investments) (638) (836)
Total capital expenditure, excluding equity accounted investments, decreased by US$179 million to US$566 million as:
– Safe and reliable capital expenditure, excluding equity accounted investments and divested operations, decreased by US$39 million (or 11 per cent) to US$325 million, with spend at Illawarra Metallurgical Coal declining following the substantial investment in prior periods to return to a three longwall configuration;
– Improvement and life extension capital expenditure, excluding equity accounted investments and divested operations, increased by US$30 million (or 91 per cent) to US$63 million as we accelerated development of the Q&P project at Cerro Matoso and undertook pre-commitment spend on studies and critical path items associated with the DND project at Illawarra Metallurgical Coal;
– Growth capital expenditure decreased by US$43 million (or 37 per cent) to US$72 million with the rate of spend at Hermosa declining due to the impact of COVID-19 workforce restrictions and our completion of the voluntary remediation program in the prior year;
– Our spend on intangibles and the capitalisation of exploration expenditure decreased by US$39 million (or 57 per cent) to US$30 million as COVID-19 travel restrictions led to the deferral of an update to our information technology systems and restricted our ability to undertake exploration activity; and
– Capital expenditure at South Africa Energy Coal decreased by US$88 million (or 54 per cent) to US$76 million as the rate of significant investment into the business to secure its long-term sustainability under the ownership of Seriti slowed and the divestment was completed on 1 June 2021.
Total capital expenditure associated with our manganese equity accounted investments declined by US$19 million to US$72 million as we completed non-processing infrastructure upgrades at GEMCO and divested TEMCO.
Net finance costsThe Group’s Underlying net finance costs, excluding equity accounted investments and discontinued operation, of US$109 million in FY21, largely reflects the unwinding of the discount applied to our closure and rehabilitation provisions (US$59 million) and interest on our lease liabilities (US$55 million), primarily at Worsley Alumina. Costs for our discontinued operation (US$43 million) are mostly related to the unwind of the discount applied to our closure and rehabilitation provisions at South Africa Energy Coal.
Tax expenseThe Group’s Underlying income tax expense, which excludes tax associated with equity accounted investments, was US$203 million for an Underlying ETR of 37.3 per cent in FY21. While a significant reduction from the prior year, the ETR remained elevated during FY21 due to the de-recognition of tax assets associated with losses at South Africa Energy Coal prior to its divestment. From FY22 we expect the rate to more closely reflect the corporate tax rates of the geographies where the Group operates which include: Australia 30 per cent, South Africa 28 per cent, Colombia 31 per cent, Mozambique zero per cent and Brazil 34 per cent. We continue to monitor for potential changes to tax legislation in these geographies.
The Underlying income tax expense for our manganese equity accounted investments was US$177 million, including royalty related taxation of US$53 million at GEMCO (Australia Manganese), for an Underlying ETR of 51.9 per cent (FY20: 43.7 per cent). The temporary increase in the Underlying ETR was driven by the de-recognition of certain deferred tax assets in our Australian business during FY21.
39S
outh32 Annual R
eport 2021
Op
erating and
Financial Review

Financial and operational performance summary continued
Cash flowThe Group’s free cash flow from operations, excluding equity accounted investments, increased by US$369 million to US$639 million in FY21, following a 24 per cent reduction in capital expenditure and lower cash tax payments that tend to lag an improvement in profitability. We also received (net) distributions of US$186 million from our manganese equity accounted investments (FY20: US$313 million) as our two ore producing operations continued to perform strongly, while the alloy business incurred one-off costs associated with the suspension of Metalloys and sale of TEMCO. Cash generated from our Group operations was largely unchanged (+US$37 million to US$1.4 billion) as strong operating performance and a broad based price recovery across our commodities more than offset the prior period’s benefit of a substantial unwind in working capital (US$287 million).
Free cash flow from operations, excluding equity accounted investments
US$M FY21 FY20
Profit/(loss) from continuing and discontinued operations (94) 261 Non-cash items 1,419 927 (Profit)/loss from equity accounted investments (133) (100)(Profit)/loss from sale of operations 159 -Change in working capital 61 287Cash generated 1,412 1,375 Total capital expenditure, excluding equity accounted investments, including intangibles and capitalised exploration (566) (745)Operating cash flows before financing activities and tax, and after capital expenditure 846 630 Interest (paid)/received (44) (25)Income tax (paid)/received (163) (335)Free cash flow from operations 639 270
Although lower than the prior period, working capital unwound by a further US$61 million with provisions increasing by US$95 million, and trade and other payables by US$264 million. The latter driven by higher raw material input costs and the accrual of additional power charges under our new pricing agreement for our Hillside Aluminium smelter (US$83 million). The accrual reflects the increase in the smelter’s new tariff for the period 1 August 2020 to 30 June 2021 and is expected to unwind as payments are made across 24 months. These movements were partially offset by increases in trade and other receivables (US$156 million) and inventories (US$142 million), reflecting higher commodity prices. Our debtor days remained broadly unchanged at 24 (FY20: 23 days).
Working capital movement reconciliation
US$M FY21 FY20
Trade and other receivables (156) 367Inventories (142) 208Trade and other payables 264 (184)Provisions and other liabilities 95 (104)Working capital movement 61 287
Earnings analysis
The following key factors influenced Underlying EBIT in FY21, relative to FY20.
Reconciliation of movements in Underlying EBIT (US$M)(1)(2)(3)
(1) Sales price variance reflects the revenue impact of changes in commodity prices, based on the current period’s sales volume. Price-linked costs variance reflects the change in royalties together with the change in input costs driven by changes in commodity prices or market traded consumables. Foreign exchange reflects the impact of exchange rate movements on local currency denominated costs and sales. Volume variance reflects the revenue impact of sales volume changes, based on the comparative period’s sales prices. Controllable costs variance represents the impact from changes in the Group’s controllable local currency cost base, including the variable cost impact of production volume changes on expenditure, and period-on-period movements in inventories. The controllable cost variance excludes earnings adjustments including significant items.
(2) Underlying net finance costs and Underlying income tax expense are actual FY21 results, not year-on-year variances.(3) South32’s ownership share of operations is as follows: Worsley Alumina (86 per cent share), Hillside Aluminium (100 per cent), Mozal Aluminium (47.1 per cent share), Brazil
Alumina (Alumina 36 per cent share, Aluminium 40 per cent share), Illawarra Metallurgical Coal (100 per cent), Australia Manganese (60 per cent share), South Africa Manganese (60 per cent share), Cerro Matoso (99.9 per cent share), Cannington (100 per cent), Hermosa (100 per cent), and Eagle Downs Metallurgical Coal (50 per cent share).
500
1,000
Uncontrollable Net financecosts and tax
446
401 (73)(185)
(61)115
238 11 (30) (18)
844
(152)
(203)
489
FY20
Und
erly
ing
EB
IT
Sale
s p
rice
Pric
e-lin
ked
cos
ts
Fore
ign
exch
ang
e
Infla
tion
Sale
s vo
lum
e
Con
trol
lab
le c
osts
Cea
sed
and
sol
d o
per
atio
ns
Oth
er
Inte
rest
& t
ax (e
qui
tyac
coun
ted
inve
stm
ents
)
FY21
Und
erly
ing
EB
IT
Und
erly
ing
net
fina
nce
cost
s
Und
erly
ing
inco
me
tax
exp
ense
FY21
Und
erly
ing
ear
ning
s
40S
outh
32 A
nnua
l Rep
ort
2021
Op
erat
ing
and
Fin
anci
al R
evie
w

Earnings analysis US$M Commentary
FY20 Underlying EBIT 446Change in sales price 401 Higher average realised prices for our commodities, including:
Aluminium (+US$363 million)
Silver (+US$123 million)
Zinc (+US$65 million)
Nickel (+US$65 million)
Partially offset by lower average realised prices for:
Metallurgical coal (-US$182 million)
Manganese ore (-US$35 million)
Alumina (-US$3 million)Net impact of price-linked costs (73) Higher electricity costs (-US$103 million), primarily at Hillside Aluminium
Higher distribution and freight costs across our operations (-US$39 million)
Lower caustic soda prices at Worsley Alumina (+US$27 million) and Brazil Alumina (+US$6 million)
Lower bauxite prices at Brazil Alumina (+US$18 million)
Lower aluminium smelter raw material costs (+US$12 million), including pitch and cokeChange in exchange rates (185) Stronger Australian dollar (-US$189 million)
Stronger South African rand (-US$23 million)
Weaker Brazilian real (+US$16 million)Change in inflation (61) Southern Africa (-US$29 million)
Australia (-US$24 million)Change in sales volume 115 Higher volumes at:
South Africa Manganese (+US$79 million)
Cannington (+US$66 million)
Worsley Alumina (+US$41 million)
Australia Manganese (+US$40 million)
Partially offset by lower volumes at:
Cerro Matoso (-US$91 million)
Mozal Aluminium (-US$31 million)Controllable costs 238 Inventory movements (+US$249 million), resulting from the drawdown of metallurgical
coal and aluminium finished goods in the prior period
Reduction in controllable costs for our corporate functions (+US$29 million)
Impact of higher volumes (-US$15 million) primarily at South Africa Manganese, Worsley Alumina and Illawarra Metallurgical Coal
Higher caustic usage (-US$13 million) at Worsley Alumina
Increased pot relining activity (-US$12 million) at Hillside AluminiumCeased and sold operations 11 Movement in loss-making ceased and sold operations (South Africa Energy Coal,
TEMCO alloy smelter and Bayside aluminium smelter)Other (30) Lower joint venture recoveries partially offset by EBIT earned on third party tradingInterest & tax (equity accounted investments)
(18) Higher ETR in our jointly controlled manganese operations
FY21 Underlying EBIT 844
Further analysis of operations performance is outlined on pages 44 to 53.
41S
outh32 Annual R
eport 2021
Op
erating and
Financial Review

Financial and operational performance summary continued
Balance sheet and capital managementThe Group’s generation of free cash flow from operations, including net distributions from our manganese equity accounted investments, of US$825 million supported a US$108 million increase in the Group’s net cash balance to US$406 million at 30 June 2021, after we funded the return of a further US$460 million to shareholders in the period. Our lease and other interest bearing liabilities increased by US$190 million primarily due to recognition of our commitment to fund rehabilitation activity at South Africa Energy Coal operations by way of 10 annual instalments totalling US$200 million.
Consistent with our unchanged capital management framework and commitment to maintain an investment grade credit rating, both Standard and Poor’s and Moody’s reaffirmed their respective BBB+ and Baa1 credit ratings for the Group during the period.
Reflecting our strong financial position and demonstrating the disciplined and flexible approach we are taking to our capital management program, we recommenced our on-market share buy-back in October 2020 as COVID-19 related operational risks subsided, returning US$346 million during the period in addition to paying US$115 million in ordinary dividends. In accordance with our ordinary dividend policy, the Board has resolved to pay a fully franked ordinary dividend of US 3.5 cents per share (US$164 million), representing 46 per cent of Underlying earnings in respect of H2 FY21.
Our capital management framework is designed that our options compete for excess capital to create shareholder value, while our capital management program seeks to return capital to shareholders in a timely and efficient manner. Following the aforementioned return of US$346 million to shareholders in FY21, our capital management program had US$225 million remaining to be returned to shareholders as at 30 June 2021. Consistent with the flexible approach we are taking to the execution of our program, the Board has resolved to pay a fully franked special dividend of US 2.0 cents per share (US$93 million) and to increase the amount committed under the program by US$120 million. This increases the total amount to be returned under our capital management program to US$2 billion since its commencement, with US$252 million remaining to be returned by 2 September 2022.
Net debt and sources of liquidityOur policies on debt and treasury management are as follows:
– Commitment to maintain an investment grade credit rating;
– Diversification of funding sources; and
– Generally maintain borrowings and excess cash in US dollars.
Gearing and net debtThe table below presents net cash/(debt) and net assets of the Group, based on the balance sheet as at 30 June 2021:
US$M FY21 FY20
Cash and cash equivalents 1,613 1,315Current external debt (408) (355)Non-current external debt (799) (662)Net cash 406 298Net assets 8,954 9,562
Given the net cash position of the Group, a gearing ratio is not presented.
Funding sourcesIn addition to cash flow from operations as a primary source of funding, the Group at the time of this report, has a committed US$1.45 billion revolving credit facility which is a standby arrangement to the Group’s US dollar commercial paper program and is not subject to financial covenants at the Group’s current credit rating. Certain financing facilities in relation to specific operations are the subject of financial covenants that vary from facility to facility; however, these are considered normal for such facilities.
As at 30 June 2021, the Group’s cash and cash equivalents on hand were US$1.6 billion. Details of our major standby arrangement are as follows:
US$MAvailable
FY21Used FY21
Revolving credit facility(1) 1,450 -
(1) The Group has an undrawn revolving credit facility which is a standby arrangement to the US commercial paper program. This facility was extended in July 2020 by one year and expires in February 2023.
Additional information regarding the maturity profile of the Group’s debt obligations and details of our major standby agreement is included in note 19 to the financial statements on pages 126 to 133.42
Sou
th32
Ann
ual R
epor
t 20
21O
per
atin
g a
nd F
inan
cial
Rev
iew

Operations analysisA summary of the underlying performance of the Group’s operations is presented below and more detailed analysis is presented on pages 44 to 53.
Operations table (South32 share)(1)
Revenue Underlying EBIT
US$M FY21 FY20 FY21 FY20
Worsley Alumina 1,173 1,118 143 160Brazil Alumina 400 399 63 (15)Hillside Aluminium 1,511 1,276 293 103Mozal Aluminium 578 508 98 (24)Illawarra Metallurgical Coal 758 924 (103) 52Australia Manganese 730 763 304 328South Africa Manganese 369 342 55 54Cerro Matoso 493 519 122 107Cannington 757 476 350 105Third party products and services(2) 378 340 10 (2)Inter-segment / Group and unallocated(3) (573) (550) (139) (73)Total 6,574 6,115 1,196 795Equity accounting adjustment(4) (1,098) (1,105) (202) (184)South32 Group (excluding South Africa Energy Coal) 5,476 5,010 994 611South Africa Energy Coal 861 1,065 (150) (165)South32 Group 6,337 6,075 844 446
(1) South32’s ownership share of operations is as per footnote (3) on page 40.(2) FY21 Third party products and services sold comprise US$43 million for aluminium, US$10 million for alumina, US$23 million for coal, US$206 million for freight services,
US$92 million for aluminium raw materials and US$4 million for manganese. Underlying EBIT on third party products and services comprise US$8 million for aluminium, nil for alumina, US$1 million for coal, nil for freight services, US$1 million for aluminium raw materials and nil for manganese. FY20 Third party products and services sold comprise US$42 million for aluminium, US$14 million for alumina, US$33 million for coal, US$165 million for freight services, US$86 million for aluminium raw materials and nil for manganese. Underlying EBIT on third party products and services comprise US$2 million for aluminium, (US$4 million) for alumina, nil for coal, (US$2 million) for freight services, US$2 million for aluminium raw materials and nil for manganese.
(3) Group and unallocated Underlying EBIT includes Hermosa -US$8 million (FY20 -US$5 million) and the recognition of one-off charges in H2 FY21. (4) The equity accounting adjustment reconciles the proportional consolidation of the South32 manganese operations to the treatment of the manganese operations on an equity
accounted basis (including third party product). 43
South32 A
nnual Rep
ort 2021O
perating
and Financial R
eview

Financial and operational performance summary continued
WORSLEY ALUMINALocation: Western Australia, Australia
South32 share: 86%
South32 holds an 86 per cent interest in Worsley Alumina, while Japan Alumina Associates (Australia) Pty Ltd owns 10 per cent and Sojitz Alumina Pty Ltd owns four per cent.
Bauxite is mined near the town of Boddington, 130 kilometres south-east of Perth. It is transported by overland conveyor to the alumina refinery near Collie and turned into alumina powder, before being transported by rail to Bunbury Port. It is then shipped to smelters around the world, including South32’s Hillside Aluminium and Mozal Aluminium smelters in Africa.
Worsley Alumina is one of the largest contributors to our operational carbon emissions. Short-term emissions reduction activities include a mud-washing project to optimise energy consumption. We are studying a transition from coal to gas as an interim step, followed by the subsequent deployment of renewable energy.
South32 share FY21 FY20
Alumina production (kt) 3,963 3,886 Alumina sales (kt) 4,004 3,782 Realised alumina sales price (US$/t) 293 296 Operating unit cost (US$/t) 214 210
South32 share (US$M) FY21 FY20
Revenue 1,173 1,118 Underlying EBITDA 318 322 Underlying EBIT 143 160 Net operating assets 2,667 2,789 Capital expenditure 55 48
Safe and reliable 51 44Improvement and life extension 4 4
Community investment 1.1 0.3
SafetyTRIF was 6.8 for Worsley Alumina in FY21, a 38 per cent decrease year-on-year.
VolumesWorsley Alumina saleable production increased by two per cent (or 77kt) to a record of 3,963kt in FY21, with the refinery finishing the year strongly, setting a quarterly record and operating above nameplate capacity of 4.6Mtpa (100 per cent basis). The refinery’s record performance in FY21 was enabled by improvement initiatives in the calcination circuit and record alumina hydrate production.
Operating costsOperating unit costs increased by two per cent in FY21 to US$214/t as the benefits of record production volumes, lower caustic soda prices (FY21: US$302/t, FY20: US$366/t) and reduced contractor spend were more than offset by a stronger Australian dollar and a planned increase in our caustic usage rates (FY21: 102kg/t, FY20: 93kg/t).
Financial performanceUnderlying EBIT decreased by 11 per cent (or US$17 million) in FY21 to US$143 million as a one per cent decline in the average realised price of alumina (-US$10 million), a stronger Australian dollar (-US$58 million) and a drawdown of finished goods (-US$29 million) were partially offset by increased sales volumes (+US$65 million), a reduction in contractor and consultant spend (+US$12 million) and lower expenditure on caustic soda (+US$9 million).
We realised a modest premium to the PAX on a volume weighted M-1 basis for alumina sales in FY21, due to the structure of legacy supply contracts with our Mozal Aluminium smelter. Contracts with the smelter are linked to the LME aluminium price and alumina indices on an M-1 basis, with caps and floors embedded within specific contracts that reset every calendar year. All other alumina sales were at market based prices.
Capital expenditureCapital expenditure increased by US$7 million in FY21 to US$55 million as we continued to invest in additional bauxite residue disposal capacity, further improvements in processing infrastructure that will support production creep and initial works to support the development of new mining areas.
Community investmentWe invested US$1.1 million in communities around Worsley Alumina in FY21, with a focus on environmental protection and restoration, economic diversification and supporting education and cultural programs for Aboriginal and Torres Strait Islander peoples.
44
Sou
th32
Ann
ual R
epor
t 20
21O
per
atin
g a
nd F
inan
cial
Rev
iew

BRAZIL ALUMINALocation: Pará and Maranhão, Brazil
South32 share: Alumina - 36%, Aluminium - 40%
South32 investment: Bauxite - 14.8%
South32 holds 14.8 per cent interest in the non-operated bauxite mine MRN, a 36 per cent share of the non-operated Alumar alumina refinery and a 40 per cent share in the Alumar aluminium smelter, which is currently on care and maintenance.
The MRN mine is an open-cut strip mining operation. Mined ore is hauled to primary crushers and then transported by conveyor belt to the beneficiation plant. The bauxite produced from the MRN mine is sold to its shareholders. South32’s share of bauxite produced from the MRN mine is supplied to the Brazil Alumina refinery. Together with our partners at MRN we continue to progress the life extension project’s pre-feasibility study. The project has the potential to extend the life of the mine by more than 20 years at a relatively low capital cost.
The alumina produced from the refinery is exported through the Alumar Port.
South32 share FY21 FY20
Alumina production (kt) 1,398 1,383 Alumina sales (kt) 1,391 1,392 Realised alumina sales price (US$/t) 288 287 Alumina Operating unit cost (US$/t) 203 244
South32 share (US$M) FY21 FY20
Revenue 400 399Alumina 400 399Aluminium - -
Underlying EBITDA 114 50Alumina 117 60Aluminium (3) (10)
Underlying EBIT 63 (15)Alumina 66 (5)Aluminium (3) (10)
Net operating assets/(liabilities) 571 568
Alumina 570 584Aluminium 1 (16)
Capital expenditure 25 34Safe and reliable 25 33Improvement and life extension - 1
VolumesBrazil Alumina saleable production increased by one per cent (or 15kt) to a record 1,398kt in FY21 as the refinery continued to benefit from strong plant availability, realising the benefits of the De-bottlenecking Phase One project.
Operating costsOperating unit costs decreased by 17 per cent in FY21 to US$203/t as the refinery achieved record output, combined with lower bauxite usage rates and pricing during the period. The operation also recognised one-off historical tax credits that provided a benefit to unit costs of US$12/t.
Financial performanceAlumina Underlying EBIT increased by US$71 million in FY21 to US$66 million as the refinery benefitted from lower bauxite costs (price and consumption, US$26 million), a weaker Brazilian real (+US$16 million), lower depreciation (+US$14 million) and the recognition of historical tax credits (+US$16 million).
Aluminium Underlying EBIT improved by US$7 million in FY21 to a loss of US$3 million as we continued to incur costs to maintain the smelter on care and maintenance.
Capital expenditureCapital expenditure decreased by US$9 million to US$25 million in FY21 as our rate of investment in bauxite residue disposal capacity reduced.
45S
outh32 Annual R
eport 2021
Op
erating and
Financial Review

Financial and operational performance summary continued
HILLSIDE ALUMINIUMLocation: KwaZulu-Natal, South Africa
South32 share: 100%
The Hillside Aluminium smelter is located in Richards Bay in the South African province of KwaZulu-Natal and is 100 per cent owned and operated by South32 with a solid metal production capacity of 720kt per year.
Hillside Aluminium is the largest aluminium smelter in the southern hemisphere. The smelter produces high-quality, primary aluminium for the domestic and export markets.
To support the development of the downstream aluminium industry in South Africa a portion of liquid metal is supplied to Hulamin and other local companies that produce products for the domestic and export markets.
Hillside Aluminium is a major contributor to our operational carbon emissions. A feasibility study of the AP3XLE energy efficiency technology is underway and we are also studying low carbon energy sources for the smelter.
South32 share FY21 FY20
Aluminium production (kt) 717 718Aluminium sales (kt) 707 723Realised sales price (US$/t) 2,137 1,765Operating unit cost (US$/t) 1,631 1,531
South32 share (US$M) FY21 FY20
Revenue 1,511 1,276Underlying EBITDA 358 169Underlying EBIT 293 103Net operating assets 733 794Capital expenditure 17 13
Safe and reliable 17 12Improvement and life extension - 1
Community investment 3.0 2.0
SafetyTRIF was 0.5 for Hillside Aluminium in FY21, a 55 per cent decrease year-on-year.
VolumesHillside Aluminium saleable production decreased by 1kt to 717kt in FY21 as the smelter continued to test its maximum technical capacity, despite the impact to production from increased load-shedding.
Operating costsOperating unit costs increased by seven per cent in FY21 to US$1,631/t as the benefit of lower raw material input costs was more than offset by higher charges from a new power agreement for the smelter that has been operating under an interim arrangement since 1 August 2020. Subsequent to the end of the period, we finalised the new agreement with Eskom which secures the smelter’s energy supply until 2031. The new tariff is South African rand based, with a rate of escalation linked to the South Africa Producer Price Index.
The smelter sources its alumina from our Worsley Alumina refinery with prices linked to the PAX on an M-1 basis, with alumina, coke, pitch and aluminium tri-fluoride accounting for 50 per cent of the smelter’s cost base in FY21 (FY20: 54 per cent).
Financial performanceUnderlying EBIT increased by 184 per cent (or US$190 million) in FY21 to US$293 million as a 21 per cent increase in the average realised price of aluminium (+US$262 million) and lower raw material input costs (+US$44 million) more than offset an increase in costs from the new power agreement (-US$100 million). Pot relining activity also increased (-US$12 million) at the smelter in FY21, with 120 pots relined at a cost of US$244 thousand per pot (FY20: 65 pots at US$248 thousand per pot).
Capital expenditureCapital expenditure increased by US$4 million in FY21 to US$17 million.
Community investmentWe invested US$3.0 million in communities around Hillside Aluminium in FY21, with a focus on local skills and economic development, education and strengthening healthcare services.
46S
outh
32 A
nnua
l Rep
ort
2021
Op
erat
ing
and
Fin
anci
al R
evie
w

MOZAL ALUMINIUMLocation: Maputo, Mozambique
South32 share: 47.1%
South32 has a 47.1 per cent share of Mozal Aluminium, while Mitsubishi Corporation, through MCA Metals Holding GmbH, holds 25 per cent, Industrial Development Corporation of South Africa Limited holds 24 per cent and the Government of the Republic of Mozambique holds 3.9 per cent (through preference shares). Mozal Aluminium is located 20 kilometres west of Mozambique’s capital city Maputo and has a solid metal production capacity of 580kt (on a 100 per cent basis) per year.
Mozal Aluminium is the only aluminium smelter in Mozambique and the second largest aluminium smelter in Africa. It produces standard aluminium ingots.
To support the development of the downstream aluminium industry in Mozambique a portion of liquid metal is supplied to Midal Cables, a local company that produces products for the domestic and export markets.
South32 share FY21 FY20
Aluminium production (kt) 265 268Aluminium sales (kt) 262 279Realised sales price (US$/t) 2,206 1,821Operating unit cost (US$/t) 1,702 1,785
South32 share (US$M) FY21 FY20
Revenue 578 508Underlying EBITDA 132 10Underlying EBIT 98 (24)Net operating assets 456 436Capital expenditure 11 11
Safe and reliable 10 11Improvement and life extension 1 -
Community investment 1.8 1.5
SafetyTRIF was 0.5 for Mozal Aluminium in FY21, a 38 per cent decrease year-on-year.
VolumesMozal Aluminium saleable production decreased by one per cent (or 3kt) to 265kt in FY21, with the smelter performing strongly in Q4 FY21, despite the impact of increased load-shedding. The strong finish to the year followed COVID-19 workforce restrictions that impacted operations during Q3 FY21.
Operating costsOperating unit costs decreased by five per cent in FY21 to US$1,702/t as raw material input costs decreased for alumina, coke, pitch and aluminium tri-fluoride, which combined to account for 42 per cent of the smelter’s cost base (FY20: 46 per cent).
The smelter sources its alumina from our Worsley Alumina refinery with approximately 50 per cent priced as a percentage of the LME aluminium index under a legacy contract and the remainder linked to the PAX on an M-1 basis, with caps and floors embedded within specific contracts that reset each calendar year.
Financial performanceUnderlying EBIT increased by US$122 million in FY21 to US$98 million following a loss in FY20. The smelter's return to profitability was enabled by a 21 per cent increase in the average realised price of aluminium (+US$101 million), favourable movements in finished goods inventory (+US$48 million) and lower raw material input prices (+US$20 million) that were partially offset by lower sales volumes (-US$31 million). 134 pots were relined across FY21 at a cost of US$252 thousand per pot (FY20: 112 pots at US$278 thousand per pot).
Capital expenditureCapital expenditure was unchanged at US$11 million in FY21 as the smelter continued to roll out the AP3XLE energy efficiency technology in its pot relining program.
Community investmentWe invested US$1.8 million in communities around Mozal Aluminium in FY21, with a focus on education and employment, health and wellbeing and sustainable agricultural development.
47S
outh32 Annual R
eport 2021
Op
erating and
Financial Review

Financial and operational performance summary continued
SOUTH AFRICA ENERGY COALLocation: Mpumalanga, South Africa
South32 share: 100% divested
South Africa Energy Coal is located in the South African province of Mpumalanga and was 100 per cent owned and operated by South32 until 1 June 2021, at which time we concluded the sale of the business to a subsidiary of Seriti and two trusts for the benefit of employees and the community.
South32 share FY21(1) FY20
Energy coal production (kt) 18,086 22,672Domestic sales (kt)(2) 10,375 12,638Export sales (kt)(2) 8,025 9,715Realised domestic sales price (US$/t)(2) 33 25Realised export sales price (US$/t)(2) 50 53Operating unit cost (US$/t)(3) 48 42
South32 share (US$M) FY21(1) FY20
Revenue(4) 861 1,065Underlying EBITDA (123) (118)Underlying EBIT (150) (165)Net operating assets/(liabilities) - (178)Capital expenditure 76 164
Safe and reliable 23 42 Improvement and life extension 53 122
Community investment 5.2 5.0
SafetySadly, in May this year a contractor, Mr Petros Sibeko, was fatally injured while working on the construction of a workshop at the Klipspruit Extension Project. TRIF was 1.6 for South Africa Energy Coal in FY21, an 11 per cent decrease year-on-year.
Financial performanceSouth Africa Energy Coal was divested on 1 June 2021. Prior to the divestment, the operation realised an EBIT loss of US$150 million in FY21 as Operating unit costs increased by 14 per cent to US$48/t. Capital expenditure decreased by US$88 million in FY21 to US$76 million as the substantial investment of recent periods to ensure the operation’s sustainability under Seriti’s ownership continued, and the Klipspruit Life Extension project was completed.
Community investmentWe invested US$5.2 million in communities around South Africa Energy Coal in FY21, including in education and skills development, community health, community infrastructure and supporting local economic development.
(1) South Africa Energy Coal FY21 reflects 11 months.(2) Volumes and prices do not include any third party trading that may be undertaken independently of equity production.(3) Operating unit cost is Revenue less Underlying EBITDA, excluding third party sales, divided by sales volumes.(4) South Africa Energy Coal Revenue includes domestic and export sales Revenue.
48S
outh
32 A
nnua
l Rep
ort
2021
Op
erat
ing
and
Fin
anci
al R
evie
w

ILLAWARRA METALLURGICAL COALLocation: New South Wales, Australia
South32 share: 100%
Located in the southern coalfields of New South Wales, Illawarra Metallurgical Coal is 100 per cent owned by South32 and operates two underground metallurgical coal mines, Appin mine and Dendrobium mine, and West Cliff and Dendrobium coal preparation plants. Illawarra Metallurgical Coal also manages the Port Kembla Coal Terminal (PKCT) on behalf of a consortium of partners. Illawarra Metallurgical Coal produces premium-quality, hard coking coal for steelmaking and energy coal.
Operational emissions from Illawarra Metallurgical Coal are predominantly from the release of gases from the underground coal seams during mining operations and our decarbonisation activities are focused on increasing the efficiency of gas drainage and assessing technologies for reducing ventilation air methane.
South32 share FY21 FY20
Metallurgical coal production (kt) 6,170 5,549Energy coal production (kt) 1,475 1,457Metallurgical coal sales (kt)(1) 6,074 5,842Energy coal sales (kt)(1) 1,542 1,442Realised metallurgical coal sales price (US$/t) 115 145Realised energy coal sales price (US$/t) 40 51Operating unit cost (US$/t)(2) 87 93
South32 share (US$M) FY21 FY20
Revenue(3) 758 924Underlying EBITDA 94 243Underlying EBIT (103) 52Net operating assets 612 1,356Capital expenditure 188 199
Safe and reliable 151 181Improvement and life extension 37 18
Exploration expenditure 14 16Exploration expensed 5 7Community investment 1.0 0.7
SafetyTRIF was 19.6 for Illawarra Metallurgical Coal in FY21, a 16 per cent increase year-on-year.
VolumesIllawarra Metallurgical Coal production increased by nine per cent (or 639kt) to 7.6Mt in FY21 as the operation’s return to a three longwall configuration delivered greater efficiencies through the use of alternate dual longwalls at the Appin mine, and we monetised low-margin coal wash.
Operating costsOperating unit costs decreased by six per cent in FY21 to US$87/t as the operation benefitted from increased sales volumes, including the monetisation of low-margin coal wash material, and a favourable movement in finished goods inventory that more than offset a stronger Australian dollar.
Financial performanceUnderlying EBIT decreased by US$155 million in FY21 to a loss of US$103 million as lower average realised prices (-US$205 million) and a stronger Australian dollar (-US$56 million), more than offset the benefits of a favourable movement in finished goods inventory (+US$70 million) and increased sales volumes (+US$39 million).
Capital expenditure Safe and reliable capital expenditure decreased by US$30 million in FY21 to US$151 million as our rate of spend on underground development (FY21: US$77 million) and the substantial investment made to support a return to a three longwall configuration returned to historical levels.
Improvement and life extension capital expenditure increased by US$19 million to US$37 million as we incurred pre-commitment spend on studies and critical path items for the DND project. During Q3 FY21 the IPC refused our application for the DND project (as per page 17). We have scaled back activity on the project while we consider alternative options following the IPC decision.
Community investmentWe invested US$1.0 million in communities around Illawarra Metallurgical Coal in FY21, with a focus on education, health, community support and services, and local economic development.
(1) Volumes and prices do not include any third party trading that may be undertaken independently of equity production.(2) Operating unit cost is Revenue less Underlying EBITDA, excluding third party sales, divided by sales volumes.(3) Illawarra Metallurgical Coal Revenue includes metallurgical coal and energy coal sales Revenue.
49S
outh32 Annual R
eport 2021
Op
erating and
Financial Review

Financial and operational performance summary continued
AUSTRALIA MANGANESELocation: Northern Territory and Tasmania, Australia
South32 share: Ore - 60%, Alloy - 60% divested
Australia Manganese consists of GEMCO in the Northern Territory. South32 owns 60 per cent of GEMCO and Anglo American Plc holds the remaining 40 per cent. The TEMCO manganese alloys smelter (TEMCO) was wholly owned by GEMCO until the completion of its divestment with an effective date for accounting purposes of 31 December 2020.
GEMCO is an open-cut strip mining operation, producing high-grade manganese ore and is located in close proximity to Asian export markets.
South32 share FY21(1) FY20
Manganese ore production (kwmt) 3,529 3,470Manganese alloy production (kt) 51 110Manganese ore sales (kwmt) 3,621 3,440
External customers 3,506 3,300TEMCO 115 140
Manganese alloy sales (kt) 59 116Realised external manganese ore sales price (US$/dmtu, FOB)(2)(3) 4.13 4.39Realised manganese alloy sales price (US$/t)(2) 958 940Ore Operating unit cost (US$/dmtu)(3)(4) 1.52 1.55Alloy Operating unit cost (US$/t)(4) 1,034 905
South32 share (US$M) FY21(1) FY20
Revenue(5) 730 763Manganese ore 685 668Manganese alloy 57 109Intra-segment elimination (12) (14)
Underlying EBITDA 385 400Manganese ore 389 396Manganese alloy (4) 4
Underlying EBIT 304 328Manganese ore 308 329Manganese alloy (4) (1)
Net operating assets 234 242Manganese ore 234 293Manganese alloy - (51)
Capital expenditure 55 67Safe and reliable 53 64Improvement and life extension 2 3
Exploration expenditure 2 2Exploration expensed 1 1Community investment 1.7 1.1
SafetyTRIF was 6.3 for GEMCO in FY21, a 11 per cent increase year-on-year.
VolumesAustralia Manganese saleable ore production increased by two per cent (or 59kwmt) to a record 3,529kwmt in FY21 despite the impact of higher than average rainfall during the wet season. The primary concentrator continued to achieve strong output as we drew down previously established run of mine stocks, while output from the PC02 circuit remained above nameplate capacity, contributing 10 per cent of total production (FY20: 12 per cent).
Manganese alloy saleable production decreased by 54 per cent (or 59kt) to 51kt in FY21 as we completed the divestment of TEMCO.
Operating costsFOB manganese ore Operating unit costs decreased by two per cent in FY21 to US$1.52/dmtu as the operation benefitted from higher sales volumes due to improved equipment productivity and lower planned maintenance, that more than offset the impact of a stronger Australian dollar.
Financial performanceManganese ore Underlying EBIT decreased by six per cent (or US$21 million) in FY21 to US$308 million as a stronger Australian dollar (-US$21 million), lower realised prices (-US$21 million) and higher customer freight rates (-US$11 million) were partially offset by increased sales volumes (+US$40 million) and reduced maintenance expenditure (+US$3 million).
Manganese alloy Underlying EBIT decreased by US$3 million in FY21 to a loss of US$4 million as we completed the divestment of TEMCO.
Capital expenditure Capital expenditure decreased by US$12 million in FY21 to US$55 million as we completed non-processing infrastructure upgrades at GEMCO and divested TEMCO during the year.
Community investmentWe invested US$1.6 million in communities around GEMCO and TEMCO in FY21, with a focus on supporting economic development, education and health programs for Aboriginal and Torres Strait Islander peoples at GEMCO and local education, economic development and community wellbeing at TEMCO.
(1) Reflects the effective completion date for the sale of TEMCO for accounting purposes of 31 December 2020.(2) Realised ore prices are calculated as external sales Revenue less freight and marketing costs, divided by external sales volume. Realised alloy prices are calculated as sales
Revenue, including sinter Revenue, divided by alloy sales volume. Ore converted to sinter and alloy, and sold externally, is eliminated as an intracompany transaction.(3) Manganese Australia FY21 average manganese content of external ore sales was 44.4 per cent on a dry basis (FY20: 44.6 per cent). 97 per cent of FY21 external manganese
ore sales (FY20: 95 per cent) were completed on a CIF basis. FY21 realised FOB ore prices and Operating unit costs have been adjusted for freight and marketing costs of US$63 million (FY20: US$46 million).
(4) FOB ore operating unit cost is Revenue less Underlying EBITDA, freight and marketing costs, divided by ore sales volume. Alloy operating unit cost is Revenue less Underlying EBITDA divided by alloy sales volumes and includes costs associated with sinter sold externally.
(5) Revenues associated with sales from GEMCO to TEMCO are eliminated as part of the consolidation.
50S
outh
32 A
nnua
l Rep
ort
2021
Op
erat
ing
and
Fin
anci
al R
evie
w

SOUTH AFRICA MANGANESELocation: Northern Cape and Gauteng, South Africa
South32 share: Ore - 44.4%, Alloy - 60%
South Africa Manganese consists of two manganese mines and the Metalloys manganese alloy smelter which was placed on care and maintenance in FY20.
Hotazel Manganese Mines (HMM) is located in the Kalahari Basin. South32 holds a 60 per cent interest in Samancor Holdings (Pty) Ltd and Anglo American Plc holds the remaining 40 per cent. Samancor indirectly owns 74 per cent of HMM, which gives South32 its ownership interest of 44.4 per cent. The remaining 26 per cent of HMM is owned by B-BBEE entities.
South32 holds an effective 60 per cent interest in Samancor Manganese (Pty) Ltd (Metalloys manganese smelter).
South32 share FY21 FY20
Manganese ore production (kwmt) 2,264 1,878Manganese alloy production (kt) - 53Manganese ore sales (kwmt) 2,236 1,865
External customers 2,236 1,772Metalloys - 93
Manganese alloy sales (kt) 11 55Realised external manganese ore sales price (US$/dmtu, FOB)(1)(2) 3.53 3.76Realised manganese alloy sales price (US$/t) 648 909Ore Operating unit cost (US$/dmtu)(2)(3) 2.48 2.25Alloy Operating unit cost (US$/t)(3) N/A 1,364
South32 share (US$M) FY21 FY20
Revenue(4) 369 342Manganese ore(5) 362 305Manganese alloy 7 50Intra-segment elimination - (13)
Underlying EBITDA 72 81Manganese ore(5) 92 106Manganese alloy (20) (25)
Underlying EBIT 55 54Manganese ore(5) 75 88Manganese alloy (20) (34)
Net operating assets 182 237Manganese ore(5) 242 281Manganese alloy (60) (44)
Capital expenditure 16 23Safe and reliable 16 22Improvement and life extension - 1
Exploration expenditure 1 1Exploration expensed 1 1Community investment 2.1 2.3
SafetyTRIF was 1.8 for HMM in FY21, a 22 per cent decrease year-on-year.
VolumesSouth Africa Manganese saleable ore production increased by 21 per cent (or 386kwmt) to 2,264kwmt in FY21 as the operation recovered from an extended shutdown in response to COVID-19 restrictions and subdued market conditions in the prior year.
We did not produce any manganese alloy in FY21 as our Metalloys manganese alloy smelter remained on care and maintenance.
Operating costsFOB manganese ore Operating unit costs increased by 10 per cent in FY21 to US$2.48/dmtu as the operation lifted volumes, increasing its use of higher cost trucking in response to market demand. Prior period costs had benefitted from the impact of a one-off royalty tax credit settled in FY20.
Financial performanceManganese ore Underlying EBIT decreased by 15 per cent (or US$13 million) in FY21 to US$75 million as a six per cent reduction in average realised prices (-US$14 million), higher customer freight rates (-US$43 million) and the recognition of royalty tax credit in the prior period (-US$13 million) were partially offset by increased sales volumes (+US$84 million).
Manganese alloy Underlying EBIT improved by US$14 million in FY21, to a loss of US$20 million, as we incurred one-off costs associated with the smelter’s placement on care and maintenance.
Notwithstanding the decline in index prices, our average realised price for external sales of South African ore was a two per cent premium to the medium grade 37 per cent manganese lump ore index (FOB Port Elizabeth, South Africa) in FY21. This followed adjustments to our product mix, with our lower quality fines product making up a smaller proportion of total sales (FY21: 7 per cent, FY20: 13 per cent).
Capital expenditureSafe and reliable capital expenditure decreased by US$6 million in FY21 to US$16 million despite continued investment in asset integrity projects and the replacement of mobile equipment.
Community investmentWe invested US$2.1 million in communities around South Africa Manganese in FY21, with a focus on education, health and local economic development.
(1) Volumes and prices do not include any third party trading that may be undertaken independently of equity production. Realised ore prices are calculated as external sales Revenue less freight and marketing costs, divided by external sales volume. Ore converted to alloy, and sold externally, is eliminated as an intracompany transaction. Manganese ore sales are grossed-up to reflect a 60 per cent accounting effective interest.
(2) Manganese South Africa FY21 average manganese content of external ore sales was 39.9 per cent on a dry basis (FY20: 40.1 per cent). 76 per cent of FY21 external manganese ore sales (FY20: 72 per cent) were completed on a CIF basis. FY21 realised FOB ore prices and Operating unit costs have been adjusted for freight and marketing costs of US$55 million (FY20: US$33 million).
(3) FOB ore Operating unit cost is Revenue less Underlying EBITDA, freight and marketing costs, divided by ore sales volume. Alloy Operating unit cost is Revenue less Underlying EBITDA divided by alloy sales volumes.
(4) Revenues associated with sales from Hotazel Manganese Mines (HMM) to Metalloys are eliminated as part of the consolidation.(5) Consistent with the presentation of South32’s segment information, South Africa Manganese ore production and sales have been reported at 60 per cent. South32 has a 44.4
per cent ownership interest in HMM. 26 per cent of HMM is owned by a B-BBEE consortium comprising Ntsimbintle Mining (nine per cent), NCAB Resources (seven per cent), Iziko Mining (five per cent) and HMM Education Trust (five per cent). The interests owned by NCAB Resources, Iziko Mining and HMM Education Trust were acquired using vendor finance with the loans repayable via distributions attributable to these parties, pro rata to their share in HMM. Until these loans are repaid, South32’s interest in HMM is accounted at 54.6 per cent.
51S
outh32 Annual R
eport 2021
Op
erating and
Financial Review

CERRO MATOSOLocation: Córdoba, Colombia
South32 share: 99.9%
Financial and operational performance summary continued
Cerro Matoso is an integrated nickel laterite mine and smelter located in the Cordoba area of northern Colombia, consisting of a truck and shovel open-cut mine and a processing plant. South32 owns 99.9 per cent of Cerro Matoso. Current and former employees own 0.02 per cent, with the balance of shares held in a reserve account following a buy-back.
Cerro Matoso is a major producer of nickel contained in ferronickel which is used to make stainless steel. Ore mined is blended with ore from stockpiles, which is then dried in rotary kilns and smelted in two electric arc furnaces where ferronickel is produced.
In FY21 we approved the low capital Q&P project, which will contribute higher feed grades, and the Ore Sorting and Mechanical Ore Concentration Project (OSMOC), which is expected to maintain payable nickel production by offsetting natural grade decline beyond FY23.
South32 share FY21 FY20
Ore mined (kwmt) 3,238 2,839Ore processed (kdmt) 2,385 2,761Ore grade processed (%, Ni) 1.63 1.65Payable nickel production (kt) 34.1 40.6Payable nickel sales (kt) 33.5 40.6Realised nickel sales price (US$/lb) 6.68 5.80Operating unit cost (US$/lb)(1) 4.01 3.69Operating unit cost (US$/t)(2) 124 120
South32 share (US$M) FY21 FY20
Revenue 493 519Underlying EBITDA 197 189Underlying EBIT 122 107Net operating assets 405 425Capital expenditure 45 39
Safe and reliable 30 30Improvement and life extension 15 9
Exploration expenditure - 4Exploration expensed - 2Community investment 3.3 3.8
SafetyTRIF was 5.7 for Cerro Matoso in FY21, a 54 per cent increase year-on-year.
VolumesCerro Matoso payable nickel production decreased by 16 per cent (or 6.5kt) to 34.1kt in FY21 following a major furnace refurbishment in Q2 and Q3 FY21.
Operating costs Operating unit costs increased by nine per cent in FY21 to US$4.01/lb despite a weaker Colombian peso, as the furnace refurbishment contributed to a 17 per cent decline in sales volumes.
Financial performanceUnderlying EBIT increased by 14 per cent (or US$15 million) in FY21 to US$122 million, with the extended furnace shut lowering sales volumes (-US$91 million), more than offset by a 15 per cent rise in the average realised nickel price (+US$65 million), lower energy usage (+US$16 million), a weaker Colombian peso (+US$7 million) and lower depreciation (+US$7 million).
Capital expenditure Safe and reliable capital expenditure was unchanged in FY21 at US$30 million. Improvement and life extension capital expenditure increased by US$6 million to US$15 million in FY21 as we invested in the Q&P and OSMOC projects.
Community investmentWe invested US$3.3 million in communities around Cerro Matoso in FY21, with a focus on providing access to land for ethnic communities, supporting education and community housing.
(1) Operating unit cost is Revenue less Underlying EBITDA, excluding third party sales, divided by sales volumes. (2) Cerro Matoso Operating unit cost per tonne is Revenue less Underlying EBITDA divided by ore processed. Periodic movements in finished product inventory may impact
Operating unit costs as related marketing costs may change.
52S
outh
32 A
nnua
l Rep
ort
2021
Op
erat
ing
and
Fin
anci
al R
evie
w

CANNINGTONLocation: Queensland, Australia
South32 share: 100%
Located in north-west Queensland, Cannington is 100 per cent owned by South32 and is one of the world’s largest producers of silver and lead.
Cannington consists of an underground hard rock mine and surface processing facility, a road-to-rail transfer facility and a concentrate handling and ship loading facility at the Port of Townsville.
Silver, lead and zinc are extracted from the ore using grinding, sequential flotation and leaching techniques that produce high-grade, marketable lead and zinc concentrates with a high silver content.
We expect to transition to a 100% truck haulage operation in Q4 FY22.
South32 share FY21 FY20
Ore mined (kwmt) 2,819 2,792Ore processed (kdmt) 2,746 2,839Ore grade processed (g/t, Ag) 185 156Ore grade processed (%, Pb) 5.7 4.7Ore grade processed (%, Zn) 3.5 3.3Payable zinc equivalent production (kt)(1) 380.2 332.6Payable silver production (koz) 13,655 11,792Payable lead production (kt) 131.8 110.4Payable zinc production (kt) 67.7 66.7Payable silver sales (koz) 13,736 12,109Payable lead sales (kt) 131.7 108.1Payable zinc sales (kt) 69.0 68.7Realised silver sales price (US$/oz) 25.4 16.5Realised lead sales price (US$/t) 1,862 1,648Realised zinc sales price (US$/t) 2,357 1,416Operating unit cost (US$/t ore processed)(2) 124 113
South32 share (US$M) FY21 FY20
Revenue 757 476Underlying EBITDA 416 155Underlying EBIT 350 105Net operating assets 195 214Capital expenditure 43 52
Safe and reliable 41 52Improvement and life extension 2 -
Exploration expenditure 2 4Exploration expensed 2 4Community investment 0.4 0.5
SafetyTRIF was 7.2 for Cannington in FY21, a 148 per cent increase year-on-year.
VolumesCannington payable zinc equivalent production increased by 14 per cent (or 47.6kt) to 380.2kt in FY21. Strong underground mine performance supported the acceleration of a higher-grade mining sequence, which was extracted in Q4 FY21.
Operating costsOperating unit costs increased by 10 per cent to US$124/t in FY21 as a stronger Australian dollar, and lower mill throughput following the prior period’s draw down of inventory, were partially offset by efficiencies in consumables usage and energy spend.
Financial performanceUnderlying EBIT increased by 233 per cent (or US$245 million) in FY21 to US$350 million as higher average realised prices (+US$215 million), increased sales volumes (+US$66 million), and efficiencies in consumables usage and energy spend (+US$7 million), were partially offset by a stronger Australian dollar (-US$28 million) and higher price-linked royalties (-US$12 million).
Capital expenditureCapital expenditure decreased by US$9 million in FY21 to US$43 million as we lowered our rate of investment in underground development and additional tailings storage capacity in accordance with our capital plan for the operation.
Community investmentWe invested US$0.4 million in communities around Cannington in FY21, with a focus on education, community wellbeing and social infrastructure.
(1) Payable zinc equivalent (kt) was calculated by aggregating revenues from payable silver, lead and zinc, and dividing the total Revenue by the price of zinc. FY20 realised prices for zinc (US$1,416/t), lead (US$1,648/t) and silver (US$16.5/oz) have been used for FY20 and FY21.
(2) Cannington Operating unit cost is Revenue less Underlying EBITDA divided by ore processed. Periodic movements in finished product inventory may impact Operating unit costs as related marketing costs may change.
53S
outh32 Annual R
eport 2021
Op
erating and
Financial Review

Financial and operational performance summary continued
Third party product salesThe Group differentiates the sale of its production from the sale of third party products due to a significant difference in profit margin earned on these sales. The table below shows the breakdown between the Group’s production and third party products:
US$M FY21 FY20
Group ProductionRevenue 5,837 5,492Related operating costs (net of other income) (5,162) (5,237)Group production Underlying EBIT 675 255Margin on Group production 11.6% 4.6%Third party products Revenue 500 583Related operating costs (net of other income)(1) (479) (600)Third party Underlying EBIT 21 (17)Margin on third party products 4.2% (2.9%)
(1) Includes depreciation and amortisation.
The Group engages in third party trading for the following reasons:
– To ensure a consistent supply of materials to its customers;
– As a result of production variability and occasional shortfalls from the Group’s operations; and
– To enhance value through product blending and supply chain optimisation.
Outlook
ProductionIn FY21 we achieved record production at Worsley Alumina, Brazil Alumina and Australia Manganese while beating our initial market guidance at South Africa Manganese, Cerro Matoso and Cannington. While remaining subject to further potential impacts from COVID-19, FY22 guidance is unchanged with the exception of non-operated Brazil Alumina and our underground base metals operation Cannington. Separately, volumes at Mozal Aluminium and Cerro Matoso are expected to lift from FY21 following our investment in high returning improvement projects to increase production into currently favourable markets for aluminium and nickel.
Production guidance (South32’s share)(1)
FY21 FY22e(2) FY23e(2) Key guidance assumptions
Worsley Alumina Alumina production (kt) 3,963 3,965 4,000 The refinery is expected to maintain nameplate capacity in FY22 and
target creep into FY23.Brazil Alumina (non-operated)Alumina production (kt) 1,398 ↓1,300 1,395 Repair work on one of the two bauxite ship unloaders which was
damaged subsequent to the end of the period is expected to impact production in H1 FY22.
Production volumes are expected to recover in FY23, increasing by seven per cent as the refinery returns to normalised rates.
Hillside AluminiumAluminium production (kt) 717 720 720 Smelter to continue to test its maximum technical capacity.
Guidance remains subject to load-shedding.Mozal AluminiumAluminium production (kt) 265 273 273 Expected to realise the benefits of the AP3XLE energy efficiency
project in FY22 with production expected to increase three per cent.
Guidance remains subject to load-shedding.Illawarra Metallurgical CoalTotal coal production (kt) 7,645 7,300 7,500 Total saleable coal production is expected to decline by five per cent
to 7.3Mt in FY22 with fewer planned sales of low-margin coal wash material. Metallurgical coal volumes are expected to increase by two per cent to 6.3Mt, despite an additional longwall move (three in total) being scheduled.
The operation is expected to produce 7.5Mt in FY23 with metallurgical coal volumes increasing by a further five per cent to 6.6Mt.
Metallurgical coal production (kt) 6,170 6,300 6,600Energy coal production (kt) 1,475 1,000 900
Australia ManganeseManganese ore production (kwmt) 3,529 3,500 3,400 Our low cost PC02 circuit is expected to continue to operate above
nameplate capacity, supporting secondary product volumes and production levels commensurate with FY21’s record rate.
54S
outh
32 A
nnua
l Rep
ort
2021
Op
erat
ing
and
Fin
anci
al R
evie
w

FY21 FY22e(2) FY23e(2) Key guidance assumptions
South Africa ManganeseManganese ore production (kwmt) 2,264 2,200 Subject to
demandPlanned production volumes are predicated on market conditions remaining attractive for the sale of lower quality fines product and our use of higher cost trucking.
FY23 guidance subject to market demand.Cerro MatosoOre to kiln (kt) 2,385 2,850 2,850 Production is expected to increase by 28 per cent in FY22 and remain
steady in FY23 as the operation benefits from the refurbishment of one of its furnaces and receives its first full year of ore from the higher grade Q&P project.
Payable nickel production (kt) 34.1 43.8 43.5
CanningtonOre processed (kdmt) 2,746 ↑2,750 2,850 Production is expected to benefit from the operation’s planned
transition to 100 per cent truck haulage in Q4 FY22 and the continuation of underground mine efficiencies that supported production growth in FY21.
Payable zinc equivalent production (kt)(3)
319.0 ↑278.3 313.9
Payable silver production (koz) 13,655 ↑11,647 13,500Payable lead production (kt) 131.8 ↑112.6 122.0Payable zinc production (kt) 67.7 ↑63.9 72.0
(1) South32’s ownership share of operations is as per footnote (3) on page 40.(2) The denotation (e) refers to an estimate or forecast year.(3) Payable zinc equivalent (kt) was calculated by aggregating revenues from payable silver, lead and zinc, and dividing the total Revenue by the price of zinc. FY21 realised prices
for zinc (US$2,357/t), lead (US$1,862/t) and silver (US$25.4/oz) have been used for FY21, FY22e and FY23e.
Costs and capital expenditureWe continue to pursue cost and volume efficiencies across our business to offset the impact of stronger producer currencies and cyclical inflation in labour, price-linked royalties and raw materials. While these factors are expected to have an effect on unit costs, steepening industry cost curves, our business is well placed to realise volume improvements and pursue productivity benefits to partially offset their impact, and capture additional margins from improved market conditions. Although Operating unit cost guidance is not provided for our aluminium smelters, their cost profile will continue to be influenced by the South African rand and the price of raw material inputs.
Operating unit cost performance and guidance(1)(2)
FY20 FY21 FY22e(3)(4) Commentary
Worsley Alumina
(US$/t) 210 214 241
FY20 versus FY21: Record volumes, lower caustic soda prices and reduced spend on contractors more than offset by a stronger Australian dollar and higher caustic usage rates.
FY22 key guidance assumptions: Higher caustic soda prices, price-linked freight and a planned transition to a higher cost mining area.
Brazil Alumina (non-operated)
(US$/t)
244
203
Not provided
FY20 versus FY21: Record volumes, lower bauxite costs (usage and prices), and the recognition of one-off historical tax credits (-US$12/t) during the period.
FY22 key guidance assumptions: Not provided but expected to be impacted by lower sales volumes, higher bauxite costs and prior year’s one-off tax credit. Incremental costs are also expected due to the bauxite ship unloader failure subsequent to the end of the period.
Hillside Aluminium
(US$/t) 1,531 1,631 Not provided
FY20 versus FY21: Higher power charges and a stronger South African rand, partially offset by lower raw material input costs.
FY22 key guidance assumptions: Not provided but we expect the cost profile to continue to be influenced by the South African rand, price of raw material inputs and a planned increase in pot relining.
Mozal Aluminium
(US$/t) 1,785 1,702 Not provided
FY20 versus FY21: Stronger South African rand, more than offset by lower raw material input costs.
FY22 key guidance assumptions: Not provided but we expect the cost profile to continue to be influenced by the South African rand and the price of raw material inputs.
Illawarra Metallurgical Coal
(US$/t)
93
87
101
FY20 versus FY21: Higher volumes from the return to a three longwall configuration and our monetisation of low-margin coal wash material.
FY22 key guidance assumptions: Fewer planned sales of low-margin coal wash material, higher price-linked royalties, incremental maintenance activity and longwall moves.
Production guidance (South32’s share)(1) continued
55S
outh32 Annual R
eport 2021
Op
erating and
Financial Review

Financial and operational performance summary continued
FY20 FY21 FY22e(3)(4) Commentary
Australia Manganese ore (FOB)
(US$/dmtu)
1.55
1.52
1.68
FY20 versus FY21: Record volumes from improved equipment productivity and lower planned maintenance.
FY22 key guidance assumptions: Stronger Australian dollar, an expected decline in product yield and a planned increase in strip ratio.
South Africa Manganese ore (FOB)
(US$/dmtu)
2.25
2.48
2.57
FY20 versus FY21: Additional costs from the use of higher cost, opportunistic trucking, to maximise margins.
FY22 key guidance assumptions: Stronger South African rand and increased trucking costs partially offset by labour efficiencies.
Cerro Matoso
(US$/t)(5)
(US$/lb)
120
3.69
124
4.01
141
4.12
FY20 versus FY21: Lower volumes (-16 per cent) as we completed a major furnace refurbishment in the year.
FY22 key guidance assumptions: Increased sales volumes more than offset by higher price-linked royalties and electricity prices.
Cannington
(US$/t)(6) 113 124 121
FY20 versus FY21: Lower mill throughput, following the prior year’s drawdown of inventory and a stronger Australian dollar, partially offset by efficiencies in our consumables usage and energy spend.
FY22 key guidance assumptions: Higher throughput, production efficiencies and the impact of inventory movements more than offset a stronger Australian dollar.
(1) South32’s ownership share of operations is as per footnote (3) on page 40.(2) Operating unit cost is Revenue less Underlying EBITDA, excluding third party sales, divided by sales volumes. Operating cost is Revenue less Underlying EBITDA excluding third
party sales.(3) FY22 Operating unit cost guidance includes royalties (where appropriate) and the influence of exchange rates, and includes various assumptions for FY22, including: an
alumina price of US$289/t; an average blended coal price of US$140/t for Illawarra Metallurgical Coal; a manganese ore price of US$4.79/dmtu for 44 per cent manganese product; a nickel price of US$7.93/lb; a silver price of US$25.84/troy oz; a lead price of US$2,165/t (gross of treatment and refining charges); a zinc price of US$2,846/t (gross of treatment and refining charges); an AUD:USD exchange rate of 0.75; a USD:ZAR exchange rate of 15.00; a USD:COP exchange rate of 3,650; and a reference price for caustic soda; all of which reflected forward markets as at June 2021 or our internal expectations.
(4) The denotation (e) refers to an estimate or forecast year.(5) US dollar per tonne of ore to kiln. Periodic movements in finished product inventory may impact Operating unit costs.(6) US dollar per tonne of ore processed. Periodic movements in finished product inventory may impact Operating unit costs.
Capital expenditureOur investment in Safe and reliable capital expenditure, excluding equity accounted investments, is expected to increase by US$62 million to US$410 million in FY22 as we upgrade coal clearance and ventilation infrastructure at Illawarra Metallurgical Coal’s Appin mine and establish additional bauxite residue disposal capacity at Brazil Alumina.
Improvement and life extension capital expenditure, excluding equity accounted investments, is expected to decrease by US$46 million to US$70 million in FY22 reflecting a reduction in spend attributable to South Africa Energy Coal (US$53 million) following its divestment. While we expect to maintain some activity at our DND project in FY22, this is expected to be lower than our rate of spend in FY21. Partially offsetting these reductions, we expect to increase our investment in decarbonisation projects, processing improvements and new mining area access at Worsley Alumina and projects at Cerro Matoso to further lift volumes beyond FY23.
Growth capital expenditure of US$45 million is expected at our Hermosa project in H1 FY22 as we progress the Taylor pre-feasibility study. Guidance excludes our expectation for investment in orebody dewatering and other critical path activities for the potential development of the Taylor Deposit in FY22 that remain subject to internal approvals.
Capital expenditure at our Manganese operations is expected to increase by US$24 million to US$95 million in FY22 as we invest in mine life extension projects at GEMCO’s Eastern Leases and rail infrastructure upgrades in South Africa.
Operating unit cost performance and guidance(1)(2) continued
56S
outh
32 A
nnua
l Rep
ort
2021
Op
erat
ing
and
Fin
anci
al R
evie
w

Capital expenditure guidance (South32’s share)(1)(2)
US$M FY20 FY21 FY22e(3)
Worsley Alumina 44 51 43Brazil Alumina 33 25 54Hillside Aluminium 12 17 22Mozal Aluminium 11 10 10South Africa Energy Coal 42 23 -Illawarra Metallurgical Coal 181 151 215Cerro Matoso 30 30 23Cannington 52 41 43Safe and reliable capital expenditure (excluding equity accounted investments) 405 348 410Worsley Alumina 4 4 18South Africa Energy Coal 122 53 -Illawarra Metallurgical Coal – Dendrobium Next Domain 18 37 15Cerro Matoso 9 15 20Other operations 3 7 17Improvement and life extension capital expenditure (excluding equity accounted investments) 156 116 70Hermosa 104 64 45(4)
Eagle Downs 11 8 -Growth capital expenditure 115 72 45Total capital expenditure (excluding equity accounted investments) 676 536 525Total capital expenditure (including equity accounted investments) 766 607 620
Equity accounted investments capital expenditure guidance (South32’s share)(1)(2)
US$M FY20 FY21 FY22e(3)
Australia Manganese 64 53 47South Africa Manganese 22 16 18Safe and reliable capital expenditure (equity accounted investments) 86 69 65Australia Manganese 3 2 10South Africa Manganese 1 - 20Improvement and life extension capital expenditure (equity accounted investments) 4 2 30Total capital expenditure (equity accounted investments) 90 71 95
(1) South32’s ownership share of operations is as per footnote (3) on page 40.(2) Total capital expenditure comprises Capital expenditure and evaluation expenditure. Capital expenditure comprises Safe and reliable capital expenditure (Deferred stripping,
Regulatory compliance, Risk reduction, and Sustained performance), Improvement (Decarbonisation) and Life extension capital expenditure, and Growth (development of our current and future greenfields growth) capital expenditure.
(3) The denotation (e) refers to an estimate or forecast year.(4) Guidance for Hermosa Growth capital expenditure reflects H1 FY22.
Other expenditure guidanceGroup and unallocated costs, excluding greenfield exploration, are expected to reduce by US$13 million to US$100 million in FY22 following the recognition of one-off charges in H2 FY21. We remain on-track to deliver US$50 million in annualised savings from FY22 (compared to FY20), as we further simplify the Group’s functional structures and footprint.
Underlying net finance costs (excluding equity accounted investments) are expected to decrease by US$42 million to approximately US$110 million in FY22 following our divestment of South Africa Energy Coal and resultant reduction in the Group’s closure and rehabilitation provisions.
We have a prospective portfolio of greenfield exploration partnerships targeting base metals in Australia, the Americas and Europe. FY22 guidance for greenfield exploration expenditure to progress these early stage projects is US$26 million (FY21: US$18 million). In addition, we expect to capitalise US$44 million of exploration expenditure in FY22 (FY21: US$30 million), including US$25 million at our Hermosa project (FY21: US$16 million).
Depreciation and amortisation, and tax expenseDepreciation and amortisation (excluding equity accounted investments) is expected to reduce by US$90 million to approximately US$630 million in FY22 following our divestment of South Africa Energy Coal and the recognition of an impairment to our Illawarra Metallurgical Coal operation. Depreciation and amortisation for our manganese equity accounted investments is expected to increase by US$15 million to US$113 million in FY22.
The Group’s Underlying ETR, while a significant reduction from the prior year, remained elevated during FY21 due to the de-recognition of tax assets associated with losses at South Africa Energy Coal prior to its divestment. From FY22 we expect the rate to more closely reflect the corporate tax rates of the geographies where the Group operates.
57S
outh32 Annual R
eport 2021
Op
erating and
Financial Review

Board of Directors
During her career, Ms Wood has attained executive and leadership skills which she brings to her role as Chair of South32. She has comprehensive experience in public policy, social performance, community, people, remuneration and regulatory and legal compliance.
She has held various senior global leadership roles with BHP, including Group Company Secretary, Chief People Officer and President Corporate Affairs. She was a member of BHP’s leadership team and served as Chair of The Global Ethics Advisory Panel, the Disclosure Committee and as Chief Governance Officer.
Ms Wood gained extensive expertise as a key adviser to BHP’s Board and CEO on matters of governance, composition of leadership teams, development and succession planning, organisational design and culture, remuneration structures and stakeholder relations. Following the merger between BHP Limited and Billiton plc in 2001, she established the multi-jurisdictional governance framework for the merged entity. Ms Wood joined BHP as Group Company Secretary in 2001 and retired in 2014.
Before joining BHP, Ms Wood held the role of General Counsel and Company Secretary with Bonlac Foods Limited.
Ms Wood’s governance experience is broadened by her membership of the Takeovers Panel (Australia) from 2000 to 2012 and her roles with the Australian Securities and Investment Commission (Business Consultative Panel) and the Australian Federal Government's Business Regulatory Advisory Group.
Following her retirement from BHP, Ms Wood chaired the BHP Foundation, where she oversaw grant provisions for not-for-profit organisations to deliver large, long-term global programs in the areas of natural resource governance, human capability and social inclusion, and conserving and sustainably managing natural environments.
She is currently a Non-Executive Director of Djerriwarrh Investments Limited (and member of the Audit Committee and the Investment Committee), a member of Chief Executive Women, member of the 30% Club Australia and a Fellow of Monash University.
Current ASX listed directorships: – Djerriwarrh Investments Limited: Independent Non-Executive
Director since July 2016.
Other Directorships and Offices: – Board Member and Member of the Audit & Risk Management and
Appointments and Remuneration Committees, State Library of Victoria;
– Council Member, State Library of Victoria Foundation Council; – Director, Robert Salzer Foundation; and – Member, Business Council of Australia (Chairman’s Group).
Mr Kerr has been our Chief Executive Officer since October 2014 and is responsible for running all parts of our business. He led South32 through the Demerger from BHP in 2015 and its public listing in three countries and has overseen the development and implementation of our strategy.
Mr Kerr is passionate about health, safety and sustainability, with a strong track record in global resource development. He joined BHP in 1994 and was appointed Chief Financial Officer in November 2011. Previously, Mr Kerr was President of Diamonds and Specialty Products and worked in a wide range of operational and commercial roles across BHP.
As President of Diamonds and Specialty Products, Mr Kerr was accountable for the Ekati Diamond Mine in Canada, the Richards Bay Minerals Joint Venture in South Africa, diamonds exploration in Angola, the Corridor Sands Project in Mozambique and the development of BHP’s potash portfolio in Canada. Prior to that, Mr Kerr held the positions of Chief Financial Officer Stainless Steel Materials, Vice President Finance Diamonds and Finance Director for the Canadian Diamonds Company, all for BHP. In 2004, Mr Kerr left BHP for a two-year period when he was General Manager Commercial for Iluka Resources Ltd.
Mr Kerr holds a Business degree from Edith Cowan University and studied at Deakin University to become a Certified Practicing Accountant.
Other Directorships and Offices: – Chair, CEOs for Gender Equity.
Ms Karen Wood BEd, LLB (Hons), 65Chair and Independent Non-Executive DirectorAppointed 1 November 2017 (Chair from 12 April 2019)
Chair of the Nomination and Governance CommitteeLocation: Australia
Mr Graham Kerr BBus, FCPA, 50Chief Executive Officer since October 2014 Managing Director, appointed 21 January 2015
Location: Australia
58S
outh
32 A
nnua
l Rep
ort
2021
Gov
erna
nce

Mr Cooper’s combined experience gives him a good understanding of the challenges of operating in different cultural and political environments. He brings this to South32, alongside a strong focus on organisational philosophy, values and standards.
Mr Cooper is a chartered accountant with over 40 years of experience in the finance and accounting profession. His prior appointments include Partner at Ernst & Young, Partner at PricewaterhouseCoopers, and Managing Partner for Arthur Andersen in Perth, during which time he specialised in the mining, energy and utility sectors.
Mr Cooper is currently a Non-Executive Director of Woodside Petroleum Limited (including Chair of the Audit & Risk Committee and member of the Human Resources & Compensation Committee and Nominations & Governance Committee). Until 2006, he was a Director of Alinta Infrastructure Limited and Alinta Funds Management Limited.
Mr Cooper was awarded an Officer of the Order of Australia in 2014 and was named West Australian of the Year in the Professions category in 2015.
Mr Cooper is also a Fellow of the Australian Institute of Company Directors and Chartered Accountants Australia and New Zealand.
Current ASX listed directorships: – Woodside Petroleum Limited: Independent Non-Executive
Director since February 2013.
Other Directorships and Offices: – Commissioner and Chairman, Insurance Commission of Western
Australia; – Member, WA Council of the Australian Institute of Company
Directors (from February 2016 to 23 June 2021); – Pro Chancellor, University of Western Australia; – Trustee, St John of God Health Care; and – Director, St John of God Australia Limited.
Mr Lansdown complements the South32 Board with his extensive experience in early and late stage greenfield and brownfield project development and delivery, together with his strong technical background and strategic leadership abilities.
Mr Lansdown is a civil engineer with almost 40 years’ experience in project development and mining, including as an executive at Newmont Mining Corporation where he was most recently Executive Vice President Discovery and Development. In that role he led Newmont’s exploration and major project development.
During his 20-year career with Newmont Mining Corporation, Mr Lansdown held many senior positions, including Senior Vice President of Project Development and Technical Services USA, Vice President of Project Development USA, Executive Manager Boddington Australia, Operations Manager Minera Yanacocha Peru and Engineering and Development Director Australia.
Prior to joining Newmont, Mr Lansdown held various roles contributing to his global business experience, including Associate and Projects Manager at Knight Piesold in the USA and a Director of Projects at Group Five in South Africa. He has worked in North and South America, Asia, Australia and Africa.
Mr Lansdown is currently President and Director of his US consulting company Project Excellence Inc., which offers a range of services including strategic planning, project development, organisational design and independent project reviews.
He is also President and Director of two charities, Un Futuro Mejor Inc. and Fundación Lansdown A.C., which provide opportunities for disadvantaged youth in Mexico to reach their full potential.
Other Directorships and Offices: – President and Director, Project Excellence Inc.; – President and Director, Un Futuro Mejor Inc.; and – President and Director, Fundación Lansdown A.C.
Mr Frank Cooper AO BCom, FCA, FAICD, 65Independent Non-Executive DirectorAppointed 7 May 2015
Chair of the Risk and Audit Committee Location: Australia
Mr Guy Lansdown BSc (Engineering (Civil)), MSc (Engineering (Project Management)), 60 Independent Non-Executive DirectorAppointed 2 December 2019
Location: Mexico
59S
outh32 Annual R
eport 2021
Governance

Board of Directors continued
Dr Liu is a metallurgical engineer with a 26-year career at the Rio Tinto Group. Dr Liu’s strong operational, technical, strategic, marketing and risk management skills are an important contribution to the South32 Board.
Dr Liu’s roles at Rio Tinto included General Manager and Managing Director positions in smelting operational management. She held other senior positions, including Managing Director Technical Services where she led Rio Tinto’s global technical services unit, and President and Chief Executive Officer of Rio Tinto Minerals where she ran integrated mining, processing, and supply chain operations in the United States, Europe and Asia.
Since her retirement from Rio Tinto in 2014, Dr Liu held the position of Non-Executive Director of Iluka Resources Limited until April 2019 and Non-Executive Director of Newcrest Mining Limited (including as a member of the Human Resources & Remuneration Committee, Audit & Risk Committee and Nominations Committee) until November 2020. Dr Liu is currently a Non-Executive Director of Incitec Pivot Limited (including as a member of the Audit & Risk Committee and Chair of the HSEC Committee). These roles have contributed to Dr Liu’s skills and experience in remuneration, acquisitions and divestments.
Dr Liu has been the Chancellor, Queensland University of Technology since January 2020. She held the office of Director, Melbourne Business School until October 2019. She has also served as a board member of the California Chamber of Commerce and Vice President of the Board of the Australian Aluminium Council.
Dr Liu is a Fellow of the Australian Academy of Technological Science and Engineering, a Fellow of the Australasian Institute of Mining and Metallurgy and a member of Chief Executive Women.
Current ASX listed directorships: – Incitec Pivot Limited: Independent Non-Executive Director since
November 2019.
Previous ASX listed directorships: – Newcrest Mining Limited: Independent Non-Executive Director
from September 2015 to November 2020; and – Iluka Resources Limited: Independent Non-Executive Director
from February 2016 to April 2019
Other Directorships and Offices: – Chancellor, Queensland University of Technology.
Dr Mtoba is a chartered accountant with an extensive career in business and community engagement in South Africa. In addition, she brings valuable sustainability and environmental experience to the South32 Board.
Dr Mtoba joined Deloitte and Touche South Africa in 1988, specialising in financial services. She became one of the first African Black women to be appointed as a Partner by one of the Big Four accounting firms and was later appointed the first African woman Deputy Chairman and then Chairman of Deloitte Southern Africa.
Dr Mtoba has been a member of the International Monetary Fund Advisory Group of Sub-Saharan Africa, the World Economic Forum Global Advisory Council, the B20 Financing Growth and Infrastructure Task Force and the B20 Transparency Task Team. She was also the first woman president of the Association for the Advancement of Black Accountants of Southern Africa.
Additionally, she has served as Chair of Council of the University of Pretoria, President of Business Unity South Africa, and board member of the Public Accountants and Auditors Board, the South African Institute of Chartered Accountants, the New Partnership for Africa’s Development Business Foundation and African Union Foundation.
Dr Mtoba is engaged in the regional and global community. In 2019, Dr Mtoba was appointed as a Director of the International Women’s Forum (South Africa). She is a former board member of the United Nations Global Compact.
In October 2020, Dr Mtoba was appointed as a Non-Executive Director of the Public Investment Corporation Limited (having previously served as a Board member and Investment Committee Chair). In February 2021, she was appointed Deputy Chairperson and is Chair of the Audit Committee of Public Investment Corporation Limited.
For her contributions, Dr Mtoba has received numerous awards, including Most Outstanding Leadership Women of the Year (Africa Economy Builders, 2018). She is also a Harvard Advanced Leadership Initiative Fellow (2017).
Other Directorships and Offices: – Lead Independent Director and Audit Committee Chair, Discovery
Bank Limited; – Director, Discovery Bank Holdings Limited; – Founding Trustee, ZMDT; – Trustee and Audit Committee Chair, Nelson Mandela Foundation; – Trustee and Audit Committee Chair, National Education
Collaboration Trust (NECT); and – Independent Non-Executive Director and Deputy Chairperson,
Public Investment Corporation Limited.
Dr Xiaoling Liu BEng (Extractive Metallurgy), PhD (Extractive Metallurgy), FAusIMM, FTSE, GAICD, 64Independent Non-Executive DirectorAppointed 1 November 2017
Location: Australia
Dr Ntombifuthi (Futhi) Mtoba CA(SA), DCom (Honoris Causa), BCompt (Hons), HDip Banking Law, BA (Econ)(Hons), BA (Arts), 66Independent Non-Executive DirectorAppointed 7 May 2015
Location: South Africa
60S
outh
32 A
nnua
l Rep
ort
2021
Gov
erna
nce

Mr Osborn brings over 40 years of experience from the mining, resources and manufacturing sectors to the South32 Board.
Mr Osborn was Managing Director of Alcoa in Australia from 2001 until 2008, leading an integrated business comprised of bauxite mining, alumina refining, coal mining, power generation and aluminium smelting. This included operations in Victoria and Western Australia. His prior role at Alcoa included accountability for its Asia-Pacific manufacturing operations in China, Japan, Korea and Australia. He joined Alcoa in 1979 after working as an engineer in the iron ore and telecommunications sector.
Since 2008, Mr Osborn has worked as a Non-Executive Director in the mining, construction and energy industries. He was also Chairman of the Australian Institute of Marine Science, Chairman of the Western Australia Branch of the Australia Business Arts Foundation and Vice President of the Chamber of Commerce and Industry, Western Australia.
Mr Osborn is currently a Non-Executive Director of Wesfarmers Limited (including membership of the Remuneration Committee and the Nomination Committee).
He has been awarded a WA Business Leader Award in 2007 for his work with the Australian Business Arts Foundation and an Australian Institute of Company Directors Award for Excellence in 2018.
Mr Osborn is a Fellow of the Australian Academy of Technological Sciences and Engineering and International Fellow of the Explorers Club (New York).
Current ASX listed directorships: – Wesfarmers Limited: Independent Non-Executive Director since
March 2010.
Mr Rumble has more than 40 years of experience in the resources industry, specifically in titanium and platinum mining. He also has experience managing a portfolio of private equity assets in the resource sector in Russia, India and other emerging markets. This combination of skills and knowledge are a valuable contribution to the South32 Board.
Mr Rumble has held various leadership roles including CEO of SUN Mining (a wholly-owned entity of the SUN Group), CEO of Impala Platinum (Pty) Ltd and President and CEO of Rio Tinto Iron and Titanium Inc in Canada. He also worked for Verref, a division of the Anglo American Corporation, prior to joining Richards Bay Minerals in 1980, working in smelting and metallurgy, progressing to General Manager and later CEO in 1996.
Mr Rumble has been a Non-Executive Director of a variety of private companies, including Platinum Mining Corporation of India PLC, Barplats Holdings Limited, Western Platinum (Pty) Limited, Eastern Platinum (Pty) Limited and Sarplat Investments Limited. He was also an independent Non-Executive Director at BHP Billiton plc, BHP Limited and at JSE listed Aveng Limited.
In November 2019, Mr Rumble retired as a Member of Board of Governors, Rhodes University and was appointed an Honorary Life Governor (Rhodes University).
Mr Rumble completed the Stanford (US) Executive Program in 1990.
Other Directorships and Offices: – Director, Acetologix Pty Limited; – Director, Enzyme Technologies (Pty) Limited; – Director, Elite Wealth (Pty) Limited; and – Trustee, World Wildlife Fund, South Africa.
Mr Wayne Osborn Dip Elect Eng, MBA, FAICD, FTSE, 69Independent Non-Executive DirectorAppointed 7 May 2015
Chair of the Remuneration Committee Location: Australia
Mr Keith Rumble BSc, MSc (Geology), 67Independent Non-Executive DirectorAppointed 27 February 2015
Chair of the Sustainability Committee Location: South Africa
61S
outh32 Annual R
eport 2021
Governance

Directors’ report
This report is presented by our Directors, together with the Group’s Financial report, for the financial year ended 30 June 2021.
The report is prepared in accordance with the requirements of the Corporations Act, with the following information forming part of the report:
– Operating and financial review on the inside front cover to page 57;
– Director biographical information on pages 58 to 61 and Company Secretary biographical information on page 64;
– Remuneration report on pages 68 to 93;
– Note 19 (a) Financial risk management objectives and policies on pages 126 to 129;
– Note 20 Share capital on page 134;
– Note 21 Auditor’s remuneration on page 135;
– Note 23 Employee share ownership plans on pages 136 to 139;
– Directors’ declaration on page 147;
– Auditor’s independence declaration on page 148;
– Resources and Reserves on pages 153 to 160;
– Shareholder information on pages 161 to 163; and
– Corporate directory (inside back cover).
Directors and meetings At the date of this report, the Directors in office were:
Karen Wood Appointed 1 November 2017
Graham Kerr Appointed 21 January 2015
Frank Cooper AO Appointed 7 May 2015
Guy Lansdown Appointed 2 December 2019
Dr Xiaoling Liu Appointed 1 November 2017
Dr Ntombifuthi (Futhi) Mtoba Appointed 7 May 2015
Wayne Osborn Appointed 7 May 2015
Keith Rumble Appointed 27 February 2015
You can find information about our Directors’ qualifications, experience, special responsibilities and other directorships on pages 58 to 61.
Board and Committee meetings and Director attendanceThere are nine regularly scheduled meetings of the Board each year. Six of these are usually held face-to-face over three days and are held in one of our main geographic areas of operation to allow Directors to conduct site visits. Committee meetings are also held during this time. A further three meetings are convened each year to consider annual disclosures, including half and full year results, and are usually held virtually. Additional meetings are convened as required to address business critical issues.
During FY21 there were a total of 19 Board meetings. The additional meetings were held to receive regular updates on management’s response to COVID-19, oversee the divestment of the South Africa Energy Coal (SAEC) business and consider other business critical issues and continuous disclosure obligations. Two strategy sessions were held, in January and June 2021.
Our continued response to the COVID-19 pandemic, and related travel disruptions, has seen our virtual format continue for all Board and Committee meetings. This practice will likely continue until such time that travel and social distancing restrictions are eased. Our Board has also used a hybrid approach (ie. physical and virtual format) to bring some Directors together for meetings in jurisdictions where it has been possible to do so.
Although our Board was unable to conduct any site visits during FY21, it continued to stay connected with our operations by way of operational overviews and briefing sessions conducted as part of the Board programs.
To help it carry out its responsibilities, our Board has established four standing Board Committees. From time to time, the Board creates other committees to address important matters and areas of focus for the business. For example, a committee was established to oversee the divestment of the SAEC business.
All Non-Executive Directors have a standing invitation to attend all Committee meetings, with the consent of the relevant Committee Chair. In practice, all Directors generally attend all meetings.
You will find the number of Board and Committee meetings held in FY21, as well as the Directors who attended them, in Table 1.1.
Our Chair sets the agenda for each Board meeting, with the CEO and the Company Secretary. The meetings typically include:
– Minutes of the previous meeting and matters arising;
– Report from our Chair;
– Update on various governance matters;
– CEO’s report;
– Finance report;
– Commercial report;
– Reports on major projects and strategic matters;
– Board Committee Chair reports;
– Continuous disclosure checkpoint; and
– Closed sessions with Directors and closed sessions with Non-Executive Directors only.
In between meetings, our Board receives regular reports from senior management on matters, including (but not limited to):
– Sustainability (including health and safety) performance;
– Financial and production performance; and
– Government relations and political affairs.
Further, our Board receives updates on emerging issues such as climate change, cultural heritage, community matters, business integrity and litigation. It also receives regular reports for discussion on operational, culture and leadership, corporate governance and other business matters, including market updates, market research and investor relations activities.
As part of their ongoing education and training, during FY21 our Board received external briefings on various matters including climate change, human rights, Indigenous and Tribal Peoples’ engagement including cultural heritage and cultural awareness, remuneration matters and evolving ESG matters.
62S
outh
32 A
nnua
l Rep
ort
2021
Gov
erna
nce

Table 1.1 Board and Committee Meeting Attendance in FY21
BoardNomination and
Governance CommitteeRemuneration
CommitteeRisk and Audit
CommitteeSustainability
Committee
Director Eligible(1) Attended(2) Eligible(1) Attended(2) Eligible(1) Attended(2) Eligible(1) Attended(2) Eligible(1) Attended(2)
K Wood 19 19 3 3 7 7 - 14 7 7G Kerr (CEO) 19 19 - 3 - 7 - 14 - 7F Cooper 19 19 3 3 7 7 14 14 - 7X Liu 19 19 3 3 - 7 14 14 7 7G Lansdown 19 19 3 3 - 7 14 14 7 7N Mtoba 19 19 3 3 - 7 14 14 - -W Osborn 19 19 3 3 7 7 - 14 7 7K Rumble 19 19 3 3 7 7 - 14 7 7
Member Chair
(1) Indicates the number of meetings held during FY21 while the Director was a member of the Board or Committee.(2) Indicates the number of meetings the Director attended during FY21.
Principal activities, state of affairs and review of operations Principal activities In FY21, the principal activities of the Group were mining and metal production, from a portfolio of assets that included alumina, aluminium, bauxite, energy coal, metallurgical coal, manganese ore, manganese alloy, nickel, silver, lead and zinc.
On 4 January 2021, Groote Eylandt Mining Company Pty Ltd legally completed the sale of its shareholding in Tasmanian Electro Metallurgical Company Pty Ltd (TEMCO) to an entity within GFG Alliance. On 1 June 2021, the Group also completed the sale of its shareholding in SAEC to Seriti Resources Holdings Pty Ltd and two trusts for the benefit of employees and communities.
There were no other significant changes in the Group’s principal activities during the year.
State of affairs There were no significant changes in the Group’s state of affairs during the year, other than the divestment of the Group’s interests in TEMCO and SAEC, and as set out in the Operating and financial review and Shareholder information on the inside front cover to page 57, and 161 to 163 respectively.
Review of operationsWe’ve set out a review of the Group’s FY21 operations in the Operating and financial review on the inside front cover to page 57. It includes likely developments in the Group’s operations in future financial years and expected results.
Dividends We paid the following dividends during FY21:
Dividend Total
dividendPayment
date
Final dividend of US 1 cent per share (fully franked) for the year ended 30 June 2020
US$48 million
8 October 2020
Interim dividend of US 1.4 cents per share (fully franked) for the half year ended 31 December 2020
US$67 million
8 April 2021
Matters since the end of the financial year On 19 August 2021, the Directors resolved to pay a fully franked final dividend of US 3.5 cents per share (US$164 million) and a fully franked special dividend of US 2.0 cents per share (US$93 million) in respect of the 2021 financial year. The dividends will be paid on 7 October 2021. The dividends have not been provided for in the consolidated financial statements and will be recognised in the 2022 financial year.
On 19 August 2021, the Group also announced an increase to the existing capital management program, announced on 27 March 2017, of US$120 million to a total of US$2.0 billion. This leaves US$252 million expected to be returned by 2 September 2022.
No other matters or circumstances have arisen since the end of the financial year that have significantly affected, or may significantly affect, the operations, results of operations or state of affairs of the Group in subsequent accounting periods.
Remuneration and share interests Table 1.2 Directors’ Relevant Interests in South32 Limited Shares
Director
Number of shares in which a relevant interest is held as at
the date of this Directors’ report
K Wood 367,825 G Kerr (CEO)(1) 9,928,233F Cooper 128,010 G Lansdown 80,000X Liu 60,000 N Mtoba 69,386 W Osborn 174,104K Rumble 161,380
(1) At the date of this Directors’ report, Mr Kerr’s total interest includes 3,804,621 South32 Limited ordinary shares and 6,123,612 rights over South32 Limited ordinary shares held under the South32 Equity Incentive Plan.
Rights and options over South32 Limited shares No rights or options over South32 Limited ordinary shares are held by any of our Non-Executive Directors.
Our Chief Executive Officer and Managing Director, Graham Kerr, holds rights over South32 Limited ordinary shares, granted under the South32 Equity Incentive Plan. You can find more details about this in the Remuneration report on page 83. Graham Kerr does not hold any options over South32 Limited shares.
The total number of rights over South32 Limited ordinary shares on issue as at 30 June 2021 is set out in note 23 Employee share ownership plans to the financial statements on pages 136 to 139. There were no options on issue as at 30 June 2021.
No options or rights have been granted since the end of FY21.
63S
outh32 Annual R
eport 2021
Governance

Directors’ report continued
As of the date of this report, the total number of rights over South32 Limited ordinary shares on issue is 48,656,835. The Remuneration report contains details of rights on issue. No shares have been issued on vesting of rights during or since the end of FY21.
Company Secretaries
Kelly O’Rourke LLB, BCom, MAICD
Kelly O’Rourke was appointed to the role of Chief External Affairs Officer in November 2020. Kelly’s role was subsequently expanded to Chief Legal and External Affairs Officer with effect from 1 July 2021 and she was also appointed Joint Company Secretary on this date. You can find out more about Kelly on page 67.
Claire Tolcon LLB, BComm, GCertCorpMgt, FGIA
Claire Tolcon is our Manager Company Secretariat & Corporate Counsel. She was appointed Joint Company Secretary on 30 October 2020. Before joining South32 in 2017, Claire held the role of General Counsel and Company Secretary for a number of ASX listed entities, prior to which she was a partner of a corporate law firm in Perth. She holds a Bachelor of Laws and Bachelor of Commerce from Murdoch University and a Graduate Diploma of Applied Finance and Investment from Kaplan.
Nicole Duncan BA (Hons), LLB, MAICD, FGIA, FCG
Nicole Duncan was the Chief Legal Officer of South32 Limited during FY20 and was appointed as Company Secretary on 21 January 2015. Nicole left the business in July 2021 and resigned as Company Secretary with effect from 1 July 2021.
Indemnities and insurance We support and hold harmless Directors and employees, including employees appointed as Directors of a Group company, who incur personal liability to others as a result of working for us (while acting in good faith), to the extent we are able under law.
Rule 10.2 of the South32 Constitution requires that we indemnify each Director and each Company Secretary on a full indemnity basis and to the extent permitted by law against liability incurred by them in their capacity as an officer of any member of the Group. The Directors and the Company Secretaries named in this report have the benefit of this indemnity (as do individuals who formerly held one of these positions).
As permitted by our Constitution, South32 Limited has entered into Deeds of Indemnity, Access and Insurance with each of our Directors, Company Secretaries and the CFO under which we agree to indemnify those persons on a full indemnity basis and to the extent permitted by law. We purchase Directors' and Officers' liability insurance which insures against certain liabilities (subject to exclusions) in respect of current and former Directors and Officers of the Group.
Due to confidentiality obligations and undertakings of the insurance, we can’t disclose any further details about the premium or insurance.
During FY21 and as at the date of this Directors’ report, no indemnity in favour of a current or former Director or Officer of the Group has been called on.
Corporate Governance Under ASX Listing Rule 4.10.3, ASX listed entities are required to benchmark their corporate governance practices against the fourth edition of the ASX Corporate Governance Council’s Corporate Governance Principles and Recommendations (ASX Recommendations).
South32 is compliant with all relevant fourth edition ASX Recommendations.
Our Corporate Governance Statement is available at www.south32.net/who-we-are/risk-governance. It also contains the information required under the UK Financial Conduct Authority’s Disclosure Guidance and Transparency Rules (DTR).
Auditor Our External Auditor has provided an independence declaration in accordance with the Corporations Act, which is set out on page 148 and forms part of this report.
The External Auditor also provides our Directors with an independent assurance conclusion. This relates to certain sustainability information, and is in accordance with the International Standards on Assurance Engagements ISAE 3000 Assurance Engagement other than the Audits and Reviews of Historical Financial Information and ISAE 3410 Assurance of Greenhouse Gas Statements.
We’ve included a copy of the External Auditor’s assurance report in the Sustainability Databook, available at www.south32.net.
Non-audit services All non-audit services provided by our External Auditor are considered and approved in accordance with the process set out in our Provision of Non-Audit Services Policy.
No non-audit services were undertaken by, and no amounts for non-audit services were paid to, our External Auditor. Refer to note 21 Auditor's remuneration to the financial statements on page 135.
Political donations and community investment Our Code of Business Conduct sets out our approach to political donations and community investment.
In FY21, we didn’t contribute funds to any politician, elected official or candidate for public office in any country. On occasion, our representatives attend political functions that charge an attendance fee where attendance is approved beforehand in accordance with our internal approval requirements. We record the details of attendances and the relevant costs at a corporate level.
In FY21, we contributed US$22.2 million for the purposes of supporting community programs that comprised direct investment, in-kind support and administrative costs. For more information on our community investment, please visit www.south32.net/community-society/community-investment.
Proceedings on behalf of South32 No proceedings have been brought or intervened in on our behalf, nor any application made under section 237 of the Corporations Act.
Environmental performance Performance in relation to environmental regulation We seek to be compliant with all applicable environmental laws and regulations relevant to our operations.
We classify environmental incidents based on actual and potential impact type as defined by our internal material risk management standards.
In FY21, we had no environmental events that resulted in a major impact to the environment.
Fines and prosecutions We received a $15,000 fine for pollution of water associated with our Illawarra Metallurgical Coal operation. The fine, issued by the NSW Environment Protection Authority, was in response to the pollution event that occurred at our Kemira Valley Coal Loading Facility in August 2020.
Refer to the Water Section of our 2021 Sustainable Development Report for more details in relation to the event.
64S
outh
32 A
nnua
l Rep
ort
2021
Gov
erna
nce

Rounding of amounts We’ve applied the Australian Securities and Investments Commission (ASIC) Corporations (Rounding in Financial/Directors’ Reports) Instrument 2016/191 to this report. This means the amounts in the financial statements have been rounded to the nearest million US dollars, unless stated otherwise.
Responsibility statement The Directors state that to the best of their knowledge:
a) The consolidated financial statements and notes on pages 95 to 146 were prepared in accordance with applicable accounting standards, give a true and fair view of the assets, liabilities, financial position and profit and loss of the Group and the undertakings included in the consolidation taken as a whole; and
b) The Directors’ report includes a fair review of the development and performance of the business and the position of the Group and the undertakings included in the consolidation taken as a whole, together with a description of the principal risks and uncertainties they face.
This Directors’ report is made in accordance with a resolution of the Board.
Karen Wood Chair
Graham Kerr Chief Executive Officer and Managing Director
Date: 2 September 2021
65S
outh32 Annual R
eport 2021
Governance

Lead Team
Graham Kerr BBUS, FCPA, 50Chief Executive Officer and Managing DirectorSee page 58 for Graham Kerr’s qualifications and experience.
Katie Tovich BCom, CA, GAICD, 51Chief Financial OfficerKatie Tovich became our Chief Financial Officer in May 2019, having been Vice President Corporate Affairs and Investor Relations, as well as Head of Treasury. She is responsible for Financial Reporting, Financial Analysis, Treasury, Business Evaluation, Tax, Investor Relations, Risk and Group Assurance. Her responsibility for Corporate Affairs, including Community, transitioned to our new Chief External Affairs Officer on 1 November 2020.
Katie brings more than 25 years of global experience in the resources sector. Before joining us, she held senior finance and marketing roles at BHP in Australia and Asia, including Vice President Corporate Finance, Head of Finance Worsley Alumina and Vice President Finance Marketing – Carbon Steel Materials. Earlier in her mining career, she held finance and marketing leadership positions at WMC Resources Limited in Australia and North America.
Katie holds a Bachelor of Commerce from the University of Tasmania and is a member of Chartered Accountants Australia and New Zealand.
Mike Fraser BCom, MBL, 56Chief Operating OfficerMike Fraser became our Chief Operating Officer in April 2018, having been Chief Operating Officer for the Africa region from January 2015. He is responsible for the Group’s aluminium and manganese operations in Africa and the Cerro Matoso operation in Colombia.
Before joining us, Mike was President, Human Resources with BHP. Before this, he was Asset President of Mozal Aluminium in Mozambique. He has also worked in various roles in BHP’s coal, manganese and aluminium businesses. During his career, Mike held leadership roles in a large internationally diversified industrial business, and has worked in Australia, Mozambique, South Africa and the United Kingdom.
Mike holds a Master of Business Leadership and a Bachelor of Commerce from the University of South Africa.
Jason Economidis MBA (Executive), 52Chief Operating OfficerJason Economidis became our Chief Operating Officer in July 2020, assuming accountability for Australia Manganese, Cannington, Illawarra Metallurgical Coal and Worsley Alumina. Prior to this, Jason was Vice President Operations at Illawarra Metallurgical Coal.
Jason is an experienced mining executive having worked in the sector in Australia and overseas for more than 25 years. He joined South32 from Orica, where he held the position of Vice President Coal and was responsible for 25 mining operations across Queensland and New South Wales.
Jason has held several other senior positions in the industry including General Manager of the Coppabella and Moorvale Complex for Peabody Energy, Chief Operating Officer of Vale Coal Australia, General Manager of Goonyella-Riverside and Caval Ridge, Vice President Health, Safety, Environment and Community for BHP, and Chief Operating Officer of Discovery Metals, based in Botswana.
Jason holds a Master of Business Administration (Executive) from the Australian Graduate School of Management.
66S
outh
32 A
nnua
l Rep
ort
2021
Gov
erna
nce

Vanessa Torres BSc (Chemical), MEng, DEng, 51 Chief Technical Officer Vanessa Torres became our Chief Technical Officer in July 2020. She is responsible for Technology, Innovation, Business Optimisation, Risk Management, Capital Projects as well as Health, Safety, Environment and Technical Stewardship.
Vanessa joined South32 in August 2018 as Chief Technology Officer. Before this, she was Vice President Operational Infrastructure for BHP Western Australia Iron Ore. She has over 28 years of global mining experience across Australia, Canada, Brazil, Peru and New Caledonia, and has held various senior roles at BHP and Vale in strategy, projects, business development, and operations.
Vanessa holds Doctorate and Master degrees in Minerals Engineering from the University of Sao Paulo, and a Bachelor of Science from the Federal University of Minas Gerais, Brazil. She was also a Visiting Scholar at the University of British Columbia, Canada, where her research focused on the application of artificial intelligence to the mining industry.
Brendan Harris BSc, CPA, 49Chief Human Resources and Commercial OfficerBrendan Harris became our Chief Human Resources and Commercial Officer in November 2020 and is responsible for our Human Resources, Marketing and Supply functions. Before his role was expanded, Brendan was our Chief Commercial Officer between January and November 2020.
Brendan joined South32 as our inaugural Chief Financial Officer, looking after Financial Reporting, Management Reporting, Treasury, Business Evaluation, Tax, Corporate Affairs, Investor Relations, Risk and Assurance, and Brazil Alumina. Brendan played a key role in the Demerger from BHP in 2015 and South32’s public listing in three countries, in addition to developing our capital management framework.
Before joining us, Brendan was Head of Investor Relations at BHP, based in the United Kingdom and then Australia, having been Vice President Investor Relations Australasia. During his career, he also held roles in investment banking, including Executive Director Metals and Mining Research at Macquarie Equities.
Brendan holds a Bachelor of Science in Geology and Geophysics from Flinders University.
Kelly O’Rourke LLB, BCom, MAICD, 42Chief Legal and External Affairs OfficerKelly O’Rourke was appointed to the role of Chief Legal and External Affairs Officer in July 2021 and is responsible for Legal, Company Secretary, Business Integrity, Communications, Community, Government and Sustainability Strategy. Prior to this, Kelly was our Chief External Affairs Officer, having been appointed to the Lead Team in November 2020.
Kelly joined South32 in 2016 as Head of Corporate Affairs and Investor Relations and later became Vice President Corporate Affairs. She previously worked at BHP for nine years where she held senior roles in Legal, Business Development, Mergers and Acquisitions and the Office of the Chief Executive.
Kelly has more than 15 years’ experience in the mining industry across legal, commercial, business development, mergers and acquisitions, corporate affairs and community roles, and has worked in Australia, the United Kingdom, Asia, Europe, Africa and the Americas.
Kelly holds a Bachelor of Laws (Distinction) from The University of Western Australia and a Bachelor of Commerce from Curtin University.
Simon Collins BE (Mining), MBA, 48Chief Development OfficerSimon Collins has been our Chief Development Officer since October 2018. He is responsible for Greenfields Exploration, Projects and Industry Evaluation, Acquisitions and Divestments, Brazil Alumina and the Hermosa project. He also represents South32 on the Board of Directors of Ambler Metals LLC and TSX-V listed Elemental Royalties Corp.
Simon brings over 25 years’ experience in the resources industry in senior leadership and business development roles. Before joining South32, he worked for BHP for more than a decade, providing leadership to the business development teams in Australia, Belgium, Singapore and the United Kingdom. He began his career in mine operations initially in Australia and then South Africa.
Simon holds a Master of Business Administration from London Business School and a Bachelor of Engineering (Mining) from the University of New South Wales.
67S
outh32 Annual R
eport 2021
Governance

Remuneration report
Letter from our Remuneration Committee ChairDear Shareholders,
On behalf of the Board, I am pleased to present the Remuneration report for the financial year to 30 June 2021 (FY21).
Remuneration Policy ReviewThe Board and Remuneration Committee believe our remuneration policy has served stakeholders well since Demerger . Our policy has always aimed to strike the right balance, where remuneration outcomes incentivise and reward our Executives, while ensuring they reflect overall business performance and the shareholder experience. Our actual pay outcomes, being the realised value of rewards received since Demerger , are testament to this alignment, as illustrated in diagram 1.2.
It is, however, appropriate for us to regularly review our remuneration arrangements to ensure they deliver on their intended purpose. The Remuneration Committee has considered our strategic commitments to further reshape our portfolio and halve our operational carbon emissions (Scope 1 and 2) by 2035 compared to our FY21 baseline, as these elements will underpin the long-term success of our business and delivery of value to shareholders.
Following extensive review, the Remuneration Committee has approved specific enhancements to our Reward Framework to further connect strategy, long-term shareholder value creation and executive remuneration, whilst also recognising the need for even greater restraint. From FY22, important changes to variable pay include:
– A 33 per cent reduction in the face value of the long-term incentive (LTI) for all Executive key management personnel (KMP). This means the face value of the CEO’s LTI reduces from 300 per cent to 200 per cent of Fixed Remuneration, which results in a 19 per cent decrease in Total Reward (based on face value) for the CEO from FY22;
– The incorporation of two strategic measures for 20 per cent of our LTI, directly linking executive remuneration to our ambitious but realistic approach to climate change and the transition of our portfolio towards the base metals required for a low-carbon future;
– An increase in the weighting of the financial measures in the short-term incentive (STI) to achieve an appropriate balance of measures across the elements of variable pay, given the inclusion of strategic measures in the LTI; and
– A shift from an index to a constituent group of companies for the global mining comparator group in the LTI, against which two-thirds of relative total shareholder return performance is measured, to better align our approach to market practice.
Notwithstanding these changes which have resulted in a material reduction in Total Reward (as outlined in more detail on page 87), there will be no adjustment to the quantum of Fixed Remuneration or target STI.
We have appreciated the opportunity to engage with a number of investors and other external stakeholders ahead of making these changes and acknowledge the constructive feedback that we have taken on board.
Our performance We delivered a strong operating result in FY21, including record production at Worsley Alumina, Brazil Alumina, and Australia Manganese, and exceeded our initial production guidance at South Africa Manganese, Cerro Matoso and Cannington. Our teams worked hard to control costs and working capital, successfully mitigating increasing signs of inflationary pressure.
Our teams showed incredible resilience to the impacts of COVID-19, particularly in Southern Africa, Colombia and Brazil. Our response to the COVID-19 pandemic rightly remained our priority as we focused on keeping our people safe and well, maintaining safe and reliable operations, and supporting our communities.
Together, these efforts underpinned a significant increase in the Group’s profitability. Underlying EBIT grew by 89 per cent to US$844 million (US$446 million in FY20) and free cash flow increased by 42 per cent to US$825 million(1) (US$583 million in FY20). US$670 million was returned to shareholders in respect of the period via the distribution of fully franked dividends and the continuation of our on-market share buy-back.
We also significantly reshaped our portfolio with the divestment of both South Africa Energy Coal (SAEC) and the TEMCO manganese alloy smelter, and the decision to place the Metalloys manganese alloy smelter on care and maintenance. In parallel we continued to advance studies at Hermosa, our base metals development option in Arizona, and build upon our global exploration footprint that is designed to add longer-term development options.
Having met our multi-year objective to maintain Scope 1 emissions below our FY15 baseline, we set a medium-term goal to halve our operational carbon emissions by 2035 compared to our FY21 baseline. We also recognise the need to contribute to the communities where we operate. Our contribution takes many forms and in FY21 it included investment of US$22.2 million.
Despite a reduction in recordable injuries for the period, and four of our operations recording their lowest Total Recordable Injury Frequency (TRIF) to date, our TRIF increased by two per cent to 4.3 and did not meet our 20 per cent year-on-year reduction target. While our TRIF outcome at a Group level was disappointing, we made good progress in proactive hazard reporting which is key to our approach to improving safety outcomes.
The collective strength of our performance across the year has been recognised in our Business Scorecard, where an overall outcome of 101 per cent (out of a possible 150 per cent) was achieved (refer to pages 78 to 79 for additional detail).
(1) Free cash flow from operations including net distributions from our manganese equity accounted investments (EAI).
68S
outh
32 A
nnua
l Rep
ort
2021
Gov
erna
nce

Application of the Business ModifierThe Business Modifier component of the STI considers overall business outcomes or other factors that are not specifically contemplated in the Business Scorecard, such as the shareholder experience or unexpected material external events.
For FY21, the Board considered a number of factors, including:
– The loss of our colleague, Mr Petros Sibeko, in May 2021 when he was fatally injured while working as a contractor at South Africa Energy Coal; and
– The response of our teams to COVID-19, notably their resilience and resourcefulness that underpinned our strong operating results and positive shareholder experience across the year.
Notwithstanding our strong results, the Board decided to apply a negative Business Modifier to reflect the fatality as this is a failure to meet our commitment that our people will return home safely from their shift every day. This reduced the Business Scorecard outcome by 20 per cent for the CEO and the COO Africa, and five per cent for all other Executive KMP.
As part of its deliberations, the Board also contemplated the impairment at Illawarra Metallurgical Coal that led to a statutory loss at the Group Level (see page 80). The Board concluded that the uncertainty in the current approvals landscape, that resulted in the impairment, was beyond management’s control. In addition, the Board considered the shareholder experience during the year, including our strong cash generation that enabled the payment of dividends, the continuation of our capital management program and strong share price appreciation. Consequently, the Board elected not to further penalise Executive KMP by increasing the negative impact of the Business Modifier.
As a result, the CEO’s overall STI outcome was 81 per cent (or 54 per cent of maximum). The Board believes this to be a fair outcome, taking all factors into account, including overall reward for FY21 (see page 81).
LTI failed to meet vesting thresholdsThe LTI is the component of executive remuneration most closely linked to the shareholder experience as it rewards Executives for the delivery of returns that exceed peer benchmarks across a four-year period.
South32 delivered TSR of 31 per cent over the four-year performance period of the FY18 LTI, which fell short of the threshold level required for vesting, meaning the FY18 LTI awards lapsed in full.
Continued restraint applied for FY22The CEO will not receive an increase in his Fixed Remuneration for FY22 and Fees for the Non-Executive Directors will also remain unchanged. The rates for our Director travel allowance have also been adjusted lower and will be applied when mobility increases as the global economy reopens. Discretionary increases in Fixed Remuneration have, however, been granted to Katie Tovich and Jason Economidis to reflect their continued development in their roles.
The Remuneration Committee is confident that our long-standing approach to remuneration will be enhanced by the changes being made from FY22. The addition of the strategic measures in the LTI and the increased weighting being applied to the financial measures in the STI are designed to focus the organisation on those critical activities that will underpin the long-term success of the business.
The Remuneration Committee has also shown restraint and a willingness to apply discretion where needed and will continue to do so, to ensure executive remuneration reflects overall business performance, the creation of long-term value and the shareholder experience.
We thank you, our shareholders, for your ongoing support.
Wayne Osborn Chair, Remuneration Committee
69S
outh32 Annual R
eport 2021
Governance

Remuneration report continued
Total Shareholder Return (TSR)(2)
Diagram 1.1 – South32 TSR relative to comparator groupsCEO Remuneration OutcomesDiagram 1.2 – South32 share price (A$) vs. CEO Actual pay (A$'000)(3)
-50%
0%
50%
100%
150%
FY17 FY18 FY19 FY20 FY21
South32 Sector Index World Index
FY17 FY18 FY19 FY20 FY21
Sh
are
pri
ce A
$
South32 Sector Index
0
2,000
4,000
6,000
8,000
10,000
12,000
14,000
$-
$1.00
$2.00
$3.00
$4.00
$5.00
(1) This number has not been prepared in accordance with IFRS.(2) Rolling 22-day average.(3) See page 72 for further information on actual pay.
The following table outlines historic business performance outcomes.
Table 1.1 – Business performance
Performance measures(1) FY21 FY20 FY19 FY18 FY17
Underlying EBIT (US$M) 844 446 1,440 1,774 1,648Underlying earnings (US$M) 489 193 992 1,327 1,146Closing net cash/(debt) (US$M) 406 298 504 2,041 1,640Movement in adjusted ROIC (percentage point)(2) 0.7 0.0 (1.4) (6.8) (1.1)Closing share price on 30 June (A$) 2.93 2.04 3.18 3.61 2.68(3)
Dividends/special dividends paid (US cents) 2.4 5.0 13.0 13.7 4.6Total Recordable Injury Frequency (per million hours worked) 4.3 4.2 4.6 5.1 6.1
(1) The financial information in this table has not been prepared in accordance with IFRS. Refer to page 108 of the Annual Report for a reconciliation to statutory earnings.(2) The movement in adjusted ROIC is by reference to the previous performance period and removes the effect of changes in commodity prices, commodity price linked costs,
market traded consumables, foreign exchange rates and movements in the Group’s Underlying ETR, including our manganese equity accounted investments on a proportional consolidated basis, divided by the sum of fixed assets (excluding any rehabilitation asset, the impairment of SAEC and our equity accounted manganese alloy smelters, and unproductive capital associated with Major project capital) and inventories.
(3) The opening share price on 1 July 2016 was A$1.57.
Record production at:
Worsley Alumina Brazil Alumina Australia Manganese
Underlying EBIT up 89% on FY20(1)
US$844mFY21 Total Shareholder Return(2)
42.3%
FY21 at a glance
70S
outh
32 A
nnua
l Rep
ort
2021
Gov
erna
nce

Executive remuneration aligned to performance
Fixed Remuneration
No increase was applied to Fixed Remuneration for any Executive KMP during FY21.
FY21 STI
In FY21, Management responded quickly to COVID-19 and remained focused on keeping our people safe and well, maintaining safe and reliable operations and supporting our communities.
We delivered strong operating results while managing costs, made significant progress in reshaping our portfolio, continued to build our pipeline of opportunities, progressed our decarbonisation plans and invested US$22.2 million in community initiatives and activities. This performance has been recognised in the Business Scorecard outcomes.(1)
The Board has, however, determined to apply a negative Modifier for Executive KMP in recognition of the fatality at SAEC. This included a negative Business Modifier of 20 per cent for the CEO and COO Africa, and 5 per cent for the COO Australia and CFO.
The overall STI outcome for Executive KMP ranged from 54 per cent to 77 per cent of maximum, with the CEO receiving 54 per cent.
FY18 LTI
Although our TSR outcome was 42 per cent for FY21 and 31 per cent over the four-year performance period (FY18-FY21), it was below the thresholds when measured against the performance hurdles, resulting in all FY18 LTI rights lapsing.
South32 allows employees who are promoted into Executive KMP roles to retain unvested awards that had been granted under the Management Share Plan (MSP)(2) while in their prior role, which are a combination of performance rights and retention rights. South32 does not offer retention rights to permanent members of the Lead Team, including those that are KMP. A number of MSP retention rights that were granted to Katie Tovich and Jason Economidis vested in FY21.
FY21 Total Reward
Actual pay for Executive KMP (see page 72) was below target value for Total Reward, primarily as a result of the FY18 LTI not vesting and the Board’s decision to apply a negative Business Modifier in determining the STI outcome.
The Board considers all components of remuneration in reviewing the FY21 reward outcomes to ensure alignment to our Guiding Principles (see page 73) and believes FY21 actual pay is fair for the Executive KMP and shareholders, based on performance for the year.
Diagram 1.2 illustrates the alignment of CEO actual pay to shareholder experience for the past five years.
FY22 Reward Framework
In order to further enhance our Reward Framework and reinforce alignment to our business strategy, a number of changes will be implemented for Executive KMP from FY22. These include:
– A reduction of the face value of the LTI by 33 per cent (which also reduces the face value of Total Reward for the CEO by 19 per cent);
– The introduction of climate change and portfolio management as strategic measures in the LTI as these elements will underpin the long-term success of our business and delivery of value to shareholders;
– An increase in the weighting of the financial measures in the STI to achieve an appropriate balance of measures across the elements of variable pay; and
– A shift from the index to particular constituents of the global mining comparator group for one element of the relative TSR measure.
See page 87 for details on these changes.
(1) See page 80 for commentary on the impairment recorded in FY21 and the resultant statutory loss.(2) South32 does not offer retention awards to permanent members of the Lead Team, including those that are KMP. All LTI awards that have been granted to permanent
members of the Lead Team have performance hurdles based on relative Total Shareholder Return (TSR). Roles below the Executive KMP participate in the MSP, that grants a portion of the awards in performance rights aligned to the Executive KMP LTI, and a portion in retention rights with a service-based hurdle. When individuals are promoted internally into Executive KMP roles, they retain the unvested MSP awards that will then vest while they are Executive KMP.
71S
outh32 Annual R
eport 2021
Governance
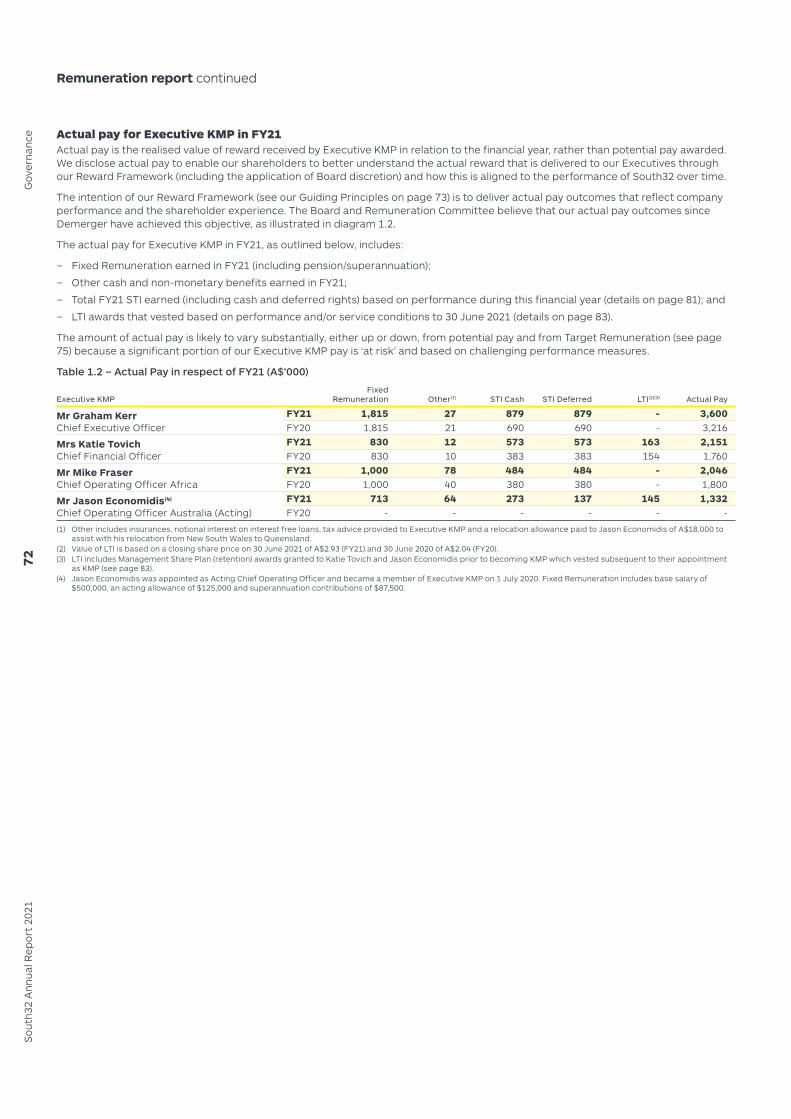
Remuneration report continued
Actual pay for Executive KMP in FY21Actual pay is the realised value of reward received by Executive KMP in relation to the financial year, rather than potential pay awarded. We disclose actual pay to enable our shareholders to better understand the actual reward that is delivered to our Executives through our Reward Framework (including the application of Board discretion) and how this is aligned to the performance of South32 over time.
The intention of our Reward Framework (see our Guiding Principles on page 73) is to deliver actual pay outcomes that reflect company performance and the shareholder experience. The Board and Remuneration Committee believe that our actual pay outcomes since Demerger have achieved this objective, as illustrated in diagram 1.2.
The actual pay for Executive KMP in FY21, as outlined below, includes:
– Fixed Remuneration earned in FY21 (including pension/superannuation);
– Other cash and non-monetary benefits earned in FY21;
– Total FY21 STI earned (including cash and deferred rights) based on performance during this financial year (details on page 81); and
– LTI awards that vested based on performance and/or service conditions to 30 June 2021 (details on page 83).
The amount of actual pay is likely to vary substantially, either up or down, from potential pay and from Target Remuneration (see page 75) because a significant portion of our Executive KMP pay is ‘at risk’ and based on challenging performance measures.
Table 1.2 – Actual Pay in respect of FY21 (A$’000)
Executive KMPFixed
Remuneration Other(1) STI Cash STI Deferred LTI(2)(3) Actual Pay
Mr Graham Kerr Chief Executive Officer
FY21 1,815 27 879 879 - 3,600FY20 1,815 21 690 690 - 3,216
Mrs Katie Tovich Chief Financial Officer
FY21 830 12 573 573 163 2,151FY20 830 10 383 383 154 1,760
Mr Mike Fraser Chief Operating Officer Africa
FY21 1,000 78 484 484 - 2,046FY20 1,000 40 380 380 - 1,800
Mr Jason Economidis(4) Chief Operating Officer Australia (Acting)
FY21 713 64 273 137 145 1,332FY20 - - - - - -
(1) Other includes insurances, notional interest on interest free loans, tax advice provided to Executive KMP and a relocation allowance paid to Jason Economidis of A$18,000 to assist with his relocation from New South Wales to Queensland.
(2) Value of LTI is based on a closing share price on 30 June 2021 of A$2.93 (FY21) and 30 June 2020 of A$2.04 (FY20).(3) LTI includes Management Share Plan (retention) awards granted to Katie Tovich and Jason Economidis prior to becoming KMP which vested subsequent to their appointment
as KMP (see page 83).(4) Jason Economidis was appointed as Acting Chief Operating Officer and became a member of Executive KMP on 1 July 2020. Fixed Remuneration includes base salary of
$500,000, an acting allowance of $125,000 and superannuation contributions of $87,500.
72S
outh
32 A
nnua
l Rep
ort
2021
Gov
erna
nce
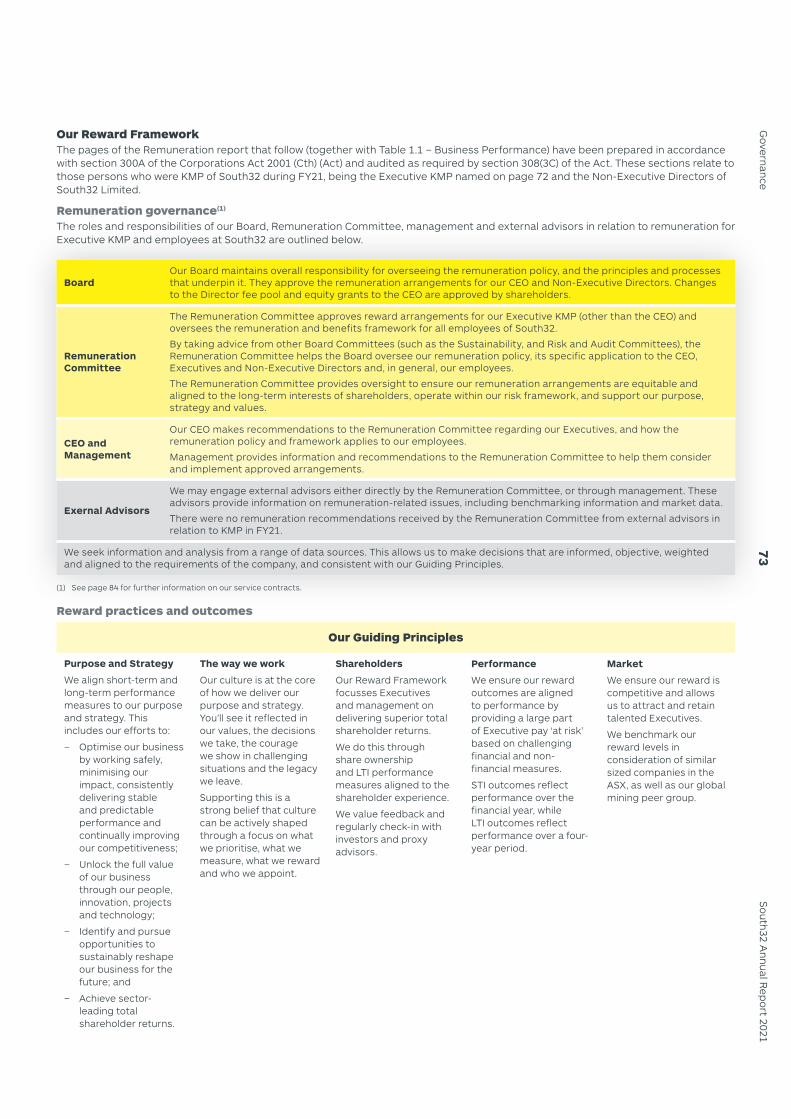
Our Reward FrameworkThe pages of the Remuneration report that follow (together with Table 1.1 – Business Performance) have been prepared in accordance with section 300A of the Corporations Act 2001 (Cth) (Act) and audited as required by section 308(3C) of the Act. These sections relate to those persons who were KMP of South32 during FY21, being the Executive KMP named on page 72 and the Non-Executive Directors of South32 Limited.
Remuneration governance(1)
The roles and responsibilities of our Board, Remuneration Committee, management and external advisors in relation to remuneration for Executive KMP and employees at South32 are outlined below.
BoardOur Board maintains overall responsibility for overseeing the remuneration policy, and the principles and processes that underpin it. They approve the remuneration arrangements for our CEO and Non-Executive Directors. Changes to the Director fee pool and equity grants to the CEO are approved by shareholders.
Remuneration Committee
The Remuneration Committee approves reward arrangements for our Executive KMP (other than the CEO) and oversees the remuneration and benefits framework for all employees of South32.
By taking advice from other Board Committees (such as the Sustainability, and Risk and Audit Committees), the Remuneration Committee helps the Board oversee our remuneration policy, its specific application to the CEO, Executives and Non-Executive Directors and, in general, our employees.
The Remuneration Committee provides oversight to ensure our remuneration arrangements are equitable and aligned to the long-term interests of shareholders, operate within our risk framework, and support our purpose, strategy and values.
CEO and Management
Our CEO makes recommendations to the Remuneration Committee regarding our Executives, and how the remuneration policy and framework applies to our employees.
Management provides information and recommendations to the Remuneration Committee to help them consider and implement approved arrangements.
Exernal Advisors
We may engage external advisors either directly by the Remuneration Committee, or through management. These advisors provide information on remuneration-related issues, including benchmarking information and market data.
There were no remuneration recommendations received by the Remuneration Committee from external advisors in relation to KMP in FY21.
We seek information and analysis from a range of data sources. This allows us to make decisions that are informed, objective, weighted and aligned to the requirements of the company, and consistent with our Guiding Principles.
(1) See page 84 for further information on our service contracts.
Reward practices and outcomes
Our Guiding Principles
Purpose and Strategy
We align short-term and long-term performance measures to our purpose and strategy. This includes our efforts to:
– Optimise our business by working safely, minimising our impact, consistently delivering stable and predictable performance and continually improving our competitiveness;
– Unlock the full value of our business through our people, innovation, projects and technology;
– Identify and pursue opportunities to sustainably reshape our business for the future; and
– Achieve sector-leading total shareholder returns.
The way we work
Our culture is at the core of how we deliver our purpose and strategy. You’ll see it reflected in our values, the decisions we take, the courage we show in challenging situations and the legacy we leave.
Supporting this is a strong belief that culture can be actively shaped through a focus on what we prioritise, what we measure, what we reward and who we appoint.
Shareholders
Our Reward Framework focusses Executives and management on delivering superior total shareholder returns.
We do this through share ownership and LTI performance measures aligned to the shareholder experience.
We value feedback and regularly check-in with investors and proxy advisors.
Performance
We ensure our reward outcomes are aligned to performance by providing a large part of Executive pay ‘at risk’ based on challenging financial and non-financial measures.
STI outcomes reflect performance over the financial year, while LTI outcomes reflect performance over a four-year period.
Market
We ensure our reward is competitive and allows us to attract and retain talented Executives.
We benchmark our reward levels in consideration of similar sized companies in the ASX, as well as our global mining peer group.
73S
outh32 Annual R
eport 2021
Governance

Remuneration report continued
Components of our reward for FY21(1)
Our intentionAttract and retain talented Executives to lead South32
The majority of pay at risk reflects our commitment to pay for performance and deliver value to shareholders
Reward business and individual performance in the financial year
Drive long-term performance and ownership behaviours
Component Fixed Remuneration Short-Term Incentive Long-Term Incentive
The why
Fixed Remuneration is set with reference to the median of our peer groups, reflecting each Executive KMP’s responsibilities, location, skills and experience.
STI focuses efforts on our key priorities to ensure success for South32 both in the financial year and into the future. It motivates Executive KMP to achieve challenging performance objectives. Our STI reflects performance during the year and measures outcomes within management’s control.
LTI is aligned to the shareholder experience and delivery of lasting total shareholder returns.
The how
Base salary and superannuation(2).
50 per cent paid in cash annually.
50 per cent delivered in rights to South32 shares, deferred for two years.
Rights to receive South32 shares, subject to TSR performance measured over a four-year period, relative to two comparator groups.
Our approach in FY21
We benchmark our Fixed Remuneration and Total Reward against two key peer groups that reflect the markets in which we operate. Our peer groups are:
– An ASX peer group based on companies with half to double our market capitalisation (excluding foreign domiciled entities and real estate investment trusts); and
– A global mining peer group of 14 companies with a similar market capitalisation, commodity mix and/or geographic spread (see Our Global Mining Peer Group below).
Quantum (% of Fixed Remuneration):Target Value Max. Value
Executive KMP(2) 120% 180%
Business Scorecard: The Business Scorecard reflects a balance of financial and non-financial measures that are a priority for us in the financial year.
The financial measures remove the impact of commodity prices and foreign exchange to ensure that we reward for items management can control.
■ Sustainability (25%)
■ Financial: Production, cost and capital expenditure (25%)
■■ Financial: Adjusted ROIC (25%)
■ Strategic Goals (25%)
Business Modifier: As Scorecard measures do not always reflect all aspects of performance across a year, and to mitigate any unintended reward outcomes, the Board has the discretion to apply a Modifier to the Business Scorecard outcome. The Modifier may be applied to Executive KMP on an individual or group basis, having regard to the perspectives of stakeholders including employees, shareholders and communities.
Individual Performance and Behaviours: The Board also considers an Executive KMP’s individual performance, taking into account their areas of responsibility and how outcomes have been achieved (including alignment with our values).
Quantum (% of Fixed Remuneration):
The quantum for FY21(1) was determined on face value as a percentage of Fixed Remuneration:
Face Value Target Value
CEO 300% 120%Other KMP(2) 200% to 250% 80% to 100%
Comparator groups:
– Two-thirds relative to a mining sector index (IHS Markit Global Mining Index with constrained weighting by company and sector); and
– One-third relative to a world index (Morgan Stanley Capital International (MSCI) World Index).
Vesting:
100% vesting
40% vesting
0% vesting
TSR = index
TSR > index by 5.5% pa
There is no retesting if the performance condition is not met at the end of the performance period.
Our Global Mining Peer Group
The Global Mining Peer Group that we use as one of our reference points for benchmarking Fixed Remuneration and Total Reward levels includes the following companies:
– Agnico Eagle Mines, Alcoa, Anglo American, Antofogasta, Barrick Gold, Boliden AB, Eramet SA, First Quantum Minerals, Fortescue Metals Group, Freeport McMoRan, Newcrest Mining, Newmont, Teck Resources and Vedanta
(1) See page 87 for further information on the components of our reward for FY22.(2) As Jason Economidis is acting in role, he has retained much of his prior reward arrangements. This arrangement provides both the company and Mr Economidis with the
flexibility to move into a permanent Lead Team role or return into a senior management role outside the Lead Team should either of these options be appropriate at the relevant time. His Fixed Remuneration includes an acting allowance of $125,000. He has a Target STI of 90 per cent of base salary, of which one third is awarded in rights to South32 shares, deferred for two years. His deferred STI is less than the other Executive KMP as he is also granted Management Share Plan (MSP) retention rights. Mr Economidis continued to participate in the MSP that grants a portion of the LTI awards in performance rights, aligned to the Executive KMP LTI, and a portion in retention rights with a service-based hurdle. These MSP retention rights have a face value of A$200,000, being 40 per cent of his base salary of A$500,000. In FY21, recognising that Mr Economidis is acting in a KMP role, he received an LTI award (i.e. performance rights) that is aligned to that of the other Executive KMP, with a face value of 200 per cent of his base salary and a target value of 80 per cent.
74S
outh
32 A
nnua
l Rep
ort
2021
Gov
erna
nce

Target Remuneration for FY21South32 sets Target Remuneration for each Executive KMP at a competitive level to attract and retain the appropriate talent in the markets in which we operate. Our Target Remuneration is informed by the South32 Reward Framework (see page 73) that outlines the key factors the Board takes into consideration in setting executive remuneration and the strategic drivers of pay at South32.
It is important to ensure reward levels fairly reflect the responsibilities and contribution of the Executives and that outcomes are aligned to performance and the delivery of total shareholder returns. As a result, a portion of our Executive remuneration is at risk, based on challenging performance measures.
Target Remuneration, as outlined below, assumes on-target performance for the STI and considers the difficulty of achieving LTI performance hurdles given broader industry and South32-specific share price volatility. The figures reflected in the graph below are therefore based on STI paid at 100 per cent of target and LTI that is 40 per cent of the face value (see page 74 for details on face value).
Based on these principles, the annualised Target Remuneration as at 30 June 2021 for Executive KMP for a full year is summarised below.
Diagram 1.3 – FY21 Target Remuneration (A$’000)
(1) Jason Economidis was promoted to Acting Chief Operating Officer on 1 July 2020. As Mr Economidis is acting in the role, his Reward Framework reflects his previous role, including the award of retention rights as part of the Management Share Plan. He therefore receives proportionately less in Deferred STI (which are also issued as retention rights). This arrangement provides both the company and Mr Economidis with the flexibility to move into a permanent Lead Team role or return into a senior management role outside the Lead Team should either of these options be appropriate at the relevant time.
Target remuneration relative to peer groups (unaudited) South32 has operations and offices on six continents and competes for talent in a global pool.
Diagrams 1.4 and 1.5 illustrate the moderate approach adopted by South32 in positioning CEO Fixed Remuneration and Total Reward for FY21 compared to relevant benchmarks, being the ASX peer group and the Global Mining Sector peer group (see page 74). The level of Fixed Remuneration for the CEO is below the median for both of our peer groups.
As an additional reference, we have also included supplementary peer groups reflecting companies on the LSE (UK) and in the S&P 500 (US) that are half to double the market capitalisation of South32 Limited, based on the markets in which we also compete for executive talent.
Diagram 1.4 – CEO Fixed Remuneration vs. Peers
0
1,000
2,000
3,000
ASX Peers Global Peers UK US
A$’
000
South321,815
Diagram 1.5 – CEO Total Reward vs. Peers
A$’
000
ASX Peers Global Peers UK US
0
5,000
10,000
15,000
20,000
South326,171
South32 Median Upper and lower quartiles
600713 150
2,178
664
1,000
1,089
498
600
1,089
498
600
1,815
830
1,000
0 2,000 4,000 6,000
Mr G Kerr 6,171(71% at risk)
Mrs K Tovich 2,490(67% at risk)
Mr M Fraser 3,200(69% at risk)
Mr J Economidis(1) 1,763(60% at risk)
Fixed Remuneration
STI (Cash)
STI (Deferred rights)
LTI
Components
300
75S
outh32 Annual R
eport 2021
Governance

Remuneration report continued
Range of possible remuneration outcomesAs actual business and individual achievement over the performance period determines reward outcomes, the amount of actual pay (see page 72) received by an Executive each year will vary.
The diagram below illustrates the range of possible remuneration outcomes for the CEO, based on several performance outcome scenarios.
Diagram 1.6 – Range of remuneration outcomes (A$’000)
In the Minimum scenario, no STI or LTI is paid. The CEO would receive Fixed Remuneration, inclusive of superannuation, of A$1.815 million.
A Target outcome would be achieved where the business meets the challenging STI performance hurdles, resulting in STI being paid at Target levels (i.e. 67 per cent of maximum opportunity, or 120 per cent of Fixed Remuneration, with half deferred into shares) and the LTI meeting the TSR performance threshold and 40 per cent of shares vesting. Future share price movements are not included in the value of the Deferred STI or the LTI.
To deliver an Outstanding outcome for the STI (i.e. at maximum STI, or 180 per cent of Fixed Remuneration, with half deferred into shares) South32 would need to meet the robust stretch targets across all metrics in the Scorecard. For the LTI to vest in full, the South32 TSR would need to outperform both the sector index and the world index by more than 23.9 per cent over the four-year performance period. Future share price movements are not included in the value of the Deferred STI or LTI.
Fixed Remuneration for FY21In FY21, there were no increases to Fixed Remuneration for Graham Kerr, Katie Tovich or Mike Fraser. Jason Economidis commenced in his current role as Acting Chief Operating Officer on 1 July 2020.
Table 1.3 – Fixed Remuneration for Executive KMP in FY21
Executive KMP
FY20 Fixed Remuneration
(A$)
FY21 Fixed Remuneration
(A$)Increase
%
Mr G Kerr 1,815,000 1,815,000 0Mrs K Tovich 830,000 830,000 0Mr M Fraser 1,000,000 1,000,000 0Mr J Economidis(1) - 712,500 -
(1) Fixed Remuneration for Jason Economidis is only shown for the period he was a member of KMP (from 1 July 2020).
2,178
5,445
2,178
3,267
1,815
1,815
1,815
0 2,000 4,000 6,000 8,000 10,000
6,171(71% at risk)
Minimum
Target
1,815(all reward at risk is forfeited)
Outstanding 10,527(83% at risk)
Fixed Remuneration
STI (Cash & Deferred rights)
LTI (performance rights)
Components
76S
outh
32 A
nnua
l Rep
ort
2021
Gov
erna
nce
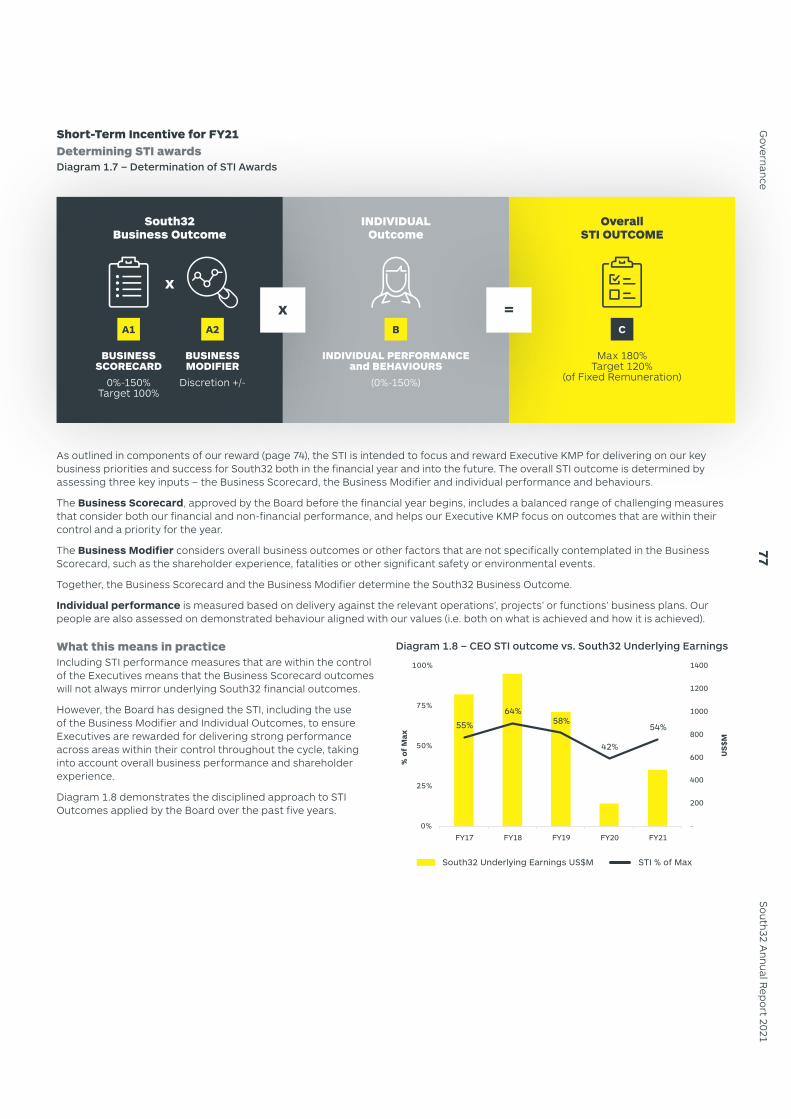
Overall STI OUTCOME
Max 180% Target 120%
(of Fixed Remuneration)
C
South32 Business Outcome
BUSINESS SCORECARD
0%-150% Target 100%
BUSINESS MODIFIER
Discretion +/-
x
A1 A2
INDIVIDUAL Outcome
INDIVIDUAL PERFORMANCE and BEHAVIOURS
(0%-150%)
B
Short-Term Incentive for FY21Determining STI awardsDiagram 1.7 – Determination of STI Awards
As outlined in components of our reward (page 74), the STI is intended to focus and reward Executive KMP for delivering on our key business priorities and success for South32 both in the financial year and into the future. The overall STI outcome is determined by assessing three key inputs – the Business Scorecard, the Business Modifier and individual performance and behaviours.
The Business Scorecard, approved by the Board before the financial year begins, includes a balanced range of challenging measures that consider both our financial and non-financial performance, and helps our Executive KMP focus on outcomes that are within their control and a priority for the year.
The Business Modifier considers overall business outcomes or other factors that are not specifically contemplated in the Business Scorecard, such as the shareholder experience, fatalities or other significant safety or environmental events.
Together, the Business Scorecard and the Business Modifier determine the South32 Business Outcome.
Individual performance is measured based on delivery against the relevant operations’, projects’ or functions’ business plans. Our people are also assessed on demonstrated behaviour aligned with our values (i.e. both on what is achieved and how it is achieved).
What this means in practiceIncluding STI performance measures that are within the control of the Executives means that the Business Scorecard outcomes will not always mirror underlying South32 financial outcomes.
However, the Board has designed the STI, including the use of the Business Modifier and Individual Outcomes, to ensure Executives are rewarded for delivering strong performance across areas within their control throughout the cycle, taking into account overall business performance and shareholder experience.
Diagram 1.8 demonstrates the disciplined approach to STI Outcomes applied by the Board over the past five years.
Diagram 1.8 – CEO STI outcome vs. South32 Underlying Earnings
South32 Underlying Earnings US$M STI % of Max
55%
64%58%
42%
54%
-
200
400
600
800
1000
1200
1400
FY17 FY18 FY19 FY20 FY21
0%
25%
50%
75%
100%
US
$M
% o
f M
ax
x =
77S
outh32 Annual R
eport 2021
Governance

Remuneration report continued
A1 FY21 Business Scorecard
Table 1.4 – FY21 Business Scorecard outcomesScorecard measure Weight Performance Outcome (Target = 25%)
Zero Target Maximum
Sustainability 25% 26%
Safety:
A 20 per cent reduction in TRIF compared to FY20.
Poor
We saw a reduction in recordable injuries for the period and four of our operations recorded their lowest TRIF to date. However, our TRIF increased by two per cent to 4.3 meaning our year-on-year performance did not meet our 20 per cent reduction target.
We are deeply saddened that a contractor working at SAEC was fatally injured in an incident involving the use of an elevated work platform in May 2021. South32 recognises the fatality in our STI through the Business Modifier (see page 80).
Significant Events and Hazards:
Ensure 90 per cent of significant event investigations completed and signed off within the allocated timeframe plus achieve a significant hazard frequency of "30".
Good
Eighty-three per cent of significant event investigations were signed off within the allocated timeframe.
Delivered a good significant hazard frequency of "41".
Health:
A 10 per cent reduction in material exposures from the baseline, plus develop an FY22 plan to reduce by 20 per cent the number of workers exposed above 200 per cent of the OEL.
Fair
Material exposures reduced by six per cent compared to the baseline(1). Plans have been developed to reduce the number of workers exposed above 200 per cent of the OEL by 15 per cent in FY22.
Environment:
Achieve Scope 1 and 2 emissions forecast of 24,649kt CO2-e(2) and Scope 1 emissions below 10,653kt CO2-e(2) (10 per cent below FY15 baseline). Define our public target and glidepath narrative and progress the critical decarbonisation studies, energy planning and offsets approach.
Excellent
In FY21, our combined Scope 1 and 2 emissions(3) were below our FY21 forecast, and our Scope 1 emissions were more than 15 per cent below our FY15 baseline.
In May 2021, we released our medium-term target to halve our operational carbon emissions (Scope 1 and 2) by 2035, stepping up our ambition on climate change and pathway to net zero.
We have progressed studies for our decarbonisation and energy transition projects at our most carbon intensive operations.
Community:
Implement Operational and Strategic Community Investment Plans on time and on budget. Mature our ‘outcome’ and ‘impact’ measurement through the continued implementation of the Community Investment Impact Measurement Framework.
Demonstrate an improvement in community outcomes across the four key ‘outcome’ indicators: education and leadership, economic participation, natural resource resilience, and good health and social wellbeing.
Excellent
FY21 Community spend was on budget. We matured our approach to measuring the outputs and outcomes of our community investments through the application of our Community Investment Impact Measurement Framework.
In FY21, we saw improved outcomes across our four investment priority areas, which are reported in our Sustainability Development Report.
Critical support was provided to communities and governments during the COVID-19 pandemic.
In addition, a social performance framework was completed and is being piloted.
Risk Management:
More than 90 per cent on time completion of planned control management activities plus deliver second line assurance over 15 per cent of material and strategic risks.
Excellent
In FY21, 93 per cent of controlled management activities were completed on time and second line assurance was delivered over 40 per cent of material risks.
(1) Baseline for Occupational Exposure Limits (OEL) excludes SAEC and TEMCO. More information can be found on page 14.(2) FY21 emission forecast and FY15 baseline include the updated methane Global Warming Potential factor in Australia.(3) A pro-rata calculation was applied for SAEC and TEMCO given their divestment part way through the year so that our emissions performance was not overstated in the FY21
Business Scorecard.
78S
outh
32 A
nnua
l Rep
ort
2021
Gov
erna
nce
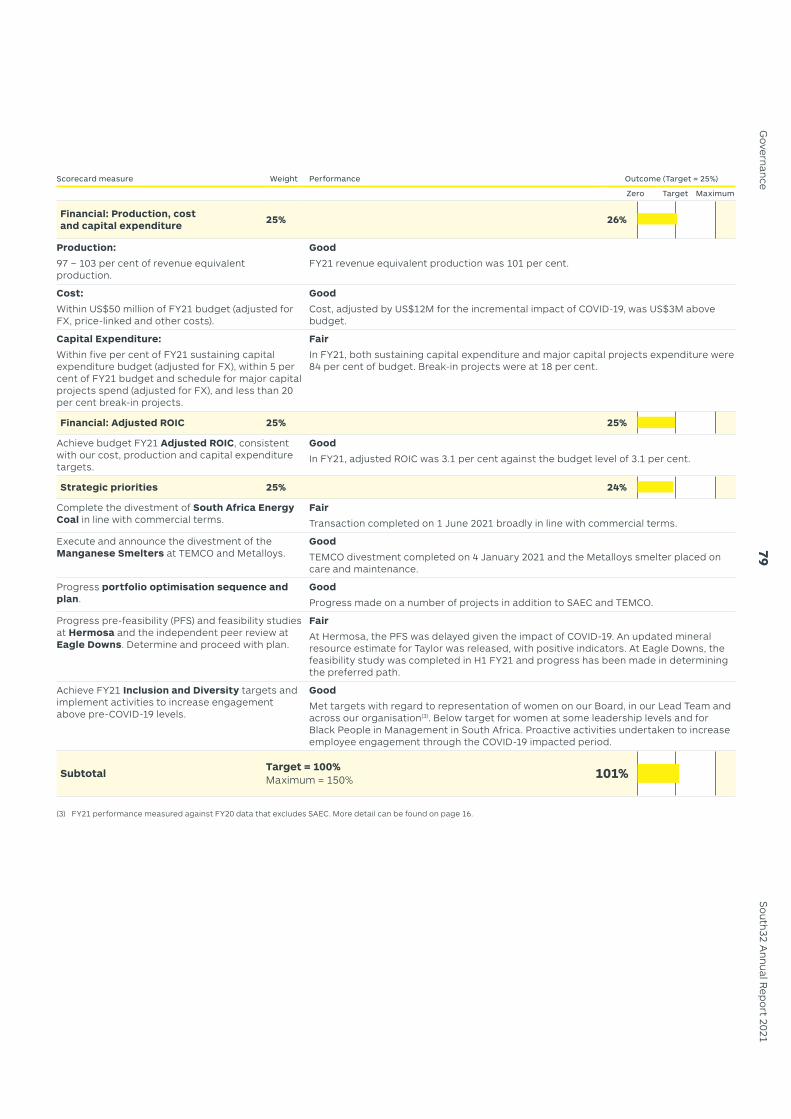
Scorecard measure Weight Performance Outcome (Target = 25%)
Zero Target Maximum
Financial: Production, cost and capital expenditure
25% 26%
Production:
97 – 103 per cent of revenue equivalent production.
Good
FY21 revenue equivalent production was 101 per cent.
Cost:
Within US$50 million of FY21 budget (adjusted for FX, price-linked and other costs).
Good
Cost, adjusted by US$12M for the incremental impact of COVID-19, was US$3M above budget.
Capital Expenditure:
Within five per cent of FY21 sustaining capital expenditure budget (adjusted for FX), within 5 per cent of FY21 budget and schedule for major capital projects spend (adjusted for FX), and less than 20 per cent break-in projects.
Fair
In FY21, both sustaining capital expenditure and major capital projects expenditure were 84 per cent of budget. Break-in projects were at 18 per cent.
Financial: Adjusted ROIC 25% 25%
Achieve budget FY21 Adjusted ROIC, consistent with our cost, production and capital expenditure targets.
Good
In FY21, adjusted ROIC was 3.1 per cent against the budget level of 3.1 per cent.
Strategic priorities 25% 24%
Complete the divestment of South Africa Energy Coal in line with commercial terms.
Fair
Transaction completed on 1 June 2021 broadly in line with commercial terms.
Execute and announce the divestment of the Manganese Smelters at TEMCO and Metalloys.
Good
TEMCO divestment completed on 4 January 2021 and the Metalloys smelter placed on care and maintenance.
Progress portfolio optimisation sequence and plan.
Good
Progress made on a number of projects in addition to SAEC and TEMCO.
Progress pre-feasibility (PFS) and feasibility studies at Hermosa and the independent peer review at Eagle Downs. Determine and proceed with plan.
Fair
At Hermosa, the PFS was delayed given the impact of COVID-19. An updated mineral resource estimate for Taylor was released, with positive indicators. At Eagle Downs, the feasibility study was completed in H1 FY21 and progress has been made in determining the preferred path.
Achieve FY21 Inclusion and Diversity targets and implement activities to increase engagement above pre-COVID-19 levels.
Good
Met targets with regard to representation of women on our Board, in our Lead Team and across our organisation(3). Below target for women at some leadership levels and for Black People in Management in South Africa. Proactive activities undertaken to increase employee engagement through the COVID-19 impacted period.
Subtotal
(3) FY21 performance measured against FY20 data that excludes SAEC. More detail can be found on page 16.
Target = 100% Maximum = 150% 101%
79S
outh32 Annual R
eport 2021
Governance

Remuneration report continued
A2 FY21 Business Modifier
The Business Modifier is an integral component of the STI that considers overall business outcomes or other factors that are not specifically contemplated in the Business Scorecard, such as:
– the shareholder experience;
– unexpected material external events, including the impact of a global pandemic or significant disruption to global trade;
– fatalities and significant safety or environmental issues;
– significant reputational issues; or
– an assessment of risk, culture or any other item that the Board considers appropriate.
The Modifier, based on Board discretion, ensures that STI outcomes reflect overall business performance, including both what has been delivered and how it has been achieved. The outcome may also be positive or negative, or may be applied to an Executive KMP on an individual or a group basis depending on the factors under consideration.
For FY21, the Board considered a number of factors before deciding on the application of the Business Modifier:
– In May 2021, Mr Petros Sibeko, a contractor working on the Klipspruit Extension Project at South Africa Energy Coal was fatally injured following an incident involving the use of an elevated platform. We are deeply saddened by this event and will never be truly successful until we eliminate fatalities and significant incidents.
– We delivered strong operating results, including record production at Worsley Alumina, Brazil Alumina and Australia Manganese, while controlling our costs and reducing capital expenditure. In FY21 the business delivered underlying EBIT of US$844 million (US$446 million in FY20), free cash flow of US$825 million(1) (US$583 million in FY20) and returned US$670 million to our shareholders (US$424 million in FY20). Under the circumstances, our strong operating results for FY21 are an excellent achievement.
– Our teams remained resilient to the ongoing challenges provided by COVID-19, which were most acute in Southern Africa, Colombia and Brazil. Our response to the pandemic is unchanged and we continue to make every effort to keep our people safe and well, maintain safe and reliable operations and support our communities.
On balance, and considering the actual pay outcomes, encompassing Fixed Remuneration, STI and LTI, the Board applied a negative Business Modifier to Executive KMP to reflect the fatality. For the CEO and the COO Africa, a Business Modifier of negative 20 per cent has been applied. For all other Executive KMP, a Business Modifier of negative five per cent has been applied to the overall STI outcome.
As part of its deliberations, the Board also discussed the impact of the New South Wales (NSW) Independent Planning Commission’s refusal of our application for the Dendrobium Next Domain (DND) life extension project at Illawarra Metallurgical Coal (IMC). This decision was unexpected, both for management and other external stakeholders, and reflected a fundamental shift in the approvals landscape. Subsequently, the NSW State Legislative Council passed a motion requesting that any further development of DND be declared as state significant infrastructure. Given the resultant level of uncertainty in the approvals process, we impaired the carrying value of Illawarra Metallurgical Coal by US$728M (post tax ~US$510M), which led to a statutory loss at the Group level in FY21. In light of the prevailing circumstances, the Board concluded that the contributing factors to the impairment were beyond management’s control. The Board also considered the shareholder experience during the year, including our strong cash generation that enabled the payment of dividends, the continuation of our capital management program and strong share price appreciation. Consequently, the Board elected not to further penalise Executive KMP by increasing the negative impact of the Business Modifier.
Table 1.5 summarises the application of the Business Modifier since FY17.
Table 1.5 – Application of the Business Modifier by the Board (multiplier applied to the Business Scorecard outcome)
Modifier for Modifier applied in previous yearsFY21 FY20 FY19 FY18 FY17
CEO:
COO Africa:
Other Executive KMP:
-20%
-20%
-5%
-30%
-30%
-15%No modifier
applied
-15%
-15%
-5%
-2.5%
-5%
-One fatality in
South Africa and statutory loss
as a result of the impairment
One fatality in South Africa and a decline
in earnings and share price
One fatality in South Africa and the
impact of the Appin mine suspension
in FY17
One fatality in South Africa
(1) Free cash flow from operations including net distributions from our manganese equity accounted investments (EAI).
80S
outh
32 A
nnua
l Rep
ort
2021
Gov
erna
nce

B FY21 individual performance
Our Board determines the Individual Scorecard measures for Executive KMP in relation to what was delivered, as demonstrated in the performance of the Executive’s portfolio, and how it was delivered, which considers demonstrated leadership and behaviour aligned to our values, risk framework and governance processes.
While the Board acknowledged FY21 was an excellent year for the CEO under difficult circumstances, when reflecting on Graham Kerr’s performance the Board agreed not to apply an individual outcome, deeming the overall South32 business outcome to be appropriate for the CEO.
Individual outcomes were applied to the other Executive KMP, reflecting the performance of their areas of accountability. These outcomes ranged from 95 per cent to 120 per cent, as indicated in Table 1.6 below.
C Overall FY21 STI outcomes
Overall STI outcomes for FY21 are determined through our Board’s assessment of the Business and Individual Outcomes, as outlined in Table 1.6.
Table 1.6 – STI earned by Executive KMP in respect of FY21 performance
Executive KMP
Business Scorecard
Outcome %
(A1)
Modifier +/- %
(A2)
Individual Outcome %
(B)
Overall STI Outcome
% of Target
A1 x (1+A2) x B
Total
STI Awarded
(A$’000)
Cash
(A$’000)(1)
Deferred Rights
(A$’000)
Percentage of maximum STI
Awarded (%) Forfeited (%)
Mr G Kerr 101 -20 100(2) 81 1,758 879 879 54 46Mrs K Tovich 101 -5 120 115 1,146 573 573 77 23Mr M Fraser 101 -20 100 81 968 484 484 54 46Mr J Economidis(3) 101 -5 95 91 410 273 137 61 39
(1) The Cash portion of the STI will be paid in cash in September 2021. The deferred rights to receive South32 shares are anticipated to be granted in or around December 2021 and will be due to vest in August 2023. The rights remain subject to continued service with the South32 Group.
(2) The Board determined to apply the overall South32 Business Outcome to the CEO, Graham Kerr. His Individual Outcome was therefore deemed to be 100.(3) As Jason Economidis is acting in role, he has retained much of his prior reward arrangements. He has a reduced portion of Deferred STI as he is granted retention rights as part
of the Management Share Plan awards that are applicable to his prior role. See page 74 for further information on Mr Economidis’ reward arrangements.
81S
outh32 Annual R
eport 2021
Governance

Remuneration report continued
Long-Term IncentiveFY18 LTI and Management Share Plan Performance AwardOur FY18 LTI awards were tested for vesting subject to service and performance conditions to 30 June 2021. These awards are subject to TSR performance conditions over four years, with two-thirds measured in reference to a mining sector index (the IHS Markit Global Mining Index) and one third with reference to a world index (the MSCI World Index). The four-year period for this award was from 1 July 2017 to 30 June 2021.
For the LTI Awards to vest in full, they would need to outperform both indices by at least 23.9 per cent over the performance period (5.5 per cent per annum cumulative). Given that our TSR failed to meet the threshold level of performance required against both comparator indices (see Diagram 1.9 and Table 1.7), these awards lapsed in full in August 2021.
South32 employees in management roles below the Lead Team participate in the Management Share Plan (MSP). We granted Katie Tovich and Jason Economidis their FY18 MSP Performance Awards before becoming Executive KMP. These awards have the same performance and vesting conditions as our FY18 LTI Awards and have therefore also lapsed in full in August 2021.
Diagram 1.9 – Indicative TSR performance: South32 vs comparators Diagram 1.10 – Vesting Outcome
Tota
l Sh
are
ho
lde
r R
etu
rn (T
SR
)
-50%
0%
50%
100%
150%
FY17 FY18 FY19 FY20 FY21
South32 Sector Index World Index
100% vesting
40% vesting
0% vesting
TSR = index
TSR > index by 5.5% pa
Table 1.7 – South32 LTI Award vesting outcome
TSR performance(1)(2)Vesting
outcomeIndex
weighting
Weighted vesting
outcome
Index (A) South32 (B)Required for 100% vesting Achieved (B-A) (C) (D) (C x D)
Sector Index 125%31%
Index+23.9% (94%) 0% 2/3 0%World Index 69% Index+23.9% (38%) 0% 1/3 0%
0%
(1) TSR performance reflects the one-month average return from 30 June 2017 at the start of the performance period, to the one-month average return to 30 June 2021 at the end of the performance period.
(2) The Board and Remuneration Committee use information from an external provider to inform them of the performance of the relevant index to assess the vesting outcome for the LTI.
FY19 Management Share Plan Retention AwardWhile South32 does not offer retention rights to permanent members of the Lead Team, we allow employees who are promoted into Executive KMP roles to retain unvested awards that had been granted under the Management Share Plan (MSP) while in their prior role. MSP awards are a combination of performance rights and retention rights.
We granted the FY19 MSP Retention Awards to Katie Tovich and Jason Economidis before they became members of KMP. Given the retention-focused objective of these awards, the vesting conditions are service-based (with a service condition to 30 June 2021) with no additional performance conditions. As the service condition was met, our Board approved these awards to vest in full in August 2021. The structure of the MSP is detailed on page 92.
Sector Index World Index
82S
outh
32 A
nnua
l Rep
ort
2021
Gov
erna
nce

LTI outcomes in FY21Table 1.8 – South32 LTI awards vested or lapsed/forfeited
Executive KMP AwardNumber of
rights grantedNumber of
rights vested
Number of rights lapsed/
forfeited
Value at grant(1)
(A$’000)
Value lapsed/forfeited(2)
(A$’000)
Value of Share price
movement(3) (A$’000)
Value at vesting(4) (A$’000)
Mr G Kerr FY18 LTI 2,026,717 - 2,026,717 5,310 5,310 - -Mrs K Tovich FY18 MSP Performance 189,312 - 189,312 496 496 - -
FY19 MSP Retention 55,725 55,725 - 204 - (41) 163Mr M Fraser FY18 LTI 925,572 - 925,572 2,425 2,425 - -Mr J Economidis FY18 MSP Performance 73,156 - 73,156 192 192 - -
FY19 MSP Retention 49,481 49,481 - 181 - (36) 145
(1) ‘Value at grant’ is the number of rights granted multiplied by the grant determination price in June 2017 of A$2.62 (FY18 LTI/FY18 MSP Performance) and June 2018 of A$3.66 (FY19 MSP Retention), based on the Volume Weighted Average Price (VWAP) over the last 10 trading days in June of the respective year.
(2) ‘Value lapsed/forfeited’ is the number of rights lapsed/forfeited based on performance relative to the performance measures, multiplied by the grant determination price of A$2.62 (for the FY18 LTI/FY18 MSP Performance).
(3) ‘Value of share price movement’ is the number of shares that vested, multiplied by the difference between the grant determination price of A$3.66 (for the FY19 MSP Retention) and the share price at 30 June 2021 of A$2.93. This reflects the value added/(lost) due to the change in share price since the start of the performance period.
(4) ‘Value at Vesting’ is the number of shares that vested in August 2021, multiplied by the closing share price of South32 shares on 30 June 2021 of A$2.93.
LTI granted in FY21As part of our FY21 LTI Plan, we granted performance rights to Executive KMP in December 2020. These awards have a four-year performance period and are subject to performance hurdles (outlined on page 74).
As Jason Economidis was acting in the COO role in FY21, he continued to participate in the MSP that grants a portion of the LTI awards in performance rights, aligned to the Executive KMP LTI, and a portion in retention rights with a service-based hurdle. As he receives the MSP retention rights, he is allocated proportionately less Deferred STI. The FY21 MSP Retention Awards have a three-year service-based vesting condition only (see Table 1.14 for key terms for the MSP). In recognition that Mr Economidis is acting as a member of Executive KMP, he was granted the same level of LTI award as the other Executive KMP.
Shareholders approved, under ASX Listing Rule 10.14, the grant of rights for the CEO at the AGM on 29 October 2020.
As outlined in the 2020 Notice of Meeting, in light of the drop in the South32 share price from FY19 to FY20, the Board exercised its discretion to determine that, for the CEO, the value of the FY21 LTI that can be received in the year of vesting will be limited to twice the grant value of the award.
Any value above that level that would otherwise be received based on testing against the performance conditions, will be forfeited or, in exceptional circumstances and at the Board’s discretion, deferred for a further period. The discretion to defer vesting of a portion of the award in excess of the maximum value, would be exercised in accordance with our Guiding Principles (set out on page 73) with particular regard to alignment with the experience of our shareholders.
The vesting outcome applied to the CEO at that time will inform the Board’s application of discretion with regard to the vesting value for other Executive KMP.
Table 1.9 – FY21 LTI grants
Reward determination(1)
(calculated at the start of the performance period 1 July 2020)Grant
(December 2020)
Executive KMP Award
Face Value (% of Fixed
Remuneration)(2)Face value
(A$’000)
Target value(3) (% of Fixed
Remuneration)Target value
(A$’000)
Number of rights
granted(4)
Mr G Kerr FY21 LTI 300 5,445 120 2,178 2,695,544Mrs K Tovich FY21 LTI 200 1,660 80 664 821,782Mr M Fraser FY21 LTI 250 2,500 100 1,000 1,237,623Mr J Economidis FY21 MSP Retention Award 40 200 40 200 99,009
FY21 MSP Performance Award 200 1,000 80 400 495,049
(1) The grant of awards is based on the face value as outlined in Components of our reward (see page 74).(2) For Jason Economidis, face value is calculated as a percentage of his salary (A$500,000). (3) The target value considers the difficulty of achieving performance hurdles and anticipated share price volatility.(4) The number of rights granted to Executive KMP in December 2020 is calculated by dividing the face value by the VWAP of South32 shares traded on the ASX over the last
10 trading days of June 2020 (Grant Price), being A$2.02. The Fair Value at grant for accounting purposes, as calculated by PwC, was A$1.18 per right for the FY21 LTI Award granted to the CEO, $1.30 per right for FY21 LTI Award granted to other Executive KMP and the FY21 MSP Performance Award, and $2.28 per right for FY21 MSP Retention Award.
83S
outh32 Annual R
eport 2021
Governance

Remuneration report continued
Terms and conditions of rights awarded under equity plans
Type of equity We deliver deferred STI and LTI equity awards (including Transitional Performance and MSP awards) in the form of share rights. These are rights to receive fully paid ordinary shares in South32 Limited(1) subject to meeting specific performance and vesting conditions (Rights). As the Rights are an element of remuneration, no amount is payable by employees to be allocated the Rights. If the Rights vest, no consideration or exercise price is payable for the allocation of shares. As Rights are automatically exercised, they do not have an expiry date.
Dividend and voting rights
Rights carry no entitlement to voting, dividends or dividend equivalent payments.
Cessation of employment
Unless our Board determines otherwise:
– Resignation or termination for cause: all unvested Rights lapse;
– Death, serious injury, disability or illness that prevents continued employment or total permanent disability: all unvested Rights vest immediately; and
– Other circumstances, generally:
– Deferred STI awards vest immediately;
– LTI and MSP Performance awards are pro-rated and the reduced portion remains on foot and eligible for vesting in the ordinary course, subject to any applicable performance hurdles; and
– MSP Retention awards are pro-rated and the reduced portion vests immediately.
Change of control Our Board can determine the level of vesting (if any) having regard to the portion of the vesting period elapsed, performance to date against any applicable performance conditions and other factors they deem appropriate.
Malus and clawback
Our Board can reduce or clawback all vested and unvested STI and LTI awards in certain circumstances to ensure Executives don’t obtain an inappropriate benefit. These circumstances are broad, and can include:
– An Executive engaging in misconduct;
– A material misstatement of our accounts results in vesting;
– Behaviours of Executives that bring us into disrepute; and
– Any other factor our Board deems justifiable.
Rights to participate in new issues
A participant can’t take part in new issues of securities in relation to their unvested Rights. However, the relevant plan rules include specific provisions dealing with rights issues, bonus issues and corporate actions, and other capital reconstructions.
(1) References in this Remuneration report to ‘South32 shares’ are references to fully paid ordinary shares in South32 Limited.
Minimum Shareholding Requirements and service contracts
Minimum Shareholding Requirement
A Minimum Shareholding Requirement (MSR), equal to 100 per cent of Fixed Remuneration for Executive KMP, drives a long-term focus and alignment with our shareholders. The MSR applies to all Executive KMP and must be obtained within five years of appointment as a KMP(1).
See page 92 for current shareholdings of our Executive KMP.
Our service contracts
Contracts are entered into by Executive KMP in their personal capacity. The key terms are consistent for all Executive KMP, and include:
– No fixed term;
– Six months’ notice by either party or payment by the company in lieu of notice; or
– Termination without notice for serious misconduct; or
– Two months’ notice by the Executive where a fundamental change occurs that materially diminishes their status, duties, authority or terms and conditions (receiving payment in lieu of six months’ notice)(2).
The maximum payment in lieu of notice won’t exceed six months’ Fixed Remuneration. Executive KMP will be subject to several post-employment restraints for a period of up to six months after their employment with the Group ends. Shareholder approval was granted at the 2018 Annual General Meeting (AGM) in relation to termination benefits for Executive KMP for a further three years and further shareholder approval will be sought to refresh this approval at the 2021 AGM.
(1) The minimum shareholding requirement does not apply to Jason Economidis as he is acting in role. (2) As Jason Economidis is acting in role, the clause does not form part of his contract.
84S
outh
32 A
nnua
l Rep
ort
2021
Gov
erna
nce

Non-Executive Director remunerationRemuneration policyAs a global company, it’s important that we offer competitive Director fees to help us attract the appropriate level of experience from a diverse global pool. These fees reflect the size, complexity and global nature of our business and acknowledge the responsibilities of serving on our Board.
To ensure the independence of our Non-Executive Directors, their remuneration does not have an ‘at risk’ element.
We pay committee fees to recognise the additional responsibilities associated with participating on a Board Committee.
We pay a fixed fee to our Board Chair for all responsibilities, including participation on any Board Committees.
FY21 Non-Executive Director fees and fee poolWe review fees every year and may get external advice to help us do so. We based the review of FY21 fees on data provided by external consultants, which resulted in no increase in the Chair and Non-Executive Directors’ fees for FY21. Committee fees also remained unchanged.
The maximum aggregate amount we can pay our Non-Executive Directors is still A$3.9 million per annum (Fee Pool). Before making any changes to this, we will always seek shareholder approval.
The table below outlines the fee levels for FY21.
Table 1.10 – FY21 Board fees (effective 1 September 2020)
Fee DescriptionFY21 fee
(A$ per annum) Increase %
Board Fees
Board of Directors
Chair of the Board
Other Non-Executive Directors
578,000
189,250
0
0
Committee Fees
Risk and Audit, Remuneration and Sustainability Committees
Committee Chair
Members
46,000
23,000
0
0
Minimum shareholding requirementsEach Non-Executive Director is required to accumulate a minimum shareholding level of one year’s base fees within a reasonable period. You can find more details of their current shareholdings in Table 1.15.
Travel allowanceAs a global company, our Board meetings are ordinarily held in Australia, South Africa and other locations, where travel restrictions allow (see page 63 for more details). Site visits are also an important part of our usual Board program, giving Directors:
– A better understanding of workplace culture through interactions with site-based employees;
– An improved understanding of local and operational risks;
– A chance to participate in continuous education; and
– On-the-ground experience.
As these meetings, site visits and other engagements take time and commitment, particularly if they’re in remote locations, we would usually give our Directors an allowance to compensate for this.
However, with COVID-19 and its impact on global travel, our Board has not had the opportunity to all meet physically or undertake site visits this financial year and as such, no travel-related payments were made in FY21.
Having reviewed Director travel allowances, we have decided to substantially reduce them from FY22 in the event travel is possible (see page 89 for further details).
85S
outh32 Annual R
eport 2021
Governance

Remuneration report continued
FY21 Non-Executive Director remunerationIn Table 1.11, we’ve set out the statutory disclosures required under the Corporations Act and in accordance with Australian Accounting Standards, in respect of FY21 remuneration paid to Non-Executive Directors.
Table 1.11 – Non-Executive Director remuneration (A$’000)
Short-term benefitsPost-employment
benefits
Non-Executive Director FY21 term
Board & Committee
feesNon-monetary
benefits(1)
Other cash allowances &
benefits(2) Superannuation Total
Ms Karen Wood Full year FY21 556 - - 22 578FY20 555 - 41 21 617
Mr Frank Cooper AO Full year FY21 237 - - 22 259FY20 237 - 25 21 283
Mr Guy Lansdown(3) Full year FY21 235 2 - - 237FY20 137 - 34 - 171
Dr Xiaoling Liu Full year FY21 214 - - 22 236FY20 214 - 32 21 267
Dr Ntombifuthi Mtoba Full year FY21 212 2 - - 214FY20 208 2 50 3 263
Mr Wayne Osborn(4) Full year FY21 237 - - 22 259FY20 272 - 49 21 342
Mr Keith Rumble(5) Full year FY21 305 2 - - 307FY20 279 2 58 3 342
TOTAL FY21 1,996 6 - 88 2,090FY20 1,902 4 289 90 2,285
(1) Includes assistance for tax return preparation in FY20 and FY21.(2) Includes travel allowance paid in FY20.(3) Guy Lansdown joined the Board as an independent Non-Executive Director on 2 December 2019. FY20 details reflect this appointment date.(4) FY20 fees for Wayne Osborn include backpay for FY19, relating to his role as interim Chair of the Nomination and Governance Committee. The total payment made relating to
this role for the period 1 August 2018 to 31 December 2019 was A$35,417 (i.e. A$25,000 per annum).(5) Keith Rumble received remuneration of ZAR 539,750 for his role as a Non-Executive Director of South32 SA Coal Holdings (Pty) Ltd during FY21 (ZAR 262,889 in FY20). This
figure is included in Board and Committee fees above based on a foreign exchange rate of AUD1:ZAR11.60 (AUD1:ZAR10.51 in FY20).
86S
outh
32 A
nnua
l Rep
ort
2021
Gov
erna
nce

Looking forward to FY22Our purpose is to make a difference by developing natural resources, improving people’s lives now and for generations to come. We are trusted by our owners and partners to realise the potential of their resources.
Our purpose is underpinned by our simple yet powerful strategy which is focused on optimising the performance of our operations, unlocking their potential and identifying new opportunities to create value for all our stakeholders. This has seen us significantly simplify and reposition our portfolio for a low carbon future, and we’ve added multiple growth options and a pipeline of greenfield exploration projects with a bias to base metals. We’re also working hard to minimise our impact as emphasised by our recent commitment to halve operational carbon emissions (Scope 1 and 2) by 2035.
Our Reward Framework is designed to be fit-for-purpose through the business cycle, allowing the Board to find the right balance between remuneration outcomes that reward and incentivise our Executives, while also reflecting overall business performance and shareholder experience.
Although we have maintained a consistent approach to remuneration since Demerger and believe shareholders will be best placed if we retain the core elements of our Reward Framework, there are now opportunities for enhancement. The recent divestments of SAEC and TEMCO, the pending completion of the Taylor pre-feasibility study and our aim to halve operational carbon emissions (Scope 1 and 2) by 2035, mean the timing is now right for us to embed those enhancements into our executive Reward Framework from FY22. These changes, which are outlined below, will further enhance the link between executive remuneration and our business strategy and priorities.
Long-term incentiveWe are enhancing our LTI design for FY22 through three adjustments that are summarised in diagram 1.11.
Diagram 1.11 - South32 Long-Term Incentive - weighting of measures and reduction in value for the CEO from FY21 to FY22
300% of FR(1)
A$5,445,000
Relative TSRvs MSCI Index
Relative TSRvs MSCI Index
Strategic Measures
Relative TSRvs GlobalMining Index
Relative TSRvs Global MiningConstituents
200% of FRA$3,630,000
3
1
2
FY21 LTI (CEO) FY22 LTI (CEO)
LTI face value reduced by 33%
1 The introduction of strategic measures into the LTI, making up 20 per cent of the performance hurdles for the incentive.
2 A shift from the Index to particular constituents of the global mining comparator group from which one element of relative TSR is measured.
3 A reduction in the face value of the awards.
(1) Figures reflect reward for South32 CEO, based on Fixed Remuneration (FR) of A$1,815,000.
Introduction of strategic measuresWe will be incorporating two strategic measures into the LTI that are aligned to our long-term business priorities. Namely, our approach to climate change and the transition of our portfolio towards those future facing base metals, as these elements will underpin the long-term success of our business and the protection and creation of value for shareholders. The strategic measures will have a weighting of 10 per cent each, for a total weighting of 20 per cent of the LTI performance hurdles.
Climate change measure:
We have announced plans to reduce our operational carbon emissions (Scope 1 and 2) by 50 per cent between FY21 and 2035, relative to our FY21 baseline, by implementing our Decarbonisation Strategy, which includes:
– The advancement of conceptual projects through our capital investment tollgates, and the successful commissioning of identified emissions reduction projects;
– The ongoing assessment of new technologies and alternative energy sources; and
– Continued participation and direct investment in research and development partnerships.
Consistent with our purpose, we will work to provide a Just Transition towards net zero in a way that supports our people, local communities and other stakeholders.
Portfolio management measure:
We are planning to further reshape our business for a low carbon world and increase our exposure to future facing base metals by:
– Building a high-quality portfolio of greenfields and brownfields exploration and development options;
– Optimising our existing portfolio by responsibly transferring ownership of non-core operations or transitioning them to closure;
– Developing or acquiring operations which are cash generative through the cycle, improving the overall quality of our business; and
– Maintaining discipline by adhering to our proven Capital Management Framework.
87S
outh32 Annual R
eport 2021
Governance

Remuneration report continued
Assessing performance for the strategic measures:
The success of these strategic initiatives will be measured on our ability to make material progress in these areas, whilst protecting and creating shareholder value as we navigate this business-critical transformation. Transparent disclosure for these two strategic measures will be provided at the end of each 12-month period in the Remuneration report so that external stakeholders have sufficient information to track and judge progress.
Key elements of these awards include:
– For FY22, each measure will make up 10 per cent of the LTI;
– Performance will be measured over a four-year performance period; and
– The Board will retain full discretion when determining the final vesting outcome.
Vesting outcomes for the strategic measures will be determined by the Board following the end of the four-year performance period on 30 June 2025. The Board’s rationale in assessing performance and determining these vesting outcomes will be clearly articulated.
Shift from index to constituents for the global mining comparator groupFor FY22, 80 per cent of the LTI will continue to be assessed on the basis of our TSR performance when compared to two comparator groups:
– A global mining comparator group for two thirds of this element. Where we have used the IHS Markit Global Mining Index in the past, we will shift to a fixed constituent group of companies. This constituent group will be made up of all companies that comprise the IHS Markit Global Mining Index at the start of the performance period and will be locked in for the four-year performance period (with Board discretion to make adjustments to take into account events such as takeovers, mergers or Demergers that may occur during the performance period). The threshold for vesting will be the median (P50) of this group, with the stretch being the upper quartile (P75). These changes will bring South32’s approach more in line with market practice; and
– A world comparator group for one third of this element. We will continue to adopt the Morgan Stanley Capital International (MSCI) World Index over the four-year performance period, with no change to the vesting criteria.
We believe that maintaining an overall weighting of 80 per cent for TSR performance will ensure the LTI retains its core purpose of directly aligning CEO and Executive KMP long-term incentive payments with returns received by shareholders.
Reduction in face valueThe face value of the LTI for the CEO will reduce by 33 per cent, from 300 per cent to 200 per cent of Fixed Remuneration from FY22, with proportionate reductions in the LTI face value for other Executive KMP. These reductions in face value reflect the changes that have been taking place in the broader market and improve alignment with our Guiding Principles (see page 73).
Notwithstanding the reduction in face value, we will not change the Target LTI or Target Total Reward for the CEO, or other Executive KMP, as we believe these remain appropriate for their roles (see page 75).
This means that the Total Reward (based on face value) for the CEO will reduce by 19 per cent from FY22. The face value Total Reward for Executive KMP will reduce by between 12 per cent and 18 per cent.
88S
outh
32 A
nnua
l Rep
ort
2021
Gov
erna
nce

Fixed RemunerationThere will be no increase to Fixed Remuneration in FY22 for Graham Kerr or Mike Fraser. Katie Tovich and Jason Economidis will receive modest Fixed Remuneration increases to A$870,000 and A$730,740, respectively. The CEO’s Fixed Remuneration will remain at A$1,815,000 per annum.
Short-term incentiveThe value of the STI will remain unchanged from FY21. However, with the inclusion of climate change and portfolio management as strategic measures in the LTI, we have reviewed the STI measures and weightings to ensure that:
– There is no double-counting between STI and LTI measures;
– We have an appropriate balance of measures across the elements of variable pay; and
– We align the performance measures with the most appropriate performance period.
For FY22, the overall design and key performance metrics of the STI will remain unchanged, with our Business Scorecard focused on maintaining safe, reliable and profitable operations.
Performance Metrics Measures FY21 weighting FY22 weighting Change to measures
SustainabilitySafety, Health, Risk Management & Community
25% 28.3%Adjusted to increase the weighting of the financial measures in the STI given the inclusion of the strategic measures in the LTI for FY22.
FinancialAdjusted Return on Invested Capital 25% 28.3%
Production, cost and capital expenditure 25% 28.3%
Strategic Items Key elements of the FY22 Business Plan 25% 15%
X
Business ModifierConsider factors that are not specifically contemplated in the Scorecard
+/- +/-
=
South32 Business Outcome Reflects our performance over the financial year
Director feesThere will be no increase to Non-Executive Director fees in FY22.
As from FY22, the travel allowance has been reduced by at least 36 per cent. Other than for domestic travel to a regularly scheduled Board meeting, where air travel to a Board commitment is greater than three hours but less than 10 hours to the destination, a one-off allowance of A$5,000 per trip now applies (FY21 was A$7,840). Where air travel is greater than 10 hours to the destination, the allowance per trip is now A$10,000 (FY21 was A$16,800).
The travel allowance is only paid where travel is undertaken.
89S
outh32 Annual R
eport 2021
Governance

Statutory disclosuresStatutory remuneration table for Executive KMPIn the following table, we’ve set out the statutory disclosures required under the Corporations Act and in accordance with the Australian Accounting Standards. The amounts shown reflect the remuneration for each member of Executive KMP that relates to their service in FY21.
Table 1.12 – Statutory remuneration of Executive KMP in FY21 (A$’000)
Short-term benefits
Post employment
benefitsTermination
benefits
Other long-term benefits(3)
Share based payments(4)
Total Remuneration
Percentage of total
remuneration which is
performance testedExecutive KMP Salary
Cash bonus(1)
Non-monetary benefits(2) Superannuation LTI STI
Mr G Kerr FY21 1,765 879 27 23 - 165 2,746 798 6,403 69%FY20 1,713 690 21 21 - 166 3,856 833 7,300 74%
Mrs K Tovich FY21 755 573 12 25 - 74 618 324 2,381 64%FY20 772 383 10 25 - 74 632 159 2,055 57%
Mr M Fraser FY21 905 484 78 21 - 92 1,296 430 3,306 67%FY20 888 380 40 21 - 91 1,794 451 3,665 72%
Mr J Economidis(5) FY21 624 273 46 88 - 46 425 43 1,545 48%FY20 - - - - - - - - - -
TOTAL FY21 4,049 2,209 163 157 - 377 5,085 1,595 13,635FY20 3,373 1,453 71 67 - 331 6,282 1,443 13,020
(1) STI is provided half in cash (which is included in the cash bonus column of the table) in September 2021 following the end of the performance period and half in deferred rights (which is included in the share-based payments column of the table). The value of the deferred equity portion is amortised over the vesting period. As Jason Economidis is currently acting in the COO role, 66.7 per cent of his STI is provided in cash in September 2021 with the remaining 33.3 per cent paid in deferred rights.
(2) Non-monetary benefits are non-pensionable and include such items as insurances and personal tax assistance.(3) Other long-term benefits is the accounting expense of annual and long-service leave accrued in FY21.(4) The related awards were not actually provided to the Executive KMP during FY21. The figures are calculated in accordance with Australian Accounting Standards and are the
amortised fair values of equity and equity-related instruments that have been granted to Executive KMP. See page 91 for information on awards outstanding during FY21.(5) Fixed Remuneration for Jason Economidis is only shown for the period he was appointed as a member of KMP (1 July 2020).
Remuneration report continued
90S
outh
32 A
nnua
l Rep
ort
2021
Gov
erna
nce

Details of rights held by Executive KMPIn the following table, we’ve set out more information about the rights over South32 shares held by Executive KMP, including the movements in rights held during FY21. See page 84 for terms and conditions about our Equity Incentive Plans.
Table 1.13 – Detail and movement of rights over South32 shares held by Executive KMP during FY21
Award(1)(2)Opening Balance
Grant Date
Granted in FY21(3) Vested in FY21
Forfeited or other change in FY21
Closing balance
Anticipated vesting date
Executive KMP Number Number Number(4) %(5) Number %(5) Number
Mr G Kerr 9,129,396 2,976,532 325,725 9 3,277,777 91 8,502,426 FY20 Deferred STI (S) - 04-Dec-20 280,988 - - - - 280,988 Aug-22FY21 LTI (P) - 04-Dec-20 2,695,544 - - - - 2,695,544 Aug-24FY19 Deferred STI (S) 352,097 06-Dec-19 - - - - - 352,097 Aug-21FY20 LTI (P) 1,696,261 06-Dec-19 - - - - - 1,696,261 Aug-23FY18 Deferred STI (S) 325,725 07-Dec-18 - 325,725 100 - - - Aug-20FY19 LTI (P) 1,450,819 07-Dec-18 - - - - - 1,450,819 Aug-22FY18 LTI (P) 2,026,717 13-Dec-17 - - - - - 2,026,717 Aug-21FY17 LTI (P) 3,277,777 02-Dec-16 - - - 3,277,777 100 - Aug-20Mrs K Tovich 1,434,750 977,812 75,725 20 300,740 80 2,036,097 FY20 Deferred STI (S) - 04-Dec-20 156,030 - - - - 156,030 Aug-22FY21 LTI (P) - 04-Dec-20 821,782 - - - - 821,782 Aug-24FY19 Deferred STI (S) 27,518 06-Dec-19 - - - - - 27,518 Aug-21FY20 LTI (P) 517,133 06-Dec-19 - - - - - 517,133 Aug-23FY20 Transitional LTI (P) 129,283 06-Dec-19 - - - - - 129,283 Aug-22FY19 MSP Retention (S) 55,725 07-Dec-18 - - - - - 55,725 Aug-21FY19 MSP Performance (P) 139,314 07-Dec-18 - - - - - 139,314 Aug-22FY18 MSP Retention (S) 75,725 13-Nov-17 - 75,725 100 - - - Aug-20FY18 MSP Performance (P) 189,312 13-Nov-17 - - - - - 189,312 Aug-21FY17 MSP Performance (P) 300,740 17-Nov-16 - - - 300,740 100 - Aug-20Mr M Fraser 4,233,533 1,392,437 176,645 11 1,496,913 89 3,952,412 FY20 Deferred STI (S) 04-Dec-20 154,814 - - - - 154,814 Aug-22FY21 LTI (P) 04-Dec-20 1,237,623 - - - - 1,237,623 Aug-24FY19 Deferred STI (S) 180,724 06-Dec-19 - - - - - 180,724 Aug-21FY20 LTI (P) 778,816 06-Dec-19 - - - - - 778,816 Aug-23FY18 Deferred STI (S) 176,645 07-Dec-18 - 176,645 100 - - - Aug-20FY19 LTI (P) 674,863 07-Dec-18 - - - - - 674,863 Aug-22FY18 LTI (P) 925,572 13-Dec-17 - - - - - 925,572 Aug-21FY17 LTI (P) 1,496,913 02-Dec-16 - - - 1,496,913 100 - Aug-20Mr J Economidis 493,671 594,058 29,262 100 - 0 1,058,467 FY21 MSP Retention (S) - 04-Dec-20 99,009 - - - - 99,009 Aug-23FY21 MSP Performance (P) 04-Dec-20 495,049 - - - - 495,049 Aug-24FY20 MSP Retention (S) 62,305 06-Dec-19 - - - - - 62,305 Aug-22FY20 MSP Performance (P) 155,763 06-Dec-19 - - - - - 155,763 Aug-23FY19 MSP Retention (S) 49,481 07-Dec-18 - - - - - 49,481 Aug-21FY19 MSP Performance (P) 123,704 07-Dec-18 - - - - - 123,704 Aug-22FY18 MSP Retention (S) 29,262 07-May-18 - 29,262 100 - - - Aug-20FY18 MSP Performance (P) 73,156 07-May-18 - - - - - 73,156 Aug-21
(1) At the time of vesting, the quantum of all awards that vest based on performance and/or service conditions will automatically convert to ordinary South32 shares for nil consideration in the participant’s name. Any Rights that do not vest will immediately lapse, hence there is no expiry date associated with the awards. (S) - Service only or (P) - Performance and Service conditions apply. As Rights are subject to service and/or performance conditions, the minimum possible total value of Rights granted under South32 Equity Plans for future financial years is nil and the maximum possible total value is the number of Rights multiplied by the market price of South32 shares on the date of vesting.
(2) Further details regarding each of the prior year equity grants are described in past South32 Annual Reports.(3) The fair value for awards granted in FY21 is the grant date fair value for accounting purposes being A$2.37 for the FY20 Deferred STI Award, A$1.18 for the FY21 LTI Award
granted to the CEO, A$1.30 for the FY21 LTI Award and FY21 MSP Performance Award granted to other KMP and A$2,28 for the FY21 MSP Retention Award. Shareholders approved, under ASX Listing Rule 10.14, the grant of rights for the CEO at the AGM on 29 October 2020.
(4) Rights converted to ordinary South32 shares for nil consideration on 21 August 2020. The South32 closing share price on this date was A$2.23. (5) Percentage based on the maximum number of Rights available to vest in FY21.
91S
outh32 Annual R
eport 2021
Governance

Details of awards for Katie Tovich and Jason EconomidisBefore becoming Executive KMP, Katie Tovich and Jason Economidis already held several awards granted under the MSP. Jason Economidis continues to participate in the MSP as Acting Chief Operating Officer (see page 83 for further details).
The details of these awards and the Transitional Performance Award (LTI) granted to South32 employees promoted into the Lead Team are outlined in Table 1.14. For additional terms of the rights granted under the two plans, see Terms and conditions of rights awarded under equity plans (page 84).
Table 1.14 – Key terms and performance conditions of awards(1)
Award Key Terms and Performance Conditions
Management Share Plan
The Management Share Plan is our LTI plan for eligible management employees below Lead Team level. The Plan has two elements:
– Retention rights with a three-year vesting and service period from 1 July to 30 June, vesting in August three years from grant provided employees remain employed by us; and
– Performance rights with a four-year performance and service period from 1 July to 30 June, vesting in August four years from grant, subject to the same performance and vesting conditions as our LTI for Executive KMP (see page 74). There is no retesting if the performance condition is not met and any rights that don’t vest will immediately lapse/be forfeited.
Rights won’t attract any entitlement to voting, dividends or dividend equivalent payments.
Katie Tovich participated in the Management Share Plan prior to being appointed to the Lead Team. As Acting Chief Operating Officer, Jason Economidis continues to participate in the Management Share Plan and this has been used to deliver his FY21 LTI award.
Transitional Performance Award
This one-off award is granted to cover the gap in vesting on appointment as a member of the Lead Team and is due to the transition from the Management Share Plan (three-year retention rights and four-year performance rights) to the LTI plan for Executive KMP (four-year performance rights).
This award is subject to the same TSR performance conditions as our LTI awards for Executive KMP (see Components of our Reward on page 74), namely two-thirds relative to a mining sector index (IHS Markit Global Mining Index) and one-third relative to a world index (MSCI Word Index), except this award has a three-year performance period, from 1 July 2019 to 30 June 2022 for Katie Tovich.
For the award to vest in full, it would need to outperform both indices by 17.4 per cent (5.5 per cent per annum cumulative).
There is no retesting if the performance condition is not met and any rights that don’t vest will immediately lapse/be forfeited.
Rights won’t attract any entitlement to voting, dividends or dividend equivalent payments.(1) See page 84 for key terms of the LTI.
Shareholdings of KMP The Minimum Shareholding Requirement for Executive KMP is summarised on page 84.
For Non-Executive Directors, the approach used to determine the Minimum Shareholding Requirement of one year’s base fee, is the cost to the Non-Executive Director to acquire the shares. Apart from Guy Lansdown (who was appointed in December 2019), all Non-Executive Directors meet this requirement. The percentage of fees reflected in the table below is based on our share price at 30 June 2021.
Table 1.15 – South32 shares held directly, indirectly or beneficially by each KMP, including their related parties
Held at 30 June 2020
Received on vesting of
rightsReceived as
remunerationOther net change(1)
Held at 30 June 2021
% of Board Fees/ fixed
remuneration(2)
Non-Executive Directors
Ms K Wood 367,825 - - - 367,825 186
Mr F Cooper AO 128,010 - - - 128,010 198
Mr G Lansdown - - - 45,000 45,000 70
Dr X Liu 60,000 - - - 60,000 93
Dr N Mtoba 69,386 - - - 69,386 107
Mr W Osborn 125,704 - - 48,400 174,104 270
Mr K Rumble 161,380 - - - 161,380 250
Executive KMP
Mr G Kerr 3,292,285 325,725 - - 3,618,010 584
Mrs K Tovich 356,541 75,725 - - 432,266 153
Mr M Fraser 3,228,249 176,645 - (79,491) 3,325,403 974
Mr J Economidis - 29,262 - - 29,262 17(3)
(1) Other net change includes purchases and sales of vested shares to cover tax liabilities. (2) Based on the closing share price of South32 shares as at 30 June 2021 of A$2.93.(3) Expressed as a percentage of base salary (A$500,000).
Remuneration report continued
92S
outh
32 A
nnua
l Rep
ort
2021
Gov
erna
nce

Additional informationTransactions with KMPThere are no amounts payable to any KMP at 30 June 2021.
On 22 June 2021 an interest free loan of A$823,906 was made to Mike Fraser in relation to South African income tax payable on his South32 remuneration. There is no maturity date for this loan. The most recent official rate of interest published by the South African Revenue Service for loan fringe benefits to South African employees is 4.50 per cent. As at 30 June 2021, the full loan remains outstanding.
Otherwise during FY21, there were no transactions between KMP or their close family members and the South32 Group.
There are no loans with any other KMP.
A number of Directors of the Group have control or joint control of other entities (also known as personal entities). There have been no transactions between those entities and no amounts were owed by or to the South32 Group during the year.
This Remuneration report was approved by our Board on 2 September 2021.
93S
outh32 Annual R
eport 2021
Governance

Consolidated income statement 95
Consolidated statement of comprehensive income 96
Consolidated balance sheet 97
Consolidated cash flow statement 98
Consolidated statement of changes in equity 99
Notes to financial statements – Basis of preparation 100
1. Reporting entity 100
2. Basis of preparation 100
3. New standards and interpretations 101
Notes to financial statements – Results for the year 102
4. Segment information 102
5. Expenses 110
6. Tax 110
7. Dividends 113
8. Earnings per share 113
Notes to financial statements – Operating assets and liabilities 114
9. Trade and other receivables 114
10. Inventories 114
11. Property, plant and equipment 115
12. Intangible assets 118
13. Impairment of non-financial assets 119
14. Trade and other payables 122
15. Provisions 123
Notes to financial statements – Capital structure and financing 125
16. Cash and cash equivalents 125
17. Interest bearing liabilities 125
18. Net finance costs 126
19. Financial assets and financial liabilities 126
20. Share capital 134
Notes to financial statements – Other notes 135
21. Auditor’s remuneration 135
22. Pension and other post-retirement obligations 135
23. Employee share ownership plans 136
24. Contingent liabilities 139
25. Subsidiaries 140
26. Equity accounted investments 140
27. Interests in joint operations 142
28. Key management personnel 142
29. Related party transactions 143
30. Parent entity information 144
31. Discontinued operation 144
32. Subsequent events 146
Directors' declaration 147
Lead auditor’s independence declaration 148
Independent auditor’s report 149
Financial report
94S
outh
32 A
nnua
l Rep
ort
2021
Fina
ncia
l Rep
ort

US$M Note FY21FY20
Restated(1)
Continuing operationsRevenue:
Group production 4 5,102 4,670Third party products and services 4 374 340
5,476 5,010Other income 157 123Expenses excluding net finance costs 5 (5,571) (4,788)Share of profit/(loss) of equity accounted investments 26 141 93Profit/(loss) from continuing operations 203 438Comprising:
Group production 193 440Third party products and services 10 (2)
Profit/(loss) from continuing operations 203 438Finance expenses (178) (129)Finance income 17 35Net finance costs 18 (161) (94)Profit/(loss) before tax from continuing operations 42 344Income tax (expense)/benefit 6 100 (186)Profit/(loss) after tax from continuing operations 142 158
Discontinued operationProfit/(loss) after tax from a discontinued operation 31 (337) (223)Profit/(loss) for the year (195) (65)
Attributable to:Equity holders of South32 Limited (195) (65)
Profit/(loss) from continuing operations for the year attributable to the equity holders of South32 Limited:Basic earnings per share (cents) 8 3.0 3.2Diluted earnings per share (cents) 8 3.0 3.2
Profit/(loss) for the year attributable to the equity holders of South32 Limited:Basic earnings per share (cents) 8 (4.1) (1.3)Diluted earnings per share (cents) 8 (4.1) (1.3)
(1) Refer to note 31 Discontinued operation.
The accompanying notes form part of the consolidated financial statements.
Consolidated income statement for the year ended 30 June 2021
95S
outh32 Annual R
eport 2021
Financial Rep
ort

Consolidated statement of comprehensive income for the year ended 30 June 2021
US$M Note FY21 FY20
Profit/(loss) for the year (195) (65)Other comprehensive incomeItems not to be reclassified to the Consolidated Income Statement:Investments in equity instruments designated as fair value through other comprehensive income (FVOCI):
Net fair value gains/(losses) 47 (65)Income tax (expense)/benefit (15) 20
Equity accounted investments – share of other comprehensive income/(loss), net of tax 26 (3) 21Gains/(losses) on pension and medical schemes 15 1 2Income tax (expense)/benefit recognised within other comprehensive income - -Total items not to be reclassified to the Consolidated Income Statement 30 (22)Total other comprehensive income/(loss) 30 (22)Total comprehensive income/(loss) (165) (87)
Attributable to:Equity holders of South32 Limited (165) (87)
The accompanying notes form part of the consolidated financial statements.
96S
outh
32 A
nnua
l Rep
ort
2021
Fina
ncia
l Rep
ort

Consolidated balance sheet as at 30 June 2021
US$M Note FY21 FY20
ASSETSCurrent assetsCash and cash equivalents 16 1,613 1,315Trade and other receivables 9 527 531Other financial assets 19 15 19Inventories 10 716 735Current tax assets 13 27Other 38 36Total current assets 2,922 2,663Non-current assetsTrade and other receivables 9 259 303Other financial assets 19 121 172Inventories 10 74 77Property, plant and equipment 11 8,938 9,680Intangible assets 12 189 248Equity accounted investments 26 380 460Deferred tax assets 6 348 123Other 11 11Total non-current assets 10,320 11,074Total assets 13,242 13,737LIABILITIESCurrent liabilitiesTrade and other payables 14 777 627Interest bearing liabilities 17 408 355Other financial liabilities 19 11 1Current tax payables 27 9Provisions 15 239 274Deferred income - 5Total current liabilities 1,462 1,271Non-current liabilitiesTrade and other payables 14 2 3Interest bearing liabilities 17 799 662Deferred tax liabilities 6 265 339Provisions 15 1,759 1,899Deferred income 1 1Total non-current liabilities 2,826 2,904Total liabilities 4,288 4,175Net assets 8,954 9,562EQUITYShare capital 20 13,597 13,943Treasury shares 20 (22) (49)Reserves (3,567) (3,566)Retained earnings/(accumulated losses) (1,053) (765)Total equity attributable to equity holders of South32 Limited 8,955 9,563Non-controlling interests (1) (1)Total equity 8,954 9,562
The accompanying notes form part of the consolidated financial statements.
97S
outh32 Annual R
eport 2021
Financial Rep
ort

Consolidated cash flow statement for the year ended 30 June 2021
US$M Note FY21FY20
Restated(1)
Operating activitiesProfit/(loss) before tax from continuing operations 42 344Profit/(loss) before tax from a discontinued operation (340) (222)Adjustments for:
Non-operating significant items (55) -Depreciation and amortisation expense 720 739Impairment losses 772 -Employee share awards expense 32 29Net finance costs 204 139Share of (profit)/loss of equity accounted investments (133) (100)Loss on disposal of a discontinued operation 159 -(Gains)/losses on derivative instruments and other investments measured at fair value through profit or loss (FVTPL) (44) 152Other non-cash or non-operating items (6) 7
Changes in assets and liabilities:Trade and other receivables (156) 367Inventories (142) 208Trade and other payables 264 (184)Provisions and other liabilities 95 (104)
Cash generated from operations 1,412 1,375Interest received 26 44Interest paid (70) (69)Income tax (paid)/received (163) (335)Dividends received 3 1Dividends received from equity accounted investments 197 349Net cash flows from operating activities 1,405 1,365Investing activitiesPurchases of property, plant and equipment (536) (676)Exploration expenditure (54) (61)Exploration expenditure expensed and included in operating cash flows 25 28Purchase of intangibles (1) (36)Investment in financial assets (152) (259)Acquisition of interest previously held by non-controlling interests - (3)Acquisition of subsidiaries and jointly controlled entities, net of their cash - (73)Disposal of a discontinued operation, net of their cash (70) -Cash outflows from investing activities (788) (1,080)Proceeds from sale of property, plant and equipment and intangibles 40 1Proceeds from financial assets 140 206Net cash flows from investing activities (608) (873)Financing activitiesProceeds from interest bearing liabilities 12 31Repayment of interest bearing liabilities (52) (55)Purchase of shares by ESOP Trusts - (23)Share buy-back (346) (269)Dividends paid (115) (246)Net cash flows from financing activities (501) (562)Net increase/(decrease) in cash and cash equivalents 296 (70)Cash and cash equivalents, net of overdrafts, at the beginning of the financial year 1,315 1,406Foreign currency exchange rate changes on cash and cash equivalents 2 (21)Cash and cash equivalents, net of overdrafts, at the end of the financial year 16 1,613 1,315
(1) Refer to note 31 Discontinued operation.
The accompanying notes form part of the consolidated financial statements.
98S
outh
32 A
nnua
l Rep
ort
2021
Fina
ncia
l Rep
ort

Consolidated statement of changes in equity for the year ended 30 June 2021
Attributable to equity holders of South32 Limited
US$MShare
capitalTreasury
shares
Financial assets
reserve(1)
Employee share
awards reserve(2)
Other reserves(3)
Retained earnings/
(accumulated losses) Total
Non-controlling
interestsTotal
equity
Balance as at 1 July 2020 13,943 (49) (54) 81 (3,593) (765) 9,563 (1) 9,562Profit/(loss) for the year - - - - - (195) (195) - (195)Other comprehensive income/(loss) - - 32 - - (2) 30 - 30Total comprehensive income/(loss) - - 32 - - (197) (165) - (165)Transactions with owners:
Dividends - - - - - (115) (115) - (115)Shares bought back and cancelled (346) - - - - - (346) - (346)Accrued employee entitlements for unvested awards, net of tax - - - 31 - - 31 - 31Employee share awards forfeited, net of tax - - - (5) - - (5) - (5)Sale of shares by ESOP Trusts - 3 - - - - 3 - 3Employee share awards vested and lapsed - 24 - (66) - 32 (10) - (10)Tax recognised for employee awards vested and lapsed - - - 7 - (8) (1) - (1)
Balance as at 30 June 2021 13,597 (22) (22) 48 (3,593) (1,053) 8,955 (1) 8,954
Balance as at 1 July 2019 14,212 (105) (9) 109 (3,590) (448) 10,169 (1) 10,168Profit/(loss) for the year - - - - - (65) (65) - (65)Other comprehensive income/(loss) - - (45) - - 23 (22) - (22)Total comprehensive income/(loss) - - (45) - - (42) (87) - (87)Transactions with owners:
Acquisition of interest previously held by non-controlling interests - - - - (3) - (3) - (3)Dividends - - - - - (246) (246) - (246)Shares bought back and cancelled (269) - - - - - (269) - (269)Accrued employee entitlements for unvested awards, net of tax - - - 21 - - 21 - 21Employee share awards forfeited, net of tax - - - (10) - - (10) - (10)Purchase of shares by ESOP Trusts - (23) - - - - (23) - (23)Employee share awards vested and waived - 79 - (39) - (42) (2) - (2)Tax recognised for employee awards vested and waived - - - - - 13 13 - 13
Balance as at 30 June 2020 13,943 (49) (54) 81 (3,593) (765) 9,563 (1) 9,562
(1) Represents the fair value movement in financial assets designated as FVOCI.(2) Represents the accrued employee entitlements to share awards that have not yet vested.(3) Primarily consists of the common control transaction reserve of US$3,569 million, which reflects the difference between consideration paid and the carrying value of assets
and liabilities acquired, as well as the gains/losses on disposal of entities as part of the Demerger of the Group in 2015.
The accompanying notes form part of the consolidated financial statements.
99S
outh32 Annual R
eport 2021
Financial Rep
ort

Notes to financial statements – Basis of preparation
This section sets out the accounting policies that relate to the consolidated financial statements of South32 Limited (referred to as the Company) and its subsidiaries and joint arrangements (collectively, the Group) as a whole. Where an accounting policy, critical accounting estimate, assumption or judgement is specific to a note, these are described within the note to which they relate. These policies have been consistently applied to all periods presented, except as described in note 3 New standards and interpretations.
The Group continues to respond to COVID-19, adjusting to the different phases of the pandemic across the jurisdictions where it operates, focussing on keeping its people well, maintaining safe and reliable operations and supporting its communities.
The Group generated US$1,405 million net cash flows from operating activities during the year, finishing the period with net cash of US$406 million (cash and cash equivalents of US$1,613 million less lease liabilities of US$687 million and other interest bearing liabilities of US$520 million). The Group also has an undrawn US$1,450 million revolving credit facility which supports its strong liquidity position.
The Group has considered the impact of COVID-19 on each of its significant accounting judgements and estimates. Key assumptions that underpin the assessment of indicators for impairment and impairment reversal of assets continue to be the Group’s main area of estimation uncertainty and are described in note 13 Impairment of non-financial assets. While no further significant estimates have been identified as a result of COVID-19, the pandemic has increased the level of uncertainty in all future cash flow forecasts applicable when considering the valuation of asset, liability and equity balances of the Group.
The consolidated financial statements of the Group for the year ended 30 June 2021 were authorised for issue in accordance with a resolution of the Directors on 2 September 2021.
1. Reporting entitySouth32 Limited is a for-profit company limited by shares incorporated in Australia with a primary listing on the Australian Securities Exchange (ASX), a standard listing on the London Stock Exchange (LSE) and a secondary listing on the Johannesburg Stock Exchange (JSE).
The nature of the operations and principal activities of the Group are described in note 4 Segment information.
2. Basis of preparationThe consolidated financial statements are a general purpose financial report which:
– Have been prepared in accordance with the requirements of the Corporations Act 2001, Australian Accounting Standards and other authoritative pronouncements of the Australian Accounting Standards Board (AASB), International Financial Reporting Standards (IFRS) and other authoritative pronouncements of the International Accounting Standards Board (IASB);
– Have been prepared on a historical cost basis, except for derivative financial instruments and certain other financial assets and liabilities which are required to be measured at fair value;
– Are presented in US dollars, which is the functional currency of the Group’s operations, and all values are rounded to the nearest million dollars (US$M or US$ million) unless otherwise stated, in accordance with ASIC Corporations Instrument 2016/191;
– Present reclassified comparative information where required for consistency with the current year’s presentation;
– Adopt all new and amended accounting standards and interpretations issued by the AASB that are relevant to the operations of the Group and effective for reporting periods beginning on or after 1 July 2020. Refer to note 3 New standards and interpretations for further details; and
– Do not early adopt any accounting standards and interpretations that have been issued or amended but are not yet effective as described in note 3 New standards and interpretations.
(a) Basis of consolidation The consolidated financial statements comprise the financial statements of the Group. A list of significant controlled entities (subsidiaries) at year end is contained in note 25 Subsidiaries.
The financial statements of subsidiaries are prepared for the same reporting period as the parent entity, using consistent accounting policies.
Changes in the Group’s interest in a subsidiary that do not result in a loss of control are accounted for as equity transactions.
(b) Foreign currency translationThe functional currency of the Group’s operations is the US dollar as this is assessed to be the principal currency of the economic environments in which they operate.
Transactions denominated in foreign currencies are initially recorded in the functional currency using the exchange rate ruling at the date of the underlying transaction. Monetary assets and liabilities denominated in foreign currencies are translated using the rate of exchange at year end. Exchange gains or losses on retranslation are included in the Consolidated Income Statement, with the exception of foreign exchange gains or losses on foreign currency provisions for closure and rehabilitation which are capitalised in property, plant and equipment for operating sites.
The exchange rates used have been obtained from Bloomberg.
100
Sou
th32
Ann
ual R
epor
t 20
21Fi
nanc
ial R
epor
t

3. New standards and interpretations(a) New accounting standards and interpretations effective from 1 July 2020The following new accounting standards and interpretations have been published that are effective for the 30 June 2021 reporting period:
– Amendments to AASB 3 - Definition of a Business;
– Amendments to AASB 101 and AASB 108 - Definition of Material; and
– Amendments to references to the Conceptual Framework in IFRS standards.
The Group has reviewed these amendments and concluded that none have a significant impact on the Group.
(b) New accounting standards and interpretations issued but not effectiveThe following new accounting standards and interpretations have been published that are not effective for the 30 June 2021 reporting period:
– Amendments to AASB 101 - Classification of Liabilities as Current or Non-current;
– Amendments to AASB 9, AASB 7, AASB 4 and AASB 16 - Interest Rate Benchmark Reform Phase 2;
– Amendments to AASB 137 - Onerous Contracts, Costs to Fulfil a Contract;
– Amendments to AASB 3 - Updating a reference to the Conceptual Framework;
– Amendments to AASB 116 - Property, Plant and Equipment, Proceeds before Intended Use;
– Amendments to AASB 10 and AASB 128 - Sale or Contribution of Assets between an Investor and its Associate or Joint Venture; and
– Annual Improvements 2018-2020.
The Group has reviewed these amendments and improvements and concluded that none will have a significant impact on the Group. The Group does not intend to early adopt any of the new standards or interpretations. It is expected that where applicable, these standards and interpretations will be adopted on each respective effective date.
101S
outh32 Annual R
eport 2021
Financial Rep
ort

Notes to financial statements – Results for the year
This section focuses on the results and performance of the Group. This covers both profitability and the resultant return to shareholders via earnings per share.
4. Segment information(a) Description of segmentsThe operating segments (also referred to as operations) are organised and managed separately according to the nature of products produced.
Certain members of the Lead Team (the chief operating decision makers) and the Board of Directors monitor the segment results regularly for the purpose of making decisions about resource allocation and performance assessment. The segment information for the manganese operations is presented on a proportional consolidation basis, which is the measure used by the Group’s management to assess their performance.
The principal activities of each operating segment are summarised as follows:
Operating segment Principal activities
Worsley Alumina Integrated bauxite mine and alumina refinery in AustraliaHillside Aluminium Aluminium smelter in South AfricaMozal Aluminium Aluminium smelter in MozambiqueBrazil Alumina Alumina refinery in BrazilIllawarra Metallurgical Coal (IMC) Underground metallurgical coal mines in AustraliaEagle Downs Metallurgical Coal Metallurgical coal exploration and development option in AustraliaAustralia Manganese Integrated producer of manganese ore and alloy(1) in AustraliaSouth Africa Manganese Integrated producer of manganese ore and alloy(2) in South AfricaCerro Matoso Integrated laterite ferronickel mining and smelting complex in ColombiaCannington Silver, lead and zinc mine in AustraliaHermosa Base metals exploration and development option in the United States South Africa Energy Coal (SAEC)(3) Open-cut and underground energy coal mines and processing operations in South Africa
(1) On 4 January 2021, Groote Eylandt Mining Company Pty Ltd (GEMCO) legally completed the sale of its shareholding in Tasmanian Electro Metallurgical Company Pty Ltd (TEMCO) to an entity within GFG Alliance (GFG). The effective completion of the sale for accounting purposes was 31 December 2020.
(2) The Metalloys manganese smelter has not recommenced production since the Group’s decision with its joint venture partner to place it on care and maintenance during the year ended 30 June 2020.
(3) On 1 June 2021, the Group completed the sale of its shareholding in SAEC to a wholly-owned subsidiary of Seriti Resources Holdings Pty Ltd (Seriti) and two trusts for the benefit of employees and communities. Refer to note 31 Discontinued operation.
All operations are operated by the Group except Brazil Alumina, which is operated by Alcoa.
(b) Segment results Segment performance is measured by Underlying EBIT and Underlying EBITDA. Underlying EBIT is profit before net finance costs, tax and other earnings adjustment items including impairments. Underlying EBITDA is Underlying EBIT before depreciation and amortisation. A reconciliation of Underlying EBIT, Underlying EBITDA and the Group’s consolidated profit after tax is set out on the following pages. Segment revenue is measured on the same basis as in the Consolidated Income Statement.
The Group separately discloses sales of group production from sales of third party products and services because of the significant difference in profit margin earned on these sales.
It is the Group’s policy that inter-segment transactions are made on a commercial basis.
Group and unallocated items/eliminations represent group centre functions and consolidation adjustments. Group financing (including finance expenses and finance income) and income taxes are managed on a Group basis and are not allocated to continuing operating segments.
Total assets and liabilities for each continuing operating segment represent operating assets and liabilities which predominantly exclude the carrying amount of equity accounted investments, cash, interest bearing liabilities, tax balances and certain other financial assets and liabilities. The carrying amount of investments accounted for using the equity method represents the balance of the Group’s investment in equity accounted investments, with no adjustment for cash, interest bearing liabilities, tax balances and certain other financial assets and liabilities.
102
Sou
th32
Ann
ual R
epor
t 20
21Fi
nanc
ial R
epor
t

4. Segment information continued(b) Segment results continued
Revenue recognition
Revenue is measured based on the consideration specified in the contract with a customer and excludes amounts collected on behalf of third parties. Revenue is not reduced for royalties and other taxes payable from group production.
The following is a description of the principal activities from which the Group generates its revenue:
Revenue from the sale of commoditiesThe Group primarily sells the following commodities: alumina, aluminium, energy coal, metallurgical coal, manganese ore, ferronickel, silver, lead and zinc. The sales of these commodities are considered to be performance obligations as they are the contractual promises by the Group to transfer distinct goods to customers.
The transaction price allocated to each performance obligation is recognised as the performance obligation is satisfied. Satisfaction occurs when control of the promised commodity is transferred to the customer.
For the sale of commodities, revenue is therefore recognised at a point in time, net of treatment and refining charges (where applicable). The majority of the Group’s sales agreements specify that title passes on the bill of lading date (the date the commodity is delivered to the shipping agent) and is assessed to be the point of time in which control over the commodity passes to the customer. For these sales, revenue is recognised on the bill of lading date. For certain sales, title passes and revenue is recognised when the goods have been delivered to the customer.
For certain commodities, the sales price is determined on a provisional basis at the date of sale and adjustments to the sales price subsequently occur based on movements in quoted market or contractual prices up to the date of final pricing. The period between provisional invoicing and final pricing is up to 180 days. Revenue on provisionally priced sales is recognised based on the estimated fair value of the total consideration receivable. The revenue adjustment mechanism embedded within provisionally priced sales arrangements has the characteristics of a commodity derivative. Accordingly, the fair value of the final sales price adjustment is re-estimated continuously and changes in fair value are disclosed separately as ‘Other’ revenue. In all cases, fair value is estimated by reference to forward market prices.
Revenue from the provision of freight servicesThe Group sells most of its commodities on either FOB or CIF Incoterms. In the case of CIF Incoterms, the Group is responsible for shipping services after the date at which control of the commodities passes to the customer at the port of loading. The provision of shipping services in these types of arrangements are a distinct service (and therefore a separate performance obligation) to which a portion of the transaction price should be allocated and recognised over time as the shipping services are provided. The Group also provides third party freight services which are recognised as the shipping service is provided.
The Group does not disclose sales revenue from freight services separately as it does not consider this necessary in order to understand the impact of economic factors on the Group.
103S
outh32 Annual R
eport 2021
Financial Rep
ort

Notes to financial statements – Results for the year continued
4. Segment information continued(b) Segment results continued
Continuing operationsDiscontinued
operation
30 June 2021
US$M Worsley Alumina
Hillside Aluminium
Mozal Aluminium Brazil Alumina
Illawarra Metallurgical
Coal
Eagle Downs Metallurgical
CoalAustralia
Manganese(1)South Africa
Manganese(1) Cerro Matoso Cannington Hermosa
Group and unallocated
items/ elimination
Statutory adjustment(1) Total
South Africa Energy Coal(2) Group
Revenue from customers 1,174 1,507 577 400 748 - 729 369 479 746 - (195) (1,097) 5,437 862 6,299Other(3) (1) 4 1 - 10 - 1 - 14 11 - - (1) 39 (1) 38Total revenue 1,173 1,511 578 400 758 - 730 369 493 757 - (195) (1,098) 5,476 861 6,337
Group production 605 1,511 578 400 758 - 730 364 493 757 - - (1,094) 5,102 735 5,837Third party products and services(4) - - - - - - - - - - - 378 (4) 374 126 500Inter-segment revenue 568 - - - - - - 5 - - - (573) - - - -Total revenue 1,173 1,511 578 400 758 - 730 369 493 757 - (195) (1,098) 5,476 861 6,337
Underlying EBITDA 318 358 132 114 94 - 385 72 197 416 (6) (93) (300) 1,687 (123) 1,564Depreciation and amortisation (175) (65) (34) (51) (197) - (81) (17) (75) (66) (2) (28) 98 (693) (27) (720)Underlying EBIT 143 293 98 63 (103) - 304 55 122 350 (8) (121) (202) 994 (150) 844Comprising:Group production excluding exploration expensed 143 293 98 63 (97) - 305 56 122 352 (8) (113) (361) 853 (153) 700Exploration expensed - - - - (5) - (1) (1) - (2) - (18) 2 (25) - (25)Third party products and services(4) - - - - - - - - - - - 10 - 10 11 21Share of profit/(loss) of equity accounted investments(5) - - - - (1) - - - - - - - 157 156 (8) 148Underlying EBIT 143 293 98 63 (103) - 304 55 122 350 (8) (121) (202) 994 (150) 844Net finance costs (109) (43) (152)Income tax (expense)/benefit (202) (1) (203)Underlying earnings 683 (194) 489Earnings adjustments(6) (541) (143) (684)Profit/(loss) after tax 142 (337) (195)
Exploration expenditure - - - - 14 - 2 1 - 2 16 22 (3) 54 - 54Capital expenditure(7) 55 17 11 25 188 8 55 16 45 43 64 4 (71) 460 76 536Equity accounted investments - - - - 2 - - - - - - - 378 380 - 380Total assets(8) 3,674 1,156 579 647 997 193 604 387 629 510 1,972 2,683 (789) 13,242 - 13,242Total liabilities(8) 1,007 423 123 76 385 8 370 205 224 315 47 1,852 (747) 4,288 - 4,288
(1) The segment information reflects the Group’s interest in the manganese operations and is presented on a proportional consolidation basis, which is the measure used by the Group’s management to assess their performance. The manganese operations are equity accounted in the consolidated financial statements. The statutory adjustment column reconciles the proportional consolidation to the equity accounting position.
(2) The SAEC operating segment has been classified as a discontinued operation. Refer to note 31 Discontinued operation.(3) Other revenue predominantly relates to fair value movements on provisionally priced contracts. (4) Revenue on third party products and services sold from continuing operations comprise of US$43 million for aluminium, US$10 million for alumina, US$23 million for coal,
US$206 million for freight services and US$92 million for aluminium raw materials. Underlying EBIT on third party products and services sold from continuing operations comprise of US$8 million for aluminium, US$nil for alumina, US$1 million for coal, US$nil for freight services and US$1 million for aluminium raw materials.
(5) Share of profit/(loss) of equity accounted investments includes the impact of earnings adjustments to Underlying EBIT, net of tax.(6) Refer to note 4(b)(i) Earnings adjustments.(7) Capital expenditure excludes the purchase of intangibles and capitalised exploration expenditure. (8) Total assets and liabilities for each operating segment represent operating assets and liabilities which predominantly exclude the carrying amount of equity accounted
investments, cash, interest bearing liabilities, tax balances and certain other financial assets and liabilities.
104
Sou
th32
Ann
ual R
epor
t 20
21Fi
nanc
ial R
epor
t

4. Segment information continued(b) Segment results continued
Continuing operationsDiscontinued
operation
30 June 2021
US$M Worsley Alumina
Hillside Aluminium
Mozal Aluminium Brazil Alumina
Illawarra Metallurgical
Coal
Eagle Downs Metallurgical
CoalAustralia
Manganese(1)South Africa
Manganese(1) Cerro Matoso Cannington Hermosa
Group and unallocated
items/ elimination
Statutory adjustment(1) Total
South Africa Energy Coal(2) Group
Revenue from customers 1,174 1,507 577 400 748 - 729 369 479 746 - (195) (1,097) 5,437 862 6,299Other(3) (1) 4 1 - 10 - 1 - 14 11 - - (1) 39 (1) 38Total revenue 1,173 1,511 578 400 758 - 730 369 493 757 - (195) (1,098) 5,476 861 6,337
Group production 605 1,511 578 400 758 - 730 364 493 757 - - (1,094) 5,102 735 5,837Third party products and services(4) - - - - - - - - - - - 378 (4) 374 126 500Inter-segment revenue 568 - - - - - - 5 - - - (573) - - - -Total revenue 1,173 1,511 578 400 758 - 730 369 493 757 - (195) (1,098) 5,476 861 6,337
Underlying EBITDA 318 358 132 114 94 - 385 72 197 416 (6) (93) (300) 1,687 (123) 1,564Depreciation and amortisation (175) (65) (34) (51) (197) - (81) (17) (75) (66) (2) (28) 98 (693) (27) (720)Underlying EBIT 143 293 98 63 (103) - 304 55 122 350 (8) (121) (202) 994 (150) 844Comprising:Group production excluding exploration expensed 143 293 98 63 (97) - 305 56 122 352 (8) (113) (361) 853 (153) 700Exploration expensed - - - - (5) - (1) (1) - (2) - (18) 2 (25) - (25)Third party products and services(4) - - - - - - - - - - - 10 - 10 11 21Share of profit/(loss) of equity accounted investments(5) - - - - (1) - - - - - - - 157 156 (8) 148Underlying EBIT 143 293 98 63 (103) - 304 55 122 350 (8) (121) (202) 994 (150) 844Net finance costs (109) (43) (152)Income tax (expense)/benefit (202) (1) (203)Underlying earnings 683 (194) 489Earnings adjustments(6) (541) (143) (684)Profit/(loss) after tax 142 (337) (195)
Exploration expenditure - - - - 14 - 2 1 - 2 16 22 (3) 54 - 54Capital expenditure(7) 55 17 11 25 188 8 55 16 45 43 64 4 (71) 460 76 536Equity accounted investments - - - - 2 - - - - - - - 378 380 - 380Total assets(8) 3,674 1,156 579 647 997 193 604 387 629 510 1,972 2,683 (789) 13,242 - 13,242Total liabilities(8) 1,007 423 123 76 385 8 370 205 224 315 47 1,852 (747) 4,288 - 4,288
105S
outh32 Annual R
eport 2021
Financial Rep
ort

Notes to financial statements – Results for the year continued
4. Segment information continued(b) Segment results continued
Continuing operationsDiscontinued
operation
30 June 2020
US$M Worsley Alumina
Hillside Aluminium
Mozal Aluminium Brazil Alumina
Illawarra Metallurgical
Coal
Eagle Downs Metallurgical
CoalAustralia
Manganese(1)South Africa
Manganese(1) Cerro Matoso Cannington Hermosa
Group and unallocated
items/ elimination
Statutory adjustment(1) Total
South Africa Energy Coal(2) Group
Revenue from customers 1,119 1,276 507 399 937 - 785 346 516 497 - (207) (1,131) 5,044 1,072 6,116Other(3) (1) - 1 - (13) - (22) (4) 3 (21) - (3) 26 (34) (7) (41)Total revenue 1,118 1,276 508 399 924 - 763 342 519 476 - (210) (1,105) 5,010 1,065 6,075
Group production 568 1,276 508 399 924 - 763 342 519 476 - - (1,105) 4,670 822 5,492Third party products and services(4) - - - - - - - - - - - 340 - 340 243 583Inter-segment revenue 550 - - - - - - - - - - (550) - - - -Total revenue 1,118 1,276 508 399 924 - 763 342 519 476 - (210) (1,105) 5,010 1,065 6,075
Underlying EBITDA 322 169 10 50 243 - 400 81 189 155 (5) (28) (283) 1,303 (118) 1,185Depreciation and amortisation (162) (66) (34) (65) (191) - (72) (27) (82) (50) - (42) 99 (692) (47) (739)Underlying EBIT 160 103 (24) (15) 52 - 328 54 107 105 (5) (70) (184) 611 (165) 446Comprising:Group production excluding exploration expensed 160 103 (24) (15) 59 - 329 55 109 109 (5) (53) (387) 440 (157) 283Exploration expensed - - - - (7) - (1) (1) (2) (4) - (15) 2 (28) - (28)Third party products and services(4) - - - - - - - - - - - (2) - (2) (15) (17)Share of profit/(loss) of equity accounted investments(5) - - - - - - - - - - - - 201 201 7 208Underlying EBIT 160 103 (24) (15) 52 - 328 54 107 105 (5) (70) (184) 611 (165) 446Net finance costs (100) (45) (145)Income tax (expense)/benefit (110) 2 (108)Underlying earnings 401 (208) 193Earnings adjustments(6) (243) (15) (258)Profit/(loss) after tax 158 (223) (65)
Exploration expenditure - - - - 16 2 2 1 4 4 19 16 (3) 61 - 61Capital expenditure(7) 48 13 11 34 199 11 67 23 39 52 104 1 (90) 512 164 676Equity accounted investments - - - - 3 - - - - - - - 436 439 21 460Total assets(8) 3,379 1,058 531 663 1,617 184 608 438 623 457 1,894 2,225 (800) 12,877 860 13,737Total liabilities(8) 590 264 95 95 261 10 366 201 198 243 36 1,541 (763) 3,137 1,038 4,175
(1) The segment information reflects the Group’s interest in the manganese operations and is presented on a proportional consolidation basis, which is the measure used by the Group’s management to assess their performance. The manganese operations are equity accounted in the consolidated financial statements. The statutory adjustment column reconciles the proportional consolidation to the equity accounting position.
(2) The SAEC operating segment has been reclassified as a discontinued operation. Refer to note 31 Discontinued operation.(3) Other revenue predominantly relates to fair value movements on provisionally priced contracts. (4) Revenue on third party products and services sold from continuing operations comprise of US$42 million for aluminium, US$14 million for alumina, US$33 million for coal,
US$165 million for freight services and US$86 million for aluminium raw materials. Underlying EBIT on third party products and services sold from continuing operations comprise of US$2 million for aluminium, (US$4) million for alumina, US$nil for coal, (US$2) million for freight services and US$2 million for aluminium raw materials.
(5) Share of profit/(loss) of equity accounted investments includes the impact of earnings adjustments to Underlying EBIT, net of tax.(6) Refer to note 4(b)(i) Earnings adjustments.(7) Capital expenditure excludes the purchase of intangibles and capitalised exploration expenditure. (8) Total assets and liabilities for each continuing operating segment represent operating assets and liabilities which predominantly exclude the carrying amount of equity
accounted investments, cash, interest bearing liabilities, tax balances and certain other financial assets and liabilities.
106
Sou
th32
Ann
ual R
epor
t 20
21Fi
nanc
ial R
epor
t

4. Segment information continued(b) Segment results continued
Continuing operationsDiscontinued
operation
30 June 2020
US$M Worsley Alumina
Hillside Aluminium
Mozal Aluminium Brazil Alumina
Illawarra Metallurgical
Coal
Eagle Downs Metallurgical
CoalAustralia
Manganese(1)South Africa
Manganese(1) Cerro Matoso Cannington Hermosa
Group and unallocated
items/ elimination
Statutory adjustment(1) Total
South Africa Energy Coal(2) Group
Revenue from customers 1,119 1,276 507 399 937 - 785 346 516 497 - (207) (1,131) 5,044 1,072 6,116Other(3) (1) - 1 - (13) - (22) (4) 3 (21) - (3) 26 (34) (7) (41)Total revenue 1,118 1,276 508 399 924 - 763 342 519 476 - (210) (1,105) 5,010 1,065 6,075
Group production 568 1,276 508 399 924 - 763 342 519 476 - - (1,105) 4,670 822 5,492Third party products and services(4) - - - - - - - - - - - 340 - 340 243 583Inter-segment revenue 550 - - - - - - - - - - (550) - - - -Total revenue 1,118 1,276 508 399 924 - 763 342 519 476 - (210) (1,105) 5,010 1,065 6,075
Underlying EBITDA 322 169 10 50 243 - 400 81 189 155 (5) (28) (283) 1,303 (118) 1,185Depreciation and amortisation (162) (66) (34) (65) (191) - (72) (27) (82) (50) - (42) 99 (692) (47) (739)Underlying EBIT 160 103 (24) (15) 52 - 328 54 107 105 (5) (70) (184) 611 (165) 446Comprising:Group production excluding exploration expensed 160 103 (24) (15) 59 - 329 55 109 109 (5) (53) (387) 440 (157) 283Exploration expensed - - - - (7) - (1) (1) (2) (4) - (15) 2 (28) - (28)Third party products and services(4) - - - - - - - - - - - (2) - (2) (15) (17)Share of profit/(loss) of equity accounted investments(5) - - - - - - - - - - - - 201 201 7 208Underlying EBIT 160 103 (24) (15) 52 - 328 54 107 105 (5) (70) (184) 611 (165) 446Net finance costs (100) (45) (145)Income tax (expense)/benefit (110) 2 (108)Underlying earnings 401 (208) 193Earnings adjustments(6) (243) (15) (258)Profit/(loss) after tax 158 (223) (65)
Exploration expenditure - - - - 16 2 2 1 4 4 19 16 (3) 61 - 61Capital expenditure(7) 48 13 11 34 199 11 67 23 39 52 104 1 (90) 512 164 676Equity accounted investments - - - - 3 - - - - - - - 436 439 21 460Total assets(8) 3,379 1,058 531 663 1,617 184 608 438 623 457 1,894 2,225 (800) 12,877 860 13,737Total liabilities(8) 590 264 95 95 261 10 366 201 198 243 36 1,541 (763) 3,137 1,038 4,175
107S
outh32 Annual R
eport 2021
Financial Rep
ort

Notes to financial statements – Results for the year continued
4. Segment information continued(b) Segment results continued(i) Earnings adjustments The following table shows earnings adjustments in determining Underlying earnings:
Year ended 30 June 2021
US$MContinuing operations
Discontinued operation(1) Total
Adjustments to Underlying EBITSignificant items(2) (55) - (55)Exchange rate (gains)/losses on restatement of monetary items(3) 35 34 69Impairment losses(3)(4) 764 - 764(Gains)/losses on non-trading derivative instruments and other investments measured at FVTPL(3)(5) 9 (46) (37)Major corporate restructures(3)(6) 23 - 23Net (gains)/losses on the disposal of interests in operations(1) - 159 159Earnings adjustments included in profit/(loss) of equity accounted investments(7)(8) 15 - 15Total adjustments to Underlying EBIT 791 147 938Adjustments to net finance costsExchange rate variations on net debt 52 - 52Total adjustments to net finance costs 52 - 52Adjustments to income tax expenseTax effect of earnings adjustments to Underlying EBIT (247) - (247)Tax effect of earnings adjustments to net finance costs 7 - 7Exchange rate variations on tax balances (62) (4) (66)Total adjustments to income tax expense (302) (4) (306)Total earnings adjustments 541 143 684
(1) Refer to note 31 Discontinued operation.(2) Refer to note 4(b)(ii) Significant items. (3) Recognised in expenses excluding net finance costs in the Consolidated Income Statement. Refer to note 5 Expenses.(4) Relates to a US$728 million impairment of property, plant and equipment in the IMC segment and a US$36 million impairment of intangible assets included in Group and
unallocated items. Impairment losses exclude a US$8 million impairment of right-of-use lease assets included in major corporate restructures. Refer to note 13 Impairment of non-financial assets.
(5) Primarily relates to US$8 million included in the Hillside Aluminium segment.(6) The major corporate restructure costs relate to the simplification of the Group’s functional structures and office footprint and are included in Group and unallocated items.(7) Recognised in share of profit/(loss) of equity accounted investments in the Consolidated Income Statement. Refer to note 26 Equity accounted investments.(8) Relates to US$5 million included in the Australia Manganese segment and US$10 million included in the South Africa Manganese segment. Of the US$5 million recorded in the
Australia Manganese segment, US$4 million relates to GEMCO’s loss on disposal of its shareholding in TEMCO.
Year ended 30 June 2020
US$MContinuing operations
Discontinued operation(1) Total
Adjustments to Underlying EBITExchange rate (gains)/losses on restatement of monetary items(2) (48) (24) (72)(Gains)/losses on non-trading derivative instruments and other investments measured at FVTPL(2)(3) 113 36 149Earnings adjustments included in profit/(loss) of equity accounted investments(4)(5) 108 - 108Total adjustments to Underlying EBIT 173 12 185Adjustments to net finance costsExchange rate variations on net debt (6) - (6)Total adjustments to net finance costs (6) - (6)Adjustments to income tax expenseTax effect of earnings adjustments to Underlying EBIT (18) - (18)Tax effect of earnings adjustments to net finance costs (2) - (2)Exchange rate variations on tax balances 96 3 99Total adjustments to income tax expense 76 3 79Total earnings adjustments 243 15 258
(1) Refer to note 31 Discontinued operation.(2) Recognised in expenses excluding net finance costs in the Consolidated Income Statement. Refer to note 5 Expenses.(3) Primarily relates to US$105 million included in the Hillside Aluminium segment.(4) Recognised in share of profit/(loss) of equity accounted investments in the Consolidated Income Statement. Refer to note 26 Equity accounted investments.(5) Relates to US$51 million included in the Australia Manganese segment and US$57 million included in the South Africa Manganese segment. Of the US$108 million, impairment
losses of US$40 million were recorded in the Australia Manganese segment after GEMCO entered into a binding conditional agreement for the sale of its shareholding in TEMCO, and US$49 million in the South Africa Manganese segment following the decision to place the Metalloys manganese smelter on care and maintenance.
108
Sou
th32
Ann
ual R
epor
t 20
21Fi
nanc
ial R
epor
t

4. Segment information continued(b) Segment results continued(ii) Significant itemsSignificant items are those items, not separately identified in note (4)(b)(i) Earnings adjustments, where their nature and amount are considered material to the consolidated financial statements. There were no such items included within the Group’s profit/(loss) for the year ended 30 June 2020.
Year ended 30 June 2021
US$M Gross Tax Net
Disposal of royalties(1) (55) - (55)Total significant items (55) - (55)
(1) Recognised in other income in the Consolidated Income Statement and included in Group and unallocated items.
Disposal of royalties
The Group divested four royalties to a wholly-owned subsidiary of the Elemental Royalties Corporation for US$55 million, which comprised US$40 million in upfront cash and US$15 million in equity. These royalties were recognised as intangible assets with a US$nil carrying value. The transaction completed on 9 February 2021 and the Group recognised other income of US$55 million (US$55 million post tax) in the Consolidated Income Statement.
(c) Geographical informationThe geographical information below analyses Group revenue and non-current assets by location. Revenue is presented by the geographical location of customers and non-current assets are presented by the geographical location of the operations.
Revenue from external customers(1) Non-current assets
US$M FY21 FY20 FY21 FY20
Australia 522 463 5,232 5,610China 421 537 - -India 207 269 - -Japan 348 363 - -Middle East 213 261 - -Netherlands 480 573 - -North America 387 305 2,049 1,967Singapore 902 953 106 106South America 32 4 1,092 1,107South Korea 326 148 - -Southern Africa 1,075 862 1,371 1,985Switzerland 480 483 - -United Kingdom 236 134 1 4Other Asia 216 290 - -Rest of Europe 492 430 - -Unallocated assets(2) - - 469 295Total 6,337 6,075 10,320 11,074
(1) Revenue from external customers comprises revenue from continuing operations of US$5,476 million (FY20: US$5,010 million) and revenue from a discontinued operation of US$861 million (FY20: US$1,065 million). Refer to note 31 Discontinued operation.
(2) Primarily comprises of other financial assets and deferred tax assets.
109S
outh32 Annual R
eport 2021
Financial Rep
ort

Notes to financial statements – Results for the year continued
5. Expenses
US$M Note FY21
FY20
Restated(1)
Changes in inventories of finished goods and work in progress (72) 191Raw materials and consumables used(2) 1,771 1,599Wages, salaries and redundancies 683 615Pension and other post-retirement obligations 61 57External services (including transportation) 905 869Third party commodity purchases 351 330Depreciation and amortisation 693 692Exchange rate (gains)/losses on restatement of monetary items 35 (48)(Gains)/losses on derivative instruments and other investments measured at FVTPL(3) 7 106Government and other royalties paid and payable 160 162Exploration and evaluation expenditure incurred and expensed 25 28Impairment losses 13 772 -Lease rentals(4) 51 33All other operating expenses 129 154Total expenses 5,571 4,788
(1) Refer to note 31 Discontinued operation.(2) Raw materials and consumables used exclude realised losses on the settlement of derivative instruments related to electricity purchases of US$8 million
(FY20: US$120 million).(3) Includes (gains)/losses on non-trading derivative instruments and other investments measured at FVTPL of US$9 million (FY20: US$113 million). Refer to note 4(b)(i) Earnings
adjustments.(4) Includes short-term, low-value and variable lease rentals.
6. TaxIncome tax expense comprises current and deferred tax and is recognised in the Consolidated Income Statement except to the extent that it relates to items recognised directly in the Consolidated Statement of Comprehensive Income.
(a) Income tax expense
US$M FY21
FY20
Restated(1)
Current income tax expense/(benefit) 196 130Deferred income tax expense/(benefit) (299) 57Total income tax expense/(benefit) (103) 187
Income tax expense attributable to:Continuing operations (100) 186Discontinued operation(1) (3) 1Total income tax expense/(benefit) (103) 187
(1) Refer to note 31 Discontinued operation.
Income tax expense/(benefit)Income tax expense/(benefit) for the period is the tax payable on the current period’s taxable income/(loss) based on the applicable income tax rate for each jurisdiction adjusted for changes in deferred tax assets and liabilities attributable to temporary differences and unused tax losses. Current tax is calculated using the tax rates enacted or substantively enacted at period end and includes any adjustment to tax payable in respect of previous years.
110
Sou
th32
Ann
ual R
epor
t 20
21Fi
nanc
ial R
epor
t

6. Tax continued(b) Reconciliation of prima facie tax expense to income tax expense
US$M FY21FY20
Restated(1)
(Profit)/loss before tax from continuing operations (42) (344)(Profit)/loss before tax from a discontinued operation(1) 340 222Deduct: (Profit)/loss from equity accounted investments included in continuing operations (141) (93)Deduct: (Profit)/loss from equity accounted investments included in a discontinued operation(1) 8 (7)(Profit)/loss subject to tax 431 (22)Income tax on (profit)/loss calculated at 30 per cent (129) 7Tax rate differential on non-Australian income (5) 18Exchange variations and other translation adjustments (66) 99Withholding tax on distributed earnings 3 -Derecognition of future tax benefits 108 58Foreign exploration - 3Adjustments to prior years (10) -Other (4) 2
Total income tax expense/(benefit) (103) 187
(1) Refer to note 31 Discontinued operation.
Profit from equity accounted investments has been taxed in companies other than South32 Limited, being the companies whose results are disclosed as equity accounted investments in the consolidated financial statements.
Refer to note 26 Equity accounted investments for further details of the Group’s equity accounted investments.
(c) Movement in deferred tax balancesThe composition of the Group’s net deferred tax asset and liability recognised in the Consolidated Balance Sheet and the deferred tax expense charged/(credited) to the Consolidated Income Statement is as follows:
Deferred tax assets Deferred tax liabilities
Deferred tax charged/(credited) to the Consolidated Income
Statement(1)
US$M FY21 FY20 FY21 FY20 FY21 FY20
Type of temporary differenceDepreciation 420 243 (302) (375) (217) 42Employee benefits 53 49 12 10 (15) (17)Closure and rehabilitation 166 150 49 30 (18) 5Other provisions 3 4 14 17 (4) 5Deferred charges (150) (160) - - (10) (1)Non tax-depreciable fair value adjustments, revaluations and mineral rights (123) (122) (29) (18) (1) (1)Tax-effected losses 2 6 11 28 4 23Brazil deferral incentive(2) - - (56) (43) 14 (16)Leases 10 (14) 2 2 (24) (3)Other (33) (33) 34 10 (28) 20Total 348 123 (265) (339) (299) 57
(1) Includes deferred tax expense charged/(credited) to the Consolidated Income Statement relating to a discontinued operation of (US$6) million (FY20: (US$2) million). Refer to note 31 Discontinued operation.
(2) The Group’s Brazilian subsidiary has received a 75 per cent corporate income tax deferral due to the reinvestment of capital. The tax is deferred until earnings are repatriated from Brazil.
Deferred tax is provided using the balance sheet liability method, providing for the tax effect of temporary differences between the carrying amount of assets and liabilities for financial reporting purposes and the amounts used for tax assessment or deduction purposes. The tax effect of certain temporary differences is not recognised, principally with respect to:
– Temporary differences arising on the initial recognition of assets or liabilities (other than those arising in a business combination or in a manner that initially impacted accounting or taxable profit);
– Temporary differences relating to investments and undistributed earnings in subsidiaries, joint ventures and associates to the extent that the Group is able to control its reversal and it is probable that it will not reverse in the foreseeable future; and
– Goodwill.
To the extent that an item’s tax base is solely derived from the amount deductible under capital gains tax legislation, deferred tax is determined as if such amounts are not deductible in determining future assessable income.
A deferred tax asset is recognised only to the extent that it is probable that future taxable profits will be available against which the asset can be utilised. Deferred tax assets are reviewed at each balance sheet date and amended to the extent that it is no longer probable that the related tax benefit will be realised. Deferred tax assets and liabilities are offset when they relate to income taxes levied by the same tax authority and the Group has both the right and the intention to settle its current tax assets and liabilities on a net or simultaneous basis.
111S
outh32 Annual R
eport 2021
Financial Rep
ort

6. Tax continued(d) Unrecognised deferred tax assets and liabilitiesThe composition of the Group’s unrecognised deferred tax assets and liabilities is as follows:
US$M FY21 FY20
Unrecognised deferred tax assetsTax-effected losses(1) 8 66Mineral rights 588 620Impairment of investments in subsidiaries 978 816Closure and rehabilitation 57 225Depreciable assets 8 148Other deductible temporary differences - 25Total unrecognised deferred tax assets 1,639 1,900Unrecognised deferred tax liabilitiesTaxable temporary differences associated with investments and undistributed earnings in subsidiaries (39) (45)Total unrecognised deferred tax liabilities (39) (45)
(1) Represents tax losses that have no expiry.
(e) Tax consolidationSouth32 Limited and its 100 per cent owned Australian resident subsidiaries have formed a tax consolidated group with effect from 25 May 2015. South32 Limited is the head entity of the tax consolidated group. Members of the group have entered into a tax sharing agreement in order to allocate income tax expense to the wholly-owned subsidiaries on a stand-alone basis. The tax sharing arrangement provides for the allocation of income tax liabilities between the entities should the head entity default on its tax payment obligations. The possibility of such a default is considered remote at the date of this report.
Members of the tax consolidated group have also entered into a tax funding agreement. The group has applied its allocation approach in determining the appropriate amount of current taxes to allocate to members of the tax consolidated group. The tax funding agreement provides for each member of the tax consolidated group to pay or receive a tax equivalent amount to or from the head entity in accordance with their notional current tax liability or current tax asset. Such amounts are reflected in amounts receivable from or payable to the head entity in their accounts and are settled as soon as practicable after lodgement of the consolidated return and payment of the tax liability.
(f) Tax Transparency ReportMore detail of the South32 Group’s tax outcomes, including country-by-country reporting is included in the South32 Tax Transparency and Payments to Government Report 2021.
Key estimates, assumptions and judgements
Deferred taxJudgement is required in assessing whether deferred tax assets and certain deferred tax liabilities are recognised in the Consolidated Balance Sheet. Deferred tax assets are recognised only where it is considered more likely than not that they will be recovered, which is dependent on the generation of sufficient future taxable profits. Deferred tax liabilities arising from temporary differences in investments, caused principally by retained earnings held in foreign tax jurisdictions, are recognised unless repatriation of retained earnings can be controlled and are not expected to occur in the foreseeable future.
Assumptions about the generation of future taxable profits and repatriation of retained earnings depend on management’s estimates of future cash flows. These depend on estimates of future production and sales volumes, commodity prices, reserves, operating costs, closure and rehabilitation costs, capital expenditure, dividends and other capital management transactions.
Uncertain tax mattersJudgements are required about the application of the inherently complex income tax legislation in Colombia, Brazil and South Africa. These judgements are subject to risk and uncertainty, hence there is a possibility that changes in circumstances will alter expectations, which may impact the amount of deferred tax assets and deferred tax liabilities recognised on the Consolidated Balance Sheet and the amount of other tax losses and temporary differences not yet recognised.
Where the final tax outcomes are different from the amounts that were initially recorded, these differences impact the current and deferred tax provisions in the period in which the determination is made. Measurement of uncertain tax and royalty matters considers a range of possible outcomes, including assessments received from tax authorities. Where management is of the view that potential liabilities have a low probability of crystallising, or it is not possible to quantify them reliably, they are disclosed as contingent liabilities.
Notes to financial statements – Results for the year continued
112
Sou
th32
Ann
ual R
epor
t 20
21Fi
nanc
ial R
epor
t

7. DividendsUS$M FY21 FY20
Prior year final dividend(1) 48.5 139.0Interim dividend(2) 66.5 53.5Special dividend - 53.5Total dividends declared and paid during the year 115 246
(1) On 20 August 2020, the Directors resolved to pay a fully franked final dividend of US 1 cent per share in respect of the 2020 financial year. The dividend was paid on 8 October 2020.
(2) On 18 February 2021, the Directors resolved to pay a fully franked interim dividend of US 1.4 cents per share (US$67 million) in respect of the 2021 financial half year. The dividend was paid on 8 April 2021. In addition to the ESOP Trusts receiving dividends from South32 Limited, a total of 24,893,905 shares were bought back between the declaration and the ex-dividend dates, therefore reducing the interim dividend paid externally to US$66.5 million.
Franking Account
US$M FY21 FY20
Franking credits at the beginning of the financial year 268 261Credits arising from tax paid/payable by South32 Limited(1) 47 24Credits arising from the receipt of franked dividends 63 92Utilisation of credits arising from the payment of franked dividends (49) (109)Total franking credits available at the end of the financial year(2) 329 268
(1) Includes the payment of the Australian FY21 income tax liability of US$10 million due in December 2021.(2) The payment of the final franked FY21 dividend declared after 30 June 2021 will decrease the franking account balance by US$110 million. Refer to note 32 Subsequent events.
8. Earnings per share Basic earnings per share (EPS) amounts are calculated based on profit or loss attributable to equity holders of South32 Limited and the weighted average number of shares outstanding during the year.
Dilutive EPS amounts are calculated based on profit or loss attributable to equity holders of South32 Limited and the weighted average number of shares outstanding after adjustment for the effects of all dilutive potential shares.
The following reflects the profit/(loss) and share data used in the basic and diluted EPS computations:
Profit/(loss) attributable to equity holders
US$M FY21FY20
Restated(1)
Continuing operations 142 158Discontinued operation(1) (337) (223)Profit/(loss) attributable to equity holders of South32 Limited (basic) (195) (65)Profit/(loss) attributable to equity holders of South32 Limited (diluted) (195) (65)
(1) Refer to note 31 Discontinued operation.
Weighted average number of shares
Million FY21FY20
Restated(1)
Basic EPS denominator(2) 4,771 4,892Shares contingently issuable under employee share ownership plans 14 12Diluted EPS denominator 4,785 4,904
(1) Refer to note 31 Discontinued operation.(2) The basic EPS denominator is the aggregate of the weighted average number of shares after deduction of the weighted average number of treasury shares outstanding and
shares permanently cancelled through the on-market share buy-back program.
Earnings per Share
US cents FY21FY20
Restated(1)
Continuing operations Basic EPS 3.0 3.2Diluted EPS 3.0 3.2Attributable to ordinary equity holders of South32 Limited Basic EPS (4.1) (1.3)Diluted EPS (4.1) (1.3)
(1) Refer to note 31 Discontinued operation.
113S
outh32 Annual R
eport 2021
Financial Rep
ort

Notes to financial statements – Operating assets and liabilities
This section shows the assets used to generate the Group’s trading performance and the liabilities incurred. Liabilities relating to the Group’s financing activities are addressed in the capital structure and financing section, notes 16 to 20.
9. Trade and other receivables US$M FY21 FY20
CurrentTrade receivables 433 379Loans to equity accounted investments(1) 10 15Other receivables 84 137Total current trade and other receivables(2) 527 531Non-currentLoans to equity accounted investments(1) 187 177Interest bearing loans receivable from joint operations - 26Other receivables 72 100Total non-current trade and other receivables(2) 259 303
(1) Refer to note 29 Related party transactions.(2) Net of allowances for expected credit losses of US$2 million (FY20: US$6 million).
Trade receivables generally have terms of up to 30 days. Trade and other receivables which are not held at FVTPL are recognised initially at fair value and subsequently at amortised cost using the effective interest method, less an allowance for expected credit losses.
10. Inventories US$M FY21 FY20
CurrentRaw materials and consumables 323 348Work in progress 236 227Finished goods 157 160Total current inventories 716 735Non-currentRaw materials and consumables 52 54Work in progress 22 23Total non-current inventories 74 77
Inventories carried at net realisable value as at 30 June 2021 was US$17 million (FY20: US$69 million). Inventory write-downs of US$42 million (FY20: US$33 million) were recognised in the year.
Inventories are valued at the lower of cost and net realisable value. Cost is determined primarily on the basis of average costs. For processed inventories, cost is derived on an absorption costing basis. Cost comprises the cost of purchasing raw materials and the cost of production, including attributable overheads. In respect of minerals inventory, quantities are assessed primarily through surveys and assays.
114
Sou
th32
Ann
ual R
epor
t 20
21Fi
nanc
ial R
epor
t

11. Property, plant and equipment
Land and buildings Plant and equipment
30 June 2021
US$MRight-of-use
(ROU) Other ROU Other
Other mineral assets
Assets under construction
Exploration and
evaluation Total
Cost At the beginning of the financial year 51 2,736 905 15,196 4,687 764 81 24,420Additions 3 - 24 506 - 500 62 1,095Foreign exchange movements in closure and rehabilitation provisions(1) - - - 238 - - - 238Disposals (4) (5) (20) (104) (42) - - (175)Disposal of a discontinued operation(2) - (525) (3) (3,082) (404) (33) - (4,047)Transfers and other movements - 93 - 307 227 (637) 10 -At the end of the financial year 50 2,299 906 13,061 4,468 594 153 21,531Accumulated depreciation and impairmentsAt the beginning of the financial year 13 1,766 241 10,959 1,761 - - 14,740Depreciation charge for the year(3) 11 71 53 475 100 - - 710Impairments for the year(4) 8 41 - 394 293 - - 736Disposals (4) (5) (17) (101) (42) - - (169)Disposal of a discontinued operation(2) - (477) (3) (2,660) (284) - - (3,424)Transfers and other movements - - - (66) 66 - - -At the end of the financial year 28 1,396 274 9,001 1,894 - - 12,593Net book value at 30 June 2021 22 903 632 4,060 2,574 594 153 8,938
(1) Refer to note 15 Provisions.(2) Refer to note 31 Discontinued operation.(3) Includes depreciation relating to a discontinued operation of US$23 million. Refer to note 31 Discontinued operation.(4) Refer to note 13 Impairment of non-financial assets.
Capital expenditure commitments as at 30 June 2021 were US$83 million (FY20: US$140 million).
Land and buildings Plant and equipment
30 June 2020
US$M ROU Other ROU Other
Other mineral assets
Assets under construction
Exploration and
evaluation Total
Cost At the beginning of the financial year - 2,669 798 15,045 4,501 592 28 23,633AASB 16 transition adjustment 49 - 86 - - - - 135Additions 2 - 21 113 - 596 49 781Foreign exchange movements in closure and rehabilitation provisions - - - (175) - - - (175)Disposals - (12) - (15) - - - (27)Acquisition of subsidiaries and jointly controlled entities - - - - 73 - - 73Transfers and other movements - 79 - 228 113 (424) 4 -At the end of the financial year 51 2,736 905 15,196 4,687 764 81 24,420Accumulated depreciation and impairmentsAt the beginning of the financial year - 1,695 186 10,510 1,646 - - 14,037Depreciation charge for the year(1) 13 74 55 463 115 - - 720Disposals - (3) - (14) - - - (17)At the end of the financial year 13 1,766 241 10,959 1,761 - - 14,740Net book value at 30 June 2020 38 970 664 4,237 2,926 764 81 9,680
(1) Includes depreciation relating to a discontinued operation of US$44 million. Refer to note 31 Discontinued operation.
(a) Property, plant and equipmentProperty, plant and equipment is stated at cost less accumulated depreciation and impairment charges. Cost is the fair value of consideration given to acquire the asset at the time of its acquisition or construction and includes the direct cost of bringing the asset to the location and condition necessary for operation and its estimated future cost of closure and rehabilitation.
(b) Assets under constructionWhen reserves are determined and development of commercial production is approved, capitalised exploration and evaluation expenditure is reclassified to assets under construction. All subsequent development expenditure is capitalised and classified as assets under construction, provided commercial viability conditions continue to be satisfied.
All assets included in assets under construction are reclassified to other categories in property, plant and equipment when the asset is available and ready for use in the location and condition necessary for it to be capable of operating in the manner intended.
115S
outh32 Annual R
eport 2021
Financial Rep
ort

Notes to financial statements – Operating assets and liabilities continued
11. Property, plant and equipment continued(c) Exploration and evaluation expenditureExploration is defined as the search for potential mineralisation after the Group has obtained legal rights to explore in a specific area and includes topographical, geological, geochemical and geophysical studies and exploratory drilling, trenching and sampling.
Evaluation is defined as the determination of the technical feasibility and commercial viability of a particular prospect. Activities conducted during the evaluation phase include the determination of the volume and grade of the deposit, examination and testing of extraction methods and metallurgical or treatment process, surveys of transportation and infrastructure requirements, and market and finance studies.
Exploration and evaluation expenditure (including amortisation of capitalised licence and lease costs) is charged to the Consolidated Income Statement as incurred except in the following circumstances, in which case the expenditure may be capitalised:
– The exploration and evaluation activity is within an area of interest which was previously acquired as an asset acquisition or in a business combination and measured at fair value on acquisition; and
– The existence of a commercially viable mineral deposit has been established.
In addition, drilling costs incurred at a producing mine for the purpose of improving confidence of the existing resource may be capitalised when the following criteria are satisfied:
– The drilling occurs within the existing physical boundaries of the area defined as the resource; and
– The drilling costs are incurred in resources which are economically recoverable.
Capitalised exploration and evaluation expenditure considered to be a tangible asset is recorded as a component of property, plant and equipment at cost less impairment charges. Otherwise, it is recorded as an intangible asset (such as certain licence and lease arrangements). In determining whether the purchase of an exploration licence or lease is an intangible asset or a component of property, plant and equipment, consideration is given to the substance of the item acquired and not its legal form. Licences or leases purchased which allow exploration over an extended period of time meet the definition of an intangible exploration lease asset where they cannot be reasonably associated with a known Mineral Resource.
(d) Other mineral assetsOther mineral assets comprise:
– Capitalised exploration, evaluation and development expenditure (including development stripping) for properties now in production;
– Mineral rights acquired; and
– Capitalised production stripping.
Development expenditureIn underground mines, when production and development activity occurs concurrently, development activity is separated from production activity, and is capitalised as development expenditure in other mineral assets. Underground mine development activity includes the cost associated with gaining access to an ore deposit which gives rise to a substantive change in the future productive capacity of the mine.
Development and production strippingThe process of removing overburden and other mine waste materials to access mineral deposits is referred to as stripping. In open-pit mining, stripping costs are accounted for separately for each component of an ore body. A component is a specific section within an ore body that is made more accessible by the stripping activity. The identification of components is dependent on the mine plan and will often comprise a separate pushback or phase identified in the plan.
There are two types of stripping activity:
– Development stripping is the initial overburden removal during the development phase to obtain access to a mineral deposit that will be commercially produced; and
– Production stripping is the interburden removal during the normal course of production activity. Production stripping commences after the first saleable minerals have been extracted from the component.
Development stripping costs are capitalised as a development stripping asset when:
– It is probable that future economic benefits associated with the asset will flow to the entity; and
– The costs can be measured reliably.
Production stripping can give rise to two benefits, being the extraction of ore in the current period and improved access to the ore body component in future periods. To the extent that the benefit is the extraction of ore, the stripping costs are recognised as an inventory cost. To the extent that the benefit is improved access to future ore, the stripping costs are recognised as a production stripping asset if the following criteria are met:
– It is probable that the future economic benefit (improved access to ore) will flow to the entity;
– The component of the ore body for which access has been improved can be identified; and
– The costs relating to the stripping activity can be measured reliably.
116
Sou
th32
Ann
ual R
epor
t 20
21Fi
nanc
ial R
epor
t

11. Property, plant and equipment continued(d) Other mineral assets continuedProduction stripping costs are allocated between the inventory produced and the production stripping asset using a life-of-component waste to ore (or mineral contained) strip ratio. When the current strip ratio is greater than the life-of-component strip ratio a portion of the stripping costs is capitalised to the production stripping asset.
The development and production stripping assets are depreciated on a units of production basis based on the Ore Reserves of the relevant components.
(e) LeasesAt inception of a contract, the Group assesses whether a contract is, or contains, a lease. A contract is, or contains, a lease if the contract conveys the right to control the use of an identified asset for a period of time in exchange for consideration.
The Group recognises a ROU asset and a lease liability at the lease commencement date. The ROU asset is initially measured at cost, which comprises the initial amount of the lease liability adjusted for any lease payments made at or before the commencement date, plus any initial direct costs incurred and estimated future cost of closure or rehabilitation, less any lease incentives received. The ROU asset is subsequently measured at cost less accumulated depreciation, impairment charges and any adjustments for remeasurements of the lease liability.
The corresponding lease liability is included within interest bearing liabilities. The lease liability is initially measured at the present value of the lease payments that are not paid at the commencement date, discounted using the interest rate implicit in the lease or, if that rate cannot be readily determined, the lessee’s incremental borrowing rate. The lessee’s incremental borrowing rate is the rate of interest that a lessee would have to pay to borrow over a similar term, and with similar security, the funds necessary to obtain an asset of a similar value to the ROU asset in a similar economic environment.
Lease payments included in the measurement of the lease liability comprise of the following:
– Fixed payments, including in-substance fixed payments;
– Variable lease payments that depend on a rate or an index, initially measured using the rate or index as at the commencement date;
– Amounts expected to be payable under a residual value guarantee; and
– The exercise price under a purchase option that the Group is reasonably certain to exercise, lease payments in an optional renewal period if the Group is reasonably certain to exercise an extension option and penalties for early termination of a lease if the Group is reasonably certain to terminate early.
The lease liability is subsequently measured at amortised cost using the effective interest method. It is remeasured when there is a change in future lease payments arising from a change in a rate or an index, if there is a change in the Group’s estimate of the amount expected to be payable under a residual guarantee, or if the Group changes its assessment of whether it will exercise a purchase, extension or termination option. When the lease liability is remeasured, a corresponding adjustment is made to the carrying amount of the ROU asset, or is recorded in the Consolidated Income Statement if the carrying amount of the ROU asset has been reduced to nil.
The nature of the Group’s leases predominantly relates to mining equipment and assets supporting the operations in line with the Group’s principal activities, as well as real estate in the form of office buildings.
Leased assets are pledged as security for the related lease liabilities.
Short-term, low-value and variable leasesThe Group has elected not to recognise ROU assets and lease liabilities for short-term and low-value leases. Short-term leases are leases with a lease term of 12 months or less, while low-value leases are leases where the underlying asset is considered low value. Variable leases are leases with lease payments which are variable but do not depend on a rate or an index. The Group recognises the lease payments associated with these leases as an expense in the Consolidated Income Statement on a straight-line basis over the lease term. If variable leases have a fixed component, these would be recognised on the Consolidated Balance Sheet.
Total cash outflows for lease obligations consist of US$104 million (FY20: US$96 million) for lease liabilities recognised on the Consolidated Balance Sheet and US$73 million (FY20: US$40 million) for short-term, low-value and variable leases recognised on the Consolidated Income Statement.
(f) Depreciation and amortisationThe carrying amounts of property, plant and equipment are depreciated to their estimated residual values over the estimated useful lives of the specific assets concerned. Estimates of residual values and useful lives are reassessed annually and any change in estimate is taken into account in the determination of remaining depreciation charges. Depreciation commences on the date of commissioning. The major categories of property, plant and equipment are depreciated on a units of production or straight-line basis using the estimated lives indicated below. However, where assets are dedicated to a mine or lease and are not readily transferable, the below useful lives are subject to the lesser of the asset category’s useful life and the life of the mine or lease:
Buildings 25 to 40 years straight-lineLand not depreciatedPlant and equipment 3 to 30 years straight-lineROU assets based on the shorter of the useful life or the lease term (straight-line)Mineral rights based on Ore Reserves on a units of production basisCapitalised exploration, evaluation and development expenditure based on Ore Reserves on a units of production basis
117S
outh32 Annual R
eport 2021
Financial Rep
ort

Notes to financial statements – Operating assets and liabilities continued
12. Intangible assets30 June 2021
US$M GoodwillOther
intangibles Total
CostAt the beginning of the financial year 193 325 518Additions - 1 1Disposals - (28) (28)Disposal of a discontinued operation(1) (54) (20) (74)At the end of the financial year 139 278 417Accumulated amortisation and impairmentsAt the beginning of the financial year 54 216 270Amortisation charge for the year(2) - 10 10Disposals - (28) (28)Disposal of a discontinued operation(1) (54) (6) (60)Impairments for the year - 36 36At the end of the financial year - 228 228Net book value at 30 June 2021 139 50 189
(1) Refer to note 31 Discontinued operation.(2) Includes amortisation relating to a discontinued operation of US$4 million. Refer to note 31 Discontinued operation.
30 June 2020
US$M GoodwillOther
intangibles Total
CostAt the beginning of the financial year 193 291 484Additions - 34 34At the end of the financial year 193 325 518Accumulated amortisation and impairmentsAt the beginning of the financial year 54 197 251Amortisation charge for the year(1) - 19 19At the end of the financial year 54 216 270Net book value at 30 June 2020 139 109 248
(1) Includes amortisation relating to a discontinued operation of US$3 million. Refer to note 31 Discontinued operation.
(a) GoodwillWhere the fair value of consideration paid for a business combination exceeds the fair value of the Group’s share of the identifiable net assets acquired, the difference is treated as purchased goodwill. Where the fair value of the Group’s share of the identifiable net assets acquired exceeds the cost of acquisition, the difference is immediately recognised in the Consolidated Income Statement. Goodwill is not amortised, however, its carrying amount is assessed annually against its recoverable amount.
(b) Other intangible assetsAmounts paid for the acquisition of identifiable intangible assets, such as software, licences and contract based intangible assets are capitalised at the fair value of consideration paid and are recorded at cost less accumulated amortisation and impairment charges. Identifiable intangible assets with a finite life are amortised on a straight-line basis over their expected useful life from when the asset is ready for use. The useful lives are as follows:
Software and licences 5 years
Contract based intangible assets up to 35 years
The Group has no identifiable intangible assets for which the expected useful life is indefinite.
118
Sou
th32
Ann
ual R
epor
t 20
21Fi
nanc
ial R
epor
t

13. Impairment of non-financial assetsIn testing for indications of impairment and performing impairment calculations, assets are considered as collective groups and referred to as cash generating units (CGUs). CGUs are the smallest identifiable group of assets, liabilities and associated goodwill that generate cash inflows that are largely independent of the cash inflows from other assets or groups of assets. Formal impairment tests are carried out annually for CGUs containing goodwill. In addition, formal impairment tests are performed for all other CGUs when there is an indication of impairment. The Group uses discounted cash flow valuations to assess all its CGUs for impairment or impairment reversal indicators. For any resultant formal impairment testing, and for CGUs containing goodwill, the Group uses the higher of fair value less cost of disposal (FVLCD) and its value in use to assess the recoverable amount. If the carrying value of the CGU exceeds its recoverable amount, the CGU is impaired, and an impairment loss is charged to the Consolidated Income Statement.
Previously impaired CGUs are reviewed for possible reversal of a previous impairment at each reporting date. Impairment reversals cannot exceed the carrying value that would have been determined (net of depreciation) had no impairment loss been recognised for the CGU. Goodwill is not subject to impairment reversal.
For properties not yet in production, any mineral rights acquired, together with subsequent capitalised exploration and evaluation expenditure, are regularly reviewed to determine the appropriateness of continuing to carry forward costs in relation to that area of interest. Once the technical feasibility and commercial viability of the extraction of Ore Reserves in an area of interest are demonstrated, exploration and evaluation assets attributable to that area of interest are first tested for impairment before being reclassified to other mineral assets.
The Group recorded the following pre-tax impairments for the year ended 30 June 2021:
US$M Note FY21 FY20
Property, plant and equipment 11 728 -
Right-of-use lease assets(1) 11 8 -Intangible assets 12 36 -Total impairment 772 -
(1) Included in the major corporate restructures earnings adjustments. Refer to note 4(b)(i) Earnings adjustments.
No impairment or impairment reversal was recognised for the year 30 June 2020.
(a) Recognised impairment – 30 June 2021Illawarra Metallurgical CoalOn 5 February 2021, the Group was advised that the New South Wales (NSW) Independent Planning Commission (IPC) refused the application for the Dendrobium Next Domain (DND) life extension project at IMC. The Group has since scaled back activity on the DND project while it considers alternative options following the IPC decision. This includes proceedings which have been commenced in the Land and Environment Court of NSW for a judicial review of the decision and the potential submission of an alternate mine plan to the NSW Minister for Planning and Public Spaces for determination of the project as state significant infrastructure. The decision by the IPC has introduced uncertainty over the future of the DND project, the IMC complex and the DND project’s value contribution to the IMC CGU recoverable amount assessment.
The Group has since assessed the potential implications of the IPC decision and reviewed the optimised IMC CGU and the resultant impact on the carrying value of its assets as at 30 June 2021. The IMC CGU, which is also a reporting segment, consists of the Appin and Dendrobium underground metallurgical coal mines, and the West Cliff and Dendrobium coal preparation plants. The Group recognised an impairment of property, plant and equipment at its IMC CGU of US$728 million which is included in expenses excluding net finance costs in the Consolidated Income Statement. This charge reflects the increased approval uncertainty created by the IPC’s decision to refuse the application for the DND life extension project and the resultant impact on the economics of the broader IMC complex. The recoverable amount of the IMC CGU was determined as US$550 million based on its FVLCD and reflects judgements in relation to the likelihood of future mine life extension projects for, and the Group’s major long-term coal supply arrangements connected with, the IMC complex. The fair value measurement is categorised as a Level 3 fair value based on the inputs in the valuation technique (refer to note 19 Financial assets and financial liabilities).
In the short to medium-term we have applied an actual enacted carbon price less allowable abatements based on existing regulations with the expectation that existing allowances will reduce over time as Australia strengthens its climate policies. In the long-term we assume a single global carbon price, based on an assessment of policy-driven costs, evolution of technological innovation and abatement costs. Our long-term global carbon price of US$40 per tonne is applied to all Scope 1 and 2 emissions and assumes no carbon exemptions or allowances are employed.
In determining the FVLCD, a real US$ post tax discount rate range of between 6 and 8 per cent was applied to discount future cash flows. The recoverable amount was informed by a production profile and costs based on management’s planning processes. The long-run metallurgical coal prices, energy coal prices and exchange rates used in the FVLCD determinations are within the following ranges as published by market commentators:
Assumptions used in FVLCD
Metallurgical coal (US$/t) 112 to 160Energy coal (US$/t) 58 to 78Foreign exchange rates (AU$ to US$) 0.71 to 0.77
119S
outh32 Annual R
eport 2021
Financial Rep
ort

Notes to financial statements – Operating assets and liabilities continued
13. Impairment of non-financial assets continued(b) Impairment test for CGUs containing goodwillFor the purpose of impairment testing, goodwill has been allocated to CGUs that are expected to benefit from the synergies of the business combination and which represent the level at which management will monitor and manage the goodwill.
The carrying amount of goodwill has been allocated to the following CGU:
US$M Note FY21 FY20
Hillside Aluminium 139 139Total goodwill 12 139 139
Hillside AluminiumThe goodwill arose from the acquisition of Alusaf in Hillside Aluminium (Pty) Ltd and has been allocated to the Hillside Aluminium CGU which comprises the Hillside aluminium smelter. The recoverable amount of the Hillside Aluminium CGU was determined based on a FVLCD calculation and was categorised as a Level 3 fair value based on the inputs in the valuation technique (refer to note 19 Financial assets and financial liabilities). The impairment test for the Hillside Aluminium CGU indicated that no impairment was required. The determination of FVLCD was most sensitive to:
– Production volumes;
– Aluminium and alumina prices;
– Foreign exchange rates;
– Carbon pricing and timing; and
– Discount rate.
Production volumes – estimated production volumes are based on the life of the smelter as determined by management as part of the long-term planning process. Production volumes are influenced by production input costs such as electricity prices, jurisdiction based carbon pricing, and the selling price of aluminium.
Aluminium and alumina prices, and foreign exchange rates – key assumptions for aluminium and alumina prices are comparable to market consensus forecasts for each of the years of the life of operation. Foreign exchange rates are aligned with forward market rates in the short-run and thereafter are within the range published by market commentators.
The table below shows the amount by which these assumptions must change in isolation in order for the estimated recoverable amount to be equal to the carrying amount of the Hillside Aluminium CGU, including goodwill. Owing to the complexity of the relationships between each key assumption, the analysis was performed for each assumption individually.
Assumptions used in FVLCDChange required for the carrying amount to equal
recoverable amount
Aluminium prices (US$/t) 1,552 to 2,866 decrease of 10%Alumina prices (US$/t) 288 to 400 increase of 34%Foreign exchange rates (ZAR to US$) 14.5 to 16.0 ZAR strengthening of 20%
Carbon pricing and timing – in determining the FVLCD, the current jurisdiction enacted carbon price, in real terms, of ZAR133 to ZAR136 per tonne CO2e is applied for the life of operation for Scope 1 and 2 emissions, net of operation specific abatement allowances.
Discount rate – in determining the FVLCD, a real post-tax discount rate of 7 per cent (FY20: 7.5 per cent), and a country risk premium of up to 2 per cent (FY20: up to 2 per cent) are applied to the post-tax cash flows expressed in real terms.
120
Sou
th32
Ann
ual R
epor
t 20
21Fi
nanc
ial R
epor
t

13. Impairment of non-financial assets continued
Key estimates, assumptions and judgementsAn assessment as to whether there is any indication of impairment and the calculation of a CGU’s recoverable amount requires management to make estimates and assumptions about expected production and sales volumes, commodity prices (considering current and historical prices, price trends and related factors), foreign exchange rates, Ore Reserves, Mineral Resources, regulatory approvals, operating costs, closure and rehabilitation costs, future capital expenditure, allocation of corporate costs, specific jurisdiction based carbon prices, where relevant, and global carbon pricing. These estimates and assumptions are subject to risk and uncertainty; hence there is a possibility that changes in circumstances will alter these projections, which may impact the recoverable amount. In such circumstances, some or all of the carrying amount may be impaired or a previously recognised impairment charge may be reversed with the impact recorded in the Consolidated Income Statement.
The key estimates and assumptions used in the assessment of impairment indicators are as follows:
Future production Life of operation plans based on Proved and Probable Ore Reserve estimates, Mineral Resource (excluding Inferred Mineral Resources) estimates, economic life of smelters and refineries and, in certain cases, expansion projects, including future cost of production.
Commodity prices Forward market and contract prices, and longer-term price protocol estimates which includes an assessment of the impact carbon price assumptions might have.
Exchange rates Observable forward market foreign exchange rates, and longer-term price protocol estimates.
Discount rates Cost of capital risk-adjusted and appropriate to the resource.
Regulatory approvals Life of operation plans include assumptions associated with the successful application of ongoing and future regulatory approvals.
Carbon prices Actual enacted schemes less allowable abatements, where applicable, and a long-term base case estimate of US$40 per tonne (real) applied to all Scope 1 and 2 emissions.
The cost and benefit of achieving the Group’s emissions reduction strategy is included when the Group has a high degree of confidence that a project will achieve a reduction, which typically aligns with the related capital project being internally approved. The Group’s commodity prices and other key assumptions represent management’s expectations on likely outcomes, with a base case estimation of at least a 2°C climate related warming scenario.
Where impairment testing is undertaken, a range of external sources are considered as further input to the above assumptions.
When assessing for impairment and impairment reversal indicators, the fundamental characteristics of previously impaired CGUs are relevant to their sensitivity to key estimates and assumptions. For previously impaired CGUs these include:
– CGUs with higher operating margins and with life of operation plans longer than 10 years which are less sensitive to short-term commodity prices and foreign exchange rates, for example Worsley Alumina;
– CGUs with lower operating margins which are highly sensitive to movements in commodity prices and foreign exchange rates, for example South Africa Manganese and IMC; and
– CGUs with higher operating margins, shorter life of operation plans and exposure to commodities that display greater price volatility, for example Australia Manganese.
The operating assets for previously impaired CGUs are included in note 4(b) Segment results.
For properties not yet in production, acquired mineral rights together with subsequent capitalised exploration and evaluation expenditure require judgement to determine the likelihood of future economic benefits from future development, and whether sufficient data exists to indicate that, although a development in the specific area is likely to proceed, the carrying amount of the exploration and evaluation asset is unlikely to be recovered in full. When facts and circumstances suggest that the carrying amount exceeds the recoverable amount, an impairment test will be required which may result in an adjustment to the carrying value of acquired mineral rights together with subsequent capitalised exploration and evaluation expenditure.
121S
outh32 Annual R
eport 2021
Financial Rep
ort

13. Impairment of non-financial assets continued
Key estimates, assumptions and judgements continuedAn Ore Reserve is the economically mineable part of the Measured and/or Indicated Mineral Resource that can be legally extracted, or where there is a reasonable expectation that approvals for extraction will be granted, from the Group’s properties. In order to estimate Ore Reserves, consideration is required for a range of modifying factors, including mining, processing, metallurgical, infrastructure, economic, marketing, legal, environmental, social and governmental. When reporting Ore Reserves, the relevant studies, to at least a pre-feasibility level, must demonstrate that, at the time of reporting, extraction could be reasonably justified. Management will form a view of forecast sales prices, based on current and long-term historical average price trends.
Estimating the quantity and/or grade of Mineral Resources requires the location, quantity, grade (or quality), continuity and other geological characteristics to be known, estimated or interpreted from specific geological evidence and knowledge, including sampling in order to satisfy the requirement that there are reasonable prospects for eventual economic extraction. This process may require complex and difficult geological assessments to interpret the data.
The Group reports Ore Reserves and Mineral Resources in accordance with the Australasian Code for Reporting of Exploration Results, Mineral Resources and Ore Reserves (JORC Code), and the ASX Listing Rules Chapter 5: Additional reporting on mining and oil and gas production and exploration activities.
Because the economic assumptions used to estimate the Ore Reserves change from period to period, and because additional geological data is generated during the course of operations, estimates of the Ore Reserves and Mineral Resources may change from period to period. The Group’s planning processes consider the impacts of climate change on its Ore Reserves, including assessments of operating costs and the impact of extreme weather events on the expectation of economic extraction. Changes in reported Ore Reserves may affect the Group’s financial results and financial position in a number of ways, including the following:
– Asset recoverable amounts may be affected due to changes in estimated future cash flows;
– Depreciation, depletion and amortisation charged in the Consolidated Income Statement may change on a units of production basis, or where the useful economic lives of assets change;
– Development and production stripping costs recorded on the Consolidated Balance Sheet or charged to the Consolidated Income Statement may change with stripping ratios or on a units of production basis of depreciation; and
– Decommissioning, closure and rehabilitation provisions may change where estimated Ore Reserves affect expectations about the timing or cost of these activities.
The carrying amount of associated deferred tax assets may change due to changes in estimates of the likely recovery of the tax benefits.
14. Trade and other payablesUS$M FY21 FY20
CurrentTrade creditors 663 558Other creditors 114 69Total current trade and other payables 777 627Non-currentOther creditors 2 3Total non-current trade and other payables 2 3
Trade and other payables generally represent liabilities for goods and services provided to the Group prior to the end of the financial year which were unpaid at the end of the financial year. These amounts are unsecured. Trade and other payables are included in current liabilities, except for those liabilities where payment is not due within 12 months from the reporting date, which are classified as non-current liabilities.
Trade and other payables, other than financial guarantee contracts and financial liabilities held at FVTPL, are stated at their amortised cost and are non-interest bearing. The carrying value of these trade and other payables is considered to approximate fair value due to the short-term nature of the payables.
Notes to financial statements – Operating assets and liabilities continued
122
Sou
th32
Ann
ual R
epor
t 20
21Fi
nanc
ial R
epor
t

15. ProvisionsUS$M Note FY21 FY20
CurrentEmployee benefits 195 184Closure and rehabilitation 15 40Other 29 50Total current provisions 239 274Non-currentEmployee benefits 6 4Closure and rehabilitation 1,702 1,790Post-retirement employee benefits 22 41 77Other 10 28Total non-current provisions 1,759 1,899
30 June 2021
US$MEmployee
benefitsClosure and
rehabilitation
Post-retirement employee
benefits Other Total
At the beginning of the financial year 188 1,830 77 78 2,173Charge/(credit) for the year to the Consolidated Income Statement:
Underlying 184 16 1 22 223Discounting(1) - 120 - 3 123Change in discount rate(2)(3) - (23) - - (23)Net interest expense(4) - - 8 - 8Exchange rate variations 21 51 16 8 96Released during the year (2) (3) - (4) (9)
Amounts capitalised for change in costs and estimates - 271 - - 271Amounts capitalised for change in discount rate(3) - 235 - - 235Foreign exchange amounts capitalised - 238 - - 238Amounts taken to retained earnings - - (1) - (1)Utilisation (152) (21) (7) (33) (213)Disposal of a discontinued operation(5) (38) (997) (60) (30) (1,125)Transfers and other movements - - 7 (5) 2At the end of the financial year 201 1,717 41 39 1,998
(1) Includes amounts relating to a discontinued operation of US$64 million. Refer to note 31 Discontinued operation.(2) Includes amounts relating to a discontinued operation of (US$17) million. Refer to note 31 Discontinued operation.(3) The Group has reviewed its discount rates applied to closure and rehabilitation provisions. The corresponding net increase in the provision is capitalised as an asset or charged
to the Consolidated Income Statement in the case of closed sites. (4) Includes amounts relating to a discontinued operation of US$5 million. Refer to note 31 Discontinued operation.(5) Refer to note 31 Discontinued operation.
30 June 2020
US$MEmployee
benefitsClosure and
rehabilitation
Post-retirement employee
benefits Other Total
At the beginning of the financial year 203 1,868 92 74 2,237Charge/(credit) for the year to the Consolidated Income Statement:
Underlying 143 16 2 37 198Discounting(1) - 102 - - 102Net interest expense(2) - - 8 - 8Exchange rate variations (10) (48) (17) (14) (89)Released during the year (16) (9) - (3) (28)
Amounts capitalised for change in costs and estimates - 106 - - 106Foreign exchange amounts capitalised - (175) - - (175)Amounts taken to retained earnings - - (2) - (2)Utilisation (132) (30) (6) (16) (184)At the end of the financial year 188 1,830 77 78 2,173
(1) Includes amounts relating to a discontinued operation of US$48 million. Refer to note 31 Discontinued operation.(2) Includes amounts relating to a discontinued operation of US$5 million. Refer to note 31 Discontinued operation.
123S
outh32 Annual R
eport 2021
Financial Rep
ort

15. Provisions continued(a) Employee benefits Liabilities for unpaid wages and salaries are recognised in other creditors. Current entitlements to annual leave and accumulating sick leave accrued for services up to the reporting date are recognised in the provision for employee benefits and are measured at the amounts expected to be paid. Entitlements to non-accumulated sick leave are recognised when the leave is taken.
The current liability for long service leave (for which settlement within 12 months of the reporting date cannot be deferred) is recognised in the current provision for employee benefits and is measured in accordance with annual leave described above. The non-current liability for long service leave is recognised in the non-current provision for employee benefits and measured as the present value of expected future payments to be made in respect of services provided by employees up to the reporting date.
(b) Closure and rehabilitation The mining, extraction and processing activities of the Group normally give rise to obligations for site closure or rehabilitation. Closure and rehabilitation works can include facility decommissioning and dismantling, removal or treatment of waste materials, site and land rehabilitation.
Provisions for the cost of each closure and rehabilitation program are recognised at the time that environmental disturbance occurs. When the extent of disturbance increases over the life of an operation, the provision is increased accordingly. Costs included in the provision encompass all closure and rehabilitation activity expected to occur progressively over the life of the operation and at, or after, the time of closure, for disturbance existing at the reporting date. Routine operating costs that may impact the ultimate closure and rehabilitation activities, such as waste material handling conducted as an integral part of a mining or production process, are not included in the provision. Costs arising from unforeseen circumstances, such as the contamination caused by unplanned discharges, are recognised as an expense and liability when the event gives rise to an obligation which is probable and capable of reliable estimation.
The timing of the actual closure and rehabilitation expenditure is dependent upon a number of factors such as: the life and nature of the asset, which is informed by the demand for commodities, carbon pricing and other variables; the operating licence conditions; and the environment in which the mine operates. Expenditure may occur before and after closure and can continue for an extended period of time depending on closure and rehabilitation requirements.
Closure and rehabilitation provisions are measured at the expected value of future cash flows, discounted to their present value and determined according to the probability of alternative estimates of cash flows occurring for each operation.
Discount rates used are risk-free interest rates specific to the country in which the operations are located. Material changes in country specific risk-free interest rates may affect the discount rates applied.
When provisions for closure and rehabilitation are initially recognised, the corresponding cost is capitalised as an asset, representing part of the cost of acquiring the future economic benefits of the operation. The capitalised cost of closure and rehabilitation activities is recognised in property, plant and equipment and depreciated accordingly. The value of the provision is progressively increased over time due to the effect of discounting unwind and inflation, creating an expense recognised in finance expenses.
Closure and rehabilitation provisions are also adjusted for changes in costs and estimates. Those adjustments are accounted for as a change in the corresponding capitalised cost, except where a reduction in the provision is greater than the depreciated capitalised cost of the related assets, in which case the capitalised cost is reduced to nil and the remaining adjustment is recognised first against other items in property, plant and equipment, and subsequently to the Consolidated Income Statement. In the case of closed sites, changes to estimated costs are recognised immediately in the Consolidated Income Statement. Changes to the capitalised cost result in an adjustment to future depreciation. Adjustments to the estimated amount and timing of future closure and rehabilitation cash flows are a normal occurrence in light of the significant judgements and estimates involved.
(c) Post-retirement employee benefitsThis relates to the provision for post-employment defined benefit pension and medical plans. Refer to note 22 Pension and other post-retirements obligations.
Key estimates, assumptions and judgementsThe recognition of closure and rehabilitation provisions requires judgement and is based on significant estimates and assumptions such as:
– the requirements of the relevant local legal and regulatory framework;
– the magnitude of possible contamination;
– the timing, extent, and cost of required closure and rehabilitation activity; and
– potential changes in climate conditions.
These uncertainties may result in future actual expenditure differing from the amounts currently provided.
The provision recognised for each site is periodically reviewed and updated based on the facts and circumstances available at the time.
In addition to the uncertainties noted above, certain closure and rehabilitation activities may be subject to legal disputes and depending on the ultimate resolution of these disputes, the final liability for such matters could vary.
If risk-free interest rates were decreased by 0.5 per cent, the provision would increase by approximately US$298 million.
Notes to financial statements – Operating assets and liabilities continued
124
Sou
th32
Ann
ual R
epor
t 20
21Fi
nanc
ial R
epor
t

Notes to financial statements – Capital structure and financing
This section outlines how the Group manages its capital and related financing activities.
16. Cash and cash equivalentsCash and cash equivalents include cash at bank and on hand as well as short-term deposits.
US$M FY21 FY20
Cash 596 465Short-term deposits 1,017 850Cash and cash equivalents(1)(2) 1,613 1,315
(1) Cash and cash equivalents include US$5 million (FY20: US$16 million) which is restricted by legal or contractual arrangements. (2) Cash and cash equivalents include US$285 million (FY20: US$284 million) consisting of short-term deposits and cash managed by the Group on behalf of its equity accounted
investments. The corresponding amount payable is included in note 17 Interest bearing liabilities.
17. Interest bearing liabilitiesUS$M FY21 FY20
CurrentLease liabilities 37 42Unsecured loans from equity accounted investments(1) 285 284Unsecured other 86 29Total current interest bearing liabilities 408 355Non-currentLease liabilities 650 609Unsecured other 149 53Total non-current interest bearing liabilities 799 662
(1) Refer to note 16 Cash and cash equivalents and note 29 Related party transactions.
Bank overdrafts, bank loans and other borrowings are initially recognised at their fair value net of directly attributable transaction costs. Subsequent to initial recognition, interest bearing liabilities are measured at amortised cost using the effective interest method. Gains and losses are recognised in the Consolidated Income Statement when the liabilities are derecognised. Interest bearing liabilities are classified as current liabilities, except when the Group has an unconditional right to defer settlement for at least 12 months after the reporting date, in which case the liabilities are classified as non-current.
(a) Reconciliation of movements in liabilities to cash flows arising from financing activities
US$M Lease liabilities
Other interest bearing
liabilities
Total interest bearing
liabilities
At the beginning of the financial year 651 366 1,017Changes from financing cash flows:
Net repayment of lease liabilities (49) - (49)Net receipt/(repayment) of other interest bearing liabilities - 9 9
Total changes from financing cash flows (49) 9 (40)The effect of changes in foreign exchange rates 58 (4) 54Increase/(decrease) in lease and other interest bearing liabilities 27 5 32Disposal of a discontinued operation(1) - 144 144Other changes:
Interest expense 55 15 70Interest paid (55) (15) (70)
At the end of the financial year 687 520 1,207
(1) Refer to note 31 Discontinued operation.
125S
outh32 Annual R
eport 2021
Financial Rep
ort

Notes to financial statements – Capital structure and financing continued
18. Net finance costs
US$M FY21FY20
Restated(1)
Finance expensesInterest on borrowings 15 18Interest on lease liabilities 55 51Discounting on provisions and other liabilities 59 54Change in discount rate on closure and rehabilitation provisions (6) -Net interest expense on post-retirement employee benefits 3 3Fair value change on financial assets - 9Exchange rate variations on net debt 52 (6)
178 129Finance incomeInterest income 17 35Net finance costs 161 94
(1) Refer to note 31 Discontinued operation.
Interest income and expense are recognised using the effective interest method.
19. Financial assets and financial liabilities(a) Financial risk management objectives and policiesThe Group is exposed to market, liquidity and credit risk. These risks are managed in accordance with the Group’s portfolio risk management strategy which supports the delivery of the Group’s financial targets while protecting its future financial security and flexibility by taking advantage of the natural diversification of the Group’s operations and activities. A Cash Flow at Risk (CFaR) framework is used to capture the benefits of diversification and to measure the aggregate impact of financial risks on those financial targets. CFaR is measured on a portfolio basis and is defined as the expected reduction from projected business plan cash flows over a one-year horizon in a pessimistic case. In addition to the CFaR framework, deterministic analysis of a range of operational, commodity price and foreign exchange rate scenarios is also used to measure the potential impact on financial targets.
(i) Market riskMarket risk is the risk that the fair value of future cash flows of a financial instrument will fluctuate because of changes in market prices. Market risk comprises interest rate risk, foreign currency risk and other price risk, such as equity price risk and commodity price risk. Financial instruments affected by market risk include loans and borrowings, deposits, investments in equity instruments designated as FVOCI, other investments held at FVTPL and derivative financial instruments.
Group activities expose it to market risks associated with movements in interest rates, foreign currencies and commodity prices. The Group predominantly manages financing costs, currency impacts, input costs and commodity prices on a floating or index basis. This strategy gives rise to a risk of variability in earnings which is measured under the CFaR framework.
In executing the strategy, financial instruments may be employed for risk mitigation purposes with a strict Board of Directors approved mandate, or to align the total Group exposure to the relevant index target in the case of commodity sales, operating costs or debt issuances.
Interest rate riskThe Group is exposed to interest rate risk on its cash and cash equivalents, trade and other receivables, embedded derivatives, trade and other payables and interest bearing liabilities from the possibility that changes in interest rates will affect future cash flows or the fair value of financial instruments.
The Group had the following exposure to interest rate risk:
US$M FY21 FY20
Financial assets Cash and cash equivalents 1,608 1,299Trade and other receivables 131 150Derivative contracts - 9Financial liabilitiesTrade and other payables (14) -Interest bearing liabilities (314) (340)Net exposure 1,411 1,118
126
Sou
th32
Ann
ual R
epor
t 20
21Fi
nanc
ial R
epor
t

19. Financial assets and financial liabilities continued(a) Financial risk management objectives and policies continued(i) Market risk continuedThe following table demonstrates the sensitivity to a reasonably possible change in interest rates on that portion of borrowings and financial assets affected. With all other variables held constant, the Group’s profit/(loss) after tax is affected through the impact on floating rate borrowings and investments, as follows:
Impact on profit/(loss) after tax
US$M
Increase/decrease in basis points FY21 FY20
+100 15 8–100 (4) (1)
The sensitivity analysis assumes that the change in interest rates is effective from the beginning of the financial year and the fixed/floating mix and balances are constant over the year. For the purpose of the sensitivity analysis, the decrease of 100 basis points is applied to the extent that the underlying interest rates do not fall below zero per cent. However, interest rates and the net debt profile of the Group may not remain constant over the coming financial year and therefore such sensitivity analysis should be used with care.
Foreign currency riskForeign currency risk is the risk that the fair value or future cash flows of an exposure will fluctuate because of changes in foreign exchange rates. The functional currency of the Group’s operations is the US dollar. The Group’s potential currency exposures comprise:
– Translational exposure in respect of non-functional currency monetary items; and
– Transactional exposure in respect of non-functional currency expenditure and revenues.
Certain operating and capital expenditure is incurred by operations in currencies other than their functional currency. To a lesser extent, certain sales revenue is earned in currencies other than the functional currency of the operation, and certain exchange control restrictions may require funds to be maintained in currencies other than the operations functional currency. When required, the Group may enter into forward exchange contracts.
The principal non-functional currencies to which the Group is exposed to are the Australian dollar, Brazilian real, Canadian dollar, Colombian peso, and South African rand. The following table shows the foreign currency risk arising from financial assets and liabilities, which are denominated in these currencies:
Net financial assets/(liabilities) – by currency of denomination
US$M FY21 FY20
Australian dollar (847) (856)Brazilian real 58 7Canadian dollar 19 (25)Colombian peso 9 (15)South African rand (172) 38
Based on the Group’s net financial assets and liabilities as at 30 June, a weakening of the US dollar against these currencies as illustrated in the table below, with all other variables held constant, would increase/(decrease) profit/(loss) after tax and other comprehensive income, net of tax, as follows:
30 June 2021
Currency movement
US$M Profit/(loss) after taxOther comprehensive
income, net of tax
10% movement in Australian dollar (60) -10% movement in Brazilian real (1) 710% movement in Canadian dollar 1 110% movement in Colombian peso 1 -10% movement in South African rand (17) -
30 June 2020
Currency movement
US$M Profit(loss) after taxOther comprehensive
income, net of tax
10% movement in Australian dollar (60) -10% movement in Brazilian real (2) 310% movement in Canadian dollar (3) -10% movement in Colombian peso (2) -10% movement in South African rand 4 -
127S
outh32 Annual R
eport 2021
Financial Rep
ort

Notes to financial statements – Capital structure and financing continued
19. Financial assets and financial liabilities continued(a) Financial risk management objectives and policies continued(i) Market risk continued
Commodity price riskContracts for the sale and physical delivery of commodities are executed whenever possible on a pricing basis intended to achieve a relevant index target. Where pricing terms deviate from the index, the Group may choose to use derivative commodity contracts to realise the index price. Contracts for the physical delivery of commodities are not typically financial instruments and are carried in the Consolidated Balance Sheet at cost (typically at nil).
Provisionally priced commodity sales and purchases contractsProvisionally priced sales or purchases contracts are those for which price finalisation, referenced to the relevant index, is outstanding at the reporting date. Provisional pricing mechanisms embedded within these sales and purchases arrangements have the character of a commodity derivative and are carried at FVTPL as part of trade receivables or trade creditors. Fair value movements on provisionally priced sale contracts are disclosed in ‘Other’ revenue. Refer to note 4(b) Segment results. The Group’s exposure at 30 June 2021 to the impact of movements in commodity prices on provisionally invoiced sale and purchase volumes was predominantly around nickel, silver, lead, zinc, aluminium and alumina.
The Group had 3.6kt of nickel, 3.0Moz of silver, 32.0kt of lead, 9.6kt of zinc, 4.0kt of aluminium and 64.2kt of alumina exposure at 30 June 2021 (FY20: 2.5kt of nickel, 2.0Moz of silver, 28.8kt of lead, 7.8kt of zinc, 18.7kt of aluminium and 11.6kt of alumina) that was provisionally priced. The final price of these sales or purchases will be determined during the first half of FY22. A 10 per cent change in the realised price of these commodities, with all other factors held constant, would increase or decrease profit/(loss) after tax by US$26 million (FY20: US$16 million). The relationship between commodity prices and foreign currencies is complex and foreign exchange rates and commodity prices may move concurrently in response to market conditions. These sensitivities should therefore be used with care.
(ii) Liquidity risk The Group’s liquidity risk arises from the possibility that it may not be able to settle or meet its obligations as they fall due. Operational, capital and regulatory requirements are considered in the management of liquidity risk, in conjunction with short and long-term forecast information.
The Group’s policy on counterparty credit exposure ensures that only counterparties of a high credit standing are used for the investment of any excess cash.
Standby arrangements and unused credit facilitiesThe entities in the Group are funded by a combination of cash generated by the Group’s operations, working capital facilities and intercompany loans provided by the Group. Intercompany loans may be funded by a combination of cash, short and long-term debt and equity market raisings. Details of the Group’s major standby arrangement are as follows:
30 June 2021
US$M Available Used Unused
Revolving credit facility(1) 1,450 - 1,450
(1) The Group has an undrawn revolving credit facility which is a standby arrangement to the US commercial paper program. This facility was extended in July 2020 by one year and expires in February 2023.
Maturity profile of financial liabilitiesThe maturity profiles of financial liabilities, based on the contractual amounts, are as follows:
30 June 2021
US$MCarrying amount Total
On demand or less than 1
year 1 to 5 yearsMore than 5
years
Trade and other payables(1) – financial guarantee contract 15 93 93 - -Trade and other payables(2) – other 754 754 752 2 -Other interest bearing liabilities 520 545 372 98 75Lease liabilities 687 1,264 91 320 853Other financial liabilities – derivative contracts 11 11 11 - -Total 1,987 2,667 1,319 420 928
(1) Refer to note 31 Discontinued operation.(2) Excludes current input taxes of US$10 million included in other creditors. Refer to note 14 Trade and other payables.
30 June 2020
US$MCarrying amount Total
On demand or less than 1
year 1 to 5 yearsMore than 5
years
Trade and other payables(1) 624 624 621 3 -Other interest bearing liabilities 366 376 315 43 18Lease liabilities 651 1,226 92 294 840Other financial liabilities – derivative contracts 1 1 1 - -Total 1,642 2,227 1,029 340 858
(1) Excludes current input taxes of US$6 million included in other creditors. Refer to note 14 Trade and other payables.
128
Sou
th32
Ann
ual R
epor
t 20
21Fi
nanc
ial R
epor
t

19. Financial assets and financial liabilities continued(a) Financial risk management objectives and policies continued(iii) Credit riskThe Group has credit risk management policies in place covering the credit analysis, approvals and monitoring of counterparty exposures. As part of these processes the ongoing creditworthiness of counterparties is regularly assessed.
Mitigation methods are defined and implemented for higher-risk counterparties to protect revenues, with more than half of the Group’s sales of physical commodities occurring via secured payment terms including prepayments, letters of credit, guarantees and other risk mitigation instruments. The methods include credit exposure management and overdue accounts monitoring. The cadence on these mitigation methods has been maintained since it was increased in the wake of changes in market conditions due to COVID-19.
There are no material concentrations of credit risk, either with individual counterparties or groups of counterparties, by industry or geography.
The Group’s exposure to credit risk is influenced by the individual characteristics of each counterparty or customer. However, management also consider other factors that may influence the credit risk of its counterparty or customer base. Where there is credit exposure for a new customer, they are assessed for creditworthiness before the Group’s standard payment and delivery terms and conditions are offered. For these customers, credit limits are established and reviewed annually or with the release of new information materially impacting the customer’s creditworthiness. The Group’s review includes external credit ratings, if available, credit agency information, as well as financial institution and industry information.
The carrying amounts of financial assets represent the maximum credit exposure.
Expected credit loss assessment as at 30 June 2021For trade receivables, the Group uses the simplified approach to recognise impairments based on the lifetime expected credit loss. For other receivables, the Group applies the general approach and recognises impairments based on a 12-month expected credit loss.
Impairment allowances are based on a forward-looking expected credit loss model. Where there has been a significant increase in credit risk, a loss allowance for lifetime expected credit losses is required.
An analysis has been performed for each financial asset subject to the expected credit loss assessment to take into consideration any increased credit risk exposure as a result of COVID-19 and the likelihood of recoverability.
Exposures are grouped by external credit rating and security options and an expected credit loss rate is calculated accordingly. Where applicable, actual credit loss experience is also taken into account. For remaining receivables without an external credit rating or security option, a rating of BB (Standard and Poor’s) is used, on the basis that there is no support that it is investment grade, nor is there any evidence of default.
Impairments on loans to equity accounted investments have been measured on the 12-month expected credit loss basis, per the general approach.
(b) Accounting classification and fair value(i) Recognition and initial measurementAll financial assets (with the exception of trade and other receivables without a significant financing component) and financial liabilities are initially recognised at fair value plus transaction costs directly attributable to its acquisition or issue (for all items except those classified as FVTPL). Trade and other receivables without a significant financing component are initially measured at the transaction price.
(ii) Financial assets: Classification and subsequent measurementOn initial recognition, financial assets are either measured at amortised cost or at fair value.
A financial asset is measured at amortised cost if it meets both of the following conditions and is not designated as FVTPL:
– It is held within a business model whose objective is to hold assets to collect contractual cash flows; and
– Its contractual terms give rise on specified dates to cash flows that are solely payments of principal and interest on the principal amount outstanding.
Financial assets that are held for trading and whose performance is evaluated on a fair value basis are measured at FVTPL.
On initial recognition, the Group may irrevocably designate a financial asset to be held at FVTPL that otherwise meets the requirements to be measured at amortised cost or for designation as FVOCI, if doing so eliminates or significantly reduces an accounting mismatch that would otherwise arise.
On initial recognition of an investment in an equity instrument not held for trading, the Group may also irrevocably elect to present subsequent changes in the investment’s fair value in other comprehensive income. This election is made on an investment-by-investment basis.
All financial assets not measured at amortised cost or designated as FVOCI are measured at FVTPL. This includes all derivative financial assets.
Financial assets are not reclassified subsequent to their initial recognition unless the Group changes its business model for managing financial assets in which case all affected financial assets are reclassified on the first day of the first reporting period following the change in the business model.
129S
outh32 Annual R
eport 2021
Financial Rep
ort

Notes to financial statements – Capital structure and financing continued
19. Financial assets and financial liabilities continued(b) Accounting classification and fair value continued(ii) Financial assets: Classification and subsequent measurement continued
Financial assets: Assessment whether contractual cash flows are solely payments of principal and interest For the purposes of this assessment, ‘principal’ is defined as the fair value of the financial asset on initial recognition. ‘Interest’ is defined as consideration for the time value of money and for the credit risk associated with the principal amount outstanding during a particular period and for other basic lending risks and costs (for example, liquidity risk and administrative costs), as well as a profit margin.
In assessing whether the contractual cash flows are solely payments of principal and interest, the Group considers the contractual terms of the instrument. This includes assessing whether the financial asset contains a contractual term that could change the timing or amount of contractual cash flows such that it would not meet this condition. In making this assessment, the Group considers:
– Contingent events that would change the amount or timing of cash flows;
– Terms that may adjust the contractual coupon rate, including variable rate features;
– Prepayment and extension features; and
– Terms that limit the Group’s claim to cash flows from specified assets (for example, non-recourse features).
Financial assets: Subsequent measurement and gains and losses
Classification Subsequent measurement
Held at FVTPL Financial assets held at FVTPL are subsequently measured at fair value. Net gains and losses, including any interest, dividend income or movements in provisionally priced sales agreements, are recognised in the Consolidated Income Statement.
Forward exchange contracts and interest rate swaps held for hedging purposes are accounted for as either cash flow or fair value hedges. Any derivative instrument fair value change that does not qualify for hedge accounting is recognised immediately in the Consolidated Income Statement.
Amortised cost Financial assets held at amortised cost are subsequently measured at amortised cost using the effective interest method. The amortised cost is reduced by impairment losses. Interest income, foreign exchange gains and losses and impairments are recognised in the Consolidated Income Statement. Any gain or loss on derecognition is recognised in the Consolidated Income Statement.
Investments in equity instruments – designated as FVOCI
Investments in equity instruments designated as FVOCI are subsequently measured at fair value. Dividends are recognised as income in the Consolidated Income Statement unless the dividend clearly represents a recovery of part of the cost of the investment. Other net gains and losses are recognised in other comprehensive income and are not reclassified to the Consolidated Income Statement.
The measurement of fair value of financial assets is based on quoted market prices in active markets for identical assets. Where no price information is available from a quoted market source, alternative market mechanisms or recent comparable transactions, fair value is estimated based on the Group’s views on relevant future prices, net of valuation allowances to accommodate liquidity, modelling, credit and other risks implicit in such estimates.
(iii) Financial liabilities: Classification and subsequent measurementFinancial liabilities are classified as FVTPL, financial guarantee contracts or as measured at amortised cost. A financial liability is classified as FVTPL if it is classified as held for trading, it is a derivative, or it is designated as such on initial recognition. Financial liabilities held at FVTPL are measured at fair value, and net gains and losses, including any interest expense, are recognised in the Consolidated Income Statement. Financial guarantee contracts are initially measured at fair value and subsequently measured at the higher of the expected credit loss and the amount initially recognised less the cumulative amount of guarantee fee income recognised, with changes in value recognised in the Consolidated Income Statement. Other financial liabilities are subsequently measured at amortised cost using the effective interest method. Interest expense and foreign exchange gains or losses are recognised in the Consolidated Income Statement. Any gain or loss on derecognition is also recognised in the Consolidated Income Statement.
(iv) Embedded derivativesA derivative embedded within a hybrid contract, with a financial liability or non-financial host, is separated from the host and accounted for as a separate derivative if: the economic characteristics and risks are not closely related to the host; a separate instrument with the same terms as the embedded derivative would meet the definition of a derivative; and the hybrid contract is not measured at FVTPL. Embedded derivatives are measured at fair value with changes in fair value recognised in the Consolidated Income Statement.
A derivative embedded within a hybrid contract containing a financial asset host is not accounted for separately. The financial asset host together with the embedded derivative is required to be classified in its entirety as a financial asset held at FVTPL.
(v) Derecognition
Financial assetsThe Group derecognises a financial asset when the contractual rights to the cash flows from the asset expire, or it transfers the rights to receive the contractual cash flows in a transaction in which substantially all risks and rewards of ownership of the financial asset are transferred. Any interest in such derecognised financial asset that is created or retained by the Group is reported as a separate asset or liability.
Financial liabilitiesThe Group derecognises a financial liability when its contractual obligations are discharged, cancelled or expire. The Group also derecognises a financial liability when its terms are modified and the cash flows of the modified liability are substantially different, in which case a new financial liability based on the modified terms is recognised at fair value.
130
Sou
th32
Ann
ual R
epor
t 20
21Fi
nanc
ial R
epor
t

19. Financial assets and financial liabilities continued(b) Accounting classification and fair value continuedThe following table presents the financial assets and liabilities by class at their carrying amounts which approximates their fair value:
30 June 2021
US$M Note Held at FVTPLDesignated
as FVOCIAmortised
cost
Financial guarantee contracts Total
Financial assets Cash and cash equivalents 16 - - 1,613 - 1,613Trade and other receivables(1) 9 120 - 365 - 485Loans to equity accounted investments 9 - - 10 - 10Other financial assets:
Derivative contracts 9 - - - 9Other investments – held at FVTPL(2) 6 - - - 6
Total current financial assets 135 - 1,988 - 2,123Trade and other receivables(1) 9 - - 10 - 10Loans to equity accounted investments 9 - - 187 - 187Other financial assets:
Investments in equity instruments – designated as FVOCI - 121 - - 121
Total non-current financial assets - 121 197 - 318Total financial assets 135 121 2,185 - 2,441Financial liabilitiesTrade and other payables(3) 14 18 - 734 15 767Lease liabilities 17 - - 37 - 37Unsecured other 17 - - 371 - 371Other financial liabilities:
Derivative contracts 11 - - - 11Total current financial liabilities 29 - 1,142 15 1,186Trade and other payables 14 - - 2 - 2Lease liabilities 17 - - 650 - 650Unsecured other 17 - - 149 - 149Total non-current financial liabilities - - 801 - 801Total financial liabilities 29 - 1,943 15 1,987
(1) Excludes current input taxes of US$32 million and non-current input and other taxes of US$62 million included in other receivables. Refer to note 9 Trade and other receivables.(2) Other investments - held at FVTPL include US$6 million which is restricted by legal or contractual arrangements.(3) Excludes current input taxes of US$10 million included in other creditors. Refer to note 14 Trade and other payables.
131S
outh32 Annual R
eport 2021
Financial Rep
ort

Notes to financial statements – Capital structure and financing continued
19. Financial assets and financial liabilities continued(b) Accounting classification and fair value continued30 June 2020
US$M Note Held at FVTPLDesignated as
FVOCI Amortised cost Total
Financial assets Cash and cash equivalents 16 - - 1,315 1,315Trade and other receivables(1) 9 80 - 393 473Loans to equity accounted investments 9 - - 15 15Other financial assets:
Derivative contracts 19 - - 19Total current financial assets 99 - 1,723 1,822Trade and other receivables(1)(2) 9 - - 6 6Loans to equity accounted investments 9 - - 177 177Interest bearing loans receivable from joint operations 9 - - 26 26Other financial assets:
Investments in equity instruments – designated as FVOCI - 59 - 59Other investments – held at FVTPL 113 - - 113
Total non-current financial assets 113 59 209 381Total financial assets 212 59 1,932 2,203Financial liabilitiesTrade and other payables(3) 14 - - 621 621Lease liabilities 17 - - 42 42Unsecured other 17 - - 313 313Other financial liabilities:
Derivative contracts 1 - - 1Total current financial liabilities 1 - 976 977Trade and other payables 14 - - 3 3Lease liabilities 17 - - 609 609Unsecured other 17 - - 53 53Total non-current financial liabilities - - 665 665Total financial liabilities 1 - 1,641 1,642
(1) Excludes current input taxes of US$43 million and non-current input taxes of US$33 million included in other receivables. Refer to note 9 Trade and other receivables.(2) Excludes a reimbursable right asset in relation to the closure and rehabilitation provision at SAEC of US$61 million included in other receivables. Refer to note 9 Trade and other
receivables.(3) Excludes input taxes of US$6 million included in other creditors. Refer to note 14 Trade and other payables.
Measurement of fair valueThe following table shows the Group’s financial assets and liabilities carried at fair value with reference to the nature of valuation inputs used:
Level 1 Valuation is based on unadjusted quoted prices in active markets for identical financial assets and liabilities.
Level 2 Valuation is based on inputs (other than quoted prices included in Level 1) that are observable for the financial asset or liability, either directly (i.e. as unquoted prices) or indirectly (i.e. derived from prices).
Level 3 Valuation includes inputs that are not based on observable market data.
30 June 2021
US$M Level 1 Level 2 Level 3 Total
Financial assets and liabilitiesTrade and other receivables - 120 - 120Trade and other payables - (4) (14) (18)Derivative contract assets 9 - - 9Derivative contract liabilities (11) - - (11)Investments in equity instruments – designated as FVOCI 55 - 66 121Other investments – held at FVTPL - 6 - 6Total 53 122 52 227
30 June 2020
US$M Level 1 Level 2 Level 3 Total
Financial assets and liabilitiesTrade and other receivables - 80 - 80Derivative contract assets 11 - 8 19Derivative contract liabilities (1) - - (1)Investments in equity instruments – designated as FVOCI 32 - 27 59Other investments – held at FVTPL - 113 - 113Total 42 193 35 270
132
Sou
th32
Ann
ual R
epor
t 20
21Fi
nanc
ial R
epor
t

19. Financial assets and financial liabilities continued(b) Accounting classification and fair value continuedLevel 3 financial assets and liabilities The following table shows the movements in the Group’s Level 3 financial assets and liabilities:
US$M FY21 FY20
At the beginning of the financial year 35 189Addition of financial assets/(liabilities) (14) -Realised gains/(losses) recognised in the Consolidated Income Statement(1) (8) (120)Unrealised gains/(losses) recognised in the Consolidated Income Statement(1) - 15Unrealised gains/(losses) recognised in the Consolidated Statement of Comprehensive Income(2) 39 (49)At the end of the financial year 52 35
(1) Recognised in expenses excluding net finance costs in the Consolidated Income Statement.(2) Recognised in the financial assets reserve in the Consolidated Statement of Comprehensive Income.
Sensitivity analysisThe carrying amount of financial assets and liabilities that are valued using inputs other than observable market data are calculated using appropriate valuation models, including discounted cash flow modelling, with inputs such as commodity prices, foreign exchange rates and inflation. The potential effect of using reasonably possible alternative assumptions in these models, based on changes in the most significant inputs by 10 per cent while holding all other variables constant, is shown in the following table:
Profit/(loss) after taxOther comprehensive income,
net of tax30 June 2021
US$MCarrying amount Significant inputs
10% increase in input
10% decrease in input
10% increase in input
10% decrease in input
Financial assets and liabilitiesInvestments in equity instruments – designated as FVOCI(1)
66
Alumina price(2)
Aluminium price(2)
Foreign exchange rate(2) - - 35 (39)Trade and other payables(1)
(14)Coal price(3)
Export volumes(3) 12 (8) - -Total 52 12 (8) 35 (39)
(1) Sensitivity analysis is performed assuming all inputs are directionally moving unfavourably and favourably.(2) Aluminium and alumina prices are comparable to market consensus forecasts and foreign exchange rates are aligned with forward market rates.(3) Coal prices are comparable to market consensus forecasts and export volumes are based on future production estimates.
Profit/(loss) after taxOther comprehensive income,
net of tax30 June 2020
US$MCarrying amount Significant inputs
10% increase in input
10% decrease in input
10% increase in input
10% decrease in input
Financial assets and liabilitiesDerivative contracts
8
Aluminium price Foreign exchange rate
Electricity price (3) 3 - -Investments in equity instruments – designated as FVOCI
27
Alumina priceAluminium price
Foreign exchange rate - - 34 (37)Total 35 (3) 3 34 (37)
(c) Capital management The Group allocates capital in line with its strategy and capital management framework. The Group’s priorities for cash flow are to:
– Maintain safe and reliable operations and an investment grade credit rating through the cycle;
– Distribute a minimum of 40 per cent of Underlying earnings as dividends to shareholders following each six month reporting period; and
– Maximise total shareholder returns through other alternatives including special dividends, share buy-backs and high return investment opportunities which compete for capital.
133S
outh32 Annual R
eport 2021
Financial Rep
ort

20. Share capital
FY21 FY20
Shares US$M Shares US$M
Share capitalAt the beginning of the financial year 4,846,267,883 13,943 5,005,503,575 14,212Shares bought back and cancelled (171,729,870) (346) (159,235,692) (269)At the end of the financial year 4,674,538,013 13,597 4,846,267,883 13,943Treasury sharesAt the beginning of the financial year (22,495,193) (49) (40,483,171) (105)Sale/(purchase) of shares by ESOP Trusts 262,531 3 (13,118,707) (23)Employee share awards vested 10,556,477 24 31,106,685 79At the end of the financial year (11,676,185) (22) (22,495,193) (49)
Shares entitle the holder to participate in dividends and the proceeds on winding up of the Group in proportion to the number of shares held. On a show of hands every holder of shares present at a meeting in person or by proxy, is entitled to one vote, and upon a poll each share is entitled to one vote.
Incremental costs directly attributable to the issue of shares, net of any income tax effects, are recognised as a deduction from equity.
Notes to financial statements – Capital structure and financing continued
134
Sou
th32
Ann
ual R
epor
t 20
21Fi
nanc
ial R
epor
t

Notes to financial statements – Other notes
21. Auditor’s remunerationThe auditor of the Group is KPMG.
US$’000 FY21 FY20
Fees payable to the Group’s auditor for assurance services Audit and review of financial statements 4,452 4,116Other assurance services(1) 550 580Total auditor’s remuneration 5,002 4,696
(1) Mainly comprises assurance in respect of the Group’s sustainability reporting.
22. Pension and other post-retirement obligationsThe Group operates or participates in a number of pension (including superannuation) schemes throughout the world. The funding of the schemes complies with local regulations. The assets of the schemes are generally held separately from those of the Group and are administered by trustees or management boards. Post the divestment of SAEC, the Group continues to operate one post-retirement medical scheme in South Africa. Full actuarial valuations are prepared for the schemes.
Defined contribution pension schemes The Group contributed US$76 million (FY20: US$73 million) to defined contribution plans and multi-employer defined contribution plans. These contributions are expensed as incurred.
Defined benefit pension schemes (closed schemes)At 30 June 2021 the Group had defined benefit obligations of US$68 million (FY20: US$67 million) and defined benefit scheme assets with a fair value of US$54 million (FY20: US$61 million) with a net liability recognised in the Consolidated Balance Sheet of US$14 million (FY20: US$6 million).
The fair value of scheme assets by major asset class is as follows:
Fair valueAsset class
US$M FY21 FY20
Bonds(1) 38 39Equities 6 7Cash and cash equivalents 4 8Other(2) 6 7Total 54 61
(1) Comprises Fixed Interest Government bonds of US$9 million (FY20: US$8 million), Index Linked Government bonds of US$22 million (FY20: US$21 million) and Corporate bonds of US$7 million (FY20: US$10 million).
(2) Primarily comprises of property and alternative investments in Australia.
Defined benefit post-retirement medical schemes (closed schemes)At 30 June 2021 the Group had post-retirement medical scheme obligations of US$27 million (FY20: US$71 million). The post-retirement medical scheme is unfunded.
Weighted average maturity profile of schemes The weighted average duration of the defined benefit obligations are 9 years (FY20: 9 years) and 10 years (FY20: 11 years) for the defined benefit pension schemes and post-retirement medical scheme respectively.
Risks associated with defined benefit pension and post-retirement medical schemes The Group’s defined benefit pension and post-retirement medical schemes expose the Group to the risks pertaining to asset value volatility, uncertainty in future benefit payments and uncertainty in future contribution requirements.
135S
outh32 Annual R
eport 2021
Financial Rep
ort

Notes to financial statements – Other notes continued
23. Employee share ownership plansAt 30 June 2021 the Group had the following employee share ownership arrangements:
Awards granted to Lead Team members(1)
Long-Term Incentive Plan FY18, FY19, FY20, FY21Deferred Short-Term Incentive Plan FY19, FY20Executive Transitional Award Plan FY19, FY20, FY21Management Share Plan FY21
(1) Awards granted on 13 December 2017, 7 December 2018, 6 December 2019 and 4 December 2020.
Awards granted to eligible employees(1)
Management Share Plan FY18, FY19, FY20, FY21AllShare Plan 2018, 2019, 2020Management Transitional Award Plan FY18, FY19, FY20
(1) Awards granted on 13 November 2017, 7 May 2018, 7 December 2018, 17 May 2019, 6 December 2019, 15 May 2020, 4 December 2020, 7 December 2020 and 6 May 2021.
All awards take the form of rights to receive one share in South32 Limited for each right granted, subject to performance and/or service conditions being met. A portion of the 2018, 2019 and 2020 AllShare Plan awards (participants located in Colombia and Mozambique) take the form of rights to receive a cash payment equivalent to the value of South32 Limited shares at the time of payment. Employees in Africa are granted rights on the JSE and all other employees are granted rights on the ASX.
Performance conditions are based on the Group’s Total Shareholder Return (TSR) measured separately against two comparator indices over the performance period as follows:
– One third of performance rights are measured against the Morgan Stanley Capital International (MSCI) World Index; and
– Two thirds of performance rights are measured against the IHS Markit Global Mining Index.
Performance rights vest when the Group’s TSR equals or outperforms the comparator index. Full vesting of performance rights occur if the Group’s TSR outperforms both indices by at least 23.9 per cent (5.5 per cent per annum cumulative) over four years. To the extent that the performance conditions are not met, awards lapse and no retesting is performed.
Awards do not confer any dividend or voting rights until they convert into shares at vesting. In addition, the awards do not confer any rights to participate in a share issue, however, there is discretion under the plans to adjust the awards in response to a variation in South32 Limited’s share capital.
The AllShare JSE plan is eligible to receive a payment equal to the dividend amount that would have been earned on the underlying shares awarded to those participants (Dividend Equivalent Payment). The Dividend Equivalent Payment is made to participants once the underlying shares are issued or transferred to them. No Dividend Equivalent Payment is made in respect of awards that have lapsed or have been forfeited. No other awards are eligible for a Dividend Equivalent Payment.
(a) Description of share-based payment arrangements(i) Recurring share-based payment plansThe awards listed below are subject to the general conditions noted above and may be granted annually subject to approval by shareholders at the annual general meeting for awards to the CEO and by the Board of Directors for all other awards.
FY18, FY19, FY20 and FY21 Long-Term Incentive Plan
The Long-Term Incentive Plan is the Group’s long-term incentive plan for Lead Team members. During the year Jason Economidis, as acting Chief Operating Officer, participated in the Management Share Plan and not the Long-Term Incentive Plan.
Awards have a four year performance period from 1 July 2017 to 30 June 2021, 1 July 2018 to 30 June 2022, 1 July 2019 to 30 June 2023 and 1 July 2020 to 30 June 2024, respectively.
The FY21 Long-Term Incentive Plan award granted to the CEO is subject to a specific vesting cap imposed by the Board of Directors. For other Lead Team members, the Board of Directors retains the discretion to apply a vesting cap to limit the value of the rights which may vest in the ordinary course.
FY19 and FY20 Deferred Short-Term Incentive Plan
The Deferred Short-Term Incentive Plan is the Group’s short-term incentive plan for Lead Team members including Jason Economidis. FY19 and FY20 Deferred Short-Term Incentive Plan Awards vest in August 2021 and August 2022 respectively, provided participants remain employed by the Group.
FY18, FY19, FY20 and FY21 Management Share Plan
The FY18, FY19, FY20 and FY21 Management Share Plan is the Group’s long-term incentive plan for eligible employees below the Lead Team. The Management Share Plan comprises two elements:
– Retention rights vesting in August 2021, August 2022 and August 2023 provided participants remain employed by the Group; and
– Performance rights vesting in August 2021, August 2022, August 2023 and August 2024 subject to performance conditions.
For the FY21 Management Share Plan awards, the Board of Directors retains the discretion to apply a vesting cap to limit the value of the rights which may vest in the ordinary course.
136
Sou
th32
Ann
ual R
epor
t 20
21Fi
nanc
ial R
epor
t

23. Employee share ownership plans continued(a) Description of share-based payment arrangements continued(i) Recurring share-based payment plans continued
2018, 2019 and 2020 AllShare Plan
The 2018, 2019 and 2020 AllShare Plan is the Group’s employee share plan for employees not eligible to participate in the other employee share plans. Awards to the value of at least US$1,250 per employee are granted annually. Awards will vest provided participants remain employed by the Group. The vesting period depends on the participants’ location at the grant date:
– Participants in Africa: August 2021, August 2022 and August 2023; and
– Participants elsewhere: August 2021 and August 2022.
(ii) Transitional share-based payment plans The awards listed below are subject to the general conditions noted above and are either one-off or will not be granted on an ongoing basis.
FY19, FY20 and FY21 Executive Transitional Award Plan
The FY19, FY20 and FY21 Executive Transitional Award Plan is a one-off grant made to Lead Team members in recognition of their adjustment from the Management Share Plan (three year retention rights and four year performance rights) to the four year plan at the Group. Awards have a three year performance period from 1 July 2018 to 30 June 2021, 1 July 2019 to 30 June 2022 and 1 July 2020 to 30 June 2023, respectively.
FY18, FY19 and FY20 Management Transitional Award Plan
The FY18, FY19 and FY20 Management Transitional Award Plan is a grant made to certain eligible employees to bridge the gap between their total target reward at BHP and their total target reward at the Group. FY20 was the last year in which transition awards were made. The FY18, FY19 and FY20 Management Transitional Award Plan has the same conditions as the FY18, FY19 and FY20 Management Share Plan and comprises both service and performance conditions.
(b) Modifications to share-based payment arrangementsAs a result of the divestment of TEMCO and SAEC, adjustments were made to unvested awards. The Group has amended the service period for the 2018 and 2019 AllShare awards granted to participants impacted by the divestments and accelerated the vesting of all awards. The SAEC employees who participated in the 2018 and 2019 AllShare plans received a cash payment, inclusive of a Dividend Equivalent Payment, based on the share price of the South32 Limited shares they would have received shortly before divestment. For the FY18, FY19 and FY20 Management Share Plans, the retention rights were vested at divestment on a pro-rata basis determined by service between the start and end of the performance period. Performance rights were partially lapsed at divestment on a pro-rata basis determined by service not performed between the start and end of the performance period. The remaining rights on foot are to be performance tested against TSR metrics at the end of the relevant performance period.
(c) Employee Share Ownership Plan TrustsThe South32 Limited Employee Incentive Plans Trust (the Australian Trust) and the South32 South African AllShare Trust (the South African Trust) are discretionary trusts for the benefit of employees of South32 Limited and its subsidiaries.
The trustee for the Australian Trust (CPU Share Plans Pty Ltd) is an independent company, resident in Australia. The trustees for the South African Trust are made up of employer and employee representatives per the B-BBEE requirements under South African law. The Trusts use funds provided by South32 Limited and/or its subsidiaries to acquire shares to enable awards to be made or satisfied under the Group employee share ownership plans.
The shares may be acquired by purchase in the market or by subscription at not less than nominal value.
(d) Measurement of fair valuesThe fair value at grant date of equity-settled share awards is charged to the Consolidated Income Statement, net of tax, over the period for which the benefits of employee services are expected to be derived. The corresponding accrued employee entitlement is recorded in the employee share awards reserve.
Where awards are forfeited because non-market based vesting conditions are not satisfied, the expense previously recognised is proportionally reversed. If awards do not vest due to a market performance condition not being met, the expense is recognised in full and the share awards reserve is released to retained earnings. Where awards are waived because the participant voluntarily relinquishes their right to receive shares, any expense not yet recognised for the awards are recognised immediately and the accrued employee entitlement previously recognised in the employee share awards reserve is released to retained earnings. Where shares in South32 Limited are acquired by on-market purchases prior to settling the vested entitlement, the cost of the acquired shares is carried as treasury shares and deducted from equity. Where awards are satisfied by delivery of acquired shares, any difference between their acquisition cost and the cumulative remuneration expense recognised is charged directly to retained earnings, net of tax.
137S
outh32 Annual R
eport 2021
Financial Rep
ort

Notes to financial statements – Other notes continued
23. Employee share ownership plans continued(d) Measurement of fair values continuedThe fair value of performance rights is measured using a Monte Carlo methodology. This model considers the following:
– Expected life of the award;
– Current market price of the underlying shares;
– Expected volatility (of the individual company and of each peer group);
– Expected dividends;
– Risk-free interest rate; and
– Market based performance hurdles.
The fair value of retention rights is measured using a Black Scholes methodology. This model considers the following:
– Expected life of the award;
– Current market price of the underlying shares;
– Expected volatility;
– Expected dividends; and
– Risk-free interest rate.
The inputs used in the measurement of the fair values at grant date of the equity-settled share-based payments plans were as follows:
Year ended
30 June 2021
Fair value at grant date
(US$)(1)
Share price at grant date
(US$)
Expected volatility
(%)(2)Expected life
(in years)(1)
Risk-free interest rate based on
government bonds (%)(1)
Recurring plansFY21 Long-Term Incentive Plan(3) 0.88 – 0.97 1.94 35 4 0.25FY20 Deferred Short-Term Incentive Plan(3) 1.76 1.94 35 2 0.07FY21 Management Share Plan - Retention rights(4) 1.69 – 1.74 1.94 – 1.95 35 3 0.16 – 5.17FY21 Management Share Plan - Performance rights(4) 0.97 – 1.01 1.94 – 1.95 35 4 0.25 – 5.772020 AllShare Plan(3) 1.76 – 1.89 1.94 – 1.95 35 2 – 3 0.07 – 5.17Transitional plansFY21 Executive Transitional Award Plan(3) 0.98 1.94 35 3 0.16
(1) Represents the range of grant date fair values, expected life, and risk-free interest rates based on the amount of rights granted on the ASX or the JSE during the year, and the variations in offer terms and grant dates of each plan where applicable. The risk-free interest rate and expected volatility does not materially impact service based awards.
(2) Expected volatility is based on the historical South32 Limited share price volatility at the grant date.(3) Grant date 4 December 2020.(4) Grant date 4 December 2020, 7 December 2020 and 6 May 2021.
Year ended
30 June 2020
Fair value at grant date
(US$)
Share price at grant date
(US$)
Expected volatility
(%)Expected life
(in years)
Risk-free interest rate based on
government bonds (%)
Recurring plansFY20 Long-Term Incentive Plan 0.63 1.73 30 4 0.77FY19 Deferred Short-Term Incentive Plan 1.68 1.73 30 2 0.75FY20 Management Share Plan - Retention rights 1.58 – 1.61 1.73 30 3 0.70 – 7.33FY20 Management Share Plan - Performance rights 0.63 1.73 30 4 0.77 – 7.602019 AllShare Plan 1.68 – 1.76 1.73 30 2 – 3 0.75 – 7.33Transitional plansFY20 Executive Transitional Award Plan 0.58 1.73 30 3 0.70FY20 Management Transitional Award Plan 0.63 – 1.61 1.73 30 3 – 4 0.70 – 7.60
138
Sou
th32
Ann
ual R
epor
t 20
21Fi
nanc
ial R
epor
t

23. Employee share ownership plans continued(e) Reconciliation of outstanding share awardsNone of the awards listed below have an exercise price or are exercisable at 30 June 2021.
Number of Rights
Rights at beginning of
the periodGranted during
the periodVested during
the period
Forfeited during the
period
Cancelled during the
periodRights at end of the period
Recurring plansFY17 Long-Term Incentive Plan 7,845,617 - - - (7,845,617) -FY18 Long-Term Incentive Plan 5,766,758 - - (352,564) - 5,414,194FY19 Long-Term Incentive Plan 4,906,971 - - (581,392) - 4,325,579FY20 Long-Term Incentive Plan 6,365,727 - - (1,098,061) - 5,267,666FY21 Long-Term Incentive Plan - 8,221,730 - - - 8,221,730FY18 Deferred Short-Term Incentive Plan 1,131,116 - (1,131,116) - - -FY19 Deferred Short-Term Incentive Plan 1,519,690 - (448,204) - - 1,071,486FY20 Deferred Short-Term Incentive Plan - 1,124,803 - - - 1,124,803FY17 Management Share Plan - Performance rights 10,168,647 - - - (10,168,647) -FY18 Management Share Plan - Retention rights 2,176,175 - (2,151,118) (25,057) - -FY18 Management Share Plan - Performance rights 6,121,556 - - (295,728) - 5,825,828FY19 Management Share Plan - Retention rights(1) 2,624,957 21,378 (913,157) (310,277) - 1,422,901FY19 Management Share Plan - Performance rights(1) 5,314,766 53,447 - (808,699) - 4,559,514FY20 Management Share Plan - Retention rights(1) 3,023,809 5,091 (657,839) (458,954) - 1,912,107FY20 Management Share Plan - Performance rights(1) 7,156,355 12,728 - (1,480,416) - 5,688,667FY21 Management Share Plan - Retention rights - 3,496,922 (23,182) (109,490) - 3,364,250FY21 Management Share Plan - Performance rights - 8,989,919 - (288,245) - 8,701,6742017 AllShare Plan(1) 3,420,060 1,530 (3,417,000) (4,590) - -2018 AllShare Plan(1) 5,744,650 475 (4,312,525) (119,700) - 1,312,9002019 AllShare Plan(1) 9,548,110 37,895 (3,614,325) (375,375) - 5,596,3052020 AllShare Plan - 7,068,000 (68,800) (216,800) - 6,782,400
Transitional plansFY18 Executive Transitional Award Plan 245,840 - - (245,840) - -FY19 Executive Transitional Award Plan 81,967 - - - - 81,967FY20 Executive Transitional Award Plan 129,283 - - - - 129,283FY21 Executive Transitional Award Plan - 154,702 - - - 154,702FY17 Management Transitional Award Plan 1,644,776 - - - (1,644,776) -FY18 Management Transitional Award Plan 829,372 - (173,637) (33,540) - 622,195FY19 Management Transitional Award Plan 352,603 - (23,158) (44,522) - 284,923FY20 Management Transitional Award Plan 210,299 - (9,211) (57,905) - 143,183FY19 Sign-on Award Plan 257,000 - (257,000) - - -Total awards 86,586,104 29,188,620 (17,200,272) (6,907,155) (19,659,040) 72,008,257
(1) Retrospective grants related to prior year plans.
24. Contingent liabilitiesContingent liabilities not otherwise provided for in the consolidated financial statements are categorised as arising from:
US$M FY21 FY20
Actual or potential litigation 427 409Total contingent liabilities 427 409
Actual or potential litigation primarily relates to numerous tax assessments or matters relating to transactions in prior years in Colombia and Brazil. Additionally, there are a number of legal claims or potential claims against the Group, the outcome of which cannot be foreseen at present, and for which no amounts have been disclosed.
Prior to the Demerger, the Group entered into a Separation Deed with BHP, which deals with matters arising in connection with the Demerger. The Separation Deed principally covers the following key terms: assumption of liabilities, limitations and exclusions from indemnities and claims, contracts, financial support, Demerger costs and litigation. Actual or potential litigation excludes amounts indemnified by BHP, as per the Separation Deed.
The Group has entered into various counter-indemnities of bank and performance guarantees related to its own future performance, which are in the normal course of business. Additionally, the Group has provided indemnities against certain liabilities as part of agreements for the disposal of business operations. Having taken appropriate legal advice, the Group believes that a material liability arising from the indemnities provided is remote.
139S
outh32 Annual R
eport 2021
Financial Rep
ort
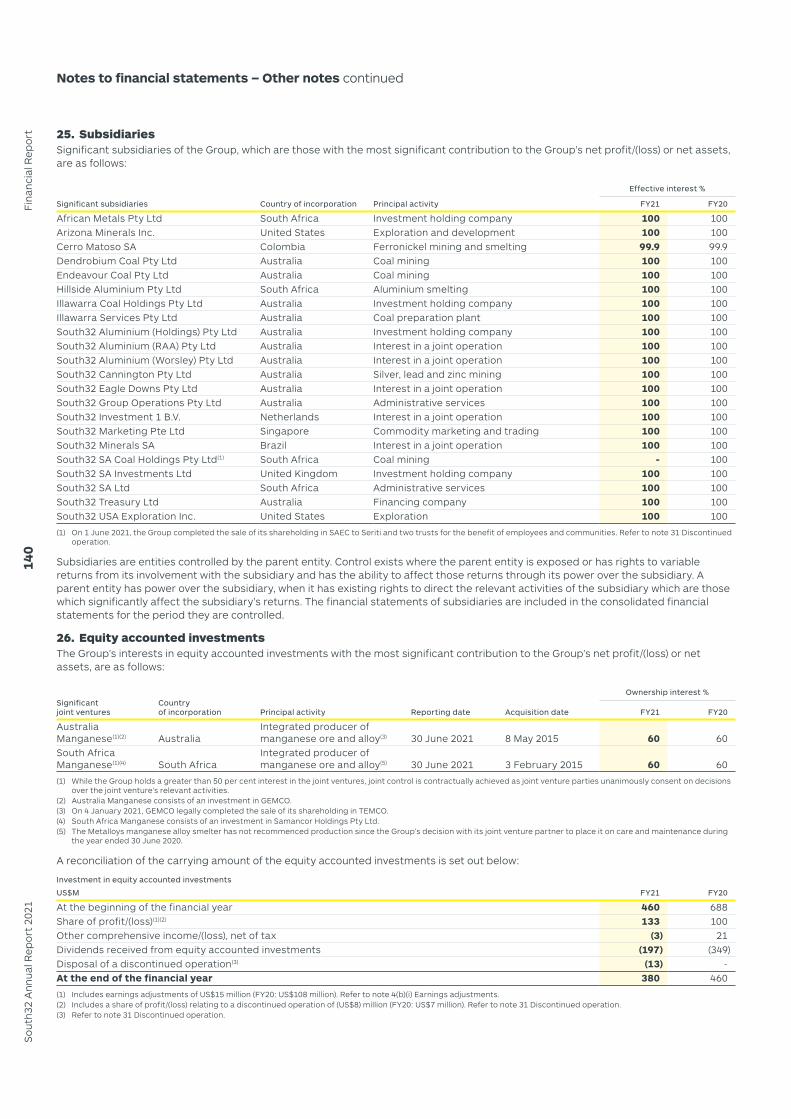
Notes to financial statements – Other notes continued
25. SubsidiariesSignificant subsidiaries of the Group, which are those with the most significant contribution to the Group’s net profit/(loss) or net assets, are as follows:
Effective interest %
Significant subsidiaries Country of incorporation Principal activity FY21 FY20
African Metals Pty Ltd South Africa Investment holding company 100 100Arizona Minerals Inc. United States Exploration and development 100 100Cerro Matoso SA Colombia Ferronickel mining and smelting 99.9 99.9Dendrobium Coal Pty Ltd Australia Coal mining 100 100Endeavour Coal Pty Ltd Australia Coal mining 100 100Hillside Aluminium Pty Ltd South Africa Aluminium smelting 100 100Illawarra Coal Holdings Pty Ltd Australia Investment holding company 100 100Illawarra Services Pty Ltd Australia Coal preparation plant 100 100South32 Aluminium (Holdings) Pty Ltd Australia Investment holding company 100 100South32 Aluminium (RAA) Pty Ltd Australia Interest in a joint operation 100 100South32 Aluminium (Worsley) Pty Ltd Australia Interest in a joint operation 100 100South32 Cannington Pty Ltd Australia Silver, lead and zinc mining 100 100South32 Eagle Downs Pty Ltd Australia Interest in a joint operation 100 100South32 Group Operations Pty Ltd Australia Administrative services 100 100South32 Investment 1 B.V. Netherlands Interest in a joint operation 100 100South32 Marketing Pte Ltd Singapore Commodity marketing and trading 100 100South32 Minerals SA Brazil Interest in a joint operation 100 100South32 SA Coal Holdings Pty Ltd(1) South Africa Coal mining - 100South32 SA Investments Ltd United Kingdom Investment holding company 100 100South32 SA Ltd South Africa Administrative services 100 100South32 Treasury Ltd Australia Financing company 100 100South32 USA Exploration Inc. United States Exploration 100 100
(1) On 1 June 2021, the Group completed the sale of its shareholding in SAEC to Seriti and two trusts for the benefit of employees and communities. Refer to note 31 Discontinued operation.
Subsidiaries are entities controlled by the parent entity. Control exists where the parent entity is exposed or has rights to variable returns from its involvement with the subsidiary and has the ability to affect those returns through its power over the subsidiary. A parent entity has power over the subsidiary, when it has existing rights to direct the relevant activities of the subsidiary which are those which significantly affect the subsidiary’s returns. The financial statements of subsidiaries are included in the consolidated financial statements for the period they are controlled.
26. Equity accounted investmentsThe Group’s interests in equity accounted investments with the most significant contribution to the Group’s net profit/(loss) or net assets, are as follows:
Ownership interest %Significant joint ventures
Country of incorporation Principal activity Reporting date Acquisition date FY21 FY20
Australia Manganese(1)(2) Australia
Integrated producer of manganese ore and alloy(3) 30 June 2021 8 May 2015 60 60
South Africa Manganese(1)(4) South Africa
Integrated producer of manganese ore and alloy(5) 30 June 2021 3 February 2015 60 60
(1) While the Group holds a greater than 50 per cent interest in the joint ventures, joint control is contractually achieved as joint venture parties unanimously consent on decisions over the joint venture’s relevant activities.
(2) Australia Manganese consists of an investment in GEMCO. (3) On 4 January 2021, GEMCO legally completed the sale of its shareholding in TEMCO.(4) South Africa Manganese consists of an investment in Samancor Holdings Pty Ltd.(5) The Metalloys manganese alloy smelter has not recommenced production since the Group’s decision with its joint venture partner to place it on care and maintenance during
the year ended 30 June 2020.
A reconciliation of the carrying amount of the equity accounted investments is set out below:
Investment in equity accounted investments
US$M FY21 FY20
At the beginning of the financial year 460 688Share of profit/(loss)(1)(2) 133 100Other comprehensive income/(loss), net of tax (3) 21Dividends received from equity accounted investments (197) (349)Disposal of a discontinued operation(3) (13) -At the end of the financial year 380 460
(1) Includes earnings adjustments of US$15 million (FY20: US$108 million). Refer to note 4(b)(i) Earnings adjustments. (2) Includes a share of profit/(loss) relating to a discontinued operation of (US$8) million (FY20: US$7 million). Refer to note 31 Discontinued operation.(3) Refer to note 31 Discontinued operation.
140
Sou
th32
Ann
ual R
epor
t 20
21Fi
nanc
ial R
epor
t

26. Equity accounted investments continuedCarrying amount of equity accounted investments
US$M FY21 FY20
Australia Manganese and South Africa Manganese 295 350Individually immaterial(1) 85 110Total 380 460
(1) Individually immaterial consists of investments in Samancor Marketing Pte Ltd (60 per cent) and Port Kembla Coal Terminal Ltd (16.7 per cent).
Share of profit/(loss) of equity accounted investments
US$M FY21 FY20
Australia Manganese and South Africa Manganese 135 88Individually immaterial(1) (2) 12Total 133 100
(1) Individually immaterial consists of investments in Samancor Marketing Pte Ltd (60 per cent), Richards Bay Coal Terminal Pty Ltd (21.1 per cent) and Port Kembla Coal Terminal Ltd (16.7 per cent). The share of profit/(loss) from Richards Bay Coal Terminal Pty Ltd (US$8) million (FY20: US$7 million) was included in the disposal of a discontinued operation. Refer to note 31 Discontinued operation.
The following table summarises the financial information relating to each significant equity accounted investment:
Joint ventures
Australia Manganese
South Africa Manganese(1)
Australia Manganese
South Africa Manganese(1)
US$M FY21 FY20
Reconciliation of carrying amount of equity accounted investments Current assets 271 237 374 287Non-current assets 812 539 750 554Current liabilities (233) (89) (238) (123)Non-current liabilities (673) (277) (661) (264)Net assets – 100% 177 410 225 454Net assets – the Group’s share 106 190 135 218Consolidation adjustments - (1) - (3)Carrying amount of equity accounted investments 106 189 135 215Reconciliation of share of profit/(loss) of equity accounted investmentsRevenue – 100% 1,096 524 1,163 506Profit/(loss) after tax – 100% 192 37 182 (33)Profit/(loss) after tax – the Group’s share 115 20 109 (24)Consolidation adjustments - - 1 2Share of profit/(loss) of equity accounted investments 115 20 110 (22)Other balances of equity accounted investments presented on a 100% basisCash and cash equivalents - 26 - 20Non-current financial liabilities (excluding trade and other payables and provisions) (222) (28) (200) (31)Depreciation and amortisation (133) (26) (117) (39)Interest income - 3 3 20Interest expense (23) (24) (27) (23)Income tax (expense)/benefit (excluding royalty related tax) (179) (8) (157) (6)
(1) South Africa Manganese includes a 60 per cent interest in Samancor Manganese Pty Ltd and 54.6 per cent interest in Hotazel Manganese Mines Pty Ltd.
The Group’s share of contingent liabilities and capital expenditure commitments of significant equity accounted investments as at 30 June 2021 was US$6 million (FY20: US$2 million) and US$18 million (FY20: US$29 million) respectively.
The Group uses the term ‘equity accounted investments’ to refer to associates and joint ventures collectively.
Associates are entities in which the Group holds significant influence. If the Group holds 20 per cent or more of the voting power of an entity, it is presumed that the Group has significant influence, unless it can be clearly demonstrated that this is not the case. Significant influence can also arise when the Group has less than 20 per cent of the voting power but it can be demonstrated that the Group has the power to participate in the financial and operating policy decisions of the associate. Investments in associates are accounted for using the equity method.
Joint ventures are joint arrangements in which the parties with joint control of the arrangement have rights to the net assets of the arrangement. Joint arrangements exist when two or more parties have joint control. Joint control is the contractually agreed sharing of control of an arrangement, which exists only when decisions about the relevant activities require the unanimous consent of the parties sharing control. A separate vehicle, not the parties, will have the rights to the assets and obligations to the liabilities, relating to the arrangement. If more than an insignificant share of output from a joint venture is sold to third parties, this indicates that the joint venture is not dependent on the parties to the arrangement for funding and that the parties to the arrangement have no obligation for the liabilities of the arrangement. Joint ventures are accounted for using the equity method.
141S
outh32 Annual R
eport 2021
Financial Rep
ort

Notes to financial statements – Other notes continued
26. Equity accounted investments continuedEquity accounted investments are initially recorded at cost, including the value of any goodwill on acquisition. In subsequent periods, the carrying amount of the investment is adjusted to reflect the share of post-acquisition profit or loss and other comprehensive income. After application of the equity method, including recognising the Group’s share of the joint ventures’ results, the value of the investment will be assessed for impairment if there is objective evidence that an impairment of the investment may have occurred. Where the carrying value of an equity accounted investment is reduced to nil after having applied equity accounting principles (and the Group has no legal or constructive obligation to make further payments, nor has made payments on behalf of the associate or joint venture), dividends received from the associate or joint venture will be recognised as a ‘Share of profit/(loss) of equity accounted investments’.
27. Interests in joint operationsSignificant joint operations of the Group, which are those with the most significant contributions to the Group’s net profit/(loss) or net assets, are as follows:
Effective interest %
Significant joint operations Country of operation Principal activity Acquisition date FY21 FY20
Ambler Metals(1) United StatesDevelopment studies, resource drilling and regional exploration 11 February 2020 50 50
Brazil Alumina Brazil Alumina refining 3 July 2014 36 36Eagle Downs Metallurgical Coal Australia
Metallurgical coal exploration and development option 14 September 2018 50 50
Mozal Aluminium(1) Mozambique Aluminium smelting 27 March 2015 47.1 47.1Worsley Alumina(2) Australia Bauxite mining and alumina refining 8 May 2015 86 86
(1) This joint arrangement is an incorporated entity. It is classified as a joint operation as the participants are entitled to receive output, not dividends, from the arrangement.(2) While the Group holds a greater than 50 per cent interest in Worsley Alumina, participants jointly approve certain matters and are entitled to receive their share of output from
the arrangement.
Joint operations are joint arrangements in which the parties with joint control have rights to the assets and obligations for the liabilities relating to the arrangement. The activities of a joint operation are primarily designed for the provision of output to the parties to the arrangement, indicating that:
– The parties have the rights to substantially all the output and economic benefits of the assets of the arrangement; and
– All liabilities are satisfied by the joint participants through their purchases of that output. This indicates that, in substance, the joint participants have an obligation for the liabilities of the arrangement.
The consolidated financial statements of the Group include its share of the assets and liabilities, revenues and expenses arising jointly or otherwise from those operations and its revenue derived from the sale of its share of the output from the joint operation. All such amounts are measured in accordance with the terms of each arrangement, which are usually in proportion to the Group’s interest in the joint operation.
The assets in these joint operations are restricted to the extent that they are only available to be used by the joint operation itself and not by other operations of the Group. For certain joint operations, the Group has also either pledged, mortgaged or provided a cross charge to joint operation partners over assets within the joint operation.
28. Key management personnel(a) Key management personnel compensationUS$’000 FY21 FY20
Short-term employee benefits 6,942 5,759Post-employment benefits 182 192Other long-term benefits 286 268Termination benefits - 316Share-based payments 4,611 6,664Total 12,021 13,199
(b) Transactions with key management personnelThere were no transactions with key management personnel during the year ended 30 June 2021 (FY20: US$nil).
(c) Loans to key management personnelOn 22 June 2021, the Group made an interest free loan of US$620 thousand to Mike Fraser in relation to his South African income tax payable on his Group remuneration. As at 30 June 2021, the full loan remains outstanding and there is no maturity date for this loan. There are no other loans with any key management personnel (FY20: US$nil). Refer to the Remuneration report for further details.
(d) Transactions with key management personnel related entitiesThere were no transactions with entities controlled or jointly controlled by key management personnel and there were no outstanding amounts with those entities as at 30 June 2021 (FY20: US$nil).
142
Sou
th32
Ann
ual R
epor
t 20
21Fi
nanc
ial R
epor
t

29. Related party transactions(a) Parent entityThe ultimate parent entity of the Group is South32 Limited, which is domiciled and incorporated in Australia.
(b) Subsidiaries, joint ventures and associates The interests in subsidiaries, joint ventures and associates are disclosed in notes 25 to 26.
(c) Key management personnel The compensation of, and loans to, key management personnel are disclosed in note 28.
(d) Pension and other post-retirement obligations The pension and other post-retirement obligations are disclosed in note 22.
(e) Transactions with related parties Transactions with related parties
Joint ventures Associates
US$’000 FY21 FY20 FY21 FY20
Sales of goods and services 239,670 205,880 4,148 3,126Purchases of goods and services 2 - 51,489 80,887Interest income 4,912 7,814 - 197Dividend income 197,164 348,664 - -Interest expense 1,816 7,593 - -Increase/(decrease) in short-term financing arrangements with related parties 1,000 (14,855) - -Increase/(decrease) in loans with related parties 10,800 35,965 (5,759) (15,864)
Outstanding balances with related parties Joint ventures Associates
US$’000 FY21 FY20 FY21 FY20
Trade amounts owing to related parties 206 549 176 161Other amounts owing to related parties(1) 285,000 284,000 - -Trade amounts owing from related parties 31,539 57,901 318 422Loan amounts owing from related parties(2)(3) 130,800 120,000 66,656 72,415
(1) Other amounts owing to joint ventures relate to short-term deposits and cash managed by the Group on behalf of its equity accounted investments. Interest is paid based on the three month London Inter-Bank Offer Rate less a margin of 0.125 per cent and the one month Johannesburg Inter-Bank Agreed Rate.
(2) Loan amounts owing from joint ventures include an interest bearing loan to GEMCO which is repayable by 2 January 2024. Interest is paid based on the three month London Inter-Bank Offer Rate plus a margin of 3 per cent.
(3) Loan amounts owing from associates include an interest free loan to Port Kembla Coal Terminal Ltd which is repayable by 30 June 2030.
Terms and conditions Sales to, and purchases from, related parties are transactions at market prices and on commercial terms.
Outstanding balances at year end are unsecured and settlement mostly occurs in cash.
No guarantees are provided or received for any related party receivables or payables.
No expense has been recognised in respect of expected credit losses from related parties in FY21.
143
South32 A
nnual Rep
ort 2021Financial R
eport

30. Parent entity information(a) Summary financial informationThe individual financial statements for the parent entity, South32 Limited, show the following aggregate amounts:
US$M FY21 FY20
Result of parent entity Profit/(loss) after tax for the year (818) 514Total comprehensive income (818) 514Financial position of parent entity at year endCurrent assets 30 47Total assets 10,825 11,579Current liabilities 1,003 483Total liabilities 1,014 500Net assets 9,811 11,079Total equity of the parent entityShare capital 13,597 13,943Treasury shares (17) (34)Other reserves 28 58Profit reserve(1) 1,604 1,719Retained earnings/(accumulated losses) (5,401) (4,607)Total equity 9,811 11,079
(1) Prior year profits, net of dividends paid, have been appropriated to a profit reserve for future dividend payments.
(b) Parent company guaranteesThe parent entity has guaranteed a US commercial paper program. The parent entity has also guaranteed a Group revolving credit facility of US$1,450 million, which backs the US commercial paper program and remains undrawn as at 30 June 2021. This facility was extended in July 2020 by one year and expires in February 2023.
The parent entity is party to a Deed of Support with the effect that the Company guarantees debts in respect of South32 Group Operations Pty Ltd.
31. Discontinued operationA discontinued operation is a component of the Group’s business that represents a separate major line of business or geographical area of operations that has been disposed of or is held for sale. Classification as a discontinued operation occurs upon disposal or when the operation meets the criteria to be classified as held for sale, if earlier. When an operation is classified as discontinued, the comparative income statement is restated as if the operation had been discontinued from the start of the comparative period.
South Africa Energy CoalDuring the 2018 financial year, the Group established SAEC as a standalone business and managed it separately from the rest of the Group with tailored functional support, systems and governance processes. On 6 November 2019, the Group announced a binding conditional agreement for the sale of its shareholding in SAEC to a wholly-owned subsidiary of Seriti and two trusts which will acquire and hold equity on behalf of employees and communities.
The transaction was subject to a number of material conditions which precluded the classification of SAEC as held for sale until the conditions were satisfied on 15 May 2021. On 1 June 2021, the Group completed the sale of its shareholding in SAEC to Seriti and two trusts for the benefit of employees and communities.
The discontinued operation represents the entire SAEC operating segment which consists of: the Khutala colliery, an underground bord and pillar mining operation; the Klipspruit colliery, a single dragline multi seam open-cut mine that is combined with a truck and shovel mini pit; the Wolvekrans Middelburg Complex (WMC); and other SAEC corporate assets. The WMC consists of the Ifalethu and Wolvekrans collieries, which are open-cut mines with a number of active pits and are mined using draglines combined with truck and shovel operations.
Notes to financial statements – Other notes continued
144
Sou
th32
Ann
ual R
epor
t 20
21Fi
nanc
ial R
epor
t

31. Discontinued operation continued(a) Results of the discontinued operationUS$M FY21 FY20
RevenueGroup production 735 822Third party products and services 126 243
861 1,065Other income 58 75Expenses excluding net finance costs (1,049) (1,324)Loss on disposal of the discontinued operation (159) -Share of profit/(loss) of equity accounted investments (8) 7Profit/(loss) from the discontinued operation (297) (177)Finance expenses (52) (54)Finance income 9 9Net finance costs (43) (45)Profit/(loss) before tax from the discontinued operation (340) (222)Income tax (expense)/benefit 3 (1)Profit/(loss) after tax from the discontinued operation (337) (223)
Other comprehensive income:Gains/(losses) on pension and medical schemes - 3Income tax (expense)/benefit recognised within other comprehensive income - (1)Total other comprehensive income/(loss) from the discontinued operation attributable to the equity holders of South32 Limited (337) (221)
Basic EPS (cents) (7.1) (4.5)Diluted EPS (cents) (7.1) (4.5)
(b) Cash flows from the discontinued operation US$M FY21 FY20
Net cash flows from operating activities (180) (58)Net cash flows from investment activities (149) (176)Net cash flows from financing activities (3) (2)Net decrease in cash and cash equivalents (332) (236)
(c) Effect of disposal on the financial position of the GroupUS$M FY21
Cash and cash equivalents (58)Trade and other receivables (235)Other financial assets (167)Inventories (164)Property, plant and equipment (623)Intangible assets (14)Equity accounted investments (13)Trade and other payables 122Interest bearing liabilities (144)Provisions 1,125Deferred income 1Deferred tax liabilities 23Decrease in net assets (147)
Consideration received, net of transaction costs, satisfied in cash (12)Cash and cash equivalents disposed of (58)Net cash outflow (70)
145S
outh32 Annual R
eport 2021
Financial Rep
ort

31. Discontinued operation continued(c) Effect of disposal on the financial position of the Group continuedThe Group has committed to provide additional support to underpin the sustainability of the SAEC business under the ownership of Seriti. This support includes:
– Providing US$200 million to fund rehabilitation activity at the SAEC operations, by way of 10 annual instalments with the first US$27.5 million payment made in July 2021. The liability is interest free and has been discounted to a net present value of US$176 million based on a market equivalent interest rate. The financial liability is included in Interest bearing liabilities and is measured at amortised cost;
– Entering into a US$50 million facility with a subsidiary of Seriti, that will primarily fund costs to be incurred for the restructure of certain loss-making mining areas. The commitment to provide the facility had a fair value of US$14 million on divestment. The loan commitment is included in Trade and other payables and is classified as FVTPL. The facility was drawn in full by Seriti on 1 July 2021; and
– Providing a guarantee to support Seriti upon entering into a five year working capital facility of up to US$93 million with a South African commercial bank. The commitment to provide the guarantee had a fair value of US$15 million on divestment and includes a risked value assigned to security provided by SAEC. The commitment is included in Trade and other payables and is classified as a financial guarantee contract.
32. Subsequent eventsOn 19 August 2021, the Directors resolved to pay a fully franked final dividend of US 3.5 cents per share (US$164 million) and a fully franked special dividend of US 2.0 cents per share (US$93 million) in respect of the 2021 financial year. The dividends will be paid on 7 October 2021. The dividends have not been provided for in the consolidated financial statements and will be recognised in the 2022 financial year.
On 19 August 2021, the Group also announced an increase to the existing capital management program, announced on 27 March 2017, of US$120 million to a total of US$2.0 billion. This leaves US$252 million expected to be returned by 2 September 2022.
No other matters or circumstances have arisen since the end of the financial year that have significantly affected, or may significantly affect, the operations, results of operations or state of affairs of the Group in subsequent accounting periods.
Notes to financial statements – Other notes continued
146
Sou
th32
Ann
ual R
epor
t 20
21Fi
nanc
ial R
epor
t

In accordance with a resolution of the Directors of the Company, we state that:
1. In the opinion of the Directors:
(a) The consolidated financial statements and notes that are set out on pages 95 to 146 of the Annual Report are in accordance with the Corporations Act, including:
(i) Giving a true and fair view of the Group’s financial position as at 30 June 2021 and of its performance for the year ended on that date; and
(ii) Complying with Australian Accounting Standards and Corporations Regulations 2001.
(b) There are reasonable grounds to believe that the Company will be able to pay its debts as and when they become due and payable.
2. The Directors have been given the declarations required by Section 295A of the Corporations Act from the Chief Executive Officer and Chief Financial Officer for the financial year ended 30 June 2021.
3. The Directors draw attention to note 2 to the financial statements on page 100, which includes a statement of compliance with International Financial Reporting Standards.
Signed in accordance with a resolution of the Board of Directors.
Karen Wood Chair
Graham Kerr Chief Executive Officer and Managing Director
Dated 2 September 2021
Directors’ declaration
147S
outh32 Annual R
eport 2021
Financial Rep
ort

KPMG, an Australian partnership and a member firm of the KPMG global organisation of independent member firms affiliated with KPMG International Limited, a private English company limited by guarantee. All rights reserved. The KPMG name and logo are trademarks used under license by the independent member firms of the KPMG global organisation. Liability limited by a scheme approved under Professional Standards Legislation.
Lead Auditor’s Independence Declaration under Section 307C of the Corporations Act 2001
To the Directors of South32 Limited
I declare that, to the best of my knowledge and belief, in relation to the audit of South32 Limited for the financial year ended 30 June 2021 there have been:
i. no contraventions of the auditor independence requirements as set out in the Corporations Act 2001 in relation to the audit; and
ii. no contraventions of any applicable code of professional conduct in relation to the audit.
KPMG Graham Hogg Partner
Perth 2 September 2021
148
Sou
th32
Ann
ual R
epor
t 20
21Fi
nanc
ial R
epor
t

KPMG, an Australian partnership and a member firm of the KPMG global organisation of independent member firms affiliated with KPMG International Limited, a private English company limited by guarantee. All rights reserved. The KPMG name and logo are trademarks used under license by the independent member firms of the KPMG global organisation. Liability limited by a scheme approved under Professional Standards Legislation.
Independent Auditor’s Report
To the shareholders of South32 Limited
Report on the audit of the Financial Report
Opinion
We have audited the Financial Report of South32 Limited (the Company).
In our opinion, the accompanying Financial Report of the Company is in accordance with the Corporations Act 2001, including:
• giving a true and fair view of the Group’s financial position as at 30 June 2021 and of its financial performance for the year ended on that date; and
• complying with Australian Accounting Standards and the Corporations Regulations 2001.
The Financial Report comprises:
• Consolidated balance sheet as at 30 June 2021• Consolidated income statement, Consolidated statement of
comprehensive income, Consolidated statement of changes in equity and Consolidated cash flow statement for the year then ended
• Notes including a summary of significant accounting policies• Directors’ declaration.
The Group consists of the Company and the entities it controlled at the year-end or from time to time during the financial year.
Basis for opinion
We conducted our audit in accordance with Australian Auditing Standards. We believe that the audit evidence we have obtained is sufficient and appropriate to provide a basis for our opinion.
Our responsibilities under those standards are further described in the Auditor’s responsibilities for the audit of the Financial Report section of our report.
We are independent of the Group in accordance with the Corporations Act 2001 and the ethical requirements of the Accounting Professional and Ethical Standards Board’s APES 110 Code of Ethics for Professional Accountants (including Independence Standards) (the Code) that are relevant to our audit of the Financial Report in Australia. We have fulfilled our other ethical responsibilities in accordance with the Code.
Key Audit Matters
The Key Audit Matters we identified are:
• Asset valuation• Closure and rehabilitation provision• Divestment of South Africa Energy Coal
Key Audit Matters are those matters that, in our professional judgement, were of most significance in our audit of the Financial Report of the current period.
These matters were addressed in the context of our audit of the Financial Report as a whole, and in forming our opinion thereon, and we do not provide a separate opinion on these matters.
149S
outh32 Annual R
eport 2021
Financial Rep
ort

Independent Auditor’s Report
Asset valuation
Refer to Note 13 Impairment of non-financial assets and Note 26 Equity Accounted Investments to the Financial Report. As at 30 June 2021 the Group’s balance sheet includes property, plant and equipment of US$8,938m, intangible assets of US$189m, and equity accounted investments of US$380m, which were assessed for impairment purposes as part of their respective cash generating units (CGUs). The Group recognised US$772m of impairment expense during the year.
The key audit matter How the matter was addressed in our audit
The assessment of the existence of impairment or reversal indicators and impairment testing of CGUs, where required, was a key audit matter given the size of property, plant and equipment, intangible assets and equity accounted investments, and the sensitivity of valuations to certain assumptions.
Following the identification of an impairment indicator and subsequent impairment testing, the Group recognised an impairment in the Illawarra Metallurgical Coal CGU.
Historically the Group has impaired the carrying value of several CGUs to recoverable amount. Combined with the volatility in both commodity and foreign exchange markets, this increases the sensitivity of the carrying value of the Group’s CGUs to potential impairment and reversal.
The Group uses sophisticated models to perform their assessment of impairment or reversal indicators and impairment testing, where required. Our testing included the one CGU which contains goodwill (Hillside Aluminium) and Illawarra Metallurgical Coal for which an impairment indicator was identified. The models are developed in-house, and use life of operation and development plans, approved budgets, and a range of external sources as inputs to the assumptions. Complex modelling using forward-looking assumptions tends to be prone to greater risk for potential bias, error and inconsistent application. These conditions necessitate additional scrutiny by us, in particular to address the objectivity of inputs, and their consistent application.
We focused on the significant forward-looking assumptions the Group applied in their models, including:
• forecast commodity prices and foreign exchange rates – the current economic climate has resulted in significant volatility in forecast commodity prices across the Group. The Group’s models are sensitive to small changes in these price assumptions, as well as changes to foreign exchange rates, particularly the South African Rand and the Australian Dollar, increasing forecasting risk
• forecast operating cash flows, production volumes, capital expenditure and reserve and resource estimates – these are determined by the Group based on historical performance adjusted for expected changes or development plans, including consideration of regulatory approvals. This drives additional audit effort specific to the feasibility of the forecasts and consistency with the Group’s strategy
• discount rates - these are complicated in nature and vary according to the conditions and environment the CGUs are subject to from time to time
• carbon price – the Group incorporates carbon price assumptions in its modelling based on enacted local schemes and assumptions around global longer-term pricing and timing.
The Group uses fair value less cost of disposal models to assess recoverable amount when testing for impairment.
We involved valuation specialists to supplement our senior audit team members in assessing this key audit matter.
Our procedures included:
We assessed management’s view of the indicators leading to impairment testing for Illawarra Metallurgical Coal CGU. We recalculated the impairment charges to the Illawarra Metallurgical Coal CGU and compared to the impairment expense recognised.
We assessed the integrity and consistency of the models used for impairment testing and assessment of impairment or reversal indicators on a sample basis, including the accuracy of the underlying calculation formulas and consistency of modelling to the prior year.
We assessed the scope, objectivity and competence of the Group’s experts responsible for preparation of the resource and reserve estimates and compared these estimates to those incorporated in the life of operation and development plans where applicable.
We compared the forecast operating cash flows, production volumes, capital expenditure and reserve and resource estimates contained in the models to the life of operation and development plans incorporating the approved budgets. We assessed the accuracy of the Group’s previous forecasts to assist with this assessment.
Using our knowledge of the Group and our industry experience, and considering the Group’s strategy and past performance, we assessed the feasibility of the forecast operating cash flows, capital expenditure and production volumes.
Working with our valuation specialists, and considering the risk factors specific to the Group, we compared the discount rates to publicly available market data for comparable entities. We also compared foreign exchange rates to published views of market commentators.
We compared forecast commodity prices to published views of market commentators on future trends and long-term supply agreements.
We compared carbon assumptions to locally enacted country specific schemes and longer term published industry views.
We considered the sensitivity of the models by varying key assumptions, such as forecast commodity prices, foreign exchange rates, carbon pricing and discount rates, within a reasonably possible range, to identify those CGUs at higher risk of impairment or reversal and to focus our further procedures.
We assessed the disclosures in the Financial Report using our understanding obtained from our testing and against the requirements of the accounting standards.
150
Sou
th32
Ann
ual R
epor
t 20
21Fi
nanc
ial R
epor
t

Independent Auditor’s Report
Closure and rehabilitation provision
Refer to Note 15 Provisions to the Financial Report. As at 30 June 2021 the Group’s balance sheet includes current and non-current closure and rehabilitation provisions of US$1,717m.
The key audit matter How the matter was addressed in our audit
Closure and rehabilitation provisioning was a key audit matter due to the size of the provision and the judgement we used to audit the provision estimates across the multiple sites the Group operates.
Closure and rehabilitation activities are governed by Group policies based on legal and regulatory requirements, which differ across multiple jurisdictions.
We focused on the following assumptions the Group applied in determining the provisions in accordance with the closure and rehabilitation plans:
• nature and extent of activities required across the multiple sites, including the magnitude of possible contamination and disturbance, which are inherently challenging to assess
• timing of when closure and rehabilitation will take place, which increases estimation uncertainty given the unique nature of each site and long timeframes involved
• forecast cost estimates incorporating historical experience, which may not be a reliable predictor of such costs, and risk adjustments. The Group engages external experts periodically to assist in their determination of these estimates
• economic assumptions, including country specific discount rates, which are complicated in nature.
Our procedures included:
We assessed the scope, objectivity and competence of the Group’s internal and external experts to provide rehabilitation cost estimates.
We evaluated key assumptions used in the closure and rehabilitation provision, relevant to the jurisdictions of the sites the Group operates, by:
• comparing the nature and extent of activities costed to the Group’s closure and rehabilitation plans and relevant regulatory requirements
• comparing the timing of closure and rehabilitation activities to the Group’s resources and reserve estimates and the expected production profile contained in the life of operation plans
• comparing a sample of cost estimates of the activities, incorporating risk adjustments, to historical experience and underlying documentation, the Group’s external expert estimates, and against our knowledge of the Group and its industry
• working with our sustainability closure specialists to assess the reasonableness and completeness of closure activities on a sample basis
• working with our valuation specialists, comparing country specific discount rate assumptions to market observable data, including risk free rates.
Divestment of South Africa Energy Coal
Refer to Note 31 Discontinued Operation to the Financial Report. The effect of disposal on the financial position of the Group was $147m and a loss after tax from the discontinued operation of $337m has been recognised for the year ended 30 June 2021.
The key audit matter How the matter was addressed in our audit
On 6 November 2019, the Group announced an agreement to divest its shareholding in South32 SA Coal Holdings Proprietary Limited (SAEC) to a whole-owned subsidiary of Seriti Resources Holdings Proprietary Limited (Seriti) and two trusts for the benefit of employees and communities ( jointly referred to as the Purchasers).
Several regulatory and third-party approvals needed to be satisfied prior to completion of the sale. The divestment completed on 1 June 2021 following satisfaction of these approvals.
The financial results of SAEC are presented as discontinued operations in the Financial Report.
As part of the sale agreement the Group has committed to provide additional support to the Purchasers, including:
• US$200 million to fund rehabilitation activity at SAEC operations over a period of time
• US$50m facility to fund restructure costs• Guarantee to a working capital facility of up to US$93m with a
South African commercial bank.The fair value of these financial assets and liabilities were recognised as part of the net assets and liabilities disposed of.
The divestment is considered a key audit matter due to the:
• financial significance of SAEC to the Group• judgement applied by the Group in the identification of the
disposal group and the presentation of its results as discontinued operations including the resulting loss on disposal
• judgement involved in determining the fair value of financial assets and liabilities recognised at the date of disposal. The level of judgement increases where internal models, as opposed to quoted market prices are used to determine fair value of an instrument, or where inputs to the internal models, such as discount rates and probabilities of default loss are not observable.
Our procedures in relation to the divestment of SAEC included:
• Reading the relevant transaction documents to understand the terms and conditions of the divestment
• Checking the consideration paid for the divestment to the transaction documents and underlying financial records
• Obtaining an understanding of the process for identifying net liabilities disposed of. This included walking through the process with the Group’s respective business and finance teams to check our understanding of the approach and procedures adopted
• Using our tax specialists, evaluating the associated tax implications against the requirements of the tax legislation
• Using our valuation specialists, challenging the Group’s valuation models for the Financial assets and liabilities recognised on disposal. We compared the Group’s valuation methodology to industry practice and the criteria in the accounting standards
• Testing key inputs used in valuation models to comparable data in the market, including quoted prices and available alternatives
• Checking the integrity and accuracy of the Group’s loss on sale calculations
• Assessing the discontinued operations treatment and disclosures in the report against the requirements of the accounting standards.
151S
outh32 Annual R
eport 2021
Financial Rep
ort

Independent Auditor’s Report
Other Information
Other Information is financial and non-financial information in South32 Limited’s annual reporting which is provided in addition to the Financial Report and the Auditor's Report. The Directors are responsible for the Other Information.
Our opinion on the Financial Report does not cover the Other Information and, accordingly, we do not express an audit opinion or any form of assurance conclusion thereon, with the exception of the Remuneration Report and our related assurance opinion.
In connection with our audit of the Financial Report, our responsibility is to read the Other Information. In doing so, we consider whether the Other Information is materially inconsistent with the Financial Report or our knowledge obtained in the audit, or otherwise appears to be materially misstated.
We are required to report if we conclude that there is a material misstatement of this Other Information, and based on the work we have performed on the Other Information that we obtained prior to the date of this Auditor’s Report we have nothing to report.
Responsibilities of the Directors for the Financial Report
The Directors are responsible for:
• preparing the Financial Report that gives a true and fair view in accordance with Australian Accounting Standards and the Corporations Act 2001
• implementing necessary internal control to enable the preparation of a Financial Report that gives a true and fair view and is free from material misstatement, whether due to fraud or error
• assessing the Group and Company’s ability to continue as a going concern and whether the use of the going concern basis of accounting is appropriate. This includes disclosing, as applicable, matters related to going concern and using the going concern basis of accounting unless they either intend to liquidate the Group and Company or to cease operations, or have no realistic alternative but to do so.
Auditor’s responsibilities for the audit of the Financial Report
Our objective is:
• to obtain reasonable assurance about whether the Financial Report as a whole is free from material misstatement, whether due to fraud or error; and
• to issue an Auditor’s Report that includes our opinion.
Reasonable assurance is a high level of assurance, but is not a guarantee that an audit conducted in accordance with Australian Auditing Standards will always detect a material misstatement when it exists.
Misstatements can arise from fraud or error. They are considered material if, individually or in the aggregate, they could reasonably be expected to influence the economic decisions of users taken on the basis of the Financial Report.
A further description of our responsibilities for the audit of the Financial Report is located at the Auditing and Assurance Standards Board website at: https://www.auasb.gov.au/admin/file/content102/c3/ar1_2020.pdf. This description forms part of our Auditor’s Report.
Report on the Remuneration Report
OpinionIn our opinion, the Remuneration Report of South32 Limited for the year ended 30 June 2021, complies with Section 300A of the Corporations Act 2001.
Directors’ responsibilitiesThe Directors of the Company are responsible for the preparation and presentation of the Remuneration Report in accordance with Section 300A of the Corporations Act 2001.
Our responsibilitiesWe have audited the Remuneration Report included in pages 73 to 93 of the Directors’ report for the year ended 30 June 2021.
Our responsibility is to express an opinion on the Remuneration Report, based on our audit conducted in accordance with Australian Auditing Standards.
KPMG Graham Hogg Partner
Perth 2 September 2021
152
Sou
th32
Ann
ual R
epor
t 20
21Fi
nanc
ial R
epor
t

Resources and Reserves
As required by Chapter 5 of the ASX Listing Rules, we report Mineral Resources and Ore Reserves (including Coal Resources and Coal Reserves) in accordance with the 2012 Edition of the Australasian Code for Reporting of Exploration Results, Mineral Resources and Ore Reserves (the JORC Code).
In this report, information relating to Mineral Resources and Ore Reserves is based on, and fairly represents, information and supporting documentation prepared by our Competent Persons.
A Competent Person is defined in the JORC Code. They must have a minimum five years of relevant experience in the style of mineralisation or type of deposit under consideration and the activity being undertaken.
Each of our Competent Persons has given consent to the inclusion of the information in this report in the form and context in which it appears. You can find more details on each of their professional affiliations, employer and areas of accountability on page 154. Unless we state otherwise, all Competent Persons listed are full-time employees at South32, or at one of our related entities.
We report Mineral Resources and Ore Reserves in 100 per cent terms and represent estimates as at 30 June 2021. Our Mineral Resource estimations include Measured and Indicated Mineral Resources which, after the application of all Modifying Factors, and development of a mine plan, have been classified as Ore Reserves.
We report all quantities as dry metric tonnes, unless stated otherwise.
It’s important to note that Mineral Resources and Ore Reserves are estimations, not precise calculations. We’ve rounded tonnes and grade information to reflect the relative uncertainty of the estimate, which is why minor computational differences may be present in the totals.
Our long-range forecasts are the basis for the commodity prices and exchange rates used to estimate the economic viability of Ore Reserves. Our planning processes consider the impacts of climate change on our Ore Reserves, including assessments of operating costs and the impact of extreme weather events on the expectation of economic extraction.
Our Ore Reserves are within existing permitted mining tenements. Our mineral leases are of sufficient duration, or convey a legal right to renew the tenure, to enable all Ore Reserves on the leased properties to be mined in accordance with the current production schedules. These Ore Reserves may include areas where additional
approvals are required, and it’s expected that such approvals will be obtained within the timeframe needed for the current production schedule.
Our governance arrangements and internal controls We have internal standards and governance arrangements that cover regulatory requirements for public reporting. To ensure correct and accurate public reporting our governance processes are managed by the Technical Stewardship function in coordination with the Company Secretariat function.
Our comprehensive review and audit program is aimed at assuring our Mineral Resource and Ore Reserve estimates. This includes:
– Annual review of Mineral Resources and Ore Reserves declarations and reports;
– Annual review of reconciliation performance metrics for operating mines;
– Periodic internal mine planning and Ore Reserve audits; and
– Independent audits of Mineral Resources or Ore Reserves that are new or have materially changed.
In FY21, we undertook three independent assurance audits of Mineral Resource estimates and an internal mine planning and Ore Reserve assurance audit. The frequency and scope of the audits are a function of the perceived risks and uncertainties associated with a particular Mineral Resource and Ore Reserve.
The accompanying tables, on pages 155 to 160, outline our Mineral/Coal Resources and Ore/Coal Reserves holdings.
Our exploration, research and development Our operations carry out exploration, research and development necessary to support our activities. Our brownfield exploration activities target the delineation and categorisation of mineral deposits connected or adjacent to our existing operations. Our greenfield exploration activities focus on the discovery and delineation of opportunities outside of our operational footprint, with a bias to base metals.
During FY21 we continued to expand our global exploration footprint. We funded greenfield exploration in Australia, Peru, Colombia, Argentina, Ireland, Mexico, Canada and the United States. Our exploration expenditure for FY21 was US$57 million (FY20: US$64 million) of which US$19 million related to brownfield and US$38 million related to greenfield (FY20: US$27 million and US$37 million respectively).
At a glance - Resources and Reserves (as at 30 June 2021)
Operations and development options Total Ore/Coal
Reserve (Mt)Reserve Life
Years(1)
Total Mineral/Coal Resource
(Mt)
Worsley Alumina 242 14 1,140Brazil Alumina (MRN) 17 1.3 471Eagle Downs 1,140Illawarra Metallurgical Coal(2)(3) 108 22 1,210Cerro Matoso 31 8.0 328Australia Manganese 51 4.9 157South Africa Manganese(3) 109 44 224Cannington 20 9.0 72Taylor 138Clark 55Arctic 37Bornite 148
(1) Scheduled extraction period in years for the Total Ore Reserves in the approved Life of Operation Plan. (2) Coal Reserves in this table are presented as Marketable Coal Reserves. Process recoveries are reported in the
following detailed disclosures for each coal operation. (3) Reserve Life for Illawarra Metallurgical Coal and South Africa Manganese is reported as the life of scheduled
Coal/Ore Reserves for Bulli and Wessels respectively. The Reserve Life for the remaining operations are stated in the following detailed disclosures.
153S
outh32 Annual R
eport 2021
Resources and
Reserves

Competent persons Mineral ResourcesWorsley: P Soodi Shoar, MAusIMM
Mineração Rio Do Norte (MRN): M A H Monteiro, MAusIMM, employed by Mineração Rio do Norte S.A.
Cerro Matoso: I Espitia, MAusIMM (CP)
GEMCO: J Harvey, MAusIMM
Mamatwan & Wessels: L Lautze, Pr. Sci. Nat., SACNASP
Cannington: P Boamah, MAusIMM (CP)
Taylor: M Hastings, MAusIMM (CP), employed by SRK Consulting (US) Inc
Clark: M Hastings, MAusIMM (CP), employed by SRK Consulting (US) Inc
Arctic: D F Machuca Mory, PEng., employed by SRK Consulting (Canada) Inc; T Fouet, MAusIMM (CP)
Bornite: S Khosrowshahi, MAusIMM (CP) employed by Golder Associates Pty Ltd; T Fouet, MAusIMM (CP)
Ore ReservesWorsley: G Burnham, MAusIMM
Mineração Rio Do Norte (MRN): J P M Franco, MAusIMM, independent consultant
Cerro Matoso: A Quiroz, MAusIMM
GEMCO: U Sandilands, MAusIMM
Mamatwan & Wessels: A R Maier, Pr. Eng., MSAIMM
Cannington: A Spong, MAusIMM (CP), employed by Mining Plus Pty Ltd
Coal ResourcesEagle Downs: M Blaik, MAusIMM, employed by JB Mining Services Pty Ltd
Bulli & Wongawilli: M Krejci, MAusIMM
South Africa Energy Coal (SAEC): S Kara, Pr. Sci. Nat., SACNASP, employed by Seriti Coal Pty Ltd
Coal ReservesBulli & Wongawilli: M Rose, MAusIMM
South Africa Energy Coal (SAEC): P Mulder, MSAIMM, employed by Seriti Coal Pty Ltd
Resources and Reserves continued
154
Sou
th32
Ann
ual R
epor
t 20
21R
esou
rces
and
Res
erve
s

AluminaMineral Resources
As at 30 June 2021 As at 30 June 2020
Measured Mineral Resources Indicated Mineral Resources Inferred Mineral Resources Total Mineral ResourcesSouth32 Interest Total Mineral Resources
Deposit(1) Material Type Mt % A.Al2O3 % R.SiO2 Mt % A.Al2O3 % R.SiO2 Mt % A.Al2O3 % R.SiO2 Mt % A.Al2O3 % R.SiO2 % Mt % A. Al2O3 % R.SiO2
Worsley Laterite 350 28.4 1.4 383 29.2 2.1 405 28.7 2.2 1,140 28.7 1.9 86 1,140 28.8 1.9
MRN(2) MRN Washed 294 49.6 4.4 43 48.9 5.0 134 49.9 3.7 471 49.6 4.2 14.8 481 49.6 4.2
Ore Reserves
As at 30 June 2021 As at 30 June 2020
Proved Ore Reserves Probable Ore Reserves Total Ore Reserves Reserve LifeSouth32 Interest Total Ore Reserves Reserve Life
Deposit(1)(6) Ore Type Mt % A.Al2O3 % R.SiO2 Mt % A.Al2O3 % R.SiO2 Mt % A.Al2O3 % R.SiO2 Years % Mt % A.Al2O3 % R.SiO2 Years
Worsley(3) Laterite 236 27.7 1.7 6.5 27.9 1.8 242 27.7 1.7 14 86 257 27.7 1.7 15
MRN(2)(4)(5) MRN Washed 15 48.0 5.9 2.1 48.5 5.1 17 48.1 5.8 1.3 14.8 28 48.3 5.3 2.2
(1) Cut-off grade
Mineral Resources Ore ReservesWorsley Variable ranging from 22-25% A.Al2O3, ≤3.5% R.SiO2 and ≥1m thickness. Variable ranging from 22.5-28% A.Al2O3, ≤3.5% R.SiO2 and ≥1m thickness (except Marradong West ≥2m thickness).MRN ≥46% A.Al2O3, ≤7% R.SiO2, ≥1m thickness and ≥30% recovery on weight per cent basis. ≥46% A.Al2O3, ≤7% R.SiO2, ≥1m thickness and ≥30% recovery on weight per cent basis.
(2) MRN Washed tonnes and grades represent the expected product based on forecast beneficiation yield.(3) Ore delivered to Worsley refinery.(4) Ore delivered to Alumar refinery.(5) Reserve Life for FY20 restated to 2.2 years following review of calculation using MRN washed tonnes.(6) Metallurgical recovery: Worsley 91.9% Alumar 92%
South32 A
nnual Rep
ort 2021155
Resources and
Reserves
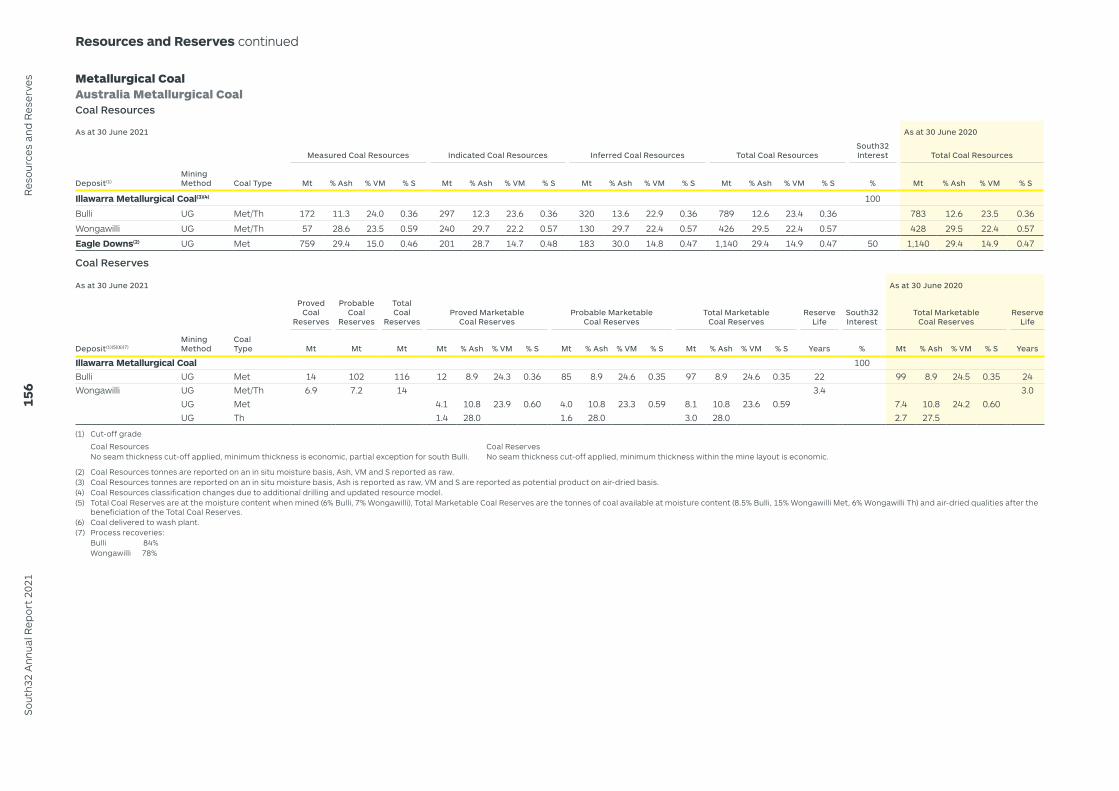
Resources and Reserves continued
Metallurgical CoalAustralia Metallurgical CoalCoal Resources
As at 30 June 2021 As at 30 June 2020
Measured Coal Resources Indicated Coal Resources Inferred Coal Resources Total Coal ResourcesSouth32 Interest Total Coal Resources
Deposit(1)Mining Method Coal Type Mt % Ash % VM % S Mt % Ash % VM % S Mt % Ash % VM % S Mt % Ash % VM % S % Mt % Ash % VM % S
Illawarra Metallurgical Coal(3)(4) 100
Bulli UG Met/Th 172 11.3 24.0 0.36 297 12.3 23.6 0.36 320 13.6 22.9 0.36 789 12.6 23.4 0.36 783 12.6 23.5 0.36
Wongawilli UG Met/Th 57 28.6 23.5 0.59 240 29.7 22.2 0.57 130 29.7 22.4 0.57 426 29.5 22.4 0.57 428 29.5 22.4 0.57
Eagle Downs(2) UG Met 759 29.4 15.0 0.46 201 28.7 14.7 0.48 183 30.0 14.8 0.47 1,140 29.4 14.9 0.47 50 1,140 29.4 14.9 0.47
Coal Reserves
As at 30 June 2021 As at 30 June 2020
Proved Coal
Reserves
Probable Coal
Reserves
Total Coal
ReservesProved Marketable
Coal ReservesProbable Marketable
Coal ReservesTotal Marketable
Coal ReservesReserve
LifeSouth32 Interest
Total Marketable Coal Reserves
Reserve Life
Deposit(1)(5)(6)(7)Mining Method
Coal Type Mt Mt Mt Mt % Ash % VM % S Mt % Ash % VM % S Mt % Ash % VM % S Years % Mt % Ash % VM % S Years
Illawarra Metallurgical Coal 100Bulli UG Met 14 102 116 12 8.9 24.3 0.36 85 8.9 24.6 0.35 97 8.9 24.6 0.35 22 99 8.9 24.5 0.35 24Wongawilli UG Met/Th 6.9 7.2 14 3.4 3.0
UG Met 4.1 10.8 23.9 0.60 4.0 10.8 23.3 0.59 8.1 10.8 23.6 0.59 7.4 10.8 24.2 0.60UG Th 1.4 28.0 1.6 28.0 3.0 28.0 2.7 27.5
(1) Cut-off grade
Coal Resources Coal ReservesNo seam thickness cut-off applied, minimum thickness is economic, partial exception for south Bulli. No seam thickness cut-off applied, minimum thickness within the mine layout is economic.
(2) Coal Resources tonnes are reported on an in situ moisture basis, Ash, VM and S reported as raw.(3) Coal Resources tonnes are reported on an in situ moisture basis, Ash is reported as raw, VM and S are reported as potential product on air-dried basis.(4) Coal Resources classification changes due to additional drilling and updated resource model.(5) Total Coal Reserves are at the moisture content when mined (6% Bulli, 7% Wongawilli), Total Marketable Coal Reserves are the tonnes of coal available at moisture content (8.5% Bulli, 15% Wongawilli Met, 6% Wongawilli Th) and air-dried qualities after the
beneficiation of the Total Coal Reserves.(6) Coal delivered to wash plant.(7) Process recoveries: Bulli 84% Wongawilli 78%
156
Sou
th32
Ann
ual R
epor
t 20
21R
esou
rces
and
Res
erve
s

Energy CoalSouth Africa Energy CoalCoal Resources
As at 30 June 2021 As at 30 June 2020
Measured Coal Resources Indicated Coal Resources Inferred Coal Resources Total Coal ResourcesSouth32 Interest Total Coal Resources
Deposit(1)Mining Method
Coal Type Mt % Ash % VM % S
KCal/kg CV Mt % Ash % VM % S
KCal/kg CV Mt % Ash % VM % S
KCal/kg CV Mt % Ash % VM % S
KCal/kg CV % Mt % Ash % VM % S
KCal/kg CV
Operating mines -
Khutala UG Th - - - - - - - - - - - - - - - - - - - - 117 32.3 21.1 1.09 4,690
OC Th - - - - - - - - - - - - - - - - - - - - 1,098 31.7 22.4 1.15 4,800
Klipspruit OC Th - - - - - - - - - - - - - - - - - - - - 706 29.7 22.1 1.20 5,090
Wolvekrans Middleburg Complex (WMC)
OC Th - - - - - - - - - - - - - - - - - - - - 804 26.4 22.8 1.13 5,520
SP Th - - - - - - - - - - - - - - - - - - - - 5.0 30.0 20.8 0.84 5,140
Projects -
Davel UG Th - - - - - - - - - - - - - - - - - - - - 222 22.8 27.2 1.49 5,790
Leandra UG Th - - - - - - - - - - - - - - - - - - - - 1,799 29.0 22.1 1.02 4,780
Naudesbank OC & UG Th - - - - - - - - - - - - - - - - - - - - 244 24.6 25.5 1.06 5,630
Pegasus OC Th - - - - - - - - - - - - - - - - - - - - 14 27.0 21.3 1.35 5,390
Coal Reserves
As at 30 June 2021 As at 30 June 2020
Proved Coal
Reserves
Probable Coal
Reserves
Total Coal
ReservesProved Marketable
Coal ReservesProbable Marketable
Coal ReservesTotal Marketable
Coal ReservesReserve
LifeSouth32 Interest
Total Marketable Coal Reserves
Reserve Life
Deposit(1)Mining Method
Coal Type Mt Mt Mt Mt
% Ash
% VM
% S
KCal/kg CV Mt
% Ash
% VM
% S
KCal/kg CV Mt
% Ash
% VM
% S
KCal/kg CV Years % Mt
% Ash
% VM
% S
KCal/kg CV Years
Operating mines -Khutala UG Th - - - - - - - - - - - - - - - - - - - 59 33.8 21.6 1.07 4,650 12Klipspruit OC Th Export - - - - - - - - - - - - - - - - - - - 65 14.8 22.7 0.69 6,000 30
OC Th - - - - - - - - - - - - - - - - - - - 80 29.0 21.5 0.90 4,670OC Th Eskom - - - - - - - - - - - - - - - - - - - 57 37.6 19.9 0.79 4,310
Wolvekrans Middelburg Complex (WMC)
OC Th Export - - - - - - - - - - - - - - - - - - - 172 18.9 24.6 0.59 6,220 24OC Th Domestic - - - - - - - - - - - - - - - - - - - 58 25.3 22.2 0.93 5,510OC Th - - - - - - - - - - - - - - - - - - -
SP Th - - - - - - - - - - - - - - - - - - -
(1) South Africa Energy Coal was divested from South32 on 1st June 2021.
South32 A
nnual Rep
ort 2021157
Resources and
Reserves

Nickel
Cerro MatosoMineral Resources
As at 30 June 2021 As at 30 June 2020
Measured Mineral Resources Indicated Mineral Resources Inferred Mineral Resources Total Mineral ResourcesSouth32 Interest Total Mineral Resources
Deposit(1) Material Type Mt % Ni Mt % Ni Mt % Ni Mt % Ni % Mt % Ni
Cerro Matoso Laterite(2) 115 1.0 126 0.8 34 0.8 275 0.9 99.9 247 0.9
SP 14 1.0 39 0.8 53 0.9 43 0.9
MNR - Ore(3) - - - - - - - - 17 0.2
Ore Reserves
As at 30 June 2021 As at 30 June 2020
Proved Ore Reserves Probable Ore Reserves Total Ore Reserves Reserve LifeSouth32 Interest Total Ore Reserves Reserve Life
Deposit(1)(4)(5) Ore Type Mt % Ni Mt % Ni Mt % Ni Years % Mt % Ni Years
Cerro Matoso(6) Laterite 14 1.3 1.8 1.4 16 1.3 8.0 99.9 14 1.2 8.9
SP 7.7 1.1 6.8 1.1 15 1.1 16 1.1
(1) Cut-off grade
Mineral Resources Ore ReservesLaterite 0.6% Ni 0.6% NiSP 0.6% Ni 0.6% Ni
(2) Changes to Mineral Resources due to additional drilling and changes in estimation methodology and economic assumptions.(3) MNR no longer satisfy the criteria of "Reasonable Prospects for Eventual Economic Extraction (RPEEE)".(4) Ore delivered to process plant.(5) Global recovery: 83%.(6) Changes to Ore Reserves due to implementation of Ore Sorting and Mechanical Ore Concentration (OSMOC) project.
Resources and Reserves continued15
8S
outh
32 A
nnua
l Rep
ort
2021
Res
ourc
es a
nd R
eser
ves
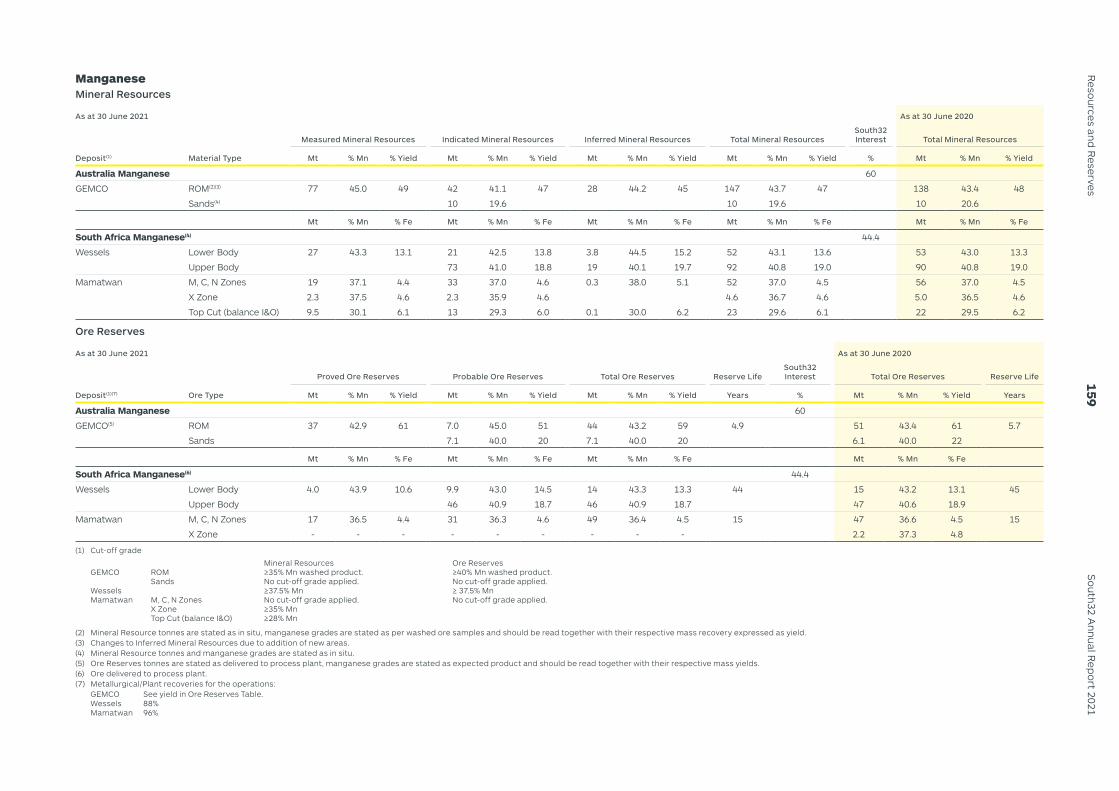
ManganeseMineral Resources
As at 30 June 2021 As at 30 June 2020
Measured Mineral Resources Indicated Mineral Resources Inferred Mineral Resources Total Mineral ResourcesSouth32 Interest Total Mineral Resources
Deposit(1) Material Type Mt % Mn % Yield Mt % Mn % Yield Mt % Mn % Yield Mt % Mn % Yield % Mt % Mn % Yield
Australia Manganese 60
GEMCO ROM(2)(3) 77 45.0 49 42 41.1 47 28 44.2 45 147 43.7 47 138 43.4 48
Sands(4) 10 19.6 10 19.6 10 20.6
Mt % Mn % Fe Mt % Mn % Fe Mt % Mn % Fe Mt % Mn % Fe Mt % Mn % Fe
South Africa Manganese(4) 44.4
Wessels Lower Body 27 43.3 13.1 21 42.5 13.8 3.8 44.5 15.2 52 43.1 13.6 53 43.0 13.3
Upper Body 73 41.0 18.8 19 40.1 19.7 92 40.8 19.0 90 40.8 19.0
Mamatwan M, C, N Zones 19 37.1 4.4 33 37.0 4.6 0.3 38.0 5.1 52 37.0 4.5 56 37.0 4.5
X Zone 2.3 37.5 4.6 2.3 35.9 4.6 4.6 36.7 4.6 5.0 36.5 4.6
Top Cut (balance I&O) 9.5 30.1 6.1 13 29.3 6.0 0.1 30.0 6.2 23 29.6 6.1 22 29.5 6.2
Ore Reserves
As at 30 June 2021 As at 30 June 2020
Proved Ore Reserves Probable Ore Reserves Total Ore Reserves Reserve LifeSouth32 Interest Total Ore Reserves Reserve Life
Deposit(1)(7) Ore Type Mt % Mn % Yield Mt % Mn % Yield Mt % Mn % Yield Years % Mt % Mn % Yield Years
Australia Manganese 60
GEMCO(5) ROM 37 42.9 61 7.0 45.0 51 44 43.2 59 4.9 51 43.4 61 5.7
Sands 7.1 40.0 20 7.1 40.0 20 6.1 40.0 22
Mt % Mn % Fe Mt % Mn % Fe Mt % Mn % Fe Mt % Mn % Fe
South Africa Manganese(6) 44.4
Wessels Lower Body 4.0 43.9 10.6 9.9 43.0 14.5 14 43.3 13.3 44 15 43.2 13.1 45
Upper Body 46 40.9 18.7 46 40.9 18.7 47 40.6 18.9
Mamatwan M, C, N Zones 17 36.5 4.4 31 36.3 4.6 49 36.4 4.5 15 47 36.6 4.5 15
X Zone - - - - - - - - - 2.2 37.3 4.8
(1) Cut-off grade
Mineral Resources Ore ReservesGEMCO ROM ≥35% Mn washed product. ≥40% Mn washed product. Sands No cut-off grade applied. No cut-off grade applied.Wessels ≥37.5% Mn ≥ 37.5% MnMamatwan M, C, N Zones No cut-off grade applied. No cut-off grade applied.
X Zone ≥35% MnTop Cut (balance I&O) ≥28% Mn
(2) Mineral Resource tonnes are stated as in situ, manganese grades are stated as per washed ore samples and should be read together with their respective mass recovery expressed as yield.(3) Changes to Inferred Mineral Resources due to addition of new areas.(4) Mineral Resource tonnes and manganese grades are stated as in situ.(5) Ore Reserves tonnes are stated as delivered to process plant, manganese grades are stated as expected product and should be read together with their respective mass yields.(6) Ore delivered to process plant.(7) Metallurgical/Plant recoveries for the operations: GEMCO See yield in Ore Reserves Table. Wessels 88% Mamatwan 96%
South32 A
nnual Rep
ort 2021159
Resources and
Reserves

Base MetalsMineral Resources
As at 30 June 2021 As at 30 June 2020
Measured Mineral Resources Indicated Mineral Resources Inferred Mineral Resources Total Mineral ResourcesSouth32 Interest Total Mineral Resources
Deposit(1) Material Type Mt g/t Ag % Pb % Zn Mt g/t Ag % Pb % Zn Mt g/t Ag % Pb % Zn Mt g/t Ag % Pb % Zn % Mt g/t Ag % Pb % Zn
Cannington 100Cannington UG Sulphide 39 180 5.15 3.24 3.6 111 3.79 2.39 0.4 90 3.26 1.97 43 174 5.02 3.16 49 166 4.82 3.06
OC Sulphide 24 108 3.28 2.51 3.3 74 2.75 1.81 1.2 55 2.68 1.33 29 102 3.20 2.38 30 96 3.07 2.30
Measured Mineral Resources Indicated Mineral Resources Inferred Mineral Resources Total Mineral ResourcesSouth32 Interest Total Mineral Resources
Deposit(1) Material Type Mt % Zn % Pb % Mn g/t Ag Mt % Zn % Pb % Mn g/t Ag Mt % Zn % Pb % Mn g/t Ag Mt % Zn % Pb % Mn g/t Ag % Mt % Zn % Pb % Mn g/t Ag
Hermosa 100Taylor(3) UG Sulphide 29 4.10 4.05 57 82 3.65 4.45 88 23 3.62 3.82 93 133 3.74 4.26 82 162 3.31 3.86 72
UG Transition 3.7 6.11 4.21 60 1.4 5.55 3.91 64 5.1 5.95 4.13 61 5.0 4.50 3.39 44Clark UG Oxide 33 2.49 9.39 57 22 2.04 8.64 110 55 2.31 9.08 78 55 2.31 9.08 78
Measured Mineral Resources Indicated Mineral Resources Inferred Mineral Resources Total Mineral ResourcesSouth32 Interest Total Mineral Resources
Deposit(1) Material Type Mt % Cu % Zn % Pb g/t Ag g/t Au Mt % Cu % Zn % Pb g/t Ag g/t Au Mt % Cu % Zn % Pb g/t Ag g/t Au Mt % Cu % Zn % Pb g/t Ag g/t Au % Mt % Cu % Zn % Pb g/t Ag g/t Au
Ambler 50Arctic OC Sulphide 33 3.14 4.43 0.80 49 0.63 4.7 2.55 3.34 0.57 37 0.38 37 3.06 4.30 0.77 47 0.60 37 3.06 4.30 0.77 47 0.60Bornite OC Sulphide 40 1.06 38 1.03 78 1.04 78 1.04
UG Sulphide 70 2.29 70 2.29 70 2.29
Ore Reserves
As at 30 June 2021 As at 30 June 2020
Proved Ore Reserves Probable Ore Reserves Total Ore Reserves Reserve LifeSouth32 Interest Total Ore Reserves Reserve Life
Deposit(1)(2)(4) Ore Type Mt g/t Ag % Pb % Zn Mt g/t Ag % Pb % Zn Mt g/t Ag % Pb % Zn Years % Mt g/t Ag % Pb % Zn Years
Cannington 100Cannington UG Sulphide 18 176 5.29 3.33 1.2 166 5.25 1.97 20 175 5.28 3.24 9.0 20 173 5.35 3.28 11
(1) Cut-off grade
Mineral Resources Ore ReservesCannington Net smelter return in A$/t Net smelter return in A$/t
UG Sulphide 130 145OC Sulphide 58
Taylor Net smelter return in US$/tUG Sulphide 80UG Transition 80
Clark Net smelter return in US$/tUG Oxide 175
Arctic Net smelter return in US$/tOC Sulphide 63.4
BorniteOC Sulphide 0.5% CuUG Sulphide 1.5% Cu
(2) Ore delivered to process plant.(3) Changes to Mineral Resources due to revision in geological model, estimation approach and project economics.(4) Metallurgical recoveries: 85% Ag, 87% Pb and 83% Zn.
Resources and Reserves continued16
0S
outh
32 A
nnua
l Rep
ort
2021
Res
ourc
es a
nd R
eser
ves

Shareholder information
Voting rights South32 Limited ordinary shares carry voting rights of one vote per share.
Shareholders may hold a beneficial entitlement to dematerialised ordinary shares in South32 Limited, UK Depositary Interests and American Depositary Shares (ADS) through the Central Securities Depositories of Strate (Strate), CREST and the Depository Trust Company respectively. Each share held dematerialised in Strate, or as a Depositary Interest held in CREST, entitles the holder to one vote. Each ADS is represented by five ordinary shares, with ADS voting managed by South32 Limited’s ADS Depositary.
Substantial shareholdersAs at 23 July 2021, South32 Limited has three substantial shareholders who, together with their associates, hold five per cent or more of the voting rights in South32 Limited, as notified to South32 under the Australian Corporations Act.
Name Date notice received Number of shares in notice Percentage of capital in notice
Schroder Investment Management Australia Limited 3 December 2020 359,970,206 7.44BlackRock Group 11 March 2020 287,969,025 5.09The Vanguard Group 5 July 2021 234,998,773 5.027
Distribution of shareholdings and number of shareholdersThe following table shows the distribution of South32 Limited shareholders by size of shareholding and number of shareholders and shares as at 23 July 2021.
Size of holding Number of shareholders Number of shares Percentage of capital
1 – 1,000 123,905 60,157,663 1.291,001 – 5,000 82,962 197,220,114 4.225,001 – 10,000 20,401 149,074,472 3.1910,001 – 100,000 18,263 415,858,324 8.90100,001 and over 615 3,852,227,440 82.41Total 246,146 4,674,538,013 100.00
Distribution of rights holdings and number of rights holdersThe following table shows the distribution of rights holders in South32 Limited by size of rights holding and number of rights holders and rights as at 23 July 2021.
Size of holding Number of rights holders Number of rights Percentage of rights on issue
0 - 1,000 658 522,285 0.7811,001 - 5,000 5,911 9,793,257 14.6355,001 - 10,000 23 164,125 0.24510,001 - 100,000 131 5,995,458 8.960100,001 and over 93 50,441,581 75.380Total 6,816 66,916,706 100.00
161S
outh32 Annual R
eport 2021
Information

Twenty largest shareholders in South32 LimitedThe following table sets out the 20 largest shareholders of ordinary shares listed on our shareholder register and the details of their shareholding as at 23 July 2021.
Name Number of fully paid shares Percentage of capital
1 HSBC Custody Nominees (Australia) Limited 1,343,686,117 28.742 J P Morgan Nominees Australia Pty Limited 854,784,989 18.293 Citicorp Nominees Pty Ltd 424,720,491 9.094 Computershare Clearing Pty Ltd <Ccnl Di A/C> 312,640,066 6.695 National Nominees Limited 171,184,675 3.666 BNP Paribas Nominees Pty Ltd <Agency Lending DRP A/C> 135,865,480 2.917 South Africa Control A/C\C 79,938,690 1.718 Citicorp Nominees Pty Limited <Citibank NY ADR Dep A/C> 70,664,930 1.519 HSBC Custody Nominees (Australia) Limited - A/C 2 62,322,068 1.3310 BNP Paribas Noms Pty Ltd <DRP> 55,067,568 1.1811 BNP Paribas Nominees Pty Ltd Six Sis Ltd <DRP A/C> 30,539,607 0.6512 HSBC Custody Nominees (Australia) Limited <NT-Comnwlth Super Corp A/C> 26,881,530 0.5813 BNP Paribas Nominees Pty Ltd ACF Clearstream 18,917,788 0.4014 Citicorp Nominees Pty Limited <Colonial First State Inv A/C> 14,972,510 0.3215 Woodross Nominees Pty Ltd 10,790,131 0.2316 Merrill Lynch (Australia) Nominees Pty Limited 9,828,443 0.2117 CPU Share Plans Pty Ltd <S32 SPA Control A/C> 9,741,184 0.2118 CPU Share Plans Pty Ltd <S32 ASP Unallocated A/C> 9,390,764 0.2019 AMP Life Limited 9,112,236 0.1920 Netwealth Investments Limited <Wrap Services A/C> 7,349,835 0.16Total 3,658,399,102 78.26
Restricted and escrowed securitiesAs at 23 July 2021, South32 Limited does not have any restricted securities or securities subject to voluntary escrow on issue.
Shareholders with less than a marketable parcelAs at 23 July 2021, there were 12,074 shareholders on the Australian South32 Limited register holding less than a marketable parcel (A$500) based on the closing market price of A$2.95.
On-market purchases of South32 Limited securities for employee incentive plansDuring FY21, 67,174 shares were purchased on-market and immediately distributed to Canadian based employees on vesting of rights. The average price at which the shares were purchased was A$2.27.
Dividend policyOur dividend policy is determined by the Board at its discretion. Our priorities for cash flow are to maintain safe and reliable operations and an investment grade credit rating through the cycle.
South32 Limited intends to distribute a minimum 40 per cent of underlying earnings as dividends to its shareholders following each six-month reporting period. South32 Limited intends to distribute dividends with the maximum practicable franking credits for the purposes of the Australian dividend imputation system.
Dividend determination and paymentOur dividends are determined in US dollars.
Dividends for shareholders of South32 Limited on the Australian register are paid by direct credit into their nominated bank account in Australian dollars, UK pounds sterling, New Zealand dollars or US dollars, provided direct credit details and currency election information are submitted no later than close of business on the dividend record date as stated in the relevant ASX announcement.
Dividends for shareholders of South32 Limited on the South African branch register and UK Depositary Interest holders are paid by direct credit in South African rand and UK pounds sterling respectively.
For further information about dividends visit www.south32.net/investors-media/investor-centre/dividends.
Capital management programFollowing the recommencement of our on-market share buy-back in October 2020, which had been suspended since March 2020 as part of our response to the COVID-19 pandemic, the Board expanded the capital management program by US$250 million on 18 February 2021 and a further US$200 million on 18 May 2021. As at 30 June 2021, the capital management program totalled US$1.88 billion, comprising a US$1.59 billion on-market share buy-back and special dividends of US$154 million (paid in 2018), US$85 million (paid in 2019) and US$53 million paid in April 2020.
As at 30 June 2021 we had returned a total value of US$1.66 billion to our shareholders under the capital management program. Subsequent to 30 June 2021, the Board has expanded the capital management program by US$120 million to US$2.00 billion and extended the execution window for the remaining program by 12-months to 2 September 2022.
The on-market share buy-back was initially announced on 27 March 2017 and purchasing commenced on 19 April 2017. During the year ended 30 June 2021, South32 Limited purchased 172 million shares under the on-market share buy-back, which represented 3.54 per cent of share capital at the beginning of the financial year. Total consideration paid for these shares was US$346 million.
Between the commencement of purchasing under the on-market share buy-back on 19 April 2017 and 30 June 2021, South32 Limited purchased a total of 649 million shares, which represented 12.19 per cent of share capital at the commencement of the program. The total consideration paid for the shares bought back up to 30 June 2021 was US$1.36 billion.
All of the shares purchased by South32 Limited under the on-market buy-back have been cancelled.
Shareholder information continued
162
Sou
th32
Ann
ual R
epor
t 20
21In
form
atio
n

Annual General Meeting (AGM)Our 2021 AGM will be held on Thursday 28 October 2021 at 12.00pm (midday) Australian Western Standard Time as a hybrid meeting, providing shareholders with the opportunity to participate via online facilities. We will continue to monitor the evolving COVID-19 situation and provide an update if this changes. Further details regarding the AGM will be made available in September 2021, and shareholders are encouraged to monitor securities exchange releases and the company’s website www.south32.net for information and updates.
Presentations delivered at the AGM and the results of voting will be provided to all stock exchanges and will be available at www.south32.net.
Stock exchangesAs at 23 July 2021, South32 Limited has a primary listing on the Australian Securities Exchange, a secondary listing on the Johannesburg Stock Exchange, is admitted to the standard segment of the Official List of the UK Listing Authority and its ordinary shares are traded on the London Stock Exchange.
South32 Limited also has a Level 1 American Depositary Receipts program, which trades in the United States’ over-the counter market.
Shareholder enquiriesShareholders can access their current holding details as well as their transaction history, view dividend statements and payments made, download statements and documents, change their address, update their communication preferences and banking details, and check their tax details online via Computershare’s Investor Centre at www.computershare.com
Alternatively, refer to the following contacts:
Share registriesAustraliaComputershare Investor Services Pty Limited Yarra Falls 452 Johnston Street Abbotsford Victoria 3067 Australia
Telephone (Australia): 1800 019 953 Telephone (International): +61 3 9415 4169 Facsimile: +61 3 9473 2500
South AfricaComputershare Investor Services (Pty) Limited Rosebank Towers, 15 Biermann Avenue Rosebank, 2196 South Africa
Telephone: +27 11 373 0033 Facsimile: +27 11 688 5217 Email enquiries: [email protected]
Holders of shares dematerialised into Strate should contact their Central Securities Depository Participant or stockbroker.
United KingdomComputershare Investor Services PLC The Pavilions, Bridgwater Road Bristol BS99 6ZZ United Kingdom
Telephone: +44 370 873 5884 Facsimile: +44 370 703 6101
Email enquiries: [email protected]
American Depositary Receipts (ADR) ADR holders should deal directly with Citibank Shareholder Services.
Citibank Shareholder Services PO Box 43077 Providence, Rhode Island 02940-3077
Telephone: +1 877 248 4237 (+1-877-CITIADR) (toll-free within US) +1 781 575 4555 (outside of US) Facsimile: +1 201 324 3284
Email enquiries: [email protected] Website: www.citi.com/dr
BranchesIn accordance with DTR 4.1.11R(5), South32 Limited, through various subsidiaries, has established branches in a number of different jurisdictions in which the business operates.
Registered officeInformation regarding the South32 Limited Registered Office is included in the corporate directory on the inside back cover.
Shareholders are encouraged to access all South32 communications electronically at www.south32.net. Shareholders that wish to receive electronic communications can update their preferences online or by telephoning the relevant Computershare Investor Centre.
163S
outh32 Annual R
eport 2021
Information

Glossary of terms and abbreviations
Mining related termsAluminaAluminium oxide (Al₂O₃). Alumina is produced from bauxite in the Bayer refining process. It’s then converted (reduced) in an electrolysis cell to produce aluminium metal.
AshInorganic material remaining after combustion of coal.
ASX Listing Rules (Chapter 5): Additional reporting on mining and oil and gas production and exploration activitiesThis chapter of the ASX Listing Rules sets out additional reporting and disclosure requirements for mining entities, oil and gas entities, as well as other entities reporting on mining and oil and gas activities.
AusIMMThe Australasian Institute of Mining and Metallurgy.
BauxitePrincipal commercial ore of aluminium.
BeneficiationThe process of physically separating ore from gangue to produce a mineral concentrate prior to subsequent processing.
BrownfieldAn exploration or development project located within an existing mineral province, which can share infrastructure and management with an existing operation.
Coal ReserveThe same meaning as Ore Reserve, but specifically concerning coal.
Coal ResourceThe same meaning as Mineral Resource, but specifically concerning coal.
Coking coalUsed in the manufacture of coke, which is used in the steelmaking process by virtue of its carbonisation properties. Coking coal is a form of, and may also be referred to as, metallurgical coal.
Competent PersonA minerals industry professional who is a Member or Fellow of The Australasian Institute of Mining and Metallurgy, or of the Australian Institute of Geoscientists, or of a ‘Recognised Professional Organisation’, as included in a list available on the JORC and ASX websites. These organisations have enforceable disciplinary processes, including the powers to suspend or expel a member.
A Competent Person must have a minimum of five years’ relevant experience in the style of mineralisation or type of deposit under consideration and in the activity that the person is undertaking (JORC Code).
Cut-off gradeThe lowest grade, or quality, of mineralised material that qualifies as economically mineable and available in a given deposit. It may be defined on the basis of economic evaluation, or on physical or chemical attributes that define an acceptable product specification (JORC Code).
Energy coalUsed as a fuel source in electrical power generation, cement manufacture and various industrial applications. Energy coal may also be referred to as steaming or thermal coal.
FlotationA method of selectively recovering minerals from finely ground ore using a froth created in water by specific reagents. In the flotation process, certain mineral particles are induced to float by becoming attached to bubbles of froth and the unwanted mineral particles sink.
GradeAny physical or chemical measurement of the characteristics of the material of interest in samples or product (JORC Code).
GreenfieldAn exploration or development project located outside the area of influence of our existing mine operations/infrastructure.
Indicated Mineral ResourceThat part of a Mineral Resource for which quantity, grade (or quality), densities, shape and physical characteristics are estimated with sufficient confidence. This allows the application of Modifying Factors in sufficient detail to support mine planning and evaluation of the economic viability of the deposit (JORC Code).
Inferred Mineral ResourceThat part of a Mineral Resource for which quantity and grade (or quality) are estimated on the basis of limited geological evidence and sampling. Geological evidence is sufficient to imply but not verify geological and grade (or quality) continuity (JORC Code).
JORCJoint Ore Reserves Committee comprising representatives of The Australasian Institute of Mining and Metallurgy (AusIMM), Australian Institute of Geoscientists (AIG) and Minerals Council of Australia (MCA) as well as the Australian Securities Exchange (ASX), the Financial Services Institute of Australasia (FinSIA) and the accounting profession.
JORC CodeThe Australasian Code for reporting of Exploration Results, Mineral Resources and Ore Reserves 2012 Edition prepared by the JORC.
LateriteA residual soil or deposit formed by the leaching of silica from rocks under specific climatic conditions.
LeachingThe process by which a soluble metal can be economically recovered from minerals in ore by dissolution.
Life of Operation PlanThe combination of an Optimised Base Plan and incremental opportunities available to the Operation for maximising value.
Marketable Coal ReservesRepresents beneficiated or otherwise enhanced coal product where modifications due to mining, dilution and processing have been considered (JORC Code).
MAusIMMMember of the Australasian Institute of Mining and Metallurgy.
MAusIMM (CP)Accredited Chartered Professional status of members of the AusIMM. These members have undergone an assessment of their competencies, which are maintained through continuing professional development activities.
Measured Mineral ResourceThat part of a Mineral Resource for which quantity, grade (or quality), densities, shape and physical characteristics are estimated with confidence sufficient to allow the application of Modifying Factors to support detailed mine planning and final evaluation of the economic viability of the deposit (JORC Code).
Metallurgical coalA broader term than coking coal that includes all coals used in steelmaking, such as coal used for the pulverised coal injection process.
Mineral ResourceA concentration or occurrence of solid material of economic interest in or on the Earth’s crust in such form, grade (or quality), and quantity that there are reasonable prospects for eventual economic extraction. The location, quantity, grade (or quality), continuity and other geological characteristics of a Mineral Resource are known, estimated or interpreted from specific geological evidence and knowledge, including sampling. Mineral Resources are sub-divided, in order of increasing geological confidence, into Inferred, Indicated and Measured categories (JORC Code).
MineralisationAny single mineral or combination of minerals occurring in a mass, or deposit, of economic interest (JORC Code).
Modifying FactorsConsiderations used to convert Mineral Resources to Ore Reserves. These include, but are not restricted to, mining, processing, metallurgical, infrastructure, economic, marketing, legal, environmental, social and governmental factors (JORC Code).
MSAIMMMember of the Southern African Institute of Mining and Metallurgy.
Net smelter return (NSR)An estimate of revenue derived from the sale of products and concentrates following the application of metallurgical recoveries and deducting transport costs, treatment and refining charges, penalties and royalties.
OC/OP (Open-cut/open-pit/open-cast)Surface working in which the working area is kept open to the sky.
164
Sou
th32
Ann
ual R
epor
t 20
21In
form
atio
n

Ore ReserveThe economically mineable part of a Measured and/or Indicated Mineral Resource.
It includes diluting materials and allowances for losses, which may occur when the material is mined or extracted and is defined by studies at Pre-feasibility or Feasibility level as appropriate that include application of Modifying Factors. Such studies demonstrate that, at the time of reporting, extraction could reasonably be justified (JORC Code).
PEngA licenced member of Professional Engineers of Ontario (PEO).
Probable Ore ReserveThe economically mineable part of an Indicated and, in some circumstances, a Measured Mineral Resource. The confidence in the Modifying Factors applying to a Probable Ore Reserve is lower than that applying to a Proved Ore Reserve (JORC Code).
Proved Ore ReserveThe economically mineable part of a Measured Mineral Resource. A Proved Ore Reserve implies a high degree of confidence in the Modifying Factors (JORC Code).
Pr.Sci.Nat.Professional Natural Scientist of the South African Council for Natural Scientific Professions.
Reserve LifeThe scheduled extraction period in years for the Total Ore Reserves in the approved Life of Operation Plan reported to two significant figures.
ROM (Run of Mine product)Product mined in the course of regular mining activities.
SACNASPSouth African Council for Natural Scientific Professions.
SAIMMSouthern African Institute of Mining and Metallurgy.
SandsTailings produced as a by-product during beneficiation of ore.
Stockpile (SP)An accumulation of ore or mineral built up when demand slackens or when the treatment plant or beneficiation equipment is incomplete or temporarily unable to process the mine output; any heap of material formed to create a buffer for loading or other purposes, or material dug and piled for future use.
TailingsThose portions of washed or milled ore that are too poor to be treated further or remain after the required metals and minerals have been extracted.
Total Ore ReservesThe sum of Proved Ore Reserves and Probable Ore Reserves.
Total Mineral ResourcesThe sum of Inferred Mineral Resources, Indicated Mineral Resources and Measured Mineral Resources.
Transitional climate change risksNon-physical risks arising from changes to policy, technology, legal and markets as the world moves to a low-carbon energy system, in line with the Paris Agreement objectives.
UGUnderground working in which the working area is below the surface of the earth.
YieldThe percentage of material of interest that is extracted during mining and/or processing. A measure of mining or processing efficiency (JORC Code). When used in reference to the Mineral Resource estimate yield refers to the sample mass recovery following beneficiation.
Finance, marketing and general termsAASBAustralian Accounting Standards Board.
Adjusted return on invested capital (Adjusted ROIC)Calculated as Underlying EBIT, adjusted for uncontrollable and one-off impacts in the current financial year, less the discount on rehabilitation provisions included in net finance cost, tax effected by the Group’s prior period Underlying effective tax rate (ETR) including our manganese equity accounted investments on a proportional consolidated basis, divided by the sum of fixed assets (excluding any rehabilitation asset, the impairment of Illawarra Metallurgical Coal and our equity accounted manganese alloy smelters, and unproductive capital associated with Growth and Life extension projects) and inventories. Our manganese equity accounted investments are included in the calculation on a proportional consolidation basis. Underlying EBIT is adjusted by excluding the current period impacts of foreign currency on revenue and cost, and commodity prices on revenue and associated price-linked costs, less the discount on rehabilitation provisions included in net finance cost, and tax effected by the Group’s prior period Underlying effective tax rate.
AGMAnnual General Meeting.
AOOfficer of the Order of Australia.
Australian Securities and Investments Commission (ASIC)The independent Australian Government body that is Australia’s integrated corporate, markets, financial services and consumer credit regulator.
ASXASX Limited or Australian Securities Exchange.
ASX Listing RulesThe rules governing the listing of an entity and the quotation of its securities on the ASX.
B-BBEEBroad-Based Black Economic Empowerment.
BHPBHP, formerly known as BHP Billiton, is the group of companies headed by, and including, BHP Group Ltd and BHP Group plc.
Black PeopleAs defined in the Broad-Based Black Economic Empowerment Amendment Act 2013 (South Africa), a generic term meaning Africans, Coloureds and Indians who are citizens of the Republic of South Africa by birth or descent; or who become citizens of the Republic of South Africa by naturalisation before 27 April 1994 or on or after 27 April 1994 and who would have been entitled to acquire citizenship by naturalisation prior to that date.
BoardThe Board of Directors of South32 Limited.
165S
outh32 Annual R
eport 2021
Information

Finance, marketing and general terms continuedCarbon emissions (also referred to as Greenhouse gas (GHG) emissions)For our reporting purposes, these are the aggregate carbon dioxide equivalent (CO2-e) emissions of carbon dioxide (CO₂), methane (CH₄), nitrous oxide (N₂O), hydrofluorocarbons (HFCs), perfluorocarbons (PFCs) and sulphur hexafluoride (SF₆).
We measure and report emissions according to local jurisdictional requirements and the World Resources Institute/World Business Council for Sustainable Development Greenhouse Gas Protocol, which includes:
– Scope 1 carbon emissions that are direct carbon emissions from our own operations, including the electricity we generate at our sites;
– Scope 2 carbon emissions that are indirect carbon emissions from the generation of purchased electricity; and
– Scope 3 carbon emissions that are carbon emissions in our supply chain.
CEOChief Executive Officer.
CFOChief Financial Officer.
Community investmentContributions made to support communities that we operate in, or have an interest in. Our contributions to community programs comprise direct investment, in-kind support and administrative costs.
ContractorAny organisation or individual (other than a South32 employee) who provides labour to South32 pursuant to a contract for service.
Cost, Insurance, and Freight (CIF)A contractual term defining responsibilities and division of cost and risk between buyer and seller, in which the seller is responsible for clearing the goods for export and bears the cost of freight and insurance to the named port of destination. The buyer assumes all risks and costs for unloading the goods and clearing the goods for import. Risk passes from seller to buyer once the goods are on board the vessel at the port of shipment.
CO2-eCarbon dioxide equivalent.
COOChief Operating Officer.
Corporations ActCorporations Act 2001 (Cth).
Commodity Price Protocol (CPP)Refers to the long-term commodity price forecasts used internally within South32. There is a governance process to ensure that a consistent set of macroeconomic assumptions are used to develop the commodity prices to be applied across South32.
COVID-19Is an infectious coronavirus disease which causes respiratory illness. On 11 March 2020 the World Health Organization declared the COVID-19 outbreak a pandemic affecting many countries globally.
DemergerThe separation of assets from BHP effected in May 2015 to create a separate entity South32 Limited, listed on the ASX, LSE and JSE.
DTRUK Financial Conduct Authority’s Disclosure Guidance and Transparency Rules. A reference to DTR followed by a number is a specific rule under the DTR.
EBITEarnings before interest and tax.
EBITDAEarnings before interest, tax, depreciation and amortisation.
Effective tax rate (ETR)Income tax expense/benefit divided by profit/loss subject to tax; both the numerator and denominator exclude equity accounted investments.
EmployeeAny person in full-time, part-time or casual employment engaged by South32 on a temporary or permanent basis pursuant to a contract of service.
ESGEnvironmental, social and governance.
ESOP TrustsThe trusts which purchase and hold South32 Limited shares for the purpose of the South32 Equity Incentive Plans. South32 has an Australian ESOP Trust and South African ESOP Trust for employees located in the respective countries.
Executive KMPLead Team members who are classified as KMP.
External AuditorKPMG.
FatalityA health or safety event where an injury or occupational illness has caused the death of one or more person(s).
Free On Board (FOB)A contractual term defining responsibilities and division of cost and risk between buyer and seller, in which the seller is responsible for clearing the goods for export and loading them on board the vessel at the named port of shipment. The buyer assumes all risks and costs for goods from this moment forward.
Free cash flowFree cash flow before interest and tax represents operating cash flows including dividends received from equity accounted investments, before financing activities and tax, and after capital expenditure.
FXForeign exchange.
FYXXRefers to the financial year ending 30 June 20XX, where XX is the two-digit number for the year.
GearingThe ratio of net debt to net debt plus net assets.
Global Reporting Initiative (GRI)GRI is an international independent organisation that has established an international framework and standards for sustainability reporting. South32 prepares our Group-level annual Sustainable Development Report in accordance with the GRI Sustainability Reporting Standards (Core option) and the GRI Mining & Metals Sector Supplement.
GroupRefers to South32 Limited and its subsidiaries and operated joint arrangements.
HSECHealth, safety, environment and community.
Indigenous and Tribal PeoplesWe use the defined term “Indigenous and Tribal Peoples” as per the definition and guidance set out in the Indigenous and Tribal Peoples Convention, 1989 (No. 169). We use this term inclusively to encompass the diversity of worldwide Indigenous and Tribal Peoples, including but not limited First Nations, Native Americans, Traditional Owners, Aboriginal and Torres Strait Islander Peoples and other land-connected communities. We recognise that no single definition can fully capture the diversity of Indigenous and Tribal Peoples.
International Council on Mining and Metals (ICMM)ICMM is an international organisation dedicated to improving the social and environmental performance of the mining and metals industry. As a corporate member, South32 commit to implementing and reporting on the ICMM Mining Principles, which define environmental, social and governance requirements. South32 participates on the ICMM and various working groups.
International Financial Reporting Standards (IFRS)Accounting standards as issued by the IASB (International Accounting Standards Board).
JSEJohannesburg Stock Exchange.
Just TransitionA fair, equitable and inclusive social transition towards a low-carbon economy.
KMPKey management personnel are people who have authority and responsibility for planning, directing and controlling the activities of South32 either directly or indirectly.
LBMALondon Bullion Market Association.
Lead TeamAll Chief positions within South32.
LMELondon Metal Exchange.
LSELondon Stock Exchange.
LTILong-term incentive.
Glossary of terms and abbreviations continued
166
Sou
th32
Ann
ual R
epor
t 20
21In
form
atio
n

Management rolesManagement Roles are Leaders with an identified job grading based on the requirements of their role and salary rate of 13 or higher.
Margin on third party productsComprises Underlying EBIT on third party products and services, divided by revenue on third party products and services.
MaterialityMateriality is the threshold at which an issue or topic becomes sufficiently important that it should be reported. Beyond this threshold, not all material topics will be of equal importance and the emphasis should reflect the relative priority of these material topics and indicators.
Modern SlaveryModern slavery is used as an umbrella term to include the legal concepts of forced labour, debt bondage, forced marriage, slavery and slavery-like practices, and human trafficking. Essentially, it refers to situations of exploitation that a person cannot refuse or leave because of threats, violence, coercion, deception, and/or abuse of power (Walk Free Foundation).
MRN (non-operated joint venture)Mineração Rio do Norte.
MSCIMorgan Stanley Capital International.
Net cashComprises cash and cash equivalents less interest bearing liabilities.
Net debtComprises interest bearing liabilities, less cash and cash equivalents.
Net operating assetsRepresents operating assets net of operating liabilities which predominantly excludes the carrying value of equity accounted investments, cash, interest bearing liabilities, tax balances and certain other financial assets and liabilities.
Occupational Exposure Limit (OEL)The concentration of a substance or agent, exposure to which, according to current knowledge, should not cause adverse health effects nor cause undue discomfort to nearly all workers.
Occupational illnessAn occupational illness is any abnormal condition or disorder, other than one resulting from an occupational injury, caused or aggravated by exposures to factors associated with employment. It includes acute or chronic illnesses or diseases which may be caused by inhalation, absorption, ingestion or direct contact.
Occupational Safety and Health Administration (OSHA)The OSHA of the United States Department of Labor. We adopt these guidelines for the recording and reporting of occupational injuries and illnesses to ensure that classifications are applied uniformly across our workforce.
Operating unit costOperating unit cost is Revenue less Underlying EBITDA divided by sales volume.
Operational carbon emissionsScope 1 and 2 carbon emissions from our operated assets.
Operational Leadership TeamAll General Managers and Managers reporting to Vice President Operations, and all Managers reporting to General Managers at an operation. Excludes: Functional Managers (such as Human Resources, Finance and Supply).
Our PeopleAs defined in our Code of Business Conduct – Our People includes South32 Directors, executive management, employees and contractor staff (e.g. labour hire, temporary or agency staff, and secondees).
Paris AgreementA global climate agreement that was agreed under the United Nations Framework Convention on Climate Change (UNFCCC) at the 21st Conference of the Parties in Paris (30 November to 12 December 2015). The Paris Agreement sets in place a durable and dynamic framework for all countries to take climate action from 2020, building on existing international efforts in the period up to 2020.
Recordable illnessesThe sum of work-related (fatalities + permanent impairment >30 per cent of body + lost time illnesses + restricted work illnesses + medical treatment illnesses).
Recordable injuriesThe sum of work-related (fatalities + permanent impairment >30 per cent of body + lost time injuries + restricted work injuries + medical treatment injuries).
Return on invested capital (ROIC)Calculated as Underlying EBIT less the discount on rehabilitation provisions included in net finance cost, tax effected by the Group’s Underlying effective tax rate (ETR) including our manganese equity accounted investments on a proportional consolidated basis, divided by the sum of fixed assets (excluding any rehabilitation asset, the impairment of Illawarra Metallurgical Coal and our equity accounted manganese alloy smelters, and unproductive capital associated with Growth and Life extension projects) and inventories. Our manganese equity accounted investments are included in the calculation on a proportional consolidation basis.
Senior Leadership TeamPresidents and Vice Presidents reporting to members of the South32 Lead Team.
Shared valueThe identification of opportunities that create economic value while also advancing the environmental and social outcomes of the communities and regions in which we operate.
South32 Equity Incentive PlanAn equity incentive plan that allows the Board to make offers to employees to acquire securities in South32 Limited and to otherwise incentivise employees.
S&P 500Standard and Poor's 500.
STIShort-term incentive.
Sustainable developmentDefined as supporting the needs of the present without compromising the ability of the future generations to meet their own needs.
Total Recordable Injury Frequency (TRIF)(The sum of recordable injuries x 1,000,000)÷ exposure hours. This is stated in units of per million hours worked for employees and contractors. We adopt the United States Government Occupational Safety and Health Administration (OSHA) guidelines for the recording and reporting of occupational injuries and illnesses.
Total Recordable Illness Frequency (TRILF)(The sum of recordable illnesses x 1,000,000)÷ exposure hours, for employees and contractors. This is stated in units of per million hours worked for employees and contractors. We adopt the United States Government Occupational Safety and Health Administration (OSHA) guidelines for the recording and reporting of occupational injuries and illnesses.
Total Shareholder Return (TSR)TSR measures the return delivered to shareholders over a certain period through the change in share price and any dividends paid. It is the measure used to compare our performance to that of relevant peer groups under the LTI.
TransformationA national strategy in South Africa aimed at attaining national unity, promoting reconciliation through negotiated settlement and non-racism.
TSXToronto Stock Exchange.
Underlying earningsUnderlying earnings is profit after tax and earnings adjustment items. Earnings adjustments represent items that don’t reflect our underlying operations. We believe that Underlying earnings provides useful information, but shouldn’t be considered as an indication of, or an alternative to, profit or attributable profit as an indicator of operating performance.
Underlying EBITUnderlying EBIT is profit before net finance costs, tax and after any earnings adjustment items, impacting profit. It’s reported inclusive of our share of net finance costs and tax of equity accounted investments. It isn’t an IFRS measure of profitability, financial performance or liquidity and may be defined and used in differing ways by different entities. We believe that Underlying EBIT provides useful information, but shouldn’t be considered as an indication of, or alternative to, profit or attributable profit as an indicator of operating performance.
Underlying EBIT marginComprises Underlying EBIT excluding third party product EBIT, divided by revenue excluding third party product revenue.
167S
outh32 Annual R
eport 2021
Information

Finance, marketing and general terms continuedUnderlying EBITDAUnderlying EBIT before depreciation and amortisation.
Underlying EBITDA marginComprises Underlying EBITDA excluding third party product EBITDA, divided by revenue excluding third party product revenue.
Underlying effective tax rate (ETR)Underlying income tax expense/benefit divided by underlying profit/loss subject to tax; both the numerator and denominator exclude equity accounted investments.
Workplace Gender Equality Act 2012Australian legislation which aims to improve and promote equality for both women and men in the workplace.
Terms used in resources and reservesA.Al₂O₃available alumina
Agsilver
Augold
Cucopper
CVcalorific value
Feiron
Metmetallurgical coal
Mnmanganese
Ninickel
OCopen-cut/open-pit/opencast
Pblead
R.SiO₂reactive silica
Ssulphur
Ththermal coal
UGunderground
VMVolatile Matter
ZnZinc
Units of measure%percentage or per cent
dmtdry metric tonne
dmtudry metric tonne unit
g/tgrams per tonne
hahectare
Kcal/kgkilo calories per kilogram
kdmtthousand dry metric tonne
kLkilolitre
kmkilometre
kozthousand ounces
ktkilotonnes
ktCO2-ekilotonnes of carbon dioxide equivalent
ktpakilotonnes per annum
kWkilowatt
kwmtthousand wet metric tonnes
mmetre
MLmegalitre
Mozmillion ounces
Mtmillion tonnes
Mtpamillion tonnes per annum
ozounce
ttonnes
tpatonnes per annum
tpdtonnes per day
tphtonnes per hour
US$/lbUS dollars per pound
US$/ozUS dollars per ounce
Glossary of terms and abbreviations continued
168
Sou
th32
Ann
ual R
epor
t 20
21In
form
atio
n

Group Headquarters (Registered Office)Level 35 108 St Georges Terrace Perth 6000 Western Australia
Telephone: +61 8 9324 9000 Facsimile: +61 8 9324 9200 Email: [email protected]
South Africa Office39 Melrose Boulevard Melrose Arch Johannesburg 2076
PO Box 61820 Marshalltown 2107
Telephone: +27 11 376 2000
Singapore Marketing Office16 Collyer Quay Unit #18-00 Income at Raffles Singapore 049318
Telephone: +65 6679 2600
London Marketing Office7 Albemarle Street London W1S 4HQ United Kingdom
Telephone: +44 20 7798 1700
North America OfficeSuite 1850 1066 West Hastings Street Vancouver V6E 3X1 British Columbia Canada
Telephone: +1 604 915-5680
Share Registrars and Transfer OfficesContact details for the Company’s share registries in Australia, South Africa and the United Kingdom are included on page 163.
Information about the ADR Depositary, Transfer Agent and Registrar can also be found on page 163.
Corporate directory
Printed copies of this Annual Report will only be posted to those shareholders who have requested a hard copy. Other shareholders are notified by email when the Annual Report becomes available and given details of where to access it electronically.
This Annual Report is printed on paper that is FSC® (Forest Stewardship Council) certified and
manufactured from plantation-grown timber.
Both the paper manufacturer and printer are certified to the highest possible internationally recognised
standard for environmental management.
