food waste in sa - the magnitude, cost and impacts waste... · food waste in sa - the magnitude,...
TRANSCRIPT

Food waste in SA - The Magnitude, Cost and
Impacts
Presentation by Dr Suzan Oelofse
Research Group Leader: Waste for Development
Competency Area: Solutions for a Green Economy
Operating Unit: Natural Resources and the Environment
SAAFoST Lecture 27 March 2014

Motivation for the research
© CSIR 2014 www.csir.co.za Slide 2
• Food is treated as a disposable commodity
• Almost one in seven people globally are estimated to be
undernourished
• Food waste has a triple negative effect:
• It impacts on food security
• Resources used in food production and distribution are wasted
• Environmental impacts throughout the supply chain
It is estimated that globally between 30-50% of food
produced is wasted before reaching consumers

Motivation for the research
© CSIR 2014 www.csir.co.za Slide 3
• Availability of water is the limiting factor to agricultural production
in South Africa (DAFF, 2012)
• South Africa is a water scarce country (30th driest in the world)
• Irrigated agriculture is the largest user of water in South Africa
• 62% of available water is used for irrigation
• 30% of crops is produced through irrigation
• About 90% of fruit, vegetables and wine are produced under irrigation
• 46% of South African agricultural production is for export markets (2009)
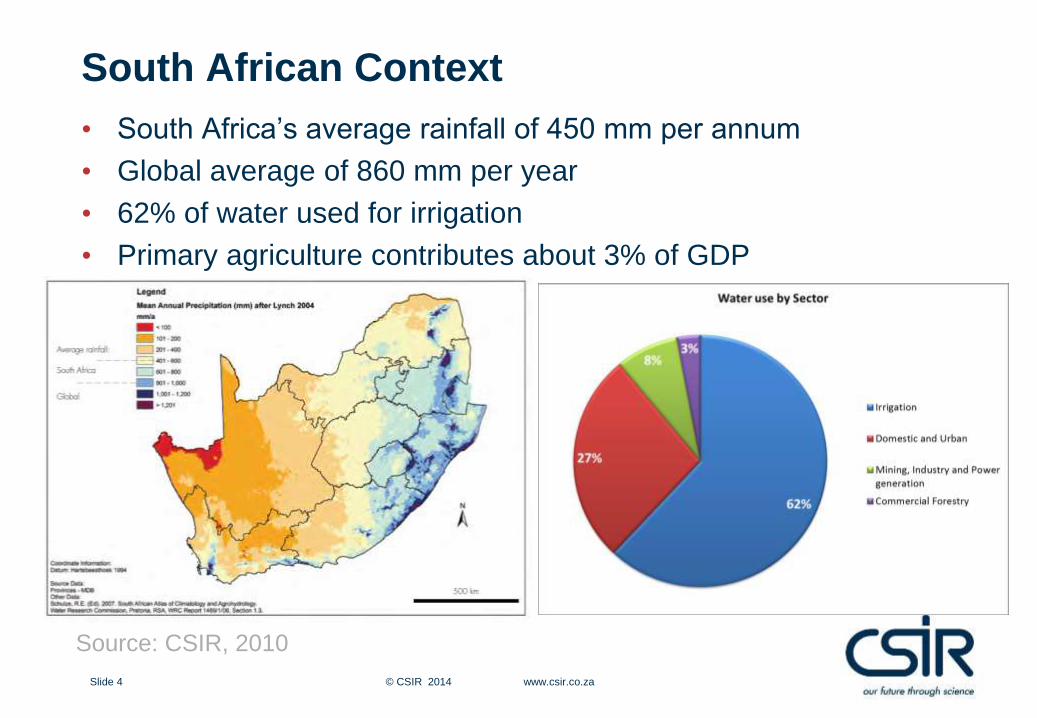
South African Context
© CSIR 2014 www.csir.co.za Slide 4
• South Africa’s average rainfall of 450 mm per annum
• Global average of 860 mm per year
• 62% of water used for irrigation
• Primary agriculture contributes about 3% of GDP
Source: CSIR, 2010

South Africa’s agri-food exports (% by volume)(2009)
© CSIR 2014 www.csir.co.za Slide 5
Source: International Trade Centre, 2010

Destinations of South African agri-foods (2009)
(% by volume)
© CSIR 2014 www.csir.co.za Slide 6
Source: International Trade Centre, 2010

Estimated waste percentage for each
commodity group in each step of the food
supply chain for sub-Saharan Africa
© CSIR 2014 www.csir.co.za Slide 7
Commodity
group
Agricultural
production
Post harvest
handling and
storage
Processing
and
packaging
Distribution Consumption
Cereals 6.0% 8.0% 3.5% 2.0% 1.0%
Roots and
Tubers 14.0% 18.0% 15.0% 5.0% 2.0%
Oil seeds &
Pulses 12.0% 8.0% 8.0% 2.0% 1.0%
Fruits and
Vegetables 10.0% 9.0% 25.0% 17.0% 5.0%
Meat 15.0% 0.7% 5.0% 7.0% 2.0%
Fish and
Seafood 5.7% 6.0% 9.0% 15.0% 2.0%
Milk 6.0% 11.0% 0.1% 10.0% 0.1%

Calculated wastage based on SA production
statistics
© CSIR 2013 www.csir.co.za Slide 8
Commodity
group
Product
ion
2007-
2009
(ave)
(1000 t)
Waste (1000 Tonnes)
Agricultural
production
Post harvest
handling and
storage
Proces
sing
and
packagi
ng
Distribu
tion
Pre-
consum
er
waste
Consu
mption
Total
waste
per
comm
odity
group
Cereals 13154 789.3 989 398 220 2396 108 2504
Roots and
Tubers 2017 282.4 312 213 60 869 23 892
Oil seeds &
Pulses 453 54.4 32 29 7 122 3 126
Fruits and
Vegetables 8230 823.0 667 1685 859 4034 210 4244
Meat 1587 238.1 9 67 89 404 24 427
Fish and
Seafood 224 12.8 13 18 27 71 3 74
Milk 3119 187.1 323 3 261 773 2 775
Total per stage
of the food
supply chain
28785 2387.0 2344.6 2413.4 1523.0 8668.2 372.7 9040.9

Magnitude of food waste in SA
© CSIR 2014 www.csir.co.za Slide 9
Food waste from local production only
= 9.04 million tonnes per annum
= 31.4% of average annual production
Food waste from local production + imports – exports
= 10.2 million tonnes per annum
Cost of food waste in SA
© CSIR 2014 www.csir.co.za Slide 10
Total cost throughout the value chain = R 61.5 billion
Equivalent to 2.1% of South Africa’s GDP
• Costs are purely based on market prices
• Disposal costs are not included in this total

Cost of food waste in each stage of the value
chain for each commodity in SA
© CSIR 2014 www.csir.co.za Slide 11

Relative contribution of each commodity group
to total food waste generated in SA
© CSIR 2014 www.csir.co.za Slide 12
% of Waste % of Cost

Relative contribution of each stage in value
chain to total food waste generated in SA
© CSIR 2014 www.csir.co.za Slide 13
% of Waste % of Cost

Calculating water loss per commodity group
© CSIR 2014 www.csir.co.za Slide 14
Commodity
group
Agricultural
production
(1000 t)*
Total food
waste
(1000 t)*
Water use
(m3/t)
+
Water loss
(million m3)
Contribution
to water loss
(%)
Cereals 13140 2605 1600 4168 32.0
Roots and Tubers 2015 955 400 382 3.0
Oil seeds & Pulses 1198 346 3024 1046 8.0
Fruits and
Vegetables
8463 4491 685 3076 24.0
Meat 2549 753 4427 3334 26.0
Fish and Seafood 673 225 0 0 0.0
Milk 3102 831 1020 848 7.0
Total 31140 10205 1288 12854 100
*Nahman and de Lange, 2013 +Mekonnen and Hoekstra, 2013

Water use during production vs water loss
resulting from food waste
© CSIR 2014 www.csir.co.za Slide 15

Percentage contribution per commodity group
in South Africa
© CSIR 2014 www.csir.co.za Slide 16

Water loss due to food waste compared to the
water footprint of crop production in South
Africa
© CSIR 2014 www.csir.co.za Slide 17
0
5000
10000
15000
20000
25000
30000
35000
40000
45000
50000
Agriculturalproduction
Food waste
Mill
ion
m3
Water footprint (use)
Grey
Blue
Green

Conclusions
• The water footprint of a commodity is determined by local factors
at point of production
• The water loss as a result of food waste is determined by local
factors at point of consumption/wastage
• The total water loss as a result of food waste in South Africa is
equivalent to nearly 22% of the total water footprint
• The cost impacts of fruit and vegetables are the highest (42%)
followed by meat (32%)
• Water loss as a result of wasting cereals is the highest (32%)
followed by meat (26%)
• Water use with respect to agricultural production and associated
food waste appears to be highly inefficient – possible area of
intervention
© CSIR 2014 www.csir.co.za Slide 18

Responding to the problem
• Massive reductions in food wasted across the food supply chain
is needed
• Interventions should focus on:
1. Processing and packaging of fruit and vegetables
2. Distribution of fruit and vegetables
3. Production and distribution of meat
• Alternative waste treatment technologies must be considered
• Energy production
• Composting
• Source of valuable functional compounds such as antioxidants
© CSIR 2014 www.csir.co.za Slide 19
