food subsidies and direct social assistance- towards better targeting ... · food subsidies and...
TRANSCRIPT


Food Subsidies and Direct Social Assistance: Towards Better Targeting of Monetary Poverty and Deprivations in Tunisia
A f r i c a n D e v e l o p m e n t B a n k
2
Final Draft – 30 March 2013 – This version reflects only the views of the Authors
Authors: Mohamed Ayadi (Expert, African Development Bank), Vincent Castel (Chief Country Economist, African Development Bank),
Laurence Lannes (Principal Health Economist, African Development Bank), Kaouther Abderrahim (Economist, African Development Bank),
Samia Mansour (Economist, African Development Bank), Yassine Jmal. (Statistician, African Development Bank) & Nidhal Bencheikh
(Director, Centre for Research and Social Studies-CRES), under the overall guidance of Jacob Kolster (Director, ORNA).
Design and layoutThe African Development BankYASSO creation: Hela chaouachiE-mail: [email protected]

Food Subsidies and Direct Social Assistance: Towards Better Targeting of Monetary Poverty and Deprivations in Tunisia
A f r i c a n D e v e l o p m e n t B a n k
3
Table of contents
5 1. EXECUTIVE SUMMARY
8 2. INTRODUCTION
8 2.1 Overview of Poverty in Tunisia
10 2.2 Universal Food and Direct Transfers in Tunisia
10 2.2.1 Universal Food Subsidies
12 2.2.2 Direct Targeting
13 2.2.3 Scope of the Report
14 3. LESSONS LEARNED FROM INTERNATIONAL EXPERIENCE
14 3.1 Iranian Experience
14 3.2 Indian Experience
15 3.3 Moroccan Experience
15 3.4 Conclusions
16 4. DEFINITION OF A LIVING STANDARDS INDEX TO IDENTIFY THE BENEFICIARIES OF DIRECT TRANSFERS
16 4.1 Introduction: Targeting Deprivation or Poverty?
17 4.2 FIRST APPROACH-Definition of a Basic Deprivation and Living Conditions Index
17 4.2.1 Selection of Deprivation Indicators – A Descriptive Approach
21 4.2.2 Automatic Inclusion Criteria
22 4.2.3 Preparation of an Initial Overall Household Classification Index
23 4.2.4 Limitations of the Descriptive Approach
23 4.3 SECOND APPROACH-Optimization of Index Performance Using the Multiple Deprivation Method
24 4.3.1 Formulation of the Index on the basis of a Multiple Deprivation Score
25 4.3.2 Results of the Multiple Deprivation Approach
25 Overall Analysis
25 a. Analysis using the Deprivation Index
26 Analysis by Region
26 a. Regional Disparities
27 b. Deprivation Rate by Region versus the Monetary Poverty Rate
`28 Analysis by Area
28 Analysis by Degree of Disability and Professional/Vocational Qualifications
29 4.4 THIRD APPROACH-Optimization of Index Performance by Proxy Means Tests
31 4.5 FOURTH APPROACH-Combination of the Proxy Means Test and Mulitple Deprivation Method
31 4.5.1 Description
31 4.5.2 Performance of the Proposed Indicator

Food Subsidies and Direct Social Assistance: Towards Better Targeting of Monetary Poverty and Deprivations in Tunisia
A f r i c a n D e v e l o p m e n t B a n k
4
33 5. DETERMINATION OF THE BENEFIICIARY ALLOCATION LEVEL
33 5.1 Proposed Method
33 5.2 Theoretical Performance in Terms of Poverty Reducation
35 6. PUBLIC POLICY PROPOSALS
37 6.1 OPTION 1: Modification of Procedure for Allocation of Direct Transfers and Related Budget
41 6.2 OPTION 2: Modification of Direct Transfer Method and Budget Allocated to Food Subsidies
44 6.3 OPTION 3: Subsidies Abolished and Part of Subsidy Budget Allocated to PNAFN
47 6.4 OPTION 4: Part of Subsidy Budget Allocated to PNAFN and Total Budget Remaining Constant
50 6.5 OPTION 5: Subsidy Budget Varying and Part is Allocated to PNAFN
59 6.6 OPTION 6: Some Food Products are no Longer Subisidized and the Gains are Partly Transfered to PNAFN and Other Subsidies
64 7. CONCLUSIONS
66 ANNEXE I: Direct Targeting Statistics
67 ANNEXE II: The Indian Experience
70 ANNEXE III: Statistical Prerequisites for Direct Targeting
71 ANNEXE IV: Econometric Estimation
73 ANNEXE V: Optimization of Targeting by a Multiple Deprivation Score
75 ANNEXE VI: Assessment of Impact of Existing Indirect Subsidies on Basis of two Standard of Living Classifications
76 ANNEXE VII: Social Assistance Transmission Channels
79 ANNEXE VIII: Detailed Results of Impact of Abolition of Subsidies on Targeted Products and the Transfer of partor all of budget to PNAFN
Food Subsidies and Direct Social Assistance: Towards Better Targeting of Monetary Poverty and Deprivations in Tunisia
A f r i c a n D e v e l o p m e n t B a n k
5
1 http://www.commerce.gov.tn/Fr/presentation-de-la-caisse-generale-de-compensation_11_322 Analysis of the Impact of Food Subsidies and Social Assistance Programmes on the Poor and Vulnerable Segments of the Population. http://www.cres.tn/uploads/tx_wdbiblio/rapport_impact_des_subvention_01.pdf
The 2011 Revolution and ensuing social unrest highlighted the
inequalities in Tunisia and increasing social demands. The
expectations brought to the fore the issue of poverty and called into
question the performance of social transfer systems. Against this
backdrop, and based on the 2010-2011 household expenditure
survey, the National Institute of Statistics (INS) in collaboration with
the Center for Research and Social Studies (CRES) and international
partners including the African Development Bank (ADB) revealed
that 15.5% of the population was living below the poverty line
(BPL) in 2011.
Social transfers in Tunisia are conducted directly and indirectly.
Indirect (and universal) assistance is transferred through the General
Compensation Fund, established in May 1970 to control the prices
of certain food staples, in particular, cereal products1 by introducing
subsidies to contain price increases and preserve the purchasing
power of the most deprived segments of the population. Targeted
assistance is transferred through the National Programme of
Assistance to Needy Families (PNAFN), Free Medical Assistance
(AMG1) and the Programme for Access to Reduced-Price Health
Care (AMG2). Beneficiaries are identified through field surveys
organized by the Department of Social Advancement at the
Ministry of Social Affairs.
In 2013, the INS, CRES and ADB carried out an initial analysis2 of
the impact of food subsidies and direct social transfers on the poor
and vulnerable segments of the population. This study concluded
that the existing consumption subsidy system had fairly significant
redistributory effects in favour of the poorest sections of society,
However, the universal nature of food subsidies seriously undermines
the effectiveness of this instrument as a mechanism to reduce
inequalities and poverty. While recommending the transfer of
resources allocated to universal subsidies towards targeted social
assistance programmes, the study underscored, with respect to the
PNAFN and AMG2 programmes, the existence of fairly significant
exclusion and inclusion indicators. Only 48.9% of the beneficiaries
of at least one of the programmes are poor and only 51% of the
poor are enrolled in the PNAF or AMG2.
Improving the performance of social transfers is particularly
important as the relative volume of these transfers in the Tunisian
government’s budget has considerably increased in recent years.
This rise is partly due to the hike in the prices of subsidized products
on the international markets and also to the need to meet social
expectations in the transition context.
In this context, social programme administrators must meet a
dual objective: to alleviate poverty and reduce inequalities while
optimizing the budget allocated to them for the purpose.
This report proposes an initial analysis of ways to optimize direct
transfers in order to fine-tune the social transfer procedures
adopted by the Ministry of Social Affairs. This report draws on the
lessons learned from international experience, in particular, the
Iranian, Indian and Moroccan experiences.
Theoretically, in order to achieve this objective, it is necessary to
first define an aggregate indicator of living standards.
It will then be necessary to define the amount(s) of transfers to
households that will result in a significant reduction in the number
of needy people.
Furthermore, the decision-maker may, after optimizing the direct
transfer procedure, try to revise/reallocate the budgets allocated to
the different transfer programmes, in order to enhance the efficacy
of the social action. This report will explore different public policies.
First, the report stresses the fundamental idea that decision-makers
in Tunisia do not always share the same understanding of what a
1. EXECUTIVE SUMMARY
Food Subsidies and Direct Social Assistance: Towards Better Targeting of Monetary Poverty and Deprivations in Tunisia
A f r i c a n D e v e l o p m e n t B a n k
6
3 Analysis of the Impact of Food Subsidies and Social Assistance Programmes on the Poor and Vulnerable Segments of the Population http://www.cres.tn/uploads/tx_wdbiblio/rapport_impact_des_subvention_01.pdf
potential beneficiary is. The large majority of decision-makers and
the population define a potential beneficiary as being a poor person
in the monetary sense of the term, i.e. an individual with a low
income below a fixed value. This is readily understandable, since
the poverty indicators communicated by the INS are calculated
using that logic. However, the existing direct social transfer system
is based more on the notion of deprivation, which is closer to multi-
dimensional poverty. The beneficiary is not defined in terms of
income or consumption, but by a set of factors reflecting the
constraints on his/her way of life and living standards. Since these
two interpretations are not one hundred percent interchangeable,
the decision-maker must be selective. This report proposes a
methodology that will optimally meet this dual objective (monetary
poverty and deprivation).
Four approaches are considered in this study. To facilitate their
adoption, these approaches rely on the existing context. They use
easily observable and non-modifiable indicators during the
operation to identify poor people carried out by the social worker,
while ensuring a careful estimation of the living conditions of
individuals or households concerned by social assistance. 15 living
standard indicators are used that take into account the many
deprivations households are reported to suffer from. They synthesize
three household living standard criteria: (1) living conditions
(including housing), (2) the capacity of household members to
generate a decent income. (3) The burden borne by active
household members. All these indicators may be easily assessed
by government representatives in the field during household surveys.
These approaches are also based on internationally recognized
methodologies such as the multiple deprivation method and the
Proxy Means Test method. These approaches take into account the
interdependence of the impacts of the 15 indicators, household
behaviours, and the heterogeneity associated with different milieus
and regions of residence and which may aggravate targeting
errors.
The analysis has retained the approach which best combines
the objective of reducing deprivation and reducing poverty.
The methodology then proposed to determine the allocation made
to the beneficiary will thus help to ensure a better allocation of
resources to those at the bottom of the list, in particular those
suffering from multiple deprivations and/or extreme poverty.
To conclude the report, a series of public policy scenarios is
presented. These scenarios analyze the impact on poverty of i) a
change in the budgetary envelope allocated to the CGC and the
PNAFN ii) trade-offs between direct and indirect transfers if the
procedure presented in this report is adopted, which will allow us
to create a model that will serve as a basis for determining
transfers and the government budget allocated for that purpose.
The results underscore the effectiveness of the approach.
Without affecting the subsidies, the new targeting procedure will
result in an extreme poverty rate of 1.5% even after a 50% reduction
in the PNAFN budget. With a constant PNAFN budget, the new
targeting procedure would eradicate extreme poverty and lower
the poverty rate to 8%. If the PNAF budget remains unchanged,
households affected by extreme poverty would receive 2525.6
dinars (47 dinars per person per month, if we consider that the
standard family size is 4 to 5 persons) per year for all transfers
combined, i.e. 2276.8 dinars (equivalent to an increase of 42 dinars
per person per month) more than using the existing method. The
poorest segments of the population would then receive 52% of the
total budget allocated to direct and indirect transfers.
The use of this new procedure would also help to eradicate
extreme poverty while abolishing food subsidies. The number of poor
households would, in that case, remain virtually stable at 16%.
However, it is worth noting that if the food subsidy budget is
reallocated to PNAFN, the results will be spectacular. Transferring the
entire subsidy budget to PNAFN using the new targeting method
would bring down the extreme poverty rate to 0% and the poverty
rate to 4.1%.
Finally, in a context where dialogue on subsidies could be difficult, it
might be possible to abolish subsidies on a number of products,
starting with those on products that have been identified as having
little impact on poverty3. These analyses show that, with close
monitoring, several objectives may be reconciled: eradicating extreme
poverty, reducing poverty and preserving part of the subsidies, in

Food Subsidies and Direct Social Assistance: Towards Better Targeting of Monetary Poverty and Deprivations in Tunisia
A f r i c a n D e v e l o p m e n t B a n k
7
particular, those which have a confirmed distributory effect, while
abolishing the least effective ones in order to minimize the impact on
the purchasing power of the other population segments.
However, the policy scenarios presented in this report, which
explore different combinations of budget allocation and reduction, all
concur that nothing justifies the maintenance of indirect subsidies if
the main objective is to reduce poverty. No public policy scenario
results in a stronger performance than the abolition of subsidies and
the reallocation of the related budget to direct transfers.

Food Subsidies and Direct Social Assistance: Towards Better Targeting of Monetary Poverty and Deprivations in Tunisia
A f r i c a n D e v e l o p m e n t B a n k
8
2.1 Overview of Poverty in Tunisia
The study on the levels of monetary poverty and inequality in
Tunisia (conducted by the INS in collaboration with the ADB
and WB in 2012/2013 ) estimated the poverty rate at 15.5 % in 2010
and the extreme poverty rate at 4.6%. However, these rates vary
significantly depending on geographical criteria (areas and regions)
and social criteria (socio-professional categories and education levels)
–Box 1–.
Analysis by Area: Poverty rates vary according to the level of
urbanization. The monetary poverty rate in rural areas is 22.6%
compared to only 9% in the major towns and cities. Extreme poverty
is 1.3% in the major towns and cities compared to 9.2% in rural areas,
i.e. seven times higher.
Analysis by Region: With poverty rates above 20%, the regions
of the West are more disadvantaged than those of the East. The
economic centres, in particular, Greater Tunis and the Sahel Region,
where a high proportion of job applications are concentrated, have
poverty rates below 10%.
At first sight, geographical targeting could be envisaged to reduce
poverty levels and reduce inter-area and inter-regional disparities.
However, poverty is also highly dependent on the socioeconomic
characteristics of households.
Analysis according to Socioprofessional Category (SPC): The
highest poverty rates are found in families where the heads are
unemployed (40.3% of poor people) and in families where the
breadwinners do not live in the household (28.9%). The second group
of households hardest hit by poverty is that where the household head
does not need qualifications and is subject to uncertainties, mainly the
vagaries of the weather or uncertainties regarding the economic
situation. In this second group, the poverty rates are above 24%.
Leading this group are households whose heads are farm workers
(28.9%) followed by those headed by non-farm workers (24.2%).
Analysis by Level of Education: The poverty rate drops as the level
of education improves. The poverty level is 23.4% in households
whose heads are uneducated. It falls to about 7.2%, where the
household head has had a secondary education and only 0.4% if
he/she has attended university.
2. INTRODUCTION
4 INS, ADB, WB (2013), ‘Measuring Poverty, Inequalities and Polarization in Tunisia, 2000-2010’.
Box 1: Poverty Rate in 2010
Areas Extreme Poverty Rate (%) Official Poverty Rate (%)
Major Towns and Cities 1.3 9.0
Average-Size Communes 2.9 14.0
Non-Communal Areas 9.2 22.6
Total 4.6 15.5

Food Subsidies and Direct Social Assistance: Towards Better Targeting of Monetary Poverty and Deprivations in Tunisia
A f r i c a n D e v e l o p m e n t B a n k
9
Regions Extreme Poverty Rate (%) Official Poverty Rate (%)
Greater Tunis 1.1 9.1
North-East 1.8 10.3
North-West 8.8 25.7
Centre-East 1.6 8.0
Centre-West 14.3 32.3
South-East 4.9 17.9
South-West 6.4 21.5
Total 4.6 15.5
Socio-Professional CategoriesExtreme Poverty
Rate (%)Official Poverty Rate
(%)
Senior Executives and Liberal Professionals 0 0.7
Middle-Level Executives and Liberal Professionals 0 3.6
Other Employees 1.3 8.4
Owner-operators of Small Trades in Industry, Commerce and Services 1.3 7.4
Craftspersons and Self-Employed persons in Industry, Commerceand Services
2.9 10.8
Non-Farm Workers 6.7 24.2
Farm Operators 6.7 20.0
Farm Workers 13.3 28.9
Unemployed 20.8 40.3
Pensioners 1.2 5.8
Other Non-Working Persons 4.1 15.2
Breadwinners resident outside Household 13.1 28.9
Total 4.6 15.5
Level of Education Extreme Poverty Rate (%) Official Poverty Rate (%)
No Education 8.4 23.4
Primary 4.7 18.1
Secondary 1.5 7.2
Higher 0.1 0.4
Total 4.6 15.5

Food Subsidies and Direct Social Assistance: Towards Better Targeting of Monetary Poverty and Deprivations in Tunisia
A f r i c a n D e v e l o p m e n t B a n k
10
5 In addition, the subsidy on vegetable oil is 50% of its cost price and sugar and milk were subsidized to the tune of 31.9% and 4.9% of their respective cost prices in 2011.6 Table 2.2 (Box 1) shows that the budgets allocated to indirect subsidies on food products reached significant proportions in the wake of the cereal product price hikes on theinternational market, then following a political decision by the President of the Republic to reduce the prices of these products in order to ease the social tensions that hadaffected Tunisia in early 2011.7 They are about TND 64 per person per year for poor households and TND 87 for non-poor households. They are TND 89 per person for households in the 3rd and 4th incomequintiles.8 On average, the subsidy received corresponds to 8.4% of the income of a first quintile household (average of 8.1% of poor peoples’ incomes) compared to an average of only3% of non-poor incomes and 1.5% of the income of a last quintile household.9 But what is really significant is the role played by this subsidy in stabilizing the living standards of the middle class which benefits from over 60% of the resources allocated bythe central government to indirect subsidies.
2.2 Universal Food Subsidies and Direct Transfers inTunisia
There are two types of instruments for social transfers in Tunisia.
One is the universal (or indirect) food subsidies for products mainly
consumed by the poorest people (at least theoretically) in order to
provide them with a minimum calorie intake at an affordable price,
without international price fluctuations drastically altering their
purchasing power. Subsidies also concern energy products but only
food subsidies are considered in this study. These are managed by
the General Compensation Fund (CGC).
There is also a direct transfer policy (the PNAFN or National
Programme of Assistance to Needy Families) for the poorest families,
involving the allocation of free health care cards or reduced-price
health care cards, and the allocation of monthly financial assistance
and assistance depending on the number of children enrolled in
school. The list of families eligible for such assistance is decided upon
by the Ministry of Social Affairs on the basis of social surveys
prepared for each family.
2.2.1 Universal Food Subsidies
The previous study, the results of which are presented in Box II,
analyzed the importance of indirect subsidies in the real price of
food products as well as their impacts on the Tunisian population’s
standards of living. Energy subsidies are not included in this analysis.
Modalities for Implementing Indirect Transfers by Food
Products: The CGC provides subsidies to producers and distributors
of basic commodities. These subsidies mainly concern cereal
products (large loaves, French bread (baguette), semolina, pasta and
couscous) in order to lower their prices and facilitate access to them
by the neediest, to help them meet their calorie requirements. In 2011,
subsidies on these products fluctuated between 30% of the cost price
for a loaf of French bread, which is mainly purchased by the non-poor,
and 56.3% for semolina, which is a product mostly purchased by
poor households5.
Budget Allocated to Indirect Transfers through Food Products:
The bulk of the budget allocated in 2011 by central government to
food subsidies was earmarked for cereal products (77%) and the
vegetable oil subsidy (19%). Subsidies represented 6% of public
expenditure and 1.87% of GDP in 20116.
Ineffectiveness of `indirect transfers through food product
subsidies: in absolute terms, food subsidies benefit the poorest
households less7. However, in relative terms, it is noted that these
subsidies represent a fairly high proportion of the income levels of the
poorest households8.
In addition to errors of targeting between the different social
categories, other targeting errors have been observed with the
diversion of 22.8% of subsidized foods from households (to
restaurants for example). Ultimately, the poor for whom the subsidy is
intended benefit from only 9.2% of the total allocated budget amount9.
The budgets originally allocated to food subsidies ought, therefore,
to be channeled through a more effective targeting policy directly
affecting the neediest families. However, this will require the
establishment of adequate direct transfer channels with the right
balance between the targeting costs and performance.

Food Subsidies and Direct Social Assistance: Towards Better Targeting of Monetary Poverty and Deprivations in Tunisia
A f r i c a n D e v e l o p m e n t B a n k
11
Box 2: Indirect Targeting – Food Subsidies
Table 2.1: Share of Subsidies in different Subsidized Products in 2010 (in millimes)
Selling Price Cost Price Subsidy Amount Subsidy Rate in %
Large Loaves (400 gr) 230 430 200 46.5%
French Bread (220 gr) 190 272 82 30.1%
Semolina (kg) 450 1030 580 56.3%
Flour (kg) 630 1190 560 47.1%
Processed Tomatoes (800g) 1600 1670 70 4.2%
Semi-Skimmed Milk (liter) 970 1020 50 4.9%
Couscous (kg) 795 1415 620 43.8%
Pasta (kg) 805 1425 620 43.5%
Seed Oil (liter) 900 1800 900 50.0%
Sugar (kg) 970 1420 450 31.7%
2005 2006 2007 2008 2009 2010 2011
Cereals and Cereal Products 170.9 239.5 474.2 873 687.3 466.7 887.4
Vegetable Oils 57.8 69 111.5 167.5 108.4 112,7 214.4
Milk 6.7 7.3 7.3 2.8 - - 23.1
Sugar - - - - - - 10.8
School Paper 7.7 5.6 5 4.6 4.3 4.3 4.3
Seed Oil (liter) - - - - - - 9.6
Others - - - - - - -
Total 243.1 321.4 598 1 047.9 800 730 1 149.6
Table 2.2: Trend of Compensation Costs for Food Products
2001 2002 2003 2004 2005 2006 2007 2008 2009 2010 2011
Total Costs 247.9 226.2 203.9 261.7 243.1 321.4 598 1 047.9 800 730 1 149.6
Source: Ministry of Commerce
Source: Ministry of Commerce
Source: Ministry of Commerce
Table 2.3: Trend of the Costs of the General Compensation Fund
Quintile 1 Quintile 2 Quintile 3 Quintile 4 Quintile 5 Total
Total Subsidies per capita/year 68.156 84.159 87.458 89.873 89.121 83.752
Total Expenditure per capita/year 815 1422 2008 2871 5890 2601
Indirect Transfer Rate 8.4% 5.9% 4.4% 3.1% 1.5% 3.2%
Table 2.4: Estimated Values of the Average Annual Subsidy per Capita in 2010/2011

Food Subsidies and Direct Social Assistance: Towards Better Targeting of Monetary Poverty and Deprivations in Tunisia
A f r i c a n D e v e l o p m e n t B a n k
12
2.2.2 Direct Targeting
The PNAFN Programme (National Programme of Assistance to
Needy Families) is being implemented under the responsibility of the
Department of Social Advancement at the Ministry of Social affairs.
It provides direct assistance to needy families selected by the
Department. This assistance is intended to improve families’ sanitary
and financial conditions.
Two criteria are used in establishing the list of the programme’s
beneficiary households. The first criterion is the death of the household
head or his/her inability to perform a professional activity/trade
due to a physical handicap, a chronic illness or old age. To meet this
first criterion, the household must not be receiving any assistance
from any other family member and must be in unacceptable living
conditions. This information is supposed to be obtained from the
social survey. Further details of the PNAFN programme are presented
in Annex VII.
The funds allocated to the PNAFN represent 1.18% of GDP. Two types
of assistance are provided by the PNAFN. In 2012, 183,000 families
benefited from AMG 110. Each family accepted in the programme
receives an allowance of TND 100 per month plus an allowance
of TND 10 per child attending school (up to a maximum of 3 children).
These families also receive a free health care card. In 2012, 583 000
families benefited from AMG211. It provides them with a card allowing
partial coverage of health care costs.
Direct Targeting Errors: The main challenges for direct targeting
lie in: i) the high cost of obtaining information on household
characteristics and ii) the subjective aspect of assessment of living
standards and income sources by social assistants. The complexity of
living standard assessment criteria leads to targeting errors due to the
asymmetry of information between the social worker and the families.
There are two types of targeting errors: (1) inclusion errors, due to the
fact that non-poor households manage to benefit from social assistance
to the detriment of needier families; (2) exclusion factors due to the fact
that poor families who are unable to justify their low standard of living
are deprived of social assistance (in addition to households who are not
covered by surveys and do not, therefore, benefit from assistance).
According to the 2010 INS survey data, poor families only benefited
from 51% of the allocations under the PNAFN programmes, whereas
20% of the beneficiaries were among the richest 40% of the
population (Annex I)12. In addition, 40% of households suffering from
extreme poverty are excluded from this programme13.
Non Poor Poor Total
Total Subsidies per capita/year (1) 87.231 64.777 83.752
Real Expenditure/year (2) 2 930.558 802.513 2601
Relative Indirect Transfer Rates (1)/(2) 3.0% 8.1% 3.2%
Total Subsidies Received per capita/year 88.0% 12.0% 100.0%
Table 2.5: Estimated Values of the Average Annual Subsidy per capita according to Population Category (poor/non poor)
Source: INS 2013, Technical Note ‘Distribution and Impact of Indirect Subsidies on Poor Households’.
10 i.e. 7.2 % of all households in Tunisia and 6.6% of the Tunisian population.11 i.e. 19.8% of all households in Tunisia and 21.8% of the Tunisian population.12 Table 3.3 estimates exclusion errors at 48% for the two programmes combined. Thus, 48% of poor people benefit neither from the AMG 1 nor AMG 2, and 40% of extremelypoor households are excluded from one or other of the two programmes.13 This rate reaches 64% in India (Saxona 2006).

Food Subsidies and Direct Social Assistance: Towards Better Targeting of Monetary Poverty and Deprivations in Tunisia
A f r i c a n D e v e l o p m e n t B a n k
13
2.2.3 Scope of the Report
The objective of any effectively targeted social transfer programme
is to reduce the number of people considered to be needy, ideally
for a fixed total transfer amount, denoted as (so that expenditure
remains controlled and is not subject to international price
fluctuations, for example).
Theoretically, to achieve this objective, it is first necessary to define
an aggregate living standard indicator (reflecting poverty/vulnerability/
deprivation). This will be the subject of Chapter 4.
It will then be necessary to define the amount (s) of transfers to
households that will result in a significant reduction in the number of
needy people (this will be the subject of Chapter 5).
Furthermore, the decision-maker may, following optimization of the
direct transfer system, seek to revise/reallocate the budgets allocated
to the different transfer programmes in order to enhance the efficacy
of its social action. These aspects are explored from the standpoint
of different public policies in Chapter 6.
Food Subsidies and Direct Social Assistance: Towards Better Targeting of Monetary Poverty and Deprivations in Tunisia
A f r i c a n D e v e l o p m e n t B a n k
14
In the context of poverty reduction, better targeting may result in animprovement in the cost/benefit ratio (allocated budget/poverty
reduction). A necessary but insufficient condition for any effective
targeting policy is to allocate assistance to the most impoverished
households.
In the following chapters, the selection of standard of living indicators
and their aggregation into a single indicator is based on three notable
experiences in terms of direct targeting: Iranian, Indian14, and Moroccan.
The lessons learned from these countries’ experiences for the
construction of an overall living standard indicator have then been
adjusted to take into account the specificities of Tunisian households.
3.1 Iranian Experience
Aware of the burden of the oil products subsidies and some food
products on central government finances, the Iranian Authorities
decided to shift from a universal subsidy to direct targeting. However,
to offset the losses that would be suffered by households in the event
of an increase in the prices of subsidized products and maintain the
living standards of households at their original level, the Iranian
Authorities decided to transfer funds directly into each household’s
bank account. The amount would be considered sufficient to offset
any possible losses in real income levels. The Iranian Authorities also
preceded the launching of this reform by a vast communication
campaign on the benefits of the reform.
Though it was cut short one year after its launching, a number of
recommendations may be made based on the Iranian experience:
a. The specification of an adequate living standard proxy to be
assessed on the basis of observable indicators is a necessary
condition prior to the launching of any new direct targeting policy.
b. Since indirect subsidies do not only benefit households, but
other economic agents as well, their reactions to any sudden
removal of the subsidy must be anticipated. In Iran, this reaction
assumed the form of sharp increases in the retail prices of food
products.
c. It is essential to undertake a prior communication campaign.
3.2 Indian Experience
The Indian experience comprised four phases between 1992 and
2011, with a series of adjustments made to improve transparency and
effectiveness in the selection of standard of living indicators and in
order to reduce targeting errors (see Annex II for further details).
Another benefit of this experience is that it reduces the incompatibilities
between procedures for estimating poverty and identifying poor
people and then with regard to the respective assessments of the
planner and field worker15.
Initially, the Indian planner noted the difficulty in verifying information
on the incomes of a number of households working in the informal
sector. The targeting policy was therefore implemented in two stages.
Initially, visibly non-poor households were identified, then, in a second
stage, assistance was allocated to the other households on the basis
of their respective expenditure levels, starting with those households
with the lowest levels of total spending up to the exhaustion of the
budget earmarked for such assistance.
In the third stage, the planner noted the subjectivity of criteria for
the exclusion and assessment household living standards. Total
expenditure was replaced by a synthetic indicator, based on a
multidimensional approach during the living standards assessment,
in order to classify households by order of eligibility for social
assistance.
In the last stage, the Indian planner addressed corruption in the
granting of assistance by reducing information asymmetry. He
selected verifiable indicators which reduce the scope for manipulation.
The new targeting procedure, prepared in 2009, comprises three
stages:
3. Lessons Learned from International Experience
14 Other experiences are worth mentioning, especially the Indonesian and South American experiences. However, the Iranian and Indian experiences are in keeping with the objectives of, and in fairly similar environments to the present Tunisian case, in addition to the ease of implementing them. 15 This problem characterizes the divergent points of view regarding the selection of tools for analyzing living standards among actors.

Food Subsidies and Direct Social Assistance: Towards Better Targeting of Monetary Poverty and Deprivations in Tunisia
A f r i c a n D e v e l o p m e n t B a n k
15
1. Automatic exclusion of those who are visibly non-poor on the
basis of observable non-falsifiable indicators.
2. Automatic inclusion of those who are visibly poor and ensuring
they are the first to benefit from the subsidies.
3. Classify the other families by awarding scores reflecting their
respective deprivation levels for each of the agreed criteria, and
grant assistance to those with the lowest overall scores within
the limitations of the available budget.
3.3 Moroccan Experience
The Moroccan planner opted for geographical targeting. Using a
fairly detailed poverty map, he carried out universal targeting in each
sub-locality but without taking into account the socio-demographic
characteristics of the households benefiting from the subsidies. The
most recent World Bank report16 published in 2012 confirms the
persistence of the targeting error despite efforts made to fine-tune
geographical targeting.
This report affirms that geographical targeting is frequently used and
has become more widespread with the introduction of increasingly
sophisticated poverty maps but does not help to identify the
end-beneficiaries. In most cases, the final selection of beneficiaries is,
however, the responsibility of commissions or individuals that decide
on the basis of criteria with considerable leeway for interpretation or
weighting. This lack of transparency means that the population has
no recourse in the event of error or fraud (abusive exclusion or
inclusion in the programme).
The World Bank experts therefore concluded that a better use of the
poverty maps on the basis of international experience will help to build
an accurate and coherent targeting system combining geographical
targeting and direct targeting of households and that the creation
of a register of beneficiaries will, in a second stage, help to foster
intersector coordination to address the multidimensional aspects of
poverty and vulnerability.
3.4 Conclusions
The analysis of the Indian, Moroccan and Iranian experiences has
guided us in identifying the main variable criteria for a more accurate
assessment of the living standards of needy families and in pinpointing
the pitfalls to be avoided during the implementation of a more effective
pro-poor direct targeting policy.
Based on the Iranian, Indian and Moroccan experiences, it is noted
that, in order to promote a targeting policy aimed at reducing poverty,
without increasing the cost to central government, it is necessary to
have the maximum amount of information on different statistical
indicators characterizing the poor. These indicators must be easily
observable and non-modifiable during the process of identification
of poor people carried out by the social worker, while allowing a
careful estimation of individuals or households concerned by social
assistance.
The search for such indicators and the formulation of an overall
indicator are the subjects of the following chapter.
16 Kingdom of Morocco ‘Kingdom of Morocco ‘Targeting and Social Protection: Strategic Guidance Note’, World Bank, 2012.

Food Subsidies and Direct Social Assistance: Towards Better Targeting of Monetary Poverty and Deprivations in Tunisia
A f r i c a n D e v e l o p m e n t B a n k
16
4. Definition of a Living Standards Index to Identify the Beneficiaries of DirectTransfers
4.1 Introduction: Targeting Deprivation or Poverty?
First of all, before formulating an index to target the beneficiaries of
direct assistance, it is essential to realize that decision-makers in
Tunisia do not always share the same understanding of what a
potential beneficiary (and, therefore a needy person) is.
The large majority of decision-makers and the population define a
potential beneficiary as a poor person in the monetary sense of the
term, i.e. an individual with a low income, below a fixed value. This is
readily understandable since the poverty indicators communicated by
the INS are calculated using this method (though consumption and
not income is measured).
The existing direct social transfer system is based more on the idea
of deprivation, which is closer to multi-dimensional poverty. The
beneficiary is not defined in terms of income or consumption, but by
a set of factors reflecting the constraints on his/her way of life and
living standards (a disability for example).
This is a fundamental difference for it will directly influence: a) the
formulation of a living standards index that will be used to identify the
beneficiaries ; but also b) how the performance of the index will be
perceived by the different actors: either in terms of monetary poverty
eradication or in terms of alleviating deprivations.
Using a monetary poverty reduction approach and, in absolute
terms, the transfer could be optimal if the decision-maker accurately
observed the income “yi” of each household. Income could then
be used to classify households by order of priority for receiving
social assistance. However, implementation of such policies is difficult
in the absence of observable and accurate income assessments.
Furthermore, households are inclined to underestimate their
respective incomes, in order to be able to benefit from central
government transfers.
The lack of perfectly observable information on household income
levels may then lead to errors in targeting monetary poverty. We
have observed inclusion factors where some non-poor households
misrepresent their levels of income and succeed in benefiting from
social assistance, to the detriment of needier households. On the
other hand, there are exclusion errors where poor families who are
unable to establish their cases are deprived of social assistance.
Furthermore, income is not the only factor in determining the living
conditions of a family, which leads us to the concept of deprivations
and multidimensional poverty. For example, the presence of one or
more disabled members in a family increases medical expenditure
while the number of children in a family (and their ages) strongly
influences education-related expenditure. Consideration of these
specificities which generate greater non- food product requirements
must not be neglected.
Consequently, some households with incomes close to, or below
the poverty threshold are compelled to reduce their food
consumption to meet other urgent needs17. Food which is the basis
for of calculation of the poverty threshold is desired by the
household but is not necessarily sought by it, as the household is
required to cover several other non-food needs relating to
health, education, transport, sanitation or electricity. A planner who
estimates living standards solely on the basis of income (generally
estimated by total expenditure) as the only living standard indicator
(which would correspond to an approach based on the monetary
assessment of poverty, considering the shares of non-food
expenditure as fixed), could not take into account these differences
between households.
To resolve this problem and attempt to combine the two objectives
(monetary poverty and deprivations), it is necessary to rely on visible,
verifiable and tangible living standard indicators other than household
income, which are strongly correlated with the socio-demographic or
17 For example, it was noted that, since education has become accessible to all, a poor person also wants to send his/her children to school, which creates more expenditure interms of the purchase of books and clothing, despite the fact that State schools are free. These expenses will absorb part of the household revenue and consequently compel him/her to curtail spending on food consumption which will result in a drop in living standardscompared to a household with no children but which earns the same income. Controlling disease also leads to the emergence of two new types of expenditure. It is also worthmentioning spending on electricity and sanitation as well as on transport to the place of work which have become necessary, mainly for the urban poor.

Food Subsidies and Direct Social Assistance: Towards Better Targeting of Monetary Poverty and Deprivations in Tunisia
A f r i c a n D e v e l o p m e n t B a n k
17
geographic characteristics of those of households and possibly (if the
intention is to combine the objective of reducing deprivations with a
reduction in monetary poverty) with their income levels.
The aim of the following sections is to identify a list of indicators that
could serve as a living standard proxy while being easily observable
and non-falsifiable. Consequently, different methodologies have
been proposed and tested to construct an aggregated living
standard indicator that would permit the classification of households
which would “potentially” benefit from direct assistance.
4.2 First Approach-definition of a Basic Deprivation andLiving Conditions Index
In this phase, an initial methodology is defined which is aligned as
closely as possible on the methodology used by the Ministry of
Social Affairs.
The procedure currently used by social workers (who are in direct
contact with the families) for identifying people eligible for social
assistance is based on an approach involving the assessment of
deprivations (or multidimensional approach). However, this living
standards assessment procedure assigns a major role to the
personal assessment of social workers (Annex VII). This assessment
could be subjective in the absence of objectively verifiable indicators
(applied by the social worker or a control officer).
While based on the existing system, the approach presented below
aims to identify a series of readily observable and objectively verifiable
indicators that will help to identify households with the lowest living
conditions (Annex III – for statistical pre-requisites). It will subsequently
be possible to fine-tune this new approach while maintaining its basis
in the existing system.
4.2.1 Selection of Deprivation Indicators – a DescriptiveApproach
a) Selection of Indicators
Deprivations have several origins. Some institutions insist on a
series of deprivations more than others. For example, the PNAFN
programme gives precedence to families where one or more members
suffer from physical disabilities or chronic diseases limiting the ability
of the household head to easily carry out a professional activity/trade
and have a normal social life18.
To make an approximate estimation of living standards, household
deprivations will be analyzed by selecting from the 2010 INS
household survey, 15 indicators which are classified into four criteria:
(1) housing conditions, (2) possession of sufficient capacity to generate
a decent income, (3) the burden borne by active adults and (4) family
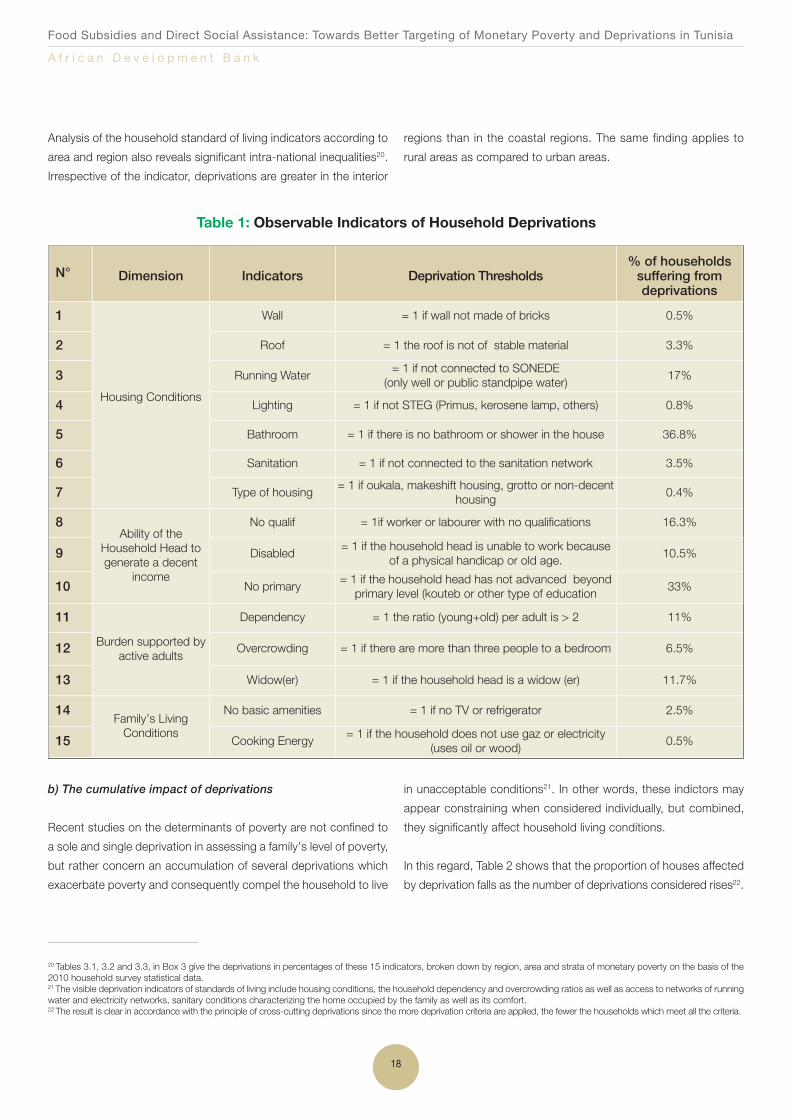
living conditions (see Table 1).
The selection of standard of living indicators took into account Tunisian
specificities summarized in Tables III.1, III.2 and III.3 in Box III. The fifteen
selected indicators presented in Table I are easy to define, easy to
collect and easily verifiable. The four criteria adopted include the main
standard of living determinants used by most of the studies in this
area19. These criteria have also been adopted by the Ministry of
Social Affairs during the selection of needy families under the PNAFN
programme. Their average frequencies have been estimated on the
basis of the 2010 INS household survey in accordance with the
deprivation thresholds decided upon for each indicator, set out in the
4th column of Table 1. Taken individually, these deprivations are more
frequently encountered in communities affected by monetary poverty
(or extreme monetary poverty) which allows us to try to combine this
dual objective of reducing deprivations and monetary poverty.
18 The PNAFN considers that if the household head is disabled, he/she will experience tremendous difficulty in achieving financial autonomy and therefore meeting the family’sneeds. It also states that the existence of the handicap will lead to additional costs (care, equipment, ……) and consequently a further deterioration in the living standards ofthese households. Such a household should therefore top the list of households eligible for social assistance.19 We have (among others) drawn on the selection procedure of the Indian planners as presented in Annex II.
Food Subsidies and Direct Social Assistance: Towards Better Targeting of Monetary Poverty and Deprivations in Tunisia
A f r i c a n D e v e l o p m e n t B a n k
18
Analysis of the household standard of living indicators according to
area and region also reveals significant intra-national inequalities20.
Irrespective of the indicator, deprivations are greater in the interior
regions than in the coastal regions. The same finding applies to
rural areas as compared to urban areas.
20 Tables 3.1, 3.2 and 3.3, in Box 3 give the deprivations in percentages of these 15 indicators, broken down by region, area and strata of monetary poverty on the basis of the2010 household survey statistical data.21 The visible deprivation indicators of standards of living include housing conditions, the household dependency and overcrowding ratios as well as access to networks of runningwater and electricity networks, sanitary conditions characterizing the home occupied by the family as well as its comfort.22 The result is clear in accordance with the principle of cross-cutting deprivations since the more deprivation criteria are applied, the fewer the households which meet all the criteria.
Table 1: Observable Indicators of Household Deprivations
N° Dimension Indicators Deprivation Thresholds % of householdssuffering fromdeprivations
1
Housing Conditions
Wall = 1 if wall not made of bricks 0.5%
2 Roof = 1 the roof is not of stable material 3.3%
3 Running Water= 1 if not connected to SONEDE (only well or public standpipe water)
17%
4 Lighting = 1 if not STEG (Primus, kerosene lamp, others) 0.8%
5 Bathroom = 1 if there is no bathroom or shower in the house 36.8%
6 Sanitation = 1 if not connected to the sanitation network 3.5%
7 Type of housing= 1 if oukala, makeshift housing, grotto or non-decent
housing0.4%
8Ability of the
Household Head togenerate a decent
income
No qualif = 1if worker or labourer with no qualifications 16.3%
9 Disabled= 1 if the household head is unable to work because
of a physical handicap or old age.10.5%
10 No primary= 1 if the household head has not advanced beyondprimary level (kouteb or other type of education
33%
11
Burden supported byactive adults
Dependency = 1 the ratio (young+old) per adult is > 2 11%
12 Overcrowding = 1 if there are more than three people to a bedroom 6.5%
13 Widow(er) = 1 if the household head is a widow (er) 11.7%
14Family’s Living Conditions
No basic amenities = 1 if no TV or refrigerator 2.5%
15 Cooking Energy= 1 if the household does not use gaz or electricity
(uses oil or wood)0.5%
b) The cumulative impact of deprivations
Recent studies on the determinants of poverty are not confined to
a sole and single deprivation in assessing a family’s level of poverty,
but rather concern an accumulation of several deprivations which
exacerbate poverty and consequently compel the household to live
in unacceptable conditions21. In other words, these indictors may
appear constraining when considered individually, but combined,
they significantly affect household living conditions.
In this regard, Table 2 shows that the proportion of houses affected
by deprivation falls as the number of deprivations considered rises22.

Food Subsidies and Direct Social Assistance: Towards Better Targeting of Monetary Poverty and Deprivations in Tunisia
A f r i c a n D e v e l o p m e n t B a n k
19
The proportion of households affected by a single deprivation
exceeds 24%. However, under 5% of households suffer from
four deprivations. From the Table it is also possible to analyze the
frequency of deprivations. Thus 60% of households suffered from
at least one deprivation in 2010, whereas only 2% of households
suffered from 5 deprivations or more in 2010.
C) Relationship between the cumulative effect of deprivations
and monetary poverty
Furthermore, even though considered separately, deprivation
indicators appear to be found more frequently in poor communities,
it is also important to determine whether the cumulative frequency of
deprivations appears to reflect monetary poverty. To that end, the entire
population is classified according to their degree of deprivation (from
households most affected by deprivations to households least affected
by deprivations – the first five percentiles corresponding, therefore, to
households most affected by deprivations – (Graph 1). The distribution
of the 3 sub-populations is considered: that suffering from extreme
poverty, that suffering from poverty and that not affected by poverty.
A strong correlation is noted between monetary poverty and
deprivation:
• The entire population affected by extreme poverty forms part
of the 15% of the population most affected by deprivation.
• 92% of the poor population forms part of the 20% of the
population most affected by deprivation.
• The 5% affected most by deprivation includes the 87% of the
population suffering from extreme monetary poverty, 35% of
the population suffering from monetary poverty and no non-
poor persons.
At first sight, there is an identical progression between the level of
monetary poverty and the degree of deprivation. However, among
the 35% of the population most affected by deprivations, we have
included almost one quarter of the population not affected by
poverty. This is a good illustration of the complexity involved in
defining an indicator to achieve the dual objective of reducing
deprivations while fighting poverty. If we only seek to reach the most
impoverished 5% (either in monetary terms or in terms of deprivation)
there will be few inclusion errors. However, very rapidly inclusion
errors relating to the other objective (monetary poverty or
deprivations) are virtually unavoidable. It will then be necessary to
determine what is tolerable by the central government in accordance
with the set objective.
All these conclusions (possibility of defining groups of deprivations;
existence of deprivations that are more critical than others;
cumulative impact of deprivations; absence of perfect correlation
between poverty and deprivations; existence of disparities in the
types and levels of deprivations) should be taken into consideration
when defining the standard of living index.
Table 2: Degrees of Deprivation in the Populationin 2010
Number ofDepriva-tions
Frequency Number of Deprivations
CummulativeFrequency
1 24% ≥1 60%
2 18% ≥2 36%
3 12% ≥3 18%
4 4% ≥4 6%
5 2% ≥5 2%
Classification of the population by level of deprivation
% of the population in extreme poverty% of the poor population% of the non poor population
Per
cent
age
of
sub
-po
pul
atio
n
Graph 1: Relationship between “deprivations”and “monetary poverty”

Food Subsidies and Direct Social Assistance: Towards Better Targeting of Monetary Poverty and Deprivations in Tunisia
A f r i c a n D e v e l o p m e n t B a n k
Box 3: Frequency of Deprivations
Table 3.1: Deprivation Rate on the basis of the 2005 Household Budget and Consumption Survey
N° Dimension Indicators Total Population Vulnerable Population Poor Population
1
Housing Conditions
Wall 0.7% 1.2% 1.6%
2 Roof 5.1% 7.4% 8.2%
3 Running Water 17.1% 27.1% 37.4%
4 Lighting 1.7% 3.8% 5.7%
5 Bathroom 50.3% 78.2% 88.8%
6 Sanitation 50.2% 62.7% 76.6%
7 Type of housing 0.9% 1.6% 2.6%
8 Capacity of the Household Head togenerate a decent
income
No qualif 15.5% 29.5% 33.9%
9 Disabled 10.1% 11.7% 11.7%
10 No education 33.6% 38.4% 41.8%
11Burden borne byactive adults
Dependency 14.1% 18% 25.2%
12 Overcrowding 9.4% 25.3% 42.2%
13 Widow(er) 13% 9.7% 8.5%
14 Family’s LivingConditions
No basic amenities 16.7% 33.6% 49.1%
15 Cooking Energy 0.7% 1.3 % 1.8%
Table 3.2: Deprivation Rate on the basis of the 2010 Household Budget and Consumption Survey
N° Dimension Indicators Total Population Poor Extreme Poverty
1
Housing Conditions
Wall 0.5% 1.2% 1.7%
2 Roof 3.3% 5.5% 7.1%
3 Running Water 17.3% 33.9% 50.7%
4 Lighting 0.7% 2.8% 5.2%
5 Bathroom 36.8% 72.9% 85.8 %
6 Sanitation 3.5% 9.4% 17%
7 Type of housing 0.4% 1.1% 2.2%
8 Capacity of the Household Head togenerate a decent
income
No qualif 16.3% 31.1% 35.0%
9 Disabled 10.5% 12.4% 11%
10 No education 33.1% 44.7% 53%
11Burden borne byactive adults
Dependency 11% 23.9% 34.1%
12 Overcrowding 6.5% 20.6% 53.6%
13 Widow(er) 11.7% 8.8% 7.5%
14 Family’s LivingConditions
No basic amenities 2.5% 6.9% 11.4%
15 Cooking Energy 0.5% 1.2% 3%
20
Food Subsidies and Direct Social Assistance: Towards Better Targeting of Monetary Poverty and Deprivations in Tunisia
A f r i c a n D e v e l o p m e n t B a n k
21
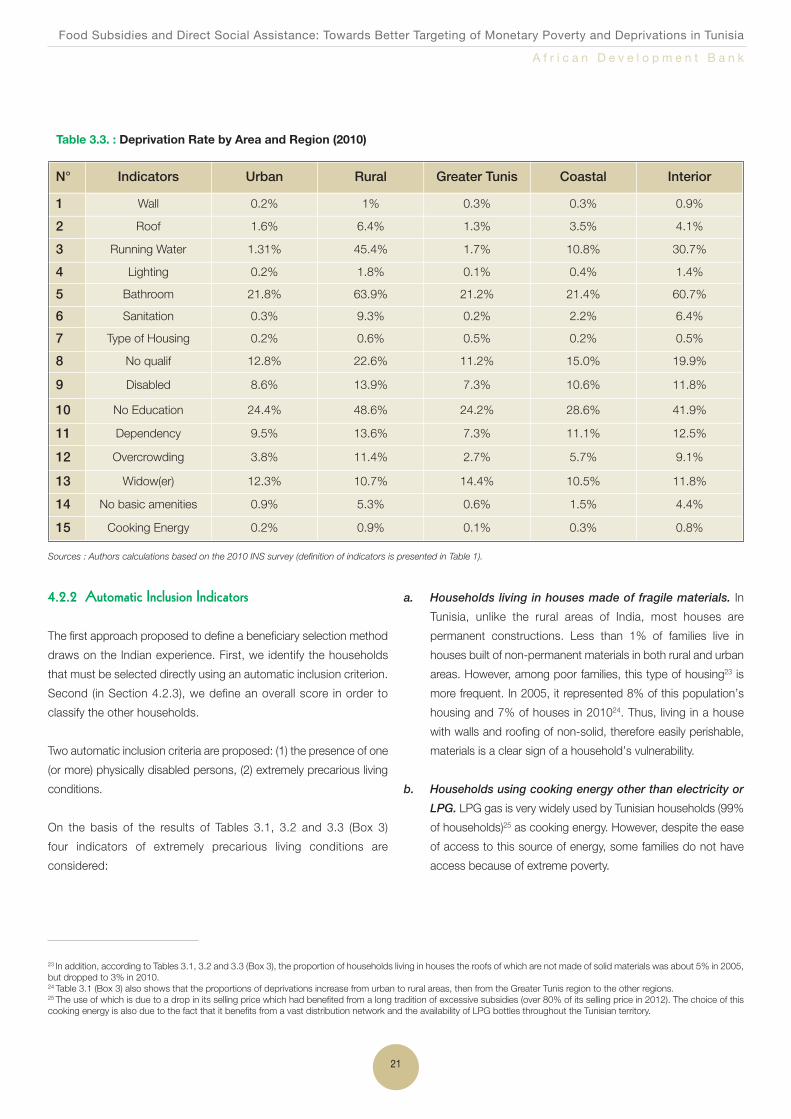
4.2.2 Automatic Inclusion Indicators
The first approach proposed to define a beneficiary selection method
draws on the Indian experience. First, we identify the households
that must be selected directly using an automatic inclusion criterion.
Second (in Section 4.2.3), we define an overall score in order to
classify the other households.
Two automatic inclusion criteria are proposed: (1) the presence of one
(or more) physically disabled persons, (2) extremely precarious living
conditions.
On the basis of the results of Tables 3.1, 3.2 and 3.3 (Box 3)
four indicators of extremely precarious living conditions are
considered:
a. Households living in houses made of fragile materials. In
Tunisia, unlike the rural areas of India, most houses are
permanent constructions. Less than 1% of families live in
houses built of non-permanent materials in both rural and urban
areas. However, among poor families, this type of housing23 is
more frequent. In 2005, it represented 8% of this population’s
housing and 7% of houses in 201024. Thus, living in a house
with walls and roofing of non-solid, therefore easily perishable,
materials is a clear sign of a household’s vulnerability.
b. Households using cooking energy other than electricity or
LPG. LPG gas is very widely used by Tunisian households (99%
of households)25 as cooking energy. However, despite the ease
of access to this source of energy, some families do not have
access because of extreme poverty.
Table 3.3. : Deprivation Rate by Area and Region (2010)
N° Indicators Urban Rural Greater Tunis Coastal Interior
1 Wall 0.2% 1% 0.3% 0.3% 0.9%
2 Roof 1.6% 6.4% 1.3% 3.5% 4.1%
3 Running Water 1.31% 45.4% 1.7% 10.8% 30.7%
4 Lighting 0.2% 1.8% 0.1% 0.4% 1.4%
5 Bathroom 21.8% 63.9% 21.2% 21.4% 60.7%
6 Sanitation 0.3% 9.3% 0.2% 2.2% 6.4%
7 Type of Housing 0.2% 0.6% 0.5% 0.2% 0.5%
8 No qualif 12.8% 22.6% 11.2% 15.0% 19.9%
9 Disabled 8.6% 13.9% 7.3% 10.6% 11.8%
10 No Education 24.4% 48.6% 24.2% 28.6% 41.9%
11 Dependency 9.5% 13.6% 7.3% 11.1% 12.5%
12 Overcrowding 3.8% 11.4% 2.7% 5.7% 9.1%
13 Widow(er) 12.3% 10.7% 14.4% 10.5% 11.8%
14 No basic amenities 0.9% 5.3% 0.6% 1.5% 4.4%
15 Cooking Energy 0.2% 0.9% 0.1% 0.3% 0.8%
Sources : Authors calculations based on the 2010 INS survey (definition of indicators is presented in Table 1).
23 In addition, according to Tables 3.1, 3.2 and 3.3 (Box 3), the proportion of households living in houses the roofs of which are not made of solid materials was about 5% in 2005,but dropped to 3% in 2010.24 Table 3.1 (Box 3) also shows that the proportions of deprivations increase from urban to rural areas, then from the Greater Tunis region to the other regions.25 The use of which is due to a drop in its selling price which had benefited from a long tradition of excessive subsidies (over 80% of its selling price in 2012). The choice of thiscooking energy is also due to the fact that it benefits from a vast distribution network and the availability of LPG bottles throughout the Tunisian territory.
Food Subsidies and Direct Social Assistance: Towards Better Targeting of Monetary Poverty and Deprivations in Tunisia
A f r i c a n D e v e l o p m e n t B a n k
22
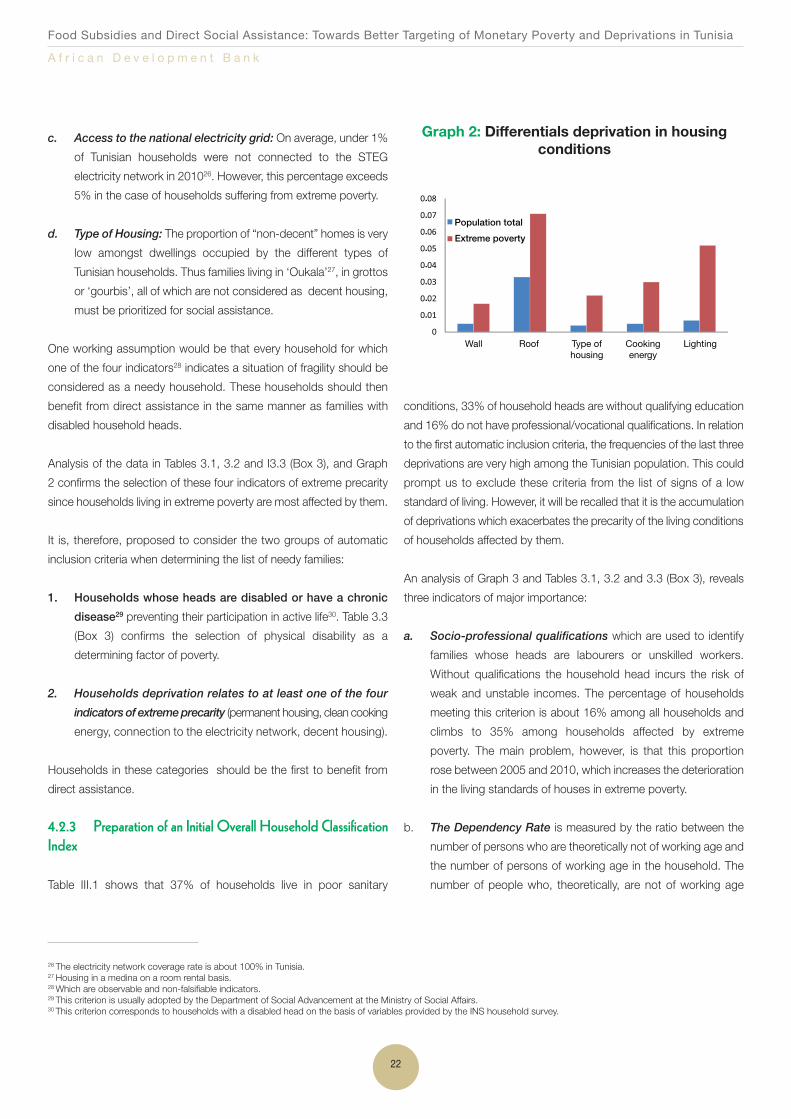
c. Access to the national electricity grid: On average, under 1%
of Tunisian households were not connected to the STEG
electricity network in 201026. However, this percentage exceeds
5% in the case of households suffering from extreme poverty.
d. Type of Housing: The proportion of “non-decent” homes is very
low amongst dwellings occupied by the different types of
Tunisian households. Thus families living in ‘Oukala’27, in grottos
or ‘gourbis’, all of which are not considered as decent housing,
must be prioritized for social assistance.
One working assumption would be that every household for which
one of the four indicators28 indicates a situation of fragility should be
considered as a needy household. These households should then
benefit from direct assistance in the same manner as families with
disabled household heads.
Analysis of the data in Tables 3.1, 3.2 and I3.3 (Box 3), and Graph
2 confirms the selection of these four indicators of extreme precarity
since households living in extreme poverty are most affected by them.
It is, therefore, proposed to consider the two groups of automatic
inclusion criteria when determining the list of needy families:
1. Households whose heads are disabled or have a chronic
disease29 preventing their participation in active life30. Table 3.3
(Box 3) confirms the selection of physical disability as a
determining factor of poverty.
2. Households deprivation relates to at least one of the four
indicators of extreme precarity (permanent housing, clean cooking
energy, connection to the electricity network, decent housing).
Households in these categories should be the first to benefit from
direct assistance.
4.2.3 Preparation of an Initial Overall Household ClassificationIndex
Table III.1 shows that 37% of households live in poor sanitary
conditions, 33% of household heads are without qualifying education
and 16% do not have professional/vocational qualifications. In relation
to the first automatic inclusion criteria, the frequencies of the last three
deprivations are very high among the Tunisian population. This could
prompt us to exclude these criteria from the list of signs of a low
standard of living. However, it will be recalled that it is the accumulation
of deprivations which exacerbates the precarity of the living conditions
of households affected by them.
An analysis of Graph 3 and Tables 3.1, 3.2 and 3.3 (Box 3), reveals
three indicators of major importance:
a. Socio-professional qualifications which are used to identify
families whose heads are labourers or unskilled workers.
Without qualifications the household head incurs the risk of
weak and unstable incomes. The percentage of households
meeting this criterion is about 16% among all households and
climbs to 35% among households affected by extreme
poverty. The main problem, however, is that this proportion
rose between 2005 and 2010, which increases the deterioration
in the living standards of houses in extreme poverty.
b. The Dependency Rate is measured by the ratio between the
number of persons who are theoretically not of working age and
the number of persons of working age in the household. The
number of people who, theoretically, are not of working age
26 The electricity network coverage rate is about 100% in Tunisia.27 Housing in a medina on a room rental basis.28 Which are observable and non-falsifiable indicators.29 This criterion is usually adopted by the Department of Social Advancement at the Ministry of Social Affairs.30 This criterion corresponds to households with a disabled head on the basis of variables provided by the INS household survey.
Graph 2: Differentials deprivation in housingconditions
Wall
Population total
Extreme poverty
Roof Type ofhousing
Cookingenergy
Lighting
.
.
.
.
.
.
.
.

Food Subsidies and Direct Social Assistance: Towards Better Targeting of Monetary Poverty and Deprivations in Tunisia
A f r i c a n D e v e l o p m e n t B a n k
23
comprises young people under 18 years of age and the elderly
over 60 years of age31. It is considered that the higher the
number of dependents in the family in relation to the number
of active persons, the greater the likelihood of the family
experiencing financial difficulties reflected in a drop in its living
standards. This ratio calculated for all households averaged
about 11% in 2010, but rose to 34% for households in extreme
poverty. This factor is fairly specific to households in extreme
poverty where the ratio was higher in 2010 compared to 2005.
c. Sanitary Conditions which deteriorate where there is no
bathroom or where households only have access to outside
toilets. These conditions are particularly relevant indicators
of poverty in urban areas32. Furthermore, the percentage of
households in extreme poverty in this situation is about 85%,
compared to under 30% for the total population.
As mentioned above, taken individually, these three sources of
deprivation may not be constraining but when combined, they
represent particularly constraining obstacles for the household.
The deprivation index is the calculated by adding the value taken
by the different second order indicators.
4.2.4 Limitations of the Descriptive Approach
This descriptive approach has the advantage of being easily
implemented. However, it has three major shortcomings.
First, the indicator produced is a discrete indicator with a limited
number of values: on the basis of 15 initial indicators and deducting
5 automatic inclusion indicators, the classification index may,
therefore, only take 12 values (automatically included, 10 secondary
deprivation values not included). It does not therefore permit an
accurate classification of households in Tunisia and therefore, close
targeting of social assistance.
Second, it would be an over-simplification to believe that there is total
independence among the different indicators proposed, or to assume
that household behaviour will remain unchanged following a
modification of the programme eligibility criteria. Consequently, it is
necessary to be able to assess the frequency of targeting measures
using the proposed approach and discuss procedures to minimize
them on the assumption of the dependency of the indicators and
changes in household behaviour. Optimization will, therefore, result in
the identification of more adequate indicators and the assessment of
their respective weights in the assessment of the final score.
Third, the weights of deprivation levels change from urban to rural
areas and between regions. It is, therefore, important to assign
adequate weights in the calculation of our standard of living scoring,
to obtain a criterion for the identification of needy families which is
consistent with the different degrees of deprivation of households
and on the basis of habits and ways of life.
Different optimization approaches may be used to reduce targeting
errors and improve the living standards of the neediest.
4.3 Second Approach-Optimization of Index Performanceusing the Multiple Deprivation Method
Two approaches stand out in the literature to optimize beneficiary
identification. The first is called the Proxy Means Test and the second
is the formulation of a multiple deprivation index. We shall first consider
31 We include the elderly among the dependents as they are generally cared for by their respective families.32 These factors are easily observed, however, they can only be considered in urban areas. Over three quarters of rural households are deprived of certain sanitary conditions (noproperly equipped bathroom in the house or access to the sanitation network). This high proportion means that this factor cannot be considered in the selection of needy familiesin rural areas.
Graph 3: Differentials in frequentdeprivation
Dependeny Overcrowding Sanitation No qualification
Population, total
Extreme poverty
.
.
.
.
.
.
.
.
.

Food Subsidies and Direct Social Assistance: Towards Better Targeting of Monetary Poverty and Deprivations in Tunisia
A f r i c a n D e v e l o p m e n t B a n k
24
33 Where k=1 this identification criterion corresponds to that of the union approach but where k = D it corresponds to the intersection approach. 34 Alkire and Foster (2007) propose the family of adjusted FGT measures defined by Mα = μ(gα) where α≥0.Mα which meets all the multidimensional axiomatic properties whilebeing easy to calculate and adapted to ordinal data. Indices of the Mα family are decomposable by population groups. In addition, all members of this family may be subdividedinto groups of standard of living indicators. This decomposition property is interpreted as the contribution of the dth indicator to multidimensional poverty. 35 However, it should be noted that the classification of households by deprivation levels is an ordinal approach. Thus it is impossible to use as an objective function the usualoverall levels of monetary poverty. Consequently, during the optimization operation we will rather minimize the adjusted A&F poverty levels to ensure the consistency of ouranalysis (see Annex V).36 Developed by Alkire and Foster (2007).37 We consider the case of N households and D living standard indicators where zd is defined as the threshold (or line) specifying the level of deprivation of indicator d (d = 1,..,D).We note sid the status of indicator d in household i, and we give a scalar of gid to each household i so that gid = 1 where sid<zd and gid = 0 otherwise. Thus household i is considered to be deprived of indicator d if gid = 1.38 It highlights each of the three dimensions: ‘the family’s housing and living conditions’, ‘capacity to generate a decent income’ and ‘burden borne by the family’. It assigns thesame weight (1/3) to each dimension, then it highlights within each dimension a series of indicators to which it assigns similar weights. Thus to each indicator of the ‘familyhousing and living conditions’ it assigns a weight of 1/27, but, on the other hand to each indicator of the other two dimensions ‘capacity to generate a decent income’ and‘burden borne by the family’ it assigns a weight of 1/9.
the second approach which is closest in its design to the one currently
adopted by the Ministry of Social Affairs for it focuses solely on the
notion of deprivation.
4.3.1 Formulation of the Index on the Basis of a MultipleDeprivation Score
As a direct continuation of the previous method, this approach is
based on a synthetic score for deprivation levels. This approach is
underpinned by a process of allocating assistance to each household
depending on the number of its deprivations and their respective
weights. It entails the construction of an aggregated deprivation index.
From a theoretical standpoint, in order to take into consideration
the interactions between indicators when assessing the level of a
household’s deprivation, the multidimensional approaches identify
people in a situation of poverty by the holistic or cross sectional
approach, in order to identify interactions between indicators
during the assessment of a household’s level of deprivation. The
multidimensional approaches identify people in a situation of
deprivation using the union approach or intersection approach. The
union approach stipulates that a household is in a situation of
deprivation if it is deprived of at least one dimension. The intersection
approach argues that a household is in a situation of deprivation if
it is deprived of all its dimensions.
The Alkire Foster approach (2007) (or the A&F approach), identifies a
household as being in a situation of deprivation33 if it is deprived of at
least k dimensions (k=1,..,D)34. This multiple deprivation approach
considers therefore that it is the accumulation of deprivations which
determines a family’s level of poverty. Multiple deprivation levels of a
household are established on the basis of aggregated periodic levels
of deprivation which are ranked according to their respective weights.
The selection of indicators and identification of the appropriate weights
for each of these indicators with a view to determining an overall score
requires an optimization procedure that will reduce targeting errors as
well as the adjusted overall poverty levels developed by A&F35. A
synthetic household living standard indicator summarizing the overall
level of deprivation suffered by each household is thus established.
Furthermore deprivation thresholds corresponding to the maximum
number of deprivations tolerated are thus defined36. This helps to
define the allocation processes by types of households classified
according to their respective deprivation37 levels and suffering from
minimum deprivation (further explanations in Annex V).
From a practical standpoint two indices have been defined to
implement this method:38.
a) an unweighted deprivation index: in this case a single weight
is assigned to each of the 15 indicators awarding a score to each
household of 1 to 15. A weight of 1/15 is assigned to each
indicator. The final score, therefore, is between 0 and 1. The
neediest households in terms of direct targeting are those with
the highest scores. This first approach enables us to carry out
an initial analysis on the basis of the number of deprivations
(which can only be done if the weights associated with the
different indicators are identical).
b) a weighted deprivation index: the 15 deprivation indicators
are used to define an overall score for each household. However,
the indicators are assigned different weights which are defined
exogenously on the basis of a UNDP-defined approach. Three
groups of indicators are defined: ‘family housing conditions and
living standards’, ‘capacity to generate a decent income’ and
‘burden borne by the family’. The weight of each of these groups
in the calculation of the final index is 1/3. The ‘family housing

Food Subsidies and Direct Social Assistance: Towards Better Targeting of Monetary Poverty and Deprivations in Tunisia
A f r i c a n D e v e l o p m e n t B a n k
25
conditions and living standards’ deprivation indicator group
comprises 9 sub-indicators. The weight of each of these sub-
indicators will be 1/27 in the calculation of the final index. In an
identical manner for the other two dimensions ‘capacity to
generate a decent income’ and ‘burden borne by the family’
it assigns a weight of 1/9 to each sub-indicator. Since the
final score is also between 0 and 1 in this case, the neediest
households in terms of direct targeting are those with the highest
score.
4.3.2 Results of “Multiple Deprivation Approach”
Calculation of the adjusted Alkire and Foster poverty indices on the
basis of the 2010 INS household budget consumption survey makes
it possible to analyze multidimensional levels of poverty for different
levels of deprivation and different deprivation percentages.
The analyses are carried out at the global level initially and in a second
phase by region, area and on the basis of certain socio-demographic
characteristics relating to the household head and outlining the main
inequalities of opportunity between households.
Overall Analysis
a. Analysis on basis of the Deprivation Index
Households are classified according to their deprivation indexes39.
The following three deprivation thresholds are defined: 0.10, 0.20
and 0.3040. The further the relative deprivation threshold falls
the faster the number of people considered to be suffering from
deprivation rises.
For a deprivation threshold of 0.1, the percentage of families
considered to suffer from deprivations is 43 %, according to the overall
unweighted index and 58% when the overall weighted deprivation
index is considered (Table 3). For a deprivation threshold of 0.30,
the proportions of needy families according to the two overall indices
are about 4% and 9% respectively.
Table 3 and Graphs 4 and 5 show that the cumulative frequencies
of households suffering from deprivations are fairly sensitive to the
deprivation thresholds and weights adopted for the calculation of
each living standard indicator.
39 The percentage of a household’s deprivation corresponds to the weighted sum of the deprivations. Thus when the weights are standard for all the indicators, the percentage(or proportion of privations) equals the sums of 15 gih divided by 15. Where gih is equal to 1 if the household is deprived of indicator i, but is otherwise equal to zero. However,when the weights denoted wi, differ among the 15 indicators, the percentage of deprivations is obtained by the weighted average by the wi, of the 15 gih. These deprivation percentages, calculated for each household h, make it possible to classify the latter in ascending order of their respective deprivations even though the indicators have the sameimpacts on household living standards.40 On the basis of international experience.
Table 3: Percentage of households suffering from deprivations (Relative approach)
Deprivation Index Threshold Unweighted Deprivation Index Weighted Deprivation Index
0.1 43% 58%
0.2 25% 25%
0.3 4% 9%

Food Subsidies and Direct Social Assistance: Towards Better Targeting of Monetary Poverty and Deprivations in Tunisia
A f r i c a n D e v e l o p m e n t B a n k
26
Analysis by Region
a. Regional Disparities
There are many clear inter-regional disparities according to the
aggregated deprivation indices. The Centre-West and North-West
regions have the highest frequencies of deprivation compared to
the regions of Greater Tunis and the Centre-East (Sahel and Sfax
regions). This result is confirmed for all deprivation thresholds and
for all overall deprivation indices (weighted and unweighted).
Table 4 shows that, for a deprivation threshold of 10%, the overall
unweighted deprivation index rises from 26% in Greater Tunis
to 71% in the Centre-West. However, for a 30% deprivation
threshold, this index is 0.4% in Greater Tunis compared to 11.3%
in the Centre-West. These figures corroborate the analyses of
regional inequalities raised by the INS-ADB-WB study in terms of
poverty.
This result confirms the conclusions based on the overall deprivation
indices.
Income is not easily observed in the real world. However, the overall
deprivation index (based on the 15 observable indicators and an
appropriate calculation of their weights) gives conclusions at the
aggregated level in terms of inequality similar to those deduced by
observing total expenditure collected from the 2010 INS household
budget and consumption survey.
Graph 4: Overall unweighted deprivation index & poverty index
% o
f to
tal p
op
ulat
ion
Threshold for deprivation index: 0.1
Great Tunis Center East Northeast Southwest Southeast Northwest West Central
Threshold for deprivation index: 0.3Threshold for deprivation index: 0.2
Graph 5: Overall weighted deprivation index& poverty index
% o
f to
tal p
op
ulat
ion
Threshold for deprivation index: 0.1Threshold for deprivation index: 0.3
Threshold for deprivation index: 0.2
Great Tunis Center East Northeast Southwest Southeast Northwest West Central

Food Subsidies and Direct Social Assistance: Towards Better Targeting of Monetary Poverty and Deprivations in Tunisia
A f r i c a n D e v e l o p m e n t B a n k
27
Table 4: Relative Deprivation Rates Broken Down by Region
WeightedScore<10%
UnweightedScore<10%
WeightedScore<20%
UnweightedScore<20%
WeightedScore<30%
UnweightedScore<30%
Vulnerable Poor
Greater-Tunis 46.1% 26% 16.7% 9.9% 4.6% 0.4% 7.9% 1%
Centre-Est 48% 26.4% 18.8% 11.5% 5.5% 1% 6.8% 1.2%
North-East 57.6% 41.7% 23.4% 22.7% 8% 3.5% 9.5% 1.6%
South-West 59.3% 39.2% 23.9% 18.9% 7.2% 1.8% 17.3% 4.4%
South-East 60,9% 37% 26% 19.1% 7.7% 2.7% 14.5% 4.2%
North-West 69.5% 66.7% 33.2% 45.2% 12.6% 10.2% 20.9% 6.6%
Centre-West 71.9% 70.6% 39.2% 50.1% 15.6% 11.3% 27.8% 11.1%
Graph 6: Overall unweighted index
% o
f to
tal p
op
ulat
ion
Greater Tunis
Coastal
Interior
oo
.
.
.
.
.
.
.
Graph 7: Overall weighted index
% o
f to
tal p
op
ulat
ion
Greater Tunis
Coastal
Interior
oo
.
.
.
.
.
.
.
.
b. Deprivation rate by region versus the monetary poverty rate
Graphs 8 and 9 compare the levels of multiple deprivations with those
for monetary poverty for the 7 major regions of Tunisia and on the
basis of two overall deprivation indices.
The poverty (vulnerable) distribution curve is below the curve
corresponding to a deprivation threshold index of 0.2, but above that
relating to the 0.3 deprivation index. However, the extreme poverty
curve (Poor) merges with the 30% deprivation curve of the overall
unweighted index, while remaining below the overall weighted
deprivation index curve.
The weighted index curves appear similar to those for monetary
poverty and result in a fairly close classification of the seven regions.
However, the unweighted index curves appear fairly different to those
for monetary poverty resulting in different classification in terms of the
regions.
The inequalities are even more obvious in Graphs 6 and 7, which
show that the regions of the interior suffer from the greatest
deprivations irrespective of the overall deprivation index.
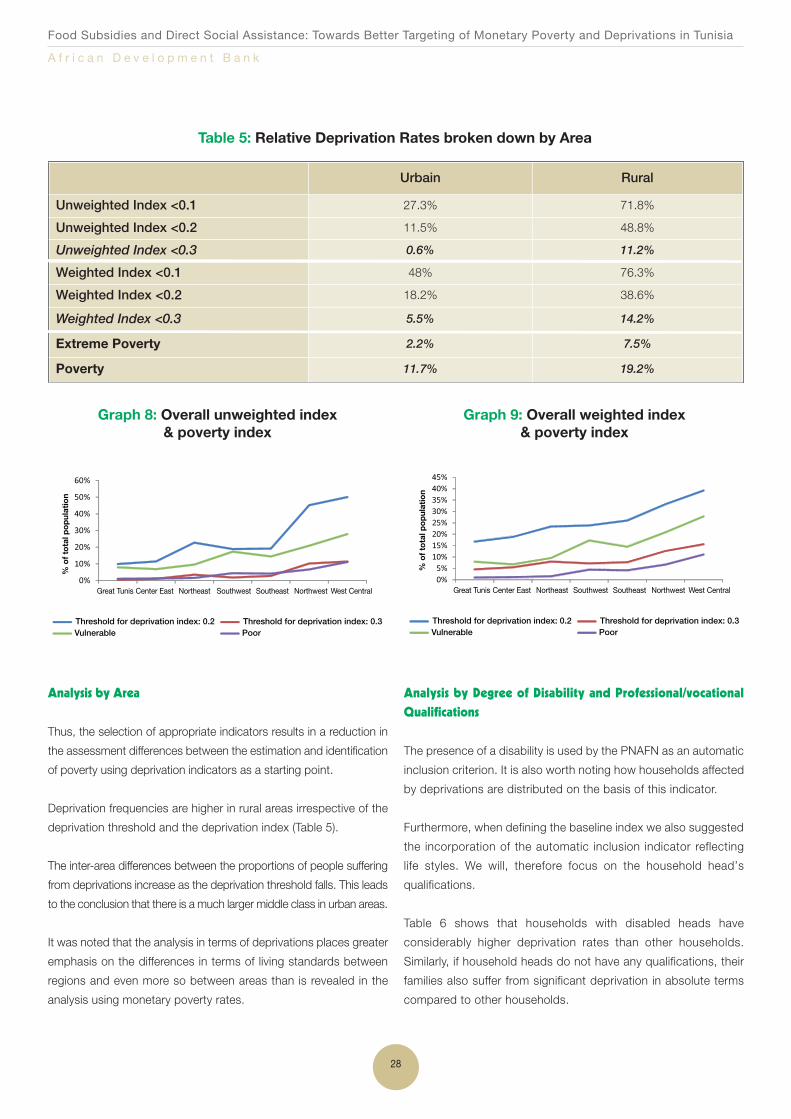
Food Subsidies and Direct Social Assistance: Towards Better Targeting of Monetary Poverty and Deprivations in Tunisia
A f r i c a n D e v e l o p m e n t B a n k
28
Graph 8: Overall unweighted index& poverty index
% o
f to
tal p
op
ulat
ion
Threshold for deprivation index: 0.2Vulnerable
Threshold for deprivation index: 0.3Poor
Great Tunis Center East Northeast Southwest Southeast Northwest West Central
Graph 9: Overall weighted index& poverty index
% o
f to
tal p
op
ulat
ion
Threshold for deprivation index: 0.2Vulnerable
Threshold for deprivation index: 0.3Poor
Great Tunis Center East Northeast Southwest Southeast Northwest West Central
Table 5: Relative Deprivation Rates broken down by Area
Analysis by Area
Thus, the selection of appropriate indicators results in a reduction in
the assessment differences between the estimation and identification
of poverty using deprivation indicators as a starting point.
Deprivation frequencies are higher in rural areas irrespective of the
deprivation threshold and the deprivation index (Table 5).
The inter-area differences between the proportions of people suffering
from deprivations increase as the deprivation threshold falls. This leads
to the conclusion that there is a much larger middle class in urban areas.
It was noted that the analysis in terms of deprivations places greater
emphasis on the differences in terms of living standards between
regions and even more so between areas than is revealed in the
analysis using monetary poverty rates.
Analysis by Degree of Disability and Professional/vocationalQualifications
The presence of a disability is used by the PNAFN as an automatic
inclusion criterion. It is also worth noting how households affected
by deprivations are distributed on the basis of this indicator.
Furthermore, when defining the baseline index we also suggested
the incorporation of the automatic inclusion indicator reflecting
life styles. We will, therefore focus on the household head’s
qualifications.
Table 6 shows that households with disabled heads have
considerably higher deprivation rates than other households.
Similarly, if household heads do not have any qualifications, their
families also suffer from significant deprivation in absolute terms
compared to other households.
Urbain Rural
Unweighted Index <0.1 27.3% 71.8%
Unweighted Index <0.2 11.5% 48.8%
Unweighted Index <0.3 0.6% 11.2%
Weighted Index <0.1 48% 76.3%
Weighted Index <0.2 18.2% 38.6%
Weighted Index <0.3 5.5% 14.2%
Extreme Poverty 2.2% 7.5%
Poverty 11.7% 19.2%
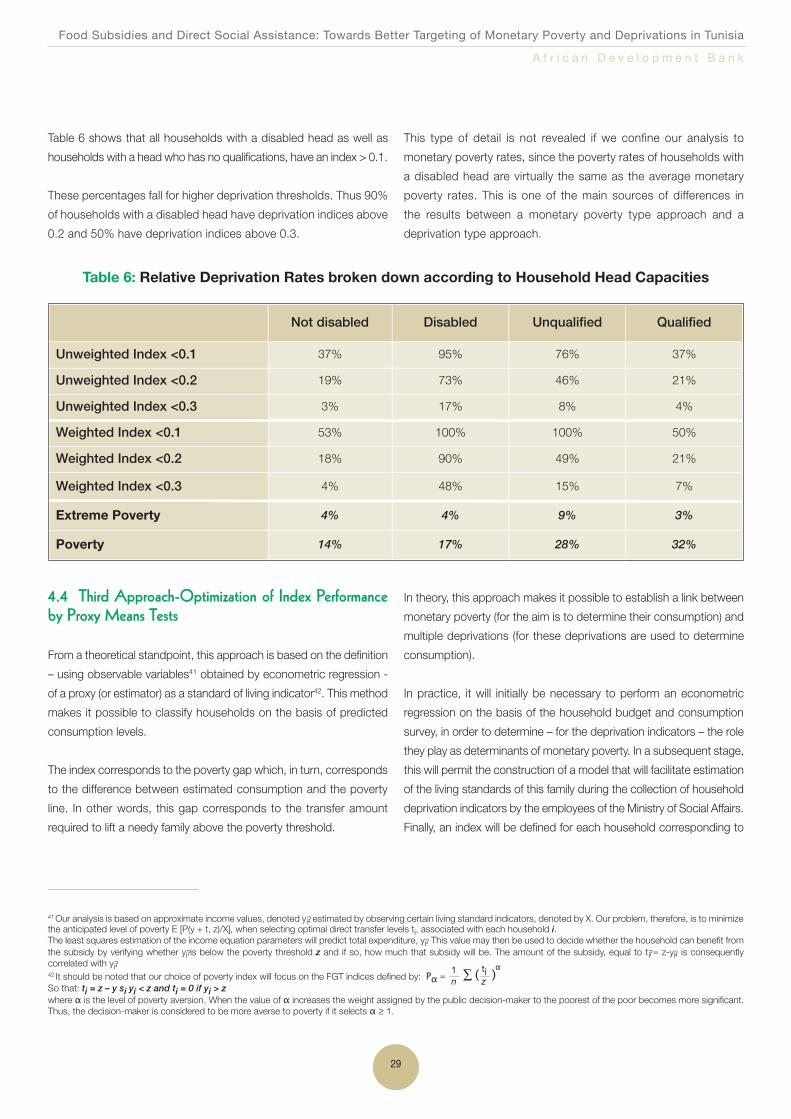
Food Subsidies and Direct Social Assistance: Towards Better Targeting of Monetary Poverty and Deprivations in Tunisia
A f r i c a n D e v e l o p m e n t B a n k
29
Table 6 shows that all households with a disabled head as well as
households with a head who has no qualifications, have an index > 0.1.
These percentages fall for higher deprivation thresholds. Thus 90%
of households with a disabled head have deprivation indices above
0.2 and 50% have deprivation indices above 0.3.
This type of detail is not revealed if we confine our analysis to
monetary poverty rates, since the poverty rates of households with
a disabled head are virtually the same as the average monetary
poverty rates. This is one of the main sources of differences in
the results between a monetary poverty type approach and a
deprivation type approach.
Table 6: Relative Deprivation Rates broken down according to Household Head Capacities
Not disabled Disabled Unqualified Qualified
Unweighted Index <0.1 37% 95% 76% 37%
Unweighted Index <0.2 19% 73% 46% 21%
Unweighted Index <0.3 3% 17% 8% 4%
Weighted Index <0.1 53% 100% 100% 50%
Weighted Index <0.2 18% 90% 49% 21%
Weighted Index <0.3 4% 48% 15% 7%
Extreme Poverty 4% 4% 9% 3%
Poverty 14% 17% 28% 32%
41 Our analysis is based on approximate income values, denoted y?i, estimated by observing certain living standard indicators, denoted by X. Our problem, therefore, is to minimizethe anticipated level of poverty E [P(y + t, z)/X], when selecting optimal direct transfer levels ti, associated with each household i.The least squares estimation of the income equation parameters will predict total expenditure, y?i. This value may then be used to decide whether the household can benefit fromthe subsidy by verifying whether y?i is below the poverty threshold z and if so, how much that subsidy will be. The amount of the subsidy, equal to t?i = z-y?i, is consequentlycorrelated with y?i.42 It should be noted that our choice of poverty index will focus on the FGT indices defined by: So that: ti = z – y si yi < z and ti = 0 if yi > zwhere α is the level of poverty aversion. When the value of α increases the weight assigned by the public decision-maker to the poorest of the poor becomes more significant.Thus, the decision-maker is considered to be more averse to poverty if it selects α ≥ 1.
Pα = ∑ ( )1n
tiz
α
4.4 Third Approach-Optimization of Index Performanceby Proxy Means Tests
From a theoretical standpoint, this approach is based on the definition
– using observable variables41 obtained by econometric regression -
of a proxy (or estimator) as a standard of living indicator42. This method
makes it possible to classify households on the basis of predicted
consumption levels.
The index corresponds to the poverty gap which, in turn, corresponds
to the difference between estimated consumption and the poverty
line. In other words, this gap corresponds to the transfer amount
required to lift a needy family above the poverty threshold.
In theory, this approach makes it possible to establish a link between
monetary poverty (for the aim is to determine their consumption) and
multiple deprivations (for these deprivations are used to determine
consumption).
In practice, it will initially be necessary to perform an econometric
regression on the basis of the household budget and consumption
survey, in order to determine – for the deprivation indicators – the role
they play as determinants of monetary poverty. In a subsequent stage,
this will permit the construction of a model that will facilitate estimation
of the living standards of this family during the collection of household
deprivation indicators by the employees of the Ministry of Social Affairs.
Finally, an index will be defined for each household corresponding to

Food Subsidies and Direct Social Assistance: Towards Better Targeting of Monetary Poverty and Deprivations in Tunisia
A f r i c a n D e v e l o p m e n t B a n k
30
43 Information may also be obtained from the survey to be carried out by CRES or from a vast database which the Ministry of Social Affairs is compiling in collaboration withseveral national organizations.44 Used as a proxy for income per capita.45 This distinction between regressions for all first quintile households helps to identify the behavioural specificities of the neediest households which as our estimates show donot have the same behaviour. 46 The non-significance of these coefficients is explained by the low number of households deprived of the last three indicators in relation to the total population. This confirmsthe need to isolate these households in the operation to determine the list of needy families.47 This finding is confirmed by the conclusions of Table VII.48 In our model we consider the coastal region as the reference area.
the gap between the living standards of the household as predicted
by the model and the poverty line. This index will classify in descending
order the neediest families in terms of direct targeting.
The INS household budget and consumption surveys (the most recent
survey was in 2010) provide considerable information on households
which could be used to carry out the Proxy Means Test43. Indeed, the
2010 Survey, in addition to information on each household’s total
expenditure, contains a set of over 100 variables outlining the socio-
demographic, geographical and institutional characteristics of each
household in the sample.
The Tables in Annex IV present the results of econometric regressions
of the logarithm of total expenditure per capita44 of each household
on a series of explanatory variables for all households in 2005 and
2010 (Table IV.1 (in Annex IV), then for households in the first quintile
(the poorest) in 2010 (Table IV.2 (in Annex IV)45.
These variables first of all include the 15 indicators defined in Table 1,
summarizing the main observable characteristics of households.
The analyses also take into account the impacts relating to
households’ areas and regions of residence. The inclusion of these
variables takes into account the heterogeneity of behaviour between
living environments and regions.
The results of the econometric regressions show that:
1. Concerning the variables relating to housing conditions,
those relating to ‘the absence of a permanent wall and roofing’,
‘non-connection to the STEG electricity networks’ or the fact of
living in a ‘non-decent house’ are not significantly linked (from a
statistical standpoint) to the level of total expenditure for 2005 and
201046. However, ‘the absence of a connection to the sanitation
network’ and the ‘absence of bathroom or equipped shower in the
house’ are significantly linked to the standard of living. Deprivation
of these two housing conditions is a strong indicator of household
living standards47.
The results of Table IV.2 (in Annex IV), show that, for households in
the first quintile, the same conclusions may be drawn as for the total
population. However, the ‘access to an electricity network’ variable
plays a significant role in this case, indicating that the poorest
people do not have access to the STEG network, justifying the use
of this criterion to automatically include these families in the list of
social assistance beneficiaries.
2. Regarding the variables associated with the capacity of the
household head to generate a decent income, the three indicators
associated with this dimension are significantly correlated with the
standard of living. This confirms that, in Tunisia, the household heads’
lack of qualifications, disability or low level of education are significantly
correlated with a drop in living standards. The lack of qualifications
has a serious impact on falling living standards. Education levels
are usually strongly correlated with living conditions, since individuals
with the highest levels of education are those with the highest
income levels.
3. The relative weight of dependents in the household has a
statistically significant impact on living standards. However, the
intensity effect for dependency only became significant in 2010. In
addition, living conditions represented by a lack of comfort and the
use of a dirty cooking energy source in the home have statistically
significant impacts on living standards which intensified between
2005 and 2010.
4. Finally, the results associated with the impact of the area
and region of residence on living standards are significant48.
There is a significant decline in income levels in rural areas. Similarly,
the regions of the interior are disadvantaged.
Food Subsidies and Direct Social Assistance: Towards Better Targeting of Monetary Poverty and Deprivations in Tunisia
A f r i c a n D e v e l o p m e n t B a n k
31
The results of these estimations help to identify the indicators that
best reflect household income levels. Their observation and use
within a predictive model immediately makes it possible to identify
the poor and vulnerable among the population.
4.5 Fourth Approach-Combination of the Proxy MeansTest and the Multiple Deprivation Method
4.5.1 Description
The minor shortcoming of the previous approach is that it doesn’t place
sufficient emphasis on deprivations, which are the starting point for the
Ministry of Social Affairs transfer policy. In order to more effectively
rechannel resources to households experiencing deprivations and to
ensure that these households are correctly targeted (thereby minimizing
exclusion errors), it is proposed to combine the Proxy Means Test
(PMT) approach with the results of the multiple deprivation approach.
To that end, we normalize the index obtained using the PMT method
by multiplying it by an index inversely proportional to the percentage
of weighted deprivations. This gives:
Adjusted PMT = PMT index *(1– weighted deprivation index)
This index places even greater emphasis on households suffering from
a significant level of deprivation by proportionally lowering the value
of the PMT index.
4.5.2 Performance of the Proposed Index
As previously mentioned, the decision-maker is split between dual
objectives: that of reducing poverty and that of reducing the impact
of deprivations.
In this analysis, we propose to adopt the methodology that will
result in the best compromise between these two objectives so
that the population as a whole has a deeper understanding of the
strategy adopted for social transfers and more readily accepts any
possible injustices.
To do so, we will, therefore, compare the performances of the
four previously described methodologies (combined method,
Proxy Means Test, weighted multiple deprivations and unweighted
multiple deprivations) regarding: a) identification of the poor from a
monetary standpoint; and b) identification of those suffering most
fromdeprivations.
The four methodologies result in the classification of all the families
in the sample by order of eligibility for social assistance. We will
then look at that part of the population we wish to target and
classified among the very first beneficiaries according to a given
methodology. This will enable us to understand the exclusion
errors and the effectiveness of a given method in identifying a family
which is poor or suffering deprivation. We will also consider the
part of the population that should not be affected by the transfer
mechanism – included among the highest ranked in the
classification. This will give us the inclusion errors – and the
effectiveness of the methodology in not transferring assistance to
those who do not need it.
The Proxy Means Test is logically seen to be (Graph 10) the most
effective approach in identifying those suffering from extreme
poverty as well as the poor segments of the population.
More surprisingly, it is the unweighted multiple deprivation method
which is best adapted for the identification of families suffering from
most deprivations.

Food Subsidies and Direct Social Assistance: Towards Better Targeting of Monetary Poverty and Deprivations in Tunisia
A f r i c a n D e v e l o p m e n t B a n k
32
Graphic 10: Effectiveness of Approaches
Performance towards the population suffering fromextreme poverty
Performance towards the population suffering frommore 4 deprivations
Ranking of the total population by method Ranking of the total population by method
Ranking of the total population by method
% o
f p
erso
n in
the
sub
-po
pul
atio
nsu
ffer
ing
fro
m e
xtre
me
inco
me
po
vert
yid
enti
fied
by
the
met
hod
% o
f p
erso
n in
the
sub
-po
pul
atio
nsu
ffer
ing
fro
m e
xtre
me
inco
me
po
vert
yid
enti
fied
by
the
met
hod
% o
f p
erso
n in
the
sub
-po
pul
atio
nsu
ffer
ing
fro
m e
xtre
me
inco
me
po
vert
yid
enti
fied
by
the
met
hod
% o
f p
erso
n in
the
sub
-po
pul
atio
nsu
ffer
ing
fro
m e
xtre
me
inco
me
po
vert
yid
enti
fied
by
the
met
hod
% o
f p
erso
n in
the
sub
-po
pul
atio
nsu
ffer
ing
fro
m 3
dep
riva
tio
ns id
enti
fied
b
y th
e m
etho
d
% o
f p
erso
n in
the
sub
-po
pul
atio
nsu
ffer
ing
fro
m 2
dep
riva
tio
ns id
enti
fied
b
y th
e m
etho
d
% o
f p
erso
n in
the
sub
-po
pul
atio
nsu
ffer
ing
fro
m 1
dep
riva
tio
ns id
enti
fied
b
y th
e m
etho
d
% o
f p
erso
n in
the
sub
-po
pul
atio
nsu
ffer
ing
fro
m 4
dep
riva
tio
ns id
enti
fied
b
y th
e m
etho
d
Ranking of the total population by method
Ranking of the total population by method Ranking of the total population by method
Ranking of the total population by method Ranking of the total population by method
Performance towards the population suffering frompoverty
Performance towards the population suffering from3 deprivations
Performance towards the population not sufferingfrom poverty
Performance towards the population suffering from2 deprivations
Performance towards the population not sufferingfrom any deprivation
Performance towards the population suffering from1 deprivation
Proposed approachProxy mean testWeighted multiple deprivation
Unweighted multiple deprivation
Proposed approachProxy mean testWeighted multiple deprivation
Unweighted multiple deprivation
Proposed approachProxy mean testWeighted multiple deprivation
Unweighted multiple deprivation
Proposed approachProxy mean testWeighted multiple deprivation
Unweighted multiple deprivation
Proposed approachProxy mean testWeighted multiple deprivation
Unweighted multiple deprivation
Proposed approachProxy mean testWeighted multiple deprivation
Unweighted multiple deprivation
Proposed approachProxy mean testWeighted multiple deprivation
Unweighted multiple deprivation
Proposed approachProxy mean testWeighted multiple deprivation
Unweighted multiple deprivation
All the methods are valid in terms of inclusion errors. On the other hand,
if the best possible compromise is sought between monetary poverty
and deprivations – the combined method undoubtedly produces the
best results and is the method which we will subsequently retain.

Food Subsidies and Direct Social Assistance: Towards Better Targeting of Monetary Poverty and Deprivations in Tunisia
A f r i c a n D e v e l o p m e n t B a n k
33
5. Determination of the Beneficiary Allocation Level
49 This threshold is the same as the value for the index of the adjusted PMT method of the household with the lowest transfer. This threshold will change if the central governmentbudget allocated to subsidies changes.
5.1 Proposed Method
Having established the household classification by order of priority
for social assistance using the previously established index
(derived from the combined method, associating the Proxy Means
Test and weighted multiple deprivations), it is now necessary to
determine how much central government must transfer and to whom.
On the basis of a purely monetary approach and from a purely
theoretical standpoint, it would be necessary to seek to achieve
‘perfect targeting’, which would assume the perfect observation by
the decision-maker of each household’s income. Theoretically, the
aim of this method is to allocate to each household an amount of
social assistance corresponding to the difference between its
income (estimated by total expenditure) and the poverty threshold
(corresponding to the income of the last household benefiting from
that assistance). The weighted sum of these amounts corresponds
to the amount of the initial overall subsidy.
Households would therefore be classified in ascending order of their
respective incomes. In the first phase, the income of the household
with the lowest level of income is increased by an initial amount
equal to the difference between its income and that of the
household immediately above it in the general classification. An
iterative process is then initiated within which is added to each of
the two most impoverished households an income supplement
equal to the difference between the incomes of the 2nd and 3rd
household. The process continues by allocating to each of the n
most impoverished households an income supplement equal to
the difference between the net incomes of the households (n+1).
The compensation process ends when the cumulative income
supplements allocated to the different households corresponds to
the total amount decided upon by central government for direct or
indirect subsidies.
However, this method obviously cannot be implemented and the
amount to be allocated must be determined by ‘imperfect direct
targeting’. This method repeats the ‘perfect targeting’ process but
using the previously defined living standard indicator in order to
classify households by order of priority for direct assistance which
takes into account both monetary poverty and deprivations.
Individuals then receive an amount calculated using the same
allocation procedure as for direct targeting.
This method would thus determine for each beneficiary a specific
allocation based on its ranking. To simplify this procedure, the
decision-maker may also define a set of 10 (or 5) household groups.
It will allocate to each group the same transfer (or assistance)
amount corresponding to the average poverty gap of the group.
It should be noted that, by adopting the proposed approach,
the more the total amount allocated by central government to
subsidies and social assistance increases,the higher the number
of beneficiaries and amounts transferred to households also
increases. However, these amounts become zero (i) when the
overall budget is fully distributed among the households before
reaching households above the poverty threshold; or (ii) when all
households with a living standard below the poverty threshold are
lifted above the poverty threshold49.
5.2. Theoretical Performance in terms of PovertyReduction
In order to evaluate the theoretical performance of the proposed
approach (and compare it with the existing situation) in terms of
monetary poverty, four theoretical scenarios must be considered for
the allocation of indirect subsidies:
(1) Scenario 1 or Status Quo: In this scenario, universal targeting
through consumer goods (indirect targeting) is preserved. The
decision-maker grants indirect subsidies in order to lower the selling
prices of certain staple prices.

Food Subsidies and Direct Social Assistance: Towards Better Targeting of Monetary Poverty and Deprivations in Tunisia
A f r i c a n D e v e l o p m e n t B a n k
34
(2) Scenario 2: This scenario corresponds to ‘uniform direct
targeting’ reallocating amount "T" equitably among all the
households irrespective of their original income levels. Each
member of the different households will receive a direct transfer
equal to T/N (N being the size of the Tunisian population).
The other two scenarios are the previously presented methods of
‘perfect direct targeting’ and ‘imperfect direct targeting’.
Table 7 assesses the levels of the poverty gap (PG) and the square of
the gaps (FGT2), for the four scenarios based on a constant central
government budget, corresponding to a total direct transfer amount
equal to "T".
The results of Table 7 confirm that universal targeting (‘status quo’)
is sub-optimal. For the same total transfer amount "T", it results in
an amount less specifically targeting the poor (monetary) than the
other three transfer scenarios (the values of the poverty gap and
square of gaps are the highest).
A direct lumpsum transfer, ‘uniform targeting’, directly allocating an
equal amount to all households is better than universal targeting
(indirect). But this type of transfer only contributes to a very slight
narrowing of the poverty gap (PG) of 2.1% and of the FGT2 of 4.2%
for the same total transfer "T" as the universal transfer.
If it were possible to observe income perfectly and then give each
person what was due, this would represent ‘perfect targeting’ which
would further reduce the poverty gaps by 40.1% and the FGT 2 by
62.7%.
But, since income is not observable, it is noted that the ‘new
targeting method’ based on observable household characteristics
defined by the multiple privations method results in targeting that is
very close to perfect targeting and far more effective than universal
or uniform targeting. The proposed method results in 40% and 36%
reductions of the poverty gap and FGT 2 respectively.
Table 7: Targeting Effectiveness for a Fixed Total Transfer Amount
Scenarios Poverty Gap (PG) Square of Gaps (FGT2)
Rate Value Change in Rate Rate Value Change in Rate
Scenario 1 : Status Quo “universal targeting” 0.064 0.025
Scenario 2 : “uniform targeting” 0.063 (-2.1%) 0.024 (-4.2%)
Scenario 3 : “perfect targeting” 0.0380 (-40.1%) 0.009 (-62.7%)
Scenario 4 : “imperfect targeting” 0.0381 (-40%) 0.016 (-36%)
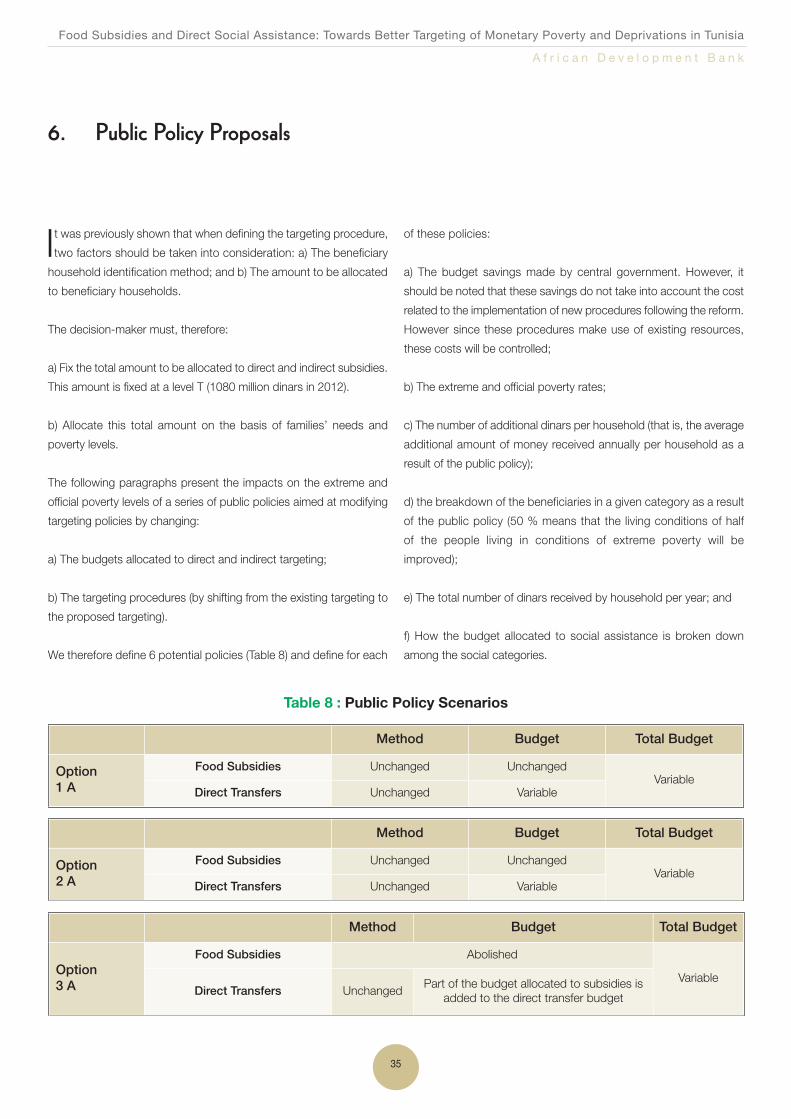
Food Subsidies and Direct Social Assistance: Towards Better Targeting of Monetary Poverty and Deprivations in Tunisia
A f r i c a n D e v e l o p m e n t B a n k
35
It was previously shown that when defining the targeting procedure,two factors should be taken into consideration: a) The beneficiary
household identification method; and b) The amount to be allocated
to beneficiary households.
The decision-maker must, therefore:
a) Fix the total amount to be allocated to direct and indirect subsidies.
This amount is fixed at a level T (1080 million dinars in 2012).
b) Allocate this total amount on the basis of families’ needs and
poverty levels.
The following paragraphs present the impacts on the extreme and
official poverty levels of a series of public policies aimed at modifying
targeting policies by changing:
a) The budgets allocated to direct and indirect targeting;
b) The targeting procedures (by shifting from the existing targeting to
the proposed targeting).
We therefore define 6 potential policies (Table 8) and define for each
of these policies:
a) The budget savings made by central government. However, it
should be noted that these savings do not take into account the cost
related to the implementation of new procedures following the reform.
However since these procedures make use of existing resources,
these costs will be controlled;
b) The extreme and official poverty rates;
c) The number of additional dinars per household (that is, the average
additional amount of money received annually per household as a
result of the public policy);
d) the breakdown of the beneficiaries in a given category as a result
of the public policy (50 % means that the living conditions of half
of the people living in conditions of extreme poverty will be
improved);
e) The total number of dinars received by household per year; and
f) How the budget allocated to social assistance is broken down
among the social categories.
6. Public Policy Proposals
Table 8 : Public Policy Scenarios
Method Budget Total Budget
Option1 A
Food Subsidies Unchanged UnchangedVariable
Direct Transfers Unchanged Variable
Method Budget Total Budget
Option2 A
Food Subsidies Unchanged UnchangedVariable
Direct Transfers Unchanged Variable
Method Budget Total Budget
Option3 A
Food Subsidies Abolished
VariableDirect Transfers Unchanged
Part of the budget allocated to subsidies isadded to the direct transfer budget

Food Subsidies and Direct Social Assistance: Towards Better Targeting of Monetary Poverty and Deprivations in Tunisia
A f r i c a n D e v e l o p m e n t B a n k
36
Method Budget Total Budget
Option 4 A
Food Subsidies Unchanged Variable
UnchangedDirect Transfers Unchanged
Variable – the total budget with-drawn from subsidies is added to
the direct transfer budget
Method Budget Total Budget
Option 5 A
Food Subsidies Unchanged Variable
VariableDirect Transfers Unchanged
Variable – part of the budget withdrawn from subsidies isadded to the direct transfer
budget
Method Budget Total Budget
Option 6 A
Food SubsidiesOnly some products are
subsidizedVariable
Unchanged
Direct Transfers Unchanged
Variable – part of the budget withdrawn from subsidies isadded to the direct transfer
budget
Method Budget Total Budget
Option 1 B
Food Subsidies Unchanged UnchangedVariable
Direct TransfersNew methodology
adoptedVariable
Method Budget Total Budget
Option 2 B
Food Subsidies Unchanged Variable
VariableDirect Transfers
New methodology adopted
Unchanged
Method Budget Total Budget
Option 3 B
Food Subsidies Abolished
VariableDirect Transfers
New methodo-logy adopted
Variable – part of the budget withdrawn fromsubsidies is added to the direct transfer budget
Method Budget Total Budget
Option4 B
Food Subsidies Unchanged Variable
UnchangedDirect Transfers
New methodology adopted
Variable – the total budget withdrawn from subsidies isadded to the direct transfer
budget
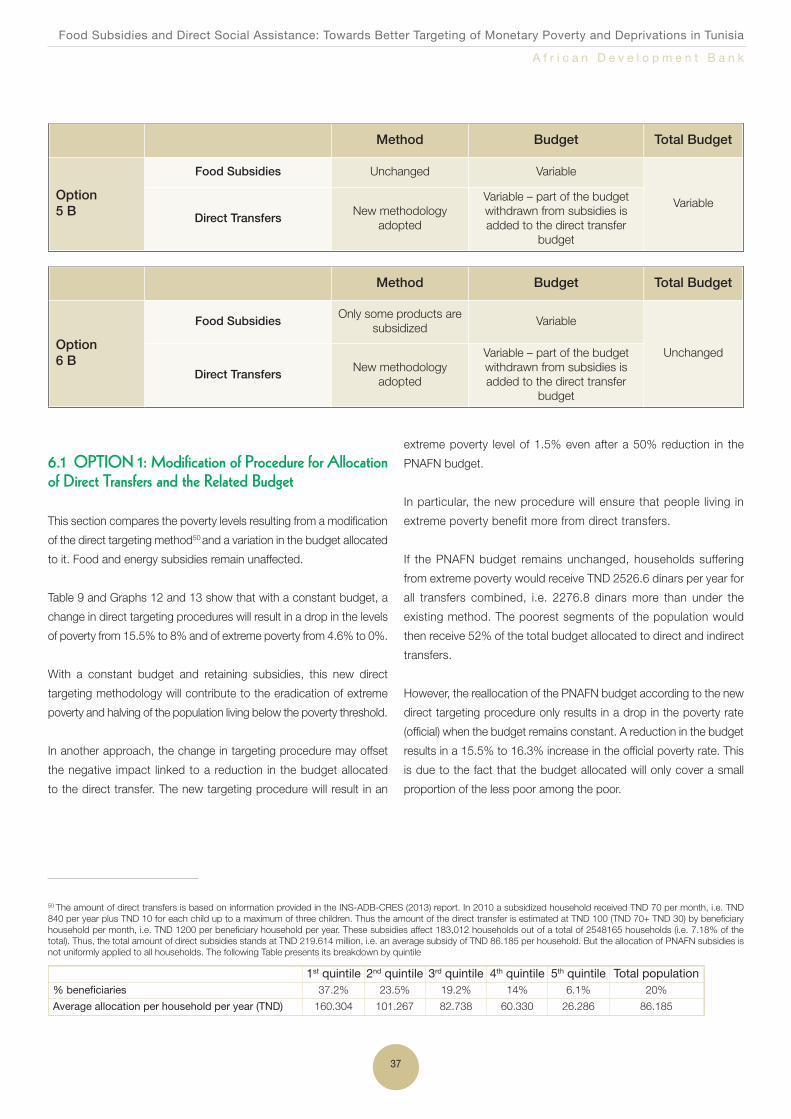
Food Subsidies and Direct Social Assistance: Towards Better Targeting of Monetary Poverty and Deprivations in Tunisia
A f r i c a n D e v e l o p m e n t B a n k
37
Method Budget Total Budget
Option 5 B
Food Subsidies Unchanged Variable
VariableDirect Transfers
New methodology adopted
Variable – part of the budget withdrawn from subsidies isadded to the direct transfer
budget
Method Budget Total Budget
Option 6 B
Food SubsidiesOnly some products are
subsidizedVariable
Unchanged
Direct TransfersNew methodology
adopted
Variable – part of the budget withdrawn from subsidies isadded to the direct transfer
budget
50 The amount of direct transfers is based on information provided in the INS-ADB-CRES (2013) report. In 2010 a subsidized household received TND 70 per month, i.e. TND840 per year plus TND 10 for each child up to a maximum of three children. Thus the amount of the direct transfer is estimated at TND 100 (TND 70+ TND 30) by beneficiaryhousehold per month, i.e. TND 1200 per beneficiary household per year. These subsidies affect 183,012 households out of a total of 2548165 households (i.e. 7.18% of thetotal). Thus, the total amount of direct subsidies stands at TND 219.614 million, i.e. an average subsidy of TND 86.185 per household. But the allocation of PNAFN subsidies isnot uniformly applied to all households. The following Table presents its breakdown by quintile
1st quintile 2nd quintile 3rd quintile 4th quintile 5th quintile Total population% beneficiaries 37.2% 23.5% 19.2% 14% 6.1% 20%
Average allocation per household per year (TND) 160.304 101.267 82.738 60.330 26.286 86.185
6.1 OPTION 1: Modification of Procedure for Allocationof Direct Transfers and the Related Budget
This section compares the poverty levels resulting from a modification
of the direct targeting method50 and a variation in the budget allocated
to it. Food and energy subsidies remain unaffected.
Table 9 and Graphs 12 and 13 show that with a constant budget, a
change in direct targeting procedures will result in a drop in the levels
of poverty from 15.5% to 8% and of extreme poverty from 4.6% to 0%.
With a constant budget and retaining subsidies, this new direct
targeting methodology will contribute to the eradication of extreme
poverty and halving of the population living below the poverty threshold.
In another approach, the change in targeting procedure may offset
the negative impact linked to a reduction in the budget allocated
to the direct transfer. The new targeting procedure will result in an
extreme poverty level of 1.5% even after a 50% reduction in the
PNAFN budget.
In particular, the new procedure will ensure that people living in
extreme poverty benefit more from direct transfers.
If the PNAFN budget remains unchanged, households suffering
from extreme poverty would receive TND 2526.6 dinars per year for
all transfers combined, i.e. 2276.8 dinars more than under the
existing method. The poorest segments of the population would
then receive 52% of the total budget allocated to direct and indirect
transfers.
However, the reallocation of the PNAFN budget according to the new
direct targeting procedure only results in a drop in the poverty rate
(official) when the budget remains constant. A reduction in the budget
results in a 15.5% to 16.3% increase in the official poverty rate. This
is due to the fact that the budget allocated will only cover a small
proportion of the less poor among the poor.
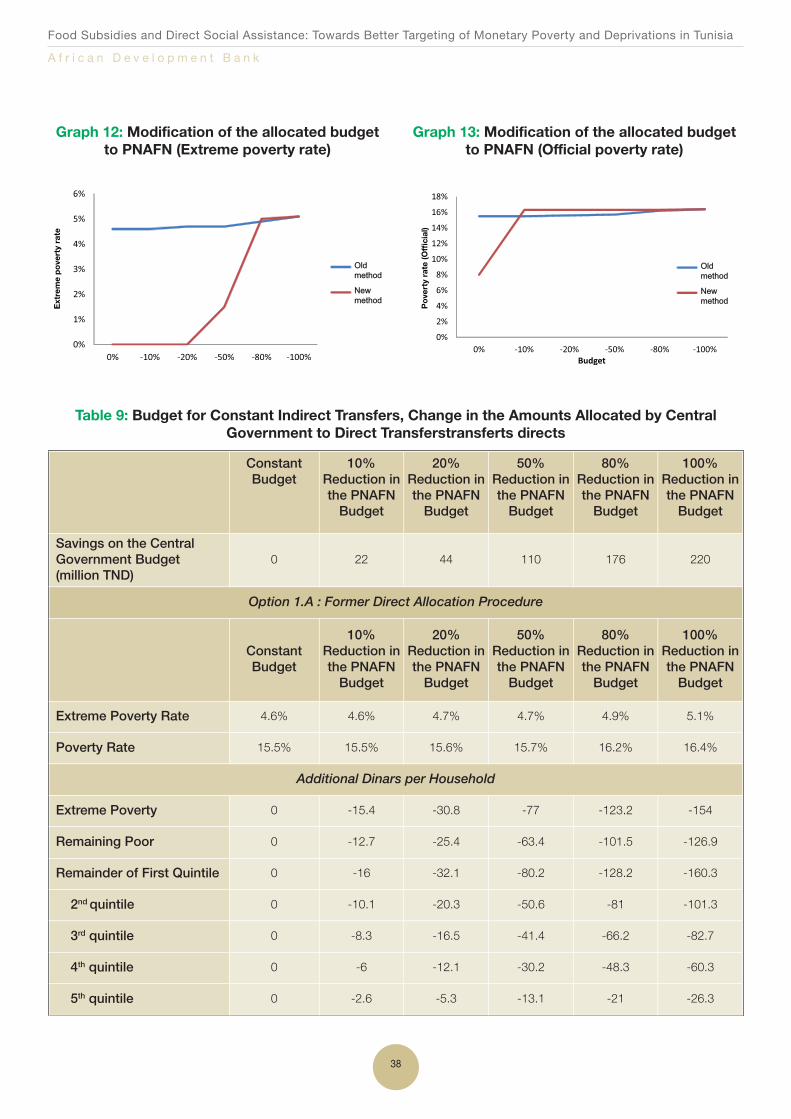
Food Subsidies and Direct Social Assistance: Towards Better Targeting of Monetary Poverty and Deprivations in Tunisia
A f r i c a n D e v e l o p m e n t B a n k
38
Graph 12: Modification of the allocated budgetto PNAFN (Extreme poverty rate)
OldOldmethodmethod
New New methodmethod
Ext
rem
e p
ove
rty
rate
Graph 13: Modification of the allocated budgetto PNAFN (Official poverty rate)
OldOldmethodmethod
NewNewmethodmethod
Po
vert
y ra
te (O
ffici
al)
Table 9: Budget for Constant Indirect Transfers, Change in the Amounts Allocated by Central Government to Direct Transferstransferts directs
ConstantBudget
10% Reduction inthe PNAFNBudget
20% Reduction inthe PNAFNBudget
50% Reduction inthe PNAFNBudget
80% Reduction inthe PNAFNBudget
100%Reduction inthe PNAFNBudget
Savings on the Central Government Budget (million TND)
0 22 44 110 176 220
Option 1.A : Former Direct Allocation Procedure
ConstantBudget
10% Reduction inthe PNAFNBudget
20% Reduction inthe PNAFNBudget
50% Reduction inthe PNAFNBudget
80% Reduction inthe PNAFNBudget
100%Reduction inthe PNAFNBudget
Extreme Poverty Rate 4.6% 4.6% 4.7% 4.7% 4.9% 5.1%
Poverty Rate 15.5% 15.5% 15.6% 15.7% 16.2% 16.4%
Additional Dinars per Household
Extreme Poverty 0 -15.4 -30.8 -77 -123.2 -154
Remaining Poor 0 -12.7 -25.4 -63.4 -101.5 -126.9
Remainder of First Quintile 0 -16 -32.1 -80.2 -128.2 -160.3
2nd quintile 0 -10.1 -20.3 -50.6 -81 -101.3
3rd quintile 0 -8.3 -16.5 -41.4 -66.2 -82.7
4th quintile 0 -6 -12.1 -30.2 -48.3 -60.3
5th quintile 0 -2.6 -5.3 -13.1 -21 -26.3

Food Subsidies and Direct Social Assistance: Towards Better Targeting of Monetary Poverty and Deprivations in Tunisia
A f r i c a n D e v e l o p m e n t B a n k
39
Percentage of Beneficiary Households in a Category
Extreme Poverty 0% 0% 0% 0% 0% 0%
Remaining Poor 0% 0% 0% 0% 0% 0%
Remainder of First Quintile 0% 0% 0% 0% 0% 0%
2nd quintile 0% 0% 0% 0% 0% 0%
3rd quintile 0% 0% 0% 0% 0% 0%
4th quintile 0% 0% 0% 0% 0% 0%
5th quintile 0% 0% 0% 0% 0% 0%
Total Number of Dinars Received by Household
Extreme Poverty 395.2 379.8 364.4 318.2 271.9 241.1
Remaining Poor 434.9 422.2 409.5 371.4 333.3 308
Remainder of First Quintile 451.2 435.2 419.2 371.1 323 290.9
2nd quintile 436.8 426.6 416.5 386.1 355.8 335.5
3rd quintile 441.9 433.6 425.3 400.5 375.7 359.1
4th quintile 423.4 417.4 411.3 393.2 375.1 363.1
5th quintile 374.9 372.3 369.7 361.8 353.9 348.6
Breakdown of Budget Allocated to Social Transfers between Categories
Extreme Poverty 13% 13% 13% 12% 11% 11%
Remaining Poor 15% 15% 15% 14% 14% 14%
Remainder of First Quintile 15% 15% 15% 14% 14% 13%
2nd quintile 15% 15% 15% 15% 15% 15%
3rd quintile 15% 15% 15% 15% 16% 16%
4th quintile 14% 14% 15% 15% 16% 16%
5th quintile 13% 13% 13% 14% 15% 15%
Option 1.B :New Direct Allocation Procedure
ConstantBudget
10% Reduction inthe PNAFNBudget
20% Reduction inthe PNAFNBudget
50% Reduction inthe PNAFNBudget
80% Reduction inthe PNAFNBudget
100%Reduction inthe PNAFNBudget
Extreme Poverty 0% 0% 0% 1.5% 5% 5.1%
Remaining Poor 8% 16.3% 16.3% 16.3% 16.3% 16.4%
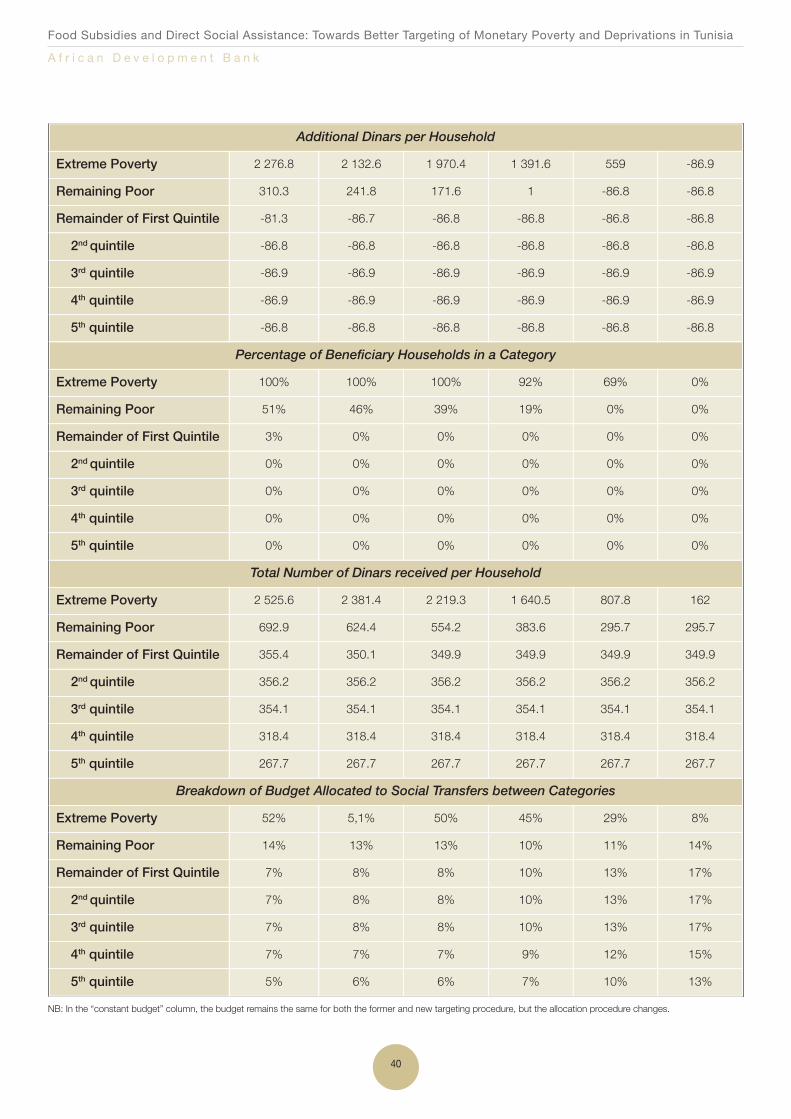
Food Subsidies and Direct Social Assistance: Towards Better Targeting of Monetary Poverty and Deprivations in Tunisia
A f r i c a n D e v e l o p m e n t B a n k
40
Additional Dinars per Household
Extreme Poverty 2 276.8 2 132.6 1 970.4 1 391.6 559 -86.9
Remaining Poor 310.3 241.8 171.6 1 -86.8 -86.8
Remainder of First Quintile -81.3 -86.7 -86.8 -86.8 -86.8 -86.8
2nd quintile -86.8 -86.8 -86.8 -86.8 -86.8 -86.8
3rd quintile -86.9 -86.9 -86.9 -86.9 -86.9 -86.9
4th quintile -86.9 -86.9 -86.9 -86.9 -86.9 -86.9
5th quintile -86.8 -86.8 -86.8 -86.8 -86.8 -86.8
Percentage of Beneficiary Households in a Category
Extreme Poverty 100% 100% 100% 92% 69% 0%
Remaining Poor 51% 46% 39% 19% 0% 0%
Remainder of First Quintile 3% 0% 0% 0% 0% 0%
2nd quintile 0% 0% 0% 0% 0% 0%
3rd quintile 0% 0% 0% 0% 0% 0%
4th quintile 0% 0% 0% 0% 0% 0%
5th quintile 0% 0% 0% 0% 0% 0%
Total Number of Dinars received per Household
Extreme Poverty 2 525.6 2 381.4 2 219.3 1 640.5 807.8 162
Remaining Poor 692.9 624.4 554.2 383.6 295.7 295.7
Remainder of First Quintile 355.4 350.1 349.9 349.9 349.9 349.9
2nd quintile 356.2 356.2 356.2 356.2 356.2 356.2
3rd quintile 354.1 354.1 354.1 354.1 354.1 354.1
4th quintile 318.4 318.4 318.4 318.4 318.4 318.4
5th quintile 267.7 267.7 267.7 267.7 267.7 267.7
Breakdown of Budget Allocated to Social Transfers between Categories
Extreme Poverty 52% 5,1% 50% 45% 29% 8%
Remaining Poor 14% 13% 13% 10% 11% 14%
Remainder of First Quintile 7% 8% 8% 10% 13% 17%
2nd quintile 7% 8% 8% 10% 13% 17%
3rd quintile 7% 8% 8% 10% 13% 17%
4th quintile 7% 7% 7% 9% 12% 15%
5th quintile 5% 6% 6% 7% 10% 13%
NB: In the “constant budget” column, the budget remains the same for both the former and new targeting procedure, but the allocation procedure changes.
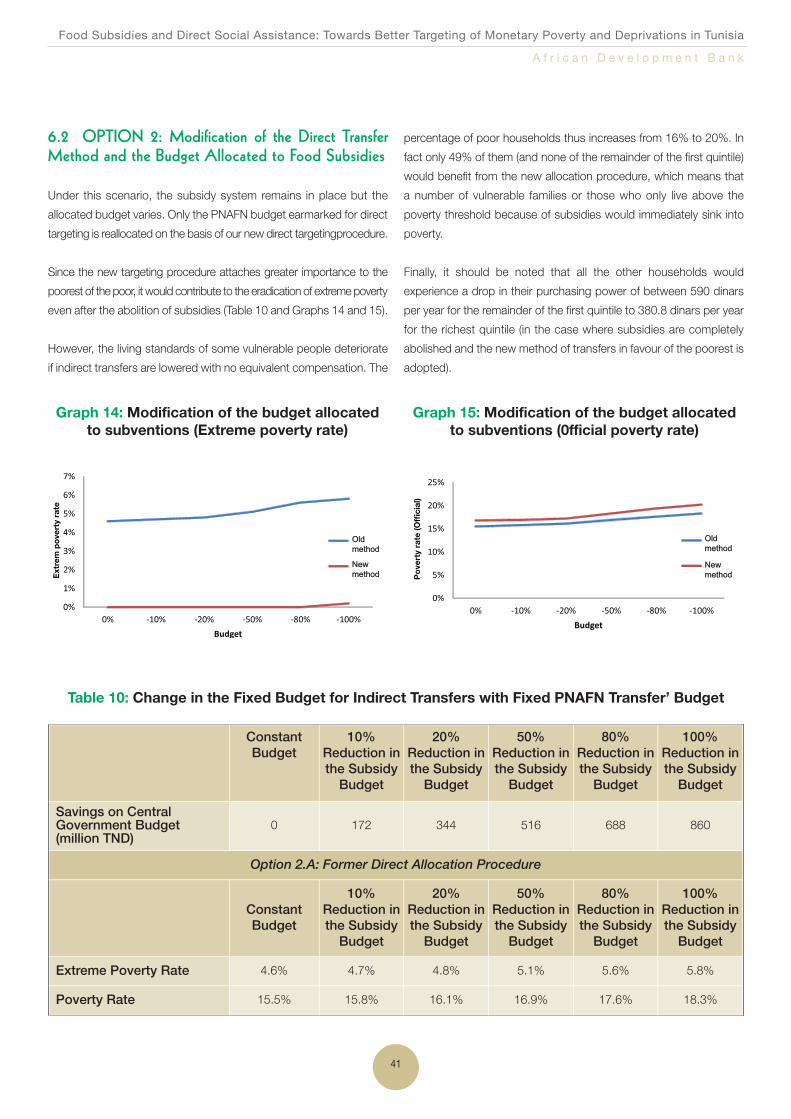
Food Subsidies and Direct Social Assistance: Towards Better Targeting of Monetary Poverty and Deprivations in Tunisia
A f r i c a n D e v e l o p m e n t B a n k
41
6.2 OPTION 2: Modification of the Direct TransferMethod and the Budget Allocated to Food Subsidies
Under this scenario, the subsidy system remains in place but the
allocated budget varies. Only the PNAFN budget earmarked for direct
targeting is reallocated on the basis of our new direct targetingprocedure.
Since the new targeting procedure attaches greater importance to the
poorest of the poor, it would contribute to the eradication of extreme poverty
even after the abolition of subsidies (Table 10 and Graphs 14 and 15).
However, the living standards of some vulnerable people deteriorate
if indirect transfers are lowered with no equivalent compensation. The
percentage of poor households thus increases from 16% to 20%. In
fact only 49% of them (and none of the remainder of the first quintile)
would benefit from the new allocation procedure, which means that
a number of vulnerable families or those who only live above the
poverty threshold because of subsidies would immediately sink into
poverty.
Finally, it should be noted that all the other households would
experience a drop in their purchasing power of between 590 dinars
per year for the remainder of the first quintile to 380.8 dinars per year
for the richest quintile (in the case where subsidies are completely
abolished and the new method of transfers in favour of the poorest is
adopted).
Graph 14: Modification of the budget allocatedto subventions (Extreme poverty rate)
OldOldmethodmethod
New New methodmethodE
xtre
m p
ove
rty
rate
Graph 15: Modification of the budget allocatedto subventions (0fficial poverty rate)
OldOldmethodmethod
New New methodmethodP
ove
rty
rate
(Offi
cial
)
Table 10: Change in the Fixed Budget for Indirect Transfers with Fixed PNAFN Transfer’ Budget
ConstantBudget
10% Reduction inthe SubsidyBudget
20% Reduction inthe SubsidyBudget
50%Reduction inthe SubsidyBudget
80%Reduction inthe SubsidyBudget
100%Reduction inthe SubsidyBudget
Savings on Central Government Budget (million TND)
0 172 344 516 688 860
Option 2.A: Former Direct Allocation Procedure
ConstantBudget
10% Reduction inthe SubsidyBudget
20% Reduction inthe SubsidyBudget
50%Reduction inthe SubsidyBudget
80%Reduction inthe SubsidyBudget
100%Reduction inthe SubsidyBudget
Extreme Poverty Rate 4.6% 4.7% 4.8% 5.1% 5.6% 5.8%
Poverty Rate 15.5% 15.8% 16.1% 16.9% 17.6% 18.3%
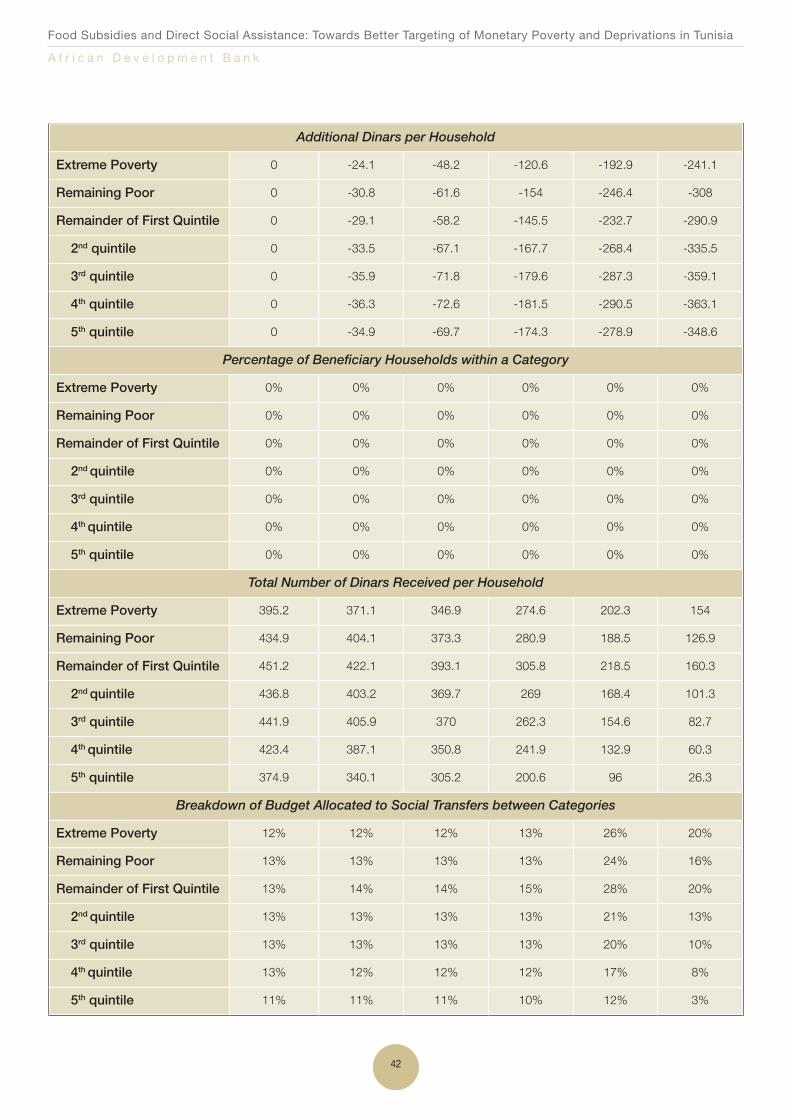
Food Subsidies and Direct Social Assistance: Towards Better Targeting of Monetary Poverty and Deprivations in Tunisia
A f r i c a n D e v e l o p m e n t B a n k
42
Additional Dinars per Household
Extreme Poverty 0 -24.1 -48.2 -120.6 -192.9 -241.1
Remaining Poor 0 -30.8 -61.6 -154 -246.4 -308
Remainder of First Quintile 0 -29.1 -58.2 -145.5 -232.7 -290.9
2nd quintile 0 -33.5 -67.1 -167.7 -268.4 -335.5
3rd quintile 0 -35.9 -71.8 -179.6 -287.3 -359.1
4th quintile 0 -36.3 -72.6 -181.5 -290.5 -363.1
5th quintile 0 -34.9 -69.7 -174.3 -278.9 -348.6
Percentage of Beneficiary Households within a Category
Extreme Poverty 0% 0% 0% 0% 0% 0%
Remaining Poor 0% 0% 0% 0% 0% 0%
Remainder of First Quintile 0% 0% 0% 0% 0% 0%
2nd quintile 0% 0% 0% 0% 0% 0%
3rd quintile 0% 0% 0% 0% 0% 0%
4th quintile 0% 0% 0% 0% 0% 0%
5th quintile 0% 0% 0% 0% 0% 0%
Total Number of Dinars Received per Household
Extreme Poverty 395.2 371.1 346.9 274.6 202.3 154
Remaining Poor 434.9 404.1 373.3 280.9 188.5 126.9
Remainder of First Quintile 451.2 422.1 393.1 305.8 218.5 160.3
2nd quintile 436.8 403.2 369.7 269 168.4 101.3
3rd quintile 441.9 405.9 370 262.3 154.6 82.7
4th quintile 423.4 387.1 350.8 241.9 132.9 60.3
5th quintile 374.9 340.1 305.2 200.6 96 26.3
Breakdown of Budget Allocated to Social Transfers between Categories
Extreme Poverty 12% 12% 12% 13% 26% 20%
Remaining Poor 13% 13% 13% 13% 24% 16%
Remainder of First Quintile 13% 14% 14% 15% 28% 20%
2nd quintile 13% 13% 13% 13% 21% 13%
3rd quintile 13% 13% 13% 13% 20% 10%
4th quintile 13% 12% 12% 12% 17% 8%
5th quintile 11% 11% 11% 10% 12% 3%

Food Subsidies and Direct Social Assistance: Towards Better Targeting of Monetary Poverty and Deprivations in Tunisia
A f r i c a n D e v e l o p m e n t B a n k
43
Option 2.B: New Direct Allocation Procedure
ConstantBudget
10% Reduction inthe SubsidyBudget
20% Reduction inthe SubsidyBudget
50%Reduction inthe SubsidyBudget
80%Reduction inthe SubsidyBudget
100%Reduction inthe SubsidyBudget
Extreme Poverty 0 % 0 % 0 % 0 % 0 % 0.2 %
Extreme Poverty 16.8 % 16.9 % 17.2 % 18.3 % 19.4 % 20.2 %
Additional Dinars per Household
Extreme Poverty 2 194.1 2 169.2 2 144,3 2 069.7 1 995 1 945.3
Remaining Poor 239.9 201.6 163,4 48.6 -66.2 -142.7
Remainder of First Quintile -154.2 -197.9 -241,5 -372.6 -503.6 -590.9
2nd quintile -101.3 -145.6 -189,9 -322.8 -455.7 -544.3
3rd quintile -82.7 -126.8 -170,9 -303.2 -435.5 -523.7
4th quintile -60.3 -100.9 -141,4 -263 -384.6 -465.6
5th quintile -26.3 -61.7 -97,2 -203.5 -309.9 -380.8
Percentage of Beneficiary Households within a Category
Extreme Poverty 100% 100% 100% 100% 100% 100%
Remaining Poor 49% 47% 45% 40% 36% 32%
Remainder of First Quintile 0% 0% 0% 0% 0% 0%
2nd quintile 0% 0% 0% 0% 0% 0%
3rd quintile 0% 0% 0% 0% 0% 0%
4th quintile 0% 0% 0% 0% 0% 0%
5th quintile 0% 0% 0% 0% 0% 0%
Total Number of Dinars Received per Household
Extreme Poverty 2 443 2 418.1 2 393.2 2 318.5 2 243.9 2 194.1
Remaining Poor 622.4 584.2 545.9 431.2 316.4 239.9
Remainder of First Quintile 282.6 238.9 195.2 64.2 -66.8 -154.2
2nd quintile 341.7 297.4 253.1 120.2 -12.7 -101.3
3rd quintile 358.2 314.1 270 137.7 5.4 -82.7
4th quintile 345 304.4 263.9 142.3 20.7 -60.3
5th quintile 328.2 292.8 257.3 151 44.6 -26.3
Breakdown of Budget Allocated to Social Transfers between Categories
Extreme Poverty 52% 54% 57% 69% 88% 109%
Remaining Poor 13% 13% 13% 13% 12% 12%
Remainder of First Quintile 6% 5% 5% 2% -3% -8%
2nd quintile 7% 7% 6% 4% 0% -5%
3rd quintile 8% 7% 6% 4% 0% -4%
4th quintile 7% 7% 6% 4% 1% -3%
5th quintile 7% 7% 6% 4% 2% -1%
NB: the negative subsidy amounts are due to the fact that initially, the PNAFN subsidies were allocated to the poorest households.
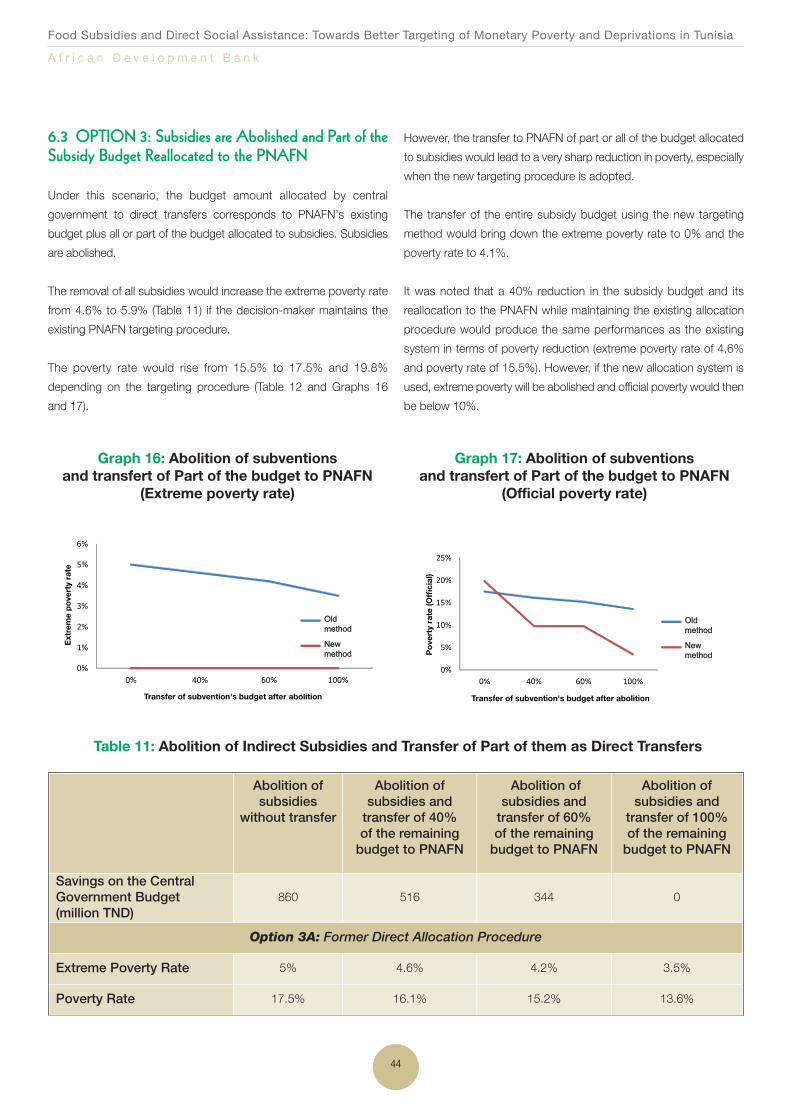
Food Subsidies and Direct Social Assistance: Towards Better Targeting of Monetary Poverty and Deprivations in Tunisia
A f r i c a n D e v e l o p m e n t B a n k
44
6.3 OPTION 3: Subsidies are Abolished and Part of theSubsidy Budget Reallocated to the PNAFN
Under this scenario, the budget amount allocated by central
government to direct transfers corresponds to PNAFN’s existing
budget plus all or part of the budget allocated to subsidies. Subsidies
are abolished.
The removal of all subsidies would increase the extreme poverty rate
from 4.6% to 5.9% (Table 11) if the decision-maker maintains the
existing PNAFN targeting procedure.
The poverty rate would rise from 15.5% to 17.5% and 19.8%
depending on the targeting procedure (Table 12 and Graphs 16
and 17).
However, the transfer to PNAFN of part or all of the budget allocated
to subsidies would lead to a very sharp reduction in poverty, especially
when the new targeting procedure is adopted.
The transfer of the entire subsidy budget using the new targeting
method would bring down the extreme poverty rate to 0% and the
poverty rate to 4.1%.
It was noted that a 40% reduction in the subsidy budget and its
reallocation to the PNAFN while maintaining the existing allocation
procedure would produce the same performances as the existing
system in terms of poverty reduction (extreme poverty rate of 4.6%
and poverty rate of 15.5%). However, if the new allocation system is
used, extreme poverty will be abolished and official poverty would then
be below 10%.
Graph 16: Abolition of subventions and transfert of Part of the budget to PNAFN
(Extreme poverty rate)
OldOldmethodmethod
NewNewmethodmethod
Ext
rem
e p
ove
rty
rate
Transfer of subvention's budget after abolition
Graph 17: Abolition of subventions and transfert of Part of the budget to PNAFN
(Official poverty rate)
OldOldmethodmethod
NewNewmethodmethodP
ove
rty
rate
(Offi
cial
)
Transfer of subvention's budget after abolition
Table 11: Abolition of Indirect Subsidies and Transfer of Part of them as Direct Transfers
Abolition of subsidies
without transfer
Abolition of subsidies and transfer of 40%of the remaining budget to PNAFN
Abolition of subsidies and transfer of 60% of the remaining budget to PNAFN
Abolition of subsidies and transfer of 100% of the remainingbudget to PNAFN
Savings on the Central Government Budget (million TND)
860 516 344 0
Option 3A: Former Direct Allocation Procedure
Extreme Poverty Rate 5% 4.6% 4.2% 3.5%
Poverty Rate 17.5% 16.1% 15.2% 13.6%

Food Subsidies and Direct Social Assistance: Towards Better Targeting of Monetary Poverty and Deprivations in Tunisia
A f r i c a n D e v e l o p m e n t B a n k
45
Additional Dinars per Household
Extreme Poverty -290.9 -125.1 -42.3 123.5
Remaining Poor -335.5 -149.6 -56.6 129.3
Remainder of First Quintile -359.1 -199.7 -119.9 39.5
2nd quintile -363.1 -227.6 -159.8 -24.3
3rd quintile -348.6 -201.4 -127.8 19.5
4th quintile 77.6 0.2 0.3 0.5
5th quintile 154 0.3 0.4 0.6
Percentage of Beneficiary Households within a Category
Extreme Poverty 0% 0% 100% 100%
Remaining Poor 0% 0% 93% 100%
Remainder of First Quintile 0% 0% 44% 77%
2nd quintile 0% 0% 41% 79%
3rd quintile 0% 0% 11% 56%
4th quintile 0% 0% 1% 28%
5th quintile 0% 0% 0% 63%
Total Number of Dinars Received per Household
Extreme Poverty 154 333.4 423.1 602.5
Remaining Poor 126.9 349.9 461.3 684.3
Remainder of First Quintile 160.3 326.1 409 574.8
2nd quintile 101.3 287.2 380.1 566
3rd quintile 82.7 242.2 321.9 481.4
4th quintile 60.3 195.8 263.6 399.1
5th quintile 26.3 173.5 247.2 394.4
Breakdown of Budget Allocated to Social Transfers between Categories
Extreme Poverty 22% 17% 17% 16%
Remaining Poor 18% 18% 18% 18%
Remainder of First Quintile 23% 17% 16% 16%
2nd quintile 14% 15% 15% 15%
3rd quintile 12% 13% 13% 13%
4th quintile 8% 10% 11% 11%
5th quintile 4% 9% 10% 11%

Food Subsidies and Direct Social Assistance: Towards Better Targeting of Monetary Poverty and Deprivations in Tunisia
A f r i c a n D e v e l o p m e n t B a n k
46
Option 3B: New Direct Allocation Procedure
Abolition of subsidies
without transfer
Abolition of subsidies and transfer of 40%of the remaining budget to PNAFN
Abolition of subsidies and transfer of 60% of the remaining budget to PNAFN
Abolition of subsidies and transfer of 100% of the remainingbudget to PNAFN
Extreme Poverty Rate 0% 0% 0% 0%
Poverty Rate 19.8% 9.8% 9.8% 3.5%
Additional Dinars Per Household
Extreme Poverty 1 962.6 3 538.1 4 147 5 029
Remaining Poor -44.3 952.6 1 448.6 2 217.9
Remainder of First Quintile -508.4 164.4 648.8 1 404.4
2nd quintile -529.9 -529.9 -528.9 -405.3
3rd quintile -527.8 -527.8 -527.8 -527.8
4th quintile -492.1 -492.1 -492.1 -492.1
5th quintile -441.4 -441.4 -441.4 -441.4
Percentage of Beneficiary Households in a Category
Extreme Poverty 100% 100% 100% 100%
Remaining Poor 39% 73% 85% 98%
Remainder of First Quintile 39% 73% 85% 98%
2nd quintile 0% 55% 79% 100%
3rd quintile 0% 0% 0% 12%
4th quintile 0% 0% 0% 0%
5th quintile 0% 0% 0% 0%
Total Number of Dinars Received per Household
Extreme Poverty 2 298.3 3 873.8 4 482.7 5 364.7
Remaining Poor 425.1 1 422 1 918 2 687.3
Remainder of First Quintile 15.2 688 1 172.4 1 928
2nd quintile 0 0 0.9 124.6
3rd quintile 0 0 0 0
4th quintile 0 0 0 0
5th quintile 0 0 0 0

Food Subsidies and Direct Social Assistance: Towards Better Targeting of Monetary Poverty and Deprivations in Tunisia
A f r i c a n D e v e l o p m e n t B a n k
47
Breakdown of Budget Allocated to Social Transfers between Categories
Extreme Poverty 84% 65% 59% 53%
Remaining Poor 16% 24% 25% 27%
Remainder of First Quintile 1% 11% 15% 19%
2nd quintile 0% 0% 0% 1%
3rd quintile 0% 0% 0% 0%
4th quintile 0% 0% 0% 0%
5th quintile 0% 0% 0% 0%
6.4 OPTION 4: Part of the Subsidy Budget is Allocatedto PNAFN, the total budget remaining constant
Under this scenario; it is assumed that the totality of the central
government budget allocated to direct and indirect subsidies
remains constant. However, the budget allocated to subsidies varies;
since the savings made are reallocated to the PNAFN. The subsidies
however, are maintained; but to a lesser extent (Table 12 and Graphs
18 and 19).
The reallocation of subsidy budgets as direct transfers contributes to
a significant reduction in poverty levels. These reductions are even
more significant if the new direct targeting procedure is adopted.
The reductions become increasingly significant as the transfer
percentage increases. This simulation shows that there are no
grounds for maintaining indirect subsidies since no scenario results
in a better performance than the abolition of subsidies and the
reallocation of the related budget to direct transfers.
Graph 18: Subsidies are maintained but part oftheir budget is transferred to PNAFN
(Extreme poverty rate)
OldOldmethodmethod
NewNewmethodmethod
Extre
me po
verty
rate
Graph 19: Subsidies are maintained but part oftheir budget is transferred to PNAFN
(Official poverty rate)
OldOldmethodmethod
NewNewmethodmethod
Pove
rty ra
te (of
ficial
)

Food Subsidies and Direct Social Assistance: Towards Better Targeting of Monetary Poverty and Deprivations in Tunisia
A f r i c a n D e v e l o p m e n t B a n k
48
Table 12: Transfer of Part of the Indirect Transfer Budget to Direct Transfers (constant Central Government Budget)
Scenario 4A: Direct Transfer using the former procedure
Budget fully allocated to subsidies
Transfer of 40% of subsidy budget
to PNAFN
Transfer of 60%of subsidy budget
to PNAFN
Transfer of 100% of subsidy budget
to PNAFN
Extreme Poverty Rate 3.9% 4% 3.8% 3.5%
Poverty Rate 14.5% 14.6% 14.2% 13.6%
Additional Dinars per Household
Extreme Poverty 0 82.9 124.4 207.4
Remaining Poor 0 99.8 149.7 249.4
Remainder of First Quintile 0 49.4 74.1 123.5
2nd quintile 0 51.7 77.6 129.3
3rd quintile 0 15.8 23.7 39.5
4th quintile 0 -9.7 -14.6 -24.3
5th quintile 0 7.8 11.7 19.5
Percentage of Beneficiary Households within a Category
Extreme Poverty 100% 100% 100% 100%
Remaining Poor 100% 100% 100% 100%
Remainder of First Quintile 100% 77% 77% 77%
2nd quintile 100% 79% 79% 79%
3rd quintile 100% 56% 56% 56%
4th quintile 100% 28% 28% 28%
5th quintile 100% 63% 63% 63%
Total Number of Dinars Received per Household
Extreme Poverty 395.2 478.1 519.6 602.5
Remaining Poor 434.9 534.6 584.5 684.3
Remainder of First Quintile 451.2 500.7 525.4 574.8
2nd quintile 436.8 488.5 514.3 566
3rd quintile 441.9 457.7 465.6 481.4
4th quintile 423.4 413.7 408.8 399.1
5th quintile 374.9 382.7 386.6 394.4
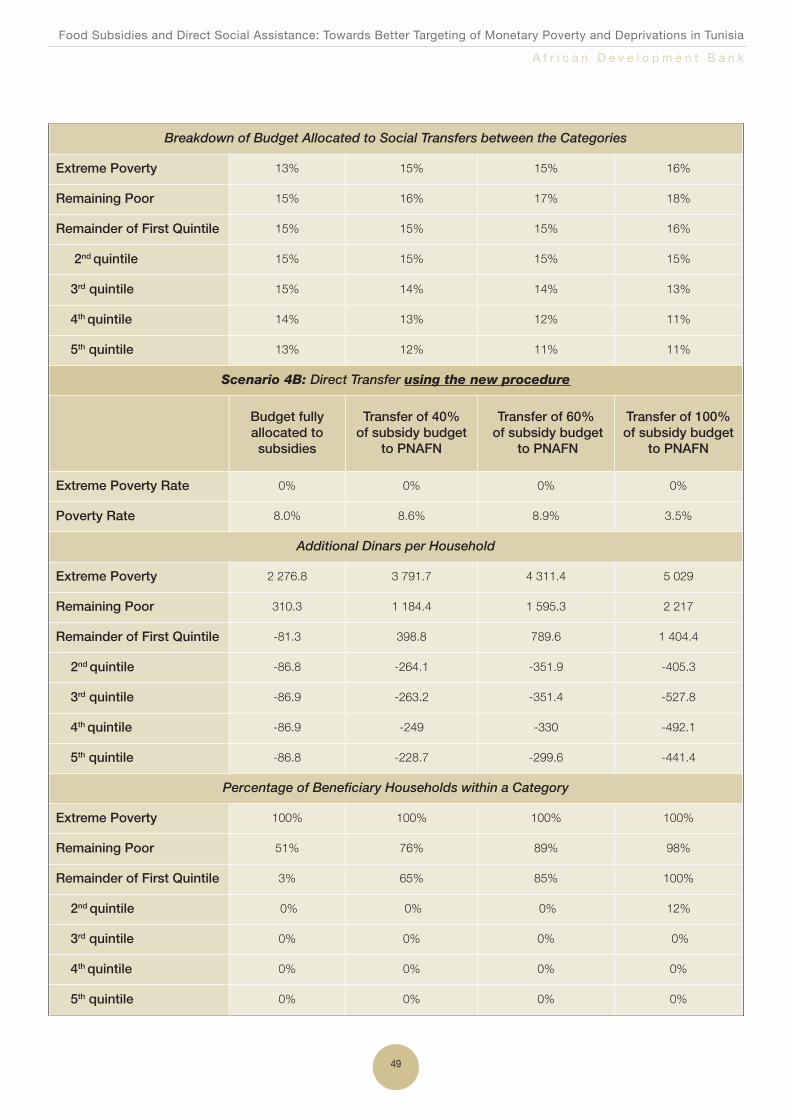
Food Subsidies and Direct Social Assistance: Towards Better Targeting of Monetary Poverty and Deprivations in Tunisia
A f r i c a n D e v e l o p m e n t B a n k
49
Breakdown of Budget Allocated to Social Transfers between the Categories
Extreme Poverty 13% 15% 15% 16%
Remaining Poor 15% 16% 17% 18%
Remainder of First Quintile 15% 15% 15% 16%
2nd quintile 15% 15% 15% 15%
3rd quintile 15% 14% 14% 13%
4th quintile 14% 13% 12% 11%
5th quintile 13% 12% 11% 11%
Scenario 4B: Direct Transfer using the new procedure
Budget fully allocated to subsidies
Transfer of 40% of subsidy budget
to PNAFN
Transfer of 60%of subsidy budget
to PNAFN
Transfer of 100% of subsidy budget
to PNAFN
Extreme Poverty Rate 0% 0% 0% 0%
Poverty Rate 8.0% 8.6% 8.9% 3.5%
Additional Dinars per Household
Extreme Poverty 2 276.8 3 791.7 4 311.4 5 029
Remaining Poor 310.3 1 184.4 1 595.3 2 217
Remainder of First Quintile -81.3 398.8 789.6 1 404.4
2nd quintile -86.8 -264.1 -351.9 -405.3
3rd quintile -86.9 -263.2 -351.4 -527.8
4th quintile -86.9 -249 -330 -492.1
5th quintile -86.8 -228.7 -299.6 -441.4
Percentage of Beneficiary Households within a Category
Extreme Poverty 100% 100% 100% 100%
Remaining Poor 51% 76% 89% 98%
Remainder of First Quintile 3% 65% 85% 100%
2nd quintile 0% 0% 0% 12%
3rd quintile 0% 0% 0% 0%
4th quintile 0% 0% 0% 0%
5th quintile 0% 0% 0% 0%
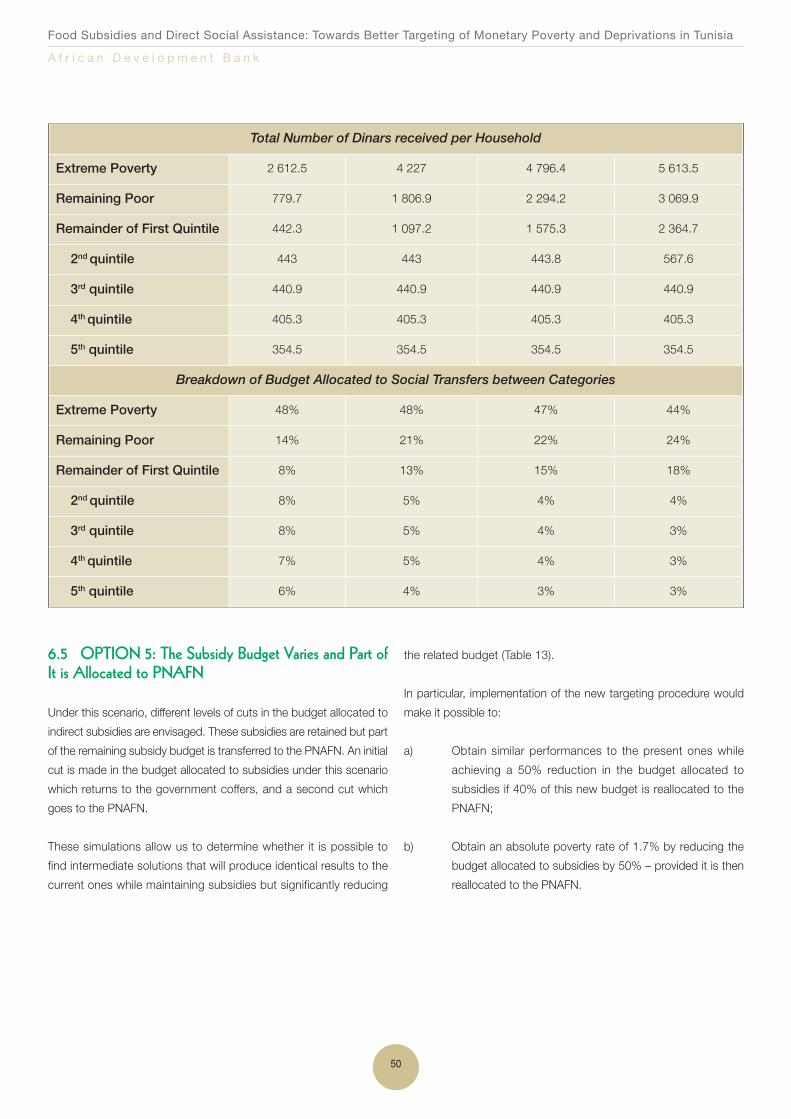
Food Subsidies and Direct Social Assistance: Towards Better Targeting of Monetary Poverty and Deprivations in Tunisia
A f r i c a n D e v e l o p m e n t B a n k
50
Total Number of Dinars received per Household
Extreme Poverty 2 612.5 4 227 4 796.4 5 613.5
Remaining Poor 779.7 1 806.9 2 294.2 3 069.9
Remainder of First Quintile 442.3 1 097.2 1 575.3 2 364.7
2nd quintile 443 443 443.8 567.6
3rd quintile 440.9 440.9 440.9 440.9
4th quintile 405.3 405.3 405.3 405.3
5th quintile 354.5 354.5 354.5 354.5
Breakdown of Budget Allocated to Social Transfers between Categories
Extreme Poverty 48% 48% 47% 44%
Remaining Poor 14% 21% 22% 24%
Remainder of First Quintile 8% 13% 15% 18%
2nd quintile 8% 5% 4% 4%
3rd quintile 8% 5% 4% 3%
4th quintile 7% 5% 4% 3%
5th quintile 6% 4% 3% 3%
6.5 OPTION 5: The Subsidy Budget Varies and Part ofIt is Allocated to PNAFN
Under this scenario, different levels of cuts in the budget allocated to
indirect subsidies are envisaged. These subsidies are retained but part
of the remaining subsidy budget is transferred to the PNAFN. An initial
cut is made in the budget allocated to subsidies under this scenario
which returns to the government coffers, and a second cut which
goes to the PNAFN.
These simulations allow us to determine whether it is possible to
find intermediate solutions that will produce identical results to the
current ones while maintaining subsidies but significantly reducing
the related budget (Table 13).
In particular, implementation of the new targeting procedure would
make it possible to:
a) Obtain similar performances to the present ones while
achieving a 50% reduction in the budget allocated to
subsidies if 40% of this new budget is reallocated to the
PNAFN;
b) Obtain an absolute poverty rate of 1.7% by reducing the
budget allocated to subsidies by 50% – provided it is then
reallocated to the PNAFN.
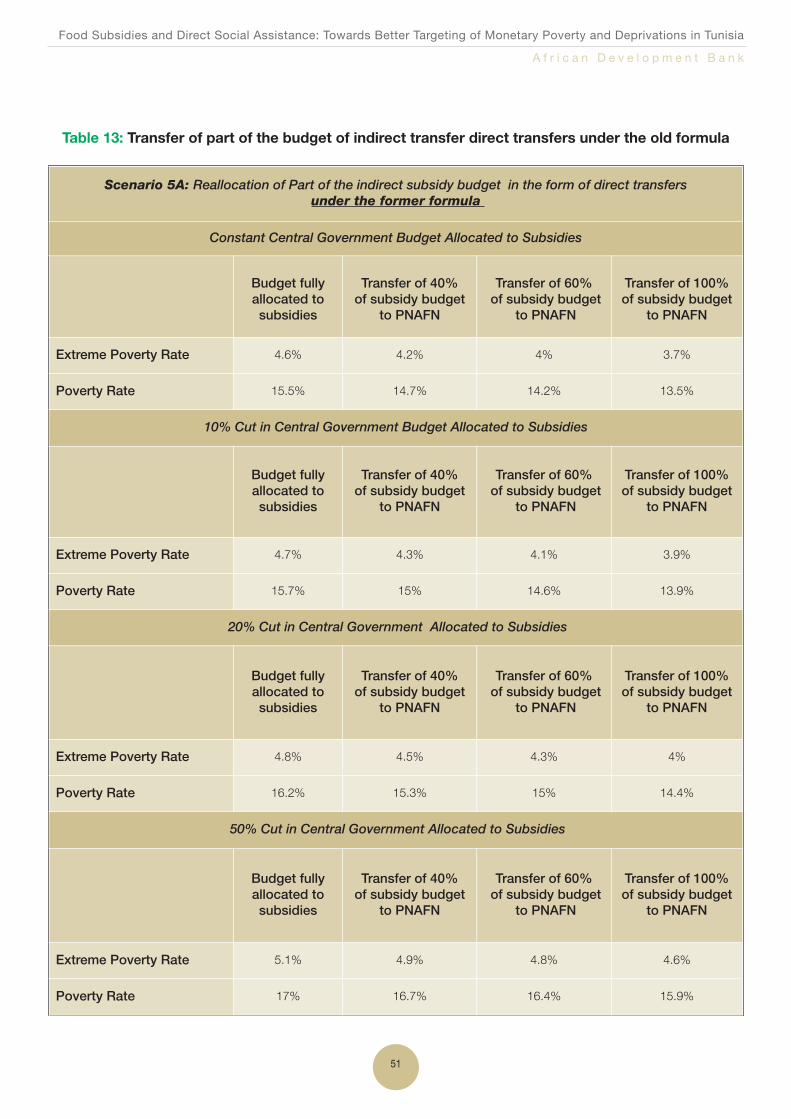
Food Subsidies and Direct Social Assistance: Towards Better Targeting of Monetary Poverty and Deprivations in Tunisia
A f r i c a n D e v e l o p m e n t B a n k
51
Table 13: Transfer of part of the budget of indirect transfer direct transfers under the old formula
Scenario 5A: Reallocation of Part of the indirect subsidy budget in the form of direct transfers under the former formula
Constant Central Government Budget Allocated to Subsidies
Budget fully allocated to subsidies
Transfer of 40% of subsidy budget
to PNAFN
Transfer of 60%of subsidy budget
to PNAFN
Transfer of 100% of subsidy budget
to PNAFN
Extreme Poverty Rate 4.6% 4.2% 4% 3.7%
Poverty Rate 15.5% 14.7% 14.2% 13.5%
10% Cut in Central Government Budget Allocated to Subsidies
Budget fully allocated to subsidies
Transfer of 40% of subsidy budget
to PNAFN
Transfer of 60%of subsidy budget
to PNAFN
Transfer of 100% of subsidy budget
to PNAFN
Extreme Poverty Rate 4.7% 4.3% 4.1% 3.9%
Poverty Rate 15.7% 15% 14.6% 13.9%
20% Cut in Central Government Allocated to Subsidies
Budget fully allocated to subsidies
Transfer of 40% of subsidy budget
to PNAFN
Transfer of 60%of subsidy budget
to PNAFN
Transfer of 100% of subsidy budget
to PNAFN
Extreme Poverty Rate 4.8% 4.5% 4.3% 4%
Poverty Rate 16.2% 15.3% 15% 14.4%
50% Cut in Central Government Allocated to Subsidies
Budget fully allocated to subsidies
Transfer of 40% of subsidy budget
to PNAFN
Transfer of 60%of subsidy budget
to PNAFN
Transfer of 100% of subsidy budget
to PNAFN
Extreme Poverty Rate 5.1% 4.9% 4.8% 4.6%
Poverty Rate 17% 16.7% 16.4% 15.9%
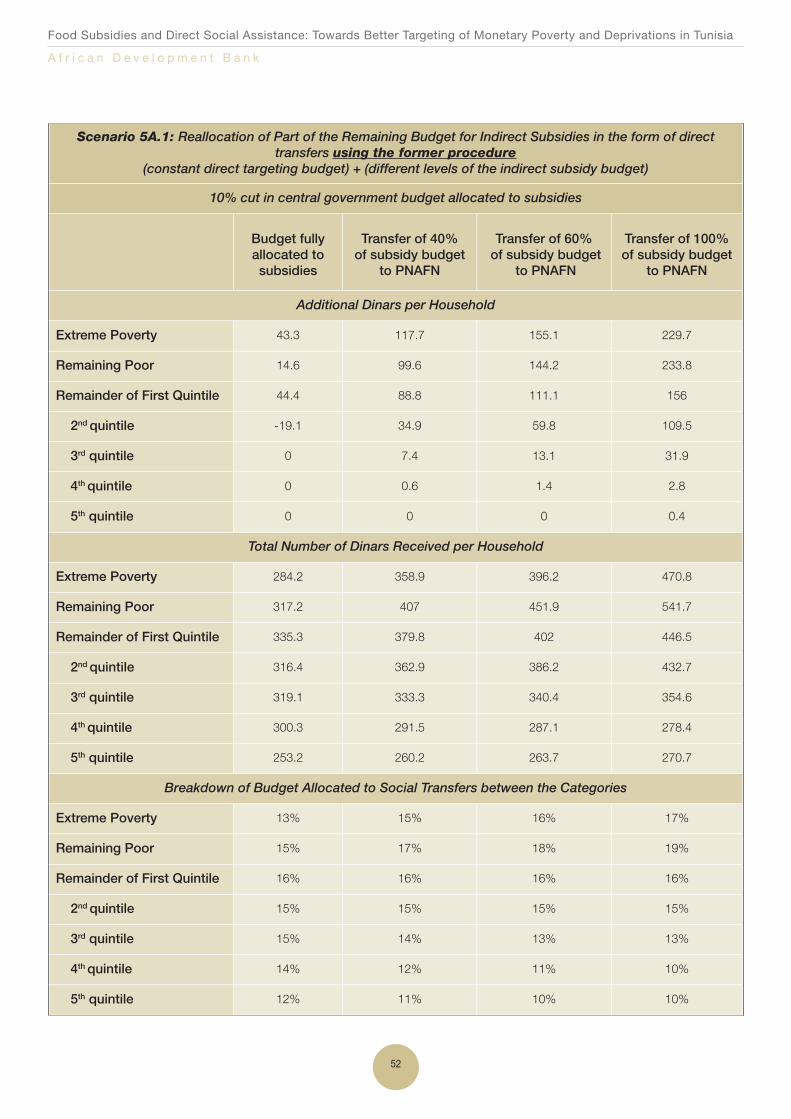
Food Subsidies and Direct Social Assistance: Towards Better Targeting of Monetary Poverty and Deprivations in Tunisia
A f r i c a n D e v e l o p m e n t B a n k
52
Scenario 5A.1: Reallocation of Part of the Remaining Budget for Indirect Subsidies in the form of direct transfers using the former procedure
(constant direct targeting budget) + (different levels of the indirect subsidy budget)
10% cut in central government budget allocated to subsidies
Budget fully allocated to subsidies
Transfer of 40% of subsidy budget
to PNAFN
Transfer of 60%of subsidy budget
to PNAFN
Transfer of 100% of subsidy budget
to PNAFN
Additional Dinars per Household
Extreme Poverty 43.3 117.7 155.1 229.7
Remaining Poor 14.6 99.6 144.2 233.8
Remainder of First Quintile 44.4 88.8 111.1 156
2nd quintile -19.1 34.9 59.8 109.5
3rd quintile 0 7.4 13.1 31.9
4th quintile 0 0.6 1.4 2.8
5th quintile 0 0 0 0.4
Total Number of Dinars Received per Household
Extreme Poverty 284.2 358.9 396.2 470.8
Remaining Poor 317.2 407 451.9 541.7
Remainder of First Quintile 335.3 379.8 402 446.5
2nd quintile 316.4 362.9 386.2 432.7
3rd quintile 319.1 333.3 340.4 354.6
4th quintile 300.3 291.5 287.1 278.4
5th quintile 253.2 260.2 263.7 270.7
Breakdown of Budget Allocated to Social Transfers between the Categories
Extreme Poverty 13% 15% 16% 17%
Remaining Poor 15% 17% 18% 19%
Remainder of First Quintile 16% 16% 16% 16%
2nd quintile 15% 15% 15% 15%
3rd quintile 15% 14% 13% 13%
4th quintile 14% 12% 11% 10%
5th quintile 12% 11% 10% 10%

Food Subsidies and Direct Social Assistance: Towards Better Targeting of Monetary Poverty and Deprivations in Tunisia
A f r i c a n D e v e l o p m e n t B a n k
53
Scenario 5A.2: Reallocation of Part of the Remaining Budget for Indirect Subsidies in the form of direct transfers using the former procedure
(constant direct targeting budget) + (different levels of the indirect subsidy budget)
20% Cut in Central Government Budget Allocated to Subsidies
Budget fully allocated to subsidies
Transfer of 40% of subsidy budget
to PNAFN
Transfer of 60%of subsidy budget
to PNAFN
Transfer of 100% of subsidy budget
to PNAFN
Additional Dinars per Household
Extreme Poverty 19.4 85.3 118.5 184.9
Remaining Poor -11.8 60.9 100.2 178.9
Remainder of First Quintile 15.3 55 75 115.5
2nd quintile -52.7 16.1 34.6 71.6
3rd quintile 0 2.4 7.5 17.7
4th quintile 0 0 0.6 1.9
5th quintile 0 0 0 0.1
Total Number of Dinars received per Household
Extreme Poverty 260.1 326.5 359.6 426
Remaining Poor 286.4 366.2 406.1 486
Remainder of First Quintile 306.2 345.7 365.5 405
2nd quintile 282.8 324.2 344.9 386.2
3rd quintile 283.2 295.8 302.1 314.8
4th quintile 263.9 256.2 252.3 244.5
5th quintile 218.4 224.6 227.7 233.9
Breakdown of Budget allocated to Social Transfers between Categories
Extreme Poverty 14% 15% 16% 17%
Remaining Poor 15% 17% 18% 19%
Remainder of First Quintile 16% 16% 16% 16%
2nd quintile 15% 15% 15% 15%
3rd quintile 15% 14% 13% 13%
4th quintile 14% 12% 11% 10%
5th quintile 11% 10% 10% 9%
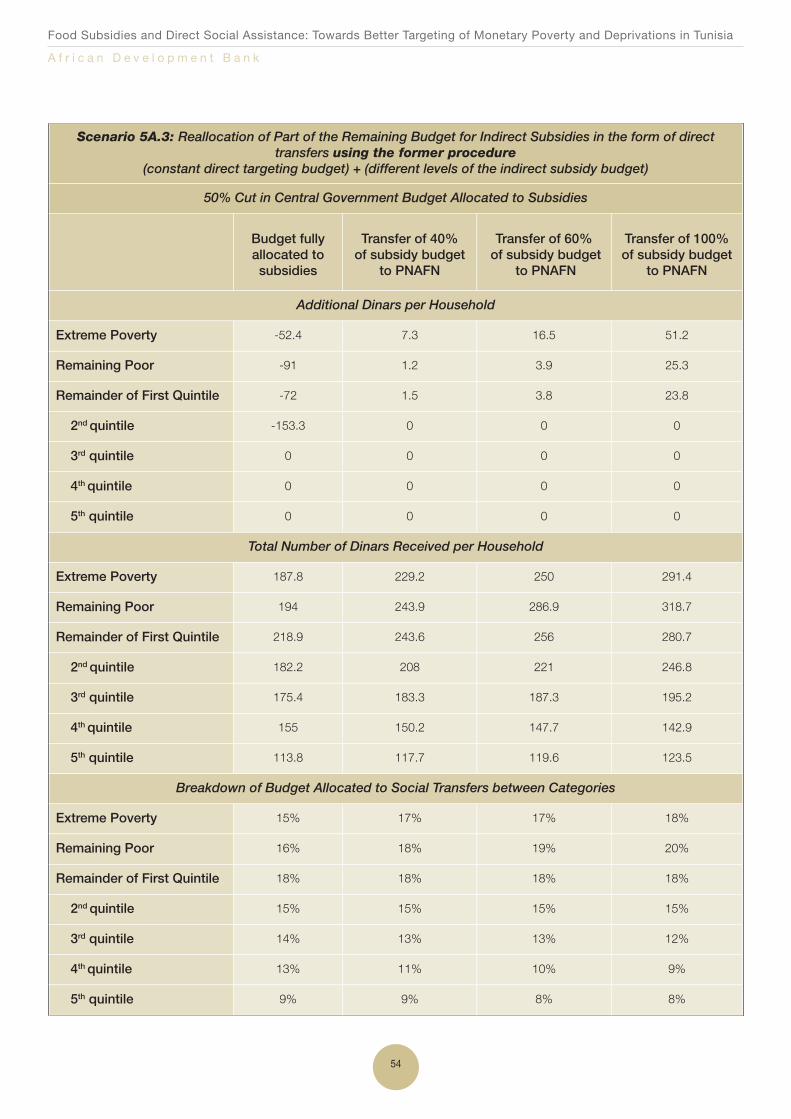
Food Subsidies and Direct Social Assistance: Towards Better Targeting of Monetary Poverty and Deprivations in Tunisia
A f r i c a n D e v e l o p m e n t B a n k
54
Scenario 5A.3: Reallocation of Part of the Remaining Budget for Indirect Subsidies in the form of direct transfers using the former procedure
(constant direct targeting budget) + (different levels of the indirect subsidy budget)
50% Cut in Central Government Budget Allocated to Subsidies
Budget fully allocated to subsidies
Transfer of 40% of subsidy budget
to PNAFN
Transfer of 60%of subsidy budget
to PNAFN
Transfer of 100% of subsidy budget
to PNAFN
Additional Dinars per Household
Extreme Poverty -52.4 7.3 16.5 51.2
Remaining Poor -91 1.2 3.9 25.3
Remainder of First Quintile -72 1.5 3.8 23.8
2nd quintile -153.3 0 0 0
3rd quintile 0 0 0 0
4th quintile 0 0 0 0
5th quintile 0 0 0 0
Total Number of Dinars Received per Household
Extreme Poverty 187.8 229.2 250 291.4
Remaining Poor 194 243.9 286.9 318.7
Remainder of First Quintile 218.9 243.6 256 280.7
2nd quintile 182.2 208 221 246.8
3rd quintile 175.4 183.3 187.3 195.2
4th quintile 155 150.2 147.7 142.9
5th quintile 113.8 117.7 119.6 123.5
Breakdown of Budget Allocated to Social Transfers between Categories
Extreme Poverty 15% 17% 17% 18%
Remaining Poor 16% 18% 19% 20%
Remainder of First Quintile 18% 18% 18% 18%
2nd quintile 15% 15% 15% 15%
3rd quintile 14% 13% 13% 12%
4th quintile 13% 11% 10% 9%
5th quintile 9% 9% 8% 8%

Food Subsidies and Direct Social Assistance: Towards Better Targeting of Monetary Poverty and Deprivations in Tunisia
A f r i c a n D e v e l o p m e n t B a n k
55
Scenario 5B: Reallocation of Part of the Remaining Budget for Indirect Subsidies in the form of direct transfers using the new procedure51
(constant direct targeting budget) + (different levels of the indirect subsidy budget)
Constant Central Government Budget Allocated to Subsidies
Budget fully allocated to subsidies
Transfer of 40% of subsidy budget
to PNAFN
Transfer of 60%of subsidy budget
to PNAFN
Transfer of 100% of subsidy budget
to PNAFN
Extreme Poverty Rate 3% 2.1% 1.5% 0.7%
Poverty Rate 17.4% 13.5% 13.3% 9.7%
10% Cut in Central Government Budget Allocated to Subsidies
Budget fully allocated to subsidies
Transfer of 40% of subsidy budget
to PNAFN
Transfer of 60%of subsidy budget
to PNAFN
Transfer of 100% of subsidy budget
to PNAFN
Extreme Poverty Rate 3% 2.4% 1.5% 0.7%
Poverty Rate 15% 13.9% 13.6% 9.9%
20% Cut in Central Government Budget Allocated to Subsidies
Budget fully allocated to subsidies
Transfer of 40% of subsidy budget
to PNAFN
Transfer of 60%of subsidy budget
to PNAFN
Transfer of 100% of subsidy budget
to PNAFN
Extreme Poverty Rate 3.7% 2.4% 2.2% 1.6%
Poverty Rate 15.2% 14.1% 13.6% 12.7%
50% Cut in Central Government Budget Allocated to Subsidies
Budget fully allocated to subsidies
Transfer of 40% of subsidy budget
to PNAFN
Transfer of 60%of subsidy budget
to PNAFN
Transfer of 100% of subsidy budget
to PNAFN
Extreme Poverty Rate 4% 3.2% 2.7% 1.4%
Poverty Rate 16.1% 15.4% 14.7% 13.9%
51 It should be remembered that the amounts of reallocated direct transfers are defined by:
Overall amounts transferred
Transfer PNAFN Transfer Indirect Transfer Constant Budget 10% budget cut 20% budget cut 50% budget cut 80% budget cut20% 220 172 392 375 358 306 25440% 220 344 564 530 495 392 28960% 220 516 736 684 633 478 32380% 220 688 908 839 770 564 358100% 220 860 1080 994 908 650 392

Food Subsidies and Direct Social Assistance: Towards Better Targeting of Monetary Poverty and Deprivations in Tunisia
A f r i c a n D e v e l o p m e n t B a n k
56
Scenario 5B.1: Reallocation of Part of the Remaining Budget for Indirect Subsidies in the form of direct transfers using the former procedure
(constant direct targeting budget) + (different levels of the indirect subsidy budget)
10% Cut in Central Government Budget Allocated to Subsidies
Budget fully allocated to subsidies
Transfer of 40% of subsidy budget
to PNAFN
Transfer of 60%of subsidy budget
to PNAFN
Transfer of 100% of subsidy budget
to PNAFN
Additional Dinars per Household
Extreme Poverty 2 244.1 3 622.4 4 089.7 4 833.2
Remaining Poor 336.7 1 123.9 1 450.7 2 051.1
Remainder of First Quintile 0.2 386.6 661.6 1 236.6
2nd quintile 0 0 0 5.9
3rd quintile 0 0 0 0
4th quintile 0 0 0 0
5th quintile 0 0 0 0
Total number of dinars received per household
Extreme Poverty 2 468.1 3 846.4 4 313.6 5 057.1
Remaining Poor 681 1 468.2 1 795.0 2 395.4
Remainder of First Quintile 393.2 779.7 1 054.7 1 629.7
2nd quintile 398.7 398.7 398.7 404.6
3rd quintile 396.8 396.8 396.8 396.8
4th quintile 364.8 364.8 364.8 364.8
5th quintile 319.1 319.1 319.1 319,.1
Breakdown of Budget Allocated to Social Transfers between Categories
Extreme Poverty 49% 51% 50% 48%
Remaining Poor 14% 19% 21% 23%
Remainder of First Quintile 8% 10% 12% 15%
2nd quintile 8% 5% 5% 4%
3rd quintile 8% 5% 5% 4%
4th quintile 7% 5% 4% 3%
5th quintile 6% 4% 4% 3%
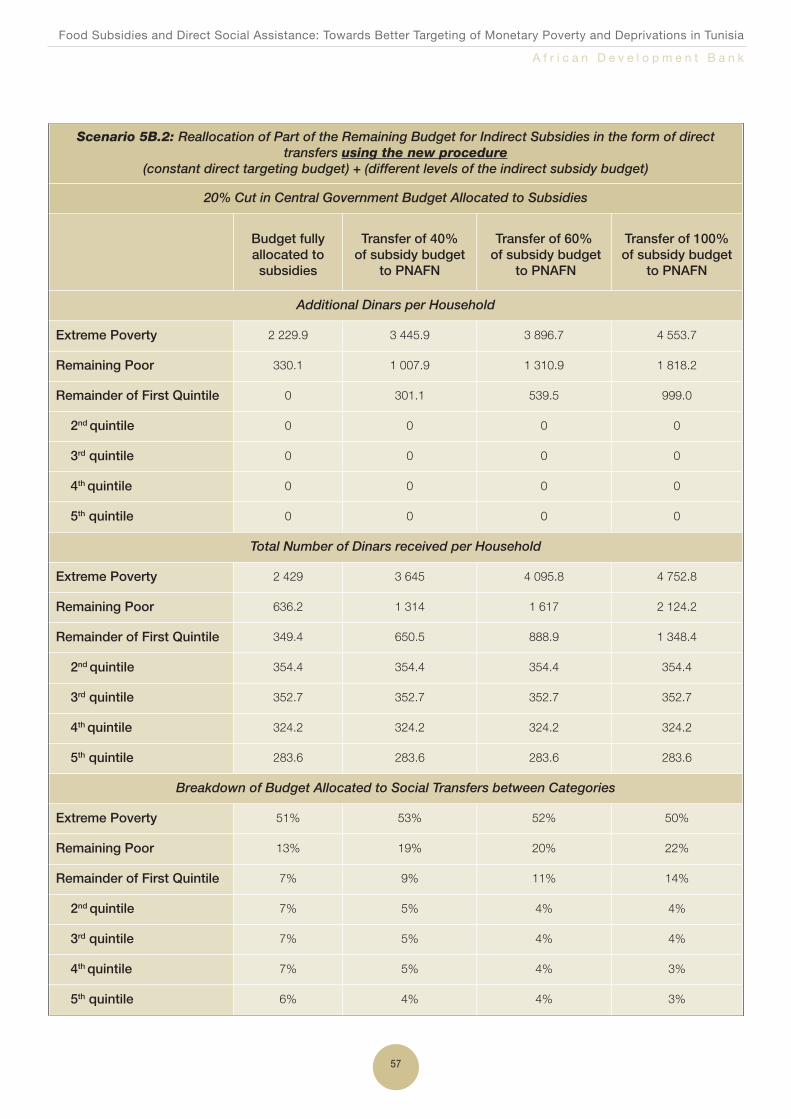
Food Subsidies and Direct Social Assistance: Towards Better Targeting of Monetary Poverty and Deprivations in Tunisia
A f r i c a n D e v e l o p m e n t B a n k
57
Scenario 5B.2: Reallocation of Part of the Remaining Budget for Indirect Subsidies in the form of direct transfers using the new procedure
(constant direct targeting budget) + (different levels of the indirect subsidy budget)
20% Cut in Central Government Budget Allocated to Subsidies
Budget fully allocated to subsidies
Transfer of 40% of subsidy budget
to PNAFN
Transfer of 60%of subsidy budget
to PNAFN
Transfer of 100% of subsidy budget
to PNAFN
Additional Dinars per Household
Extreme Poverty 2 229.9 3 445.9 3 896.7 4 553.7
Remaining Poor 330.1 1 007.9 1 310.9 1 818.2
Remainder of First Quintile 0 301.1 539.5 999.0
2nd quintile 0 0 0 0
3rd quintile 0 0 0 0
4th quintile 0 0 0 0
5th quintile 0 0 0 0
Total Number of Dinars received per Household
Extreme Poverty 2 429 3 645 4 095.8 4 752.8
Remaining Poor 636.2 1 314 1 617 2 124.2
Remainder of First Quintile 349.4 650.5 888.9 1 348.4
2nd quintile 354.4 354.4 354.4 354.4
3rd quintile 352.7 352.7 352.7 352.7
4th quintile 324.2 324.2 324.2 324.2
5th quintile 283.6 283.6 283.6 283.6
Breakdown of Budget Allocated to Social Transfers between Categories
Extreme Poverty 51% 53% 52% 50%
Remaining Poor 13% 19% 20% 22%
Remainder of First Quintile 7% 9% 11% 14%
2nd quintile 7% 5% 4% 4%
3rd quintile 7% 5% 4% 4%
4th quintile 7% 5% 4% 3%
5th quintile 6% 4% 4% 3%
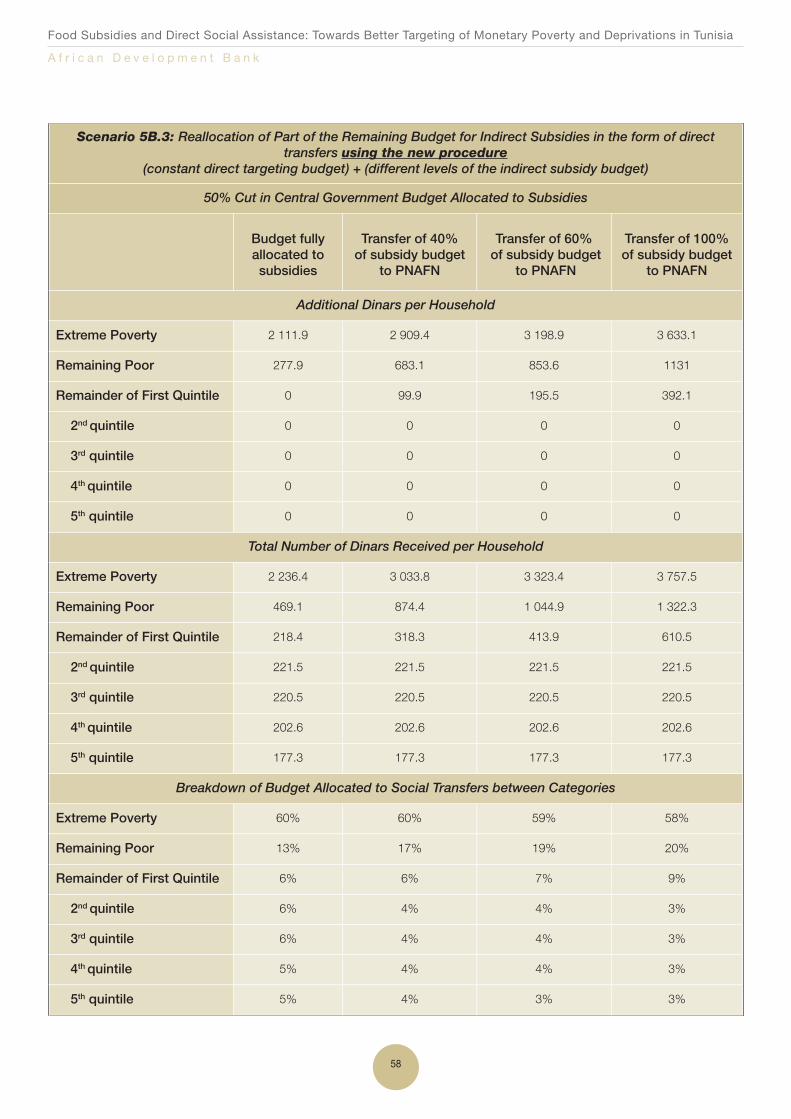
Food Subsidies and Direct Social Assistance: Towards Better Targeting of Monetary Poverty and Deprivations in Tunisia
A f r i c a n D e v e l o p m e n t B a n k
58
Scenario 5B.3: Reallocation of Part of the Remaining Budget for Indirect Subsidies in the form of directtransfers using the new procedure
(constant direct targeting budget) + (different levels of the indirect subsidy budget)
50% Cut in Central Government Budget Allocated to Subsidies
Budget fully allocated to subsidies
Transfer of 40% of subsidy budget
to PNAFN
Transfer of 60%of subsidy budget
to PNAFN
Transfer of 100% of subsidy budget
to PNAFN
Additional Dinars per Household
Extreme Poverty 2 111.9 2 909.4 3 198.9 3 633.1
Remaining Poor 277.9 683.1 853.6 1131
Remainder of First Quintile 0 99.9 195.5 392.1
2nd quintile 0 0 0 0
3rd quintile 0 0 0 0
4th quintile 0 0 0 0
5th quintile 0 0 0 0
Total Number of Dinars Received per Household
Extreme Poverty 2 236.4 3 033.8 3 323.4 3 757.5
Remaining Poor 469.1 874.4 1 044.9 1 322.3
Remainder of First Quintile 218.4 318.3 413.9 610.5
2nd quintile 221.5 221.5 221.5 221.5
3rd quintile 220.5 220.5 220.5 220.5
4th quintile 202.6 202.6 202.6 202.6
5th quintile 177.3 177.3 177.3 177.3
Breakdown of Budget Allocated to Social Transfers between Categories
Extreme Poverty 60% 60% 59% 58%
Remaining Poor 13% 17% 19% 20%
Remainder of First Quintile 6% 6% 7% 9%
2nd quintile 6% 4% 4% 3%
3rd quintile 6% 4% 4% 3%
4th quintile 5% 4% 4% 3%
5th quintile 5% 4% 3% 3%

Food Subsidies and Direct Social Assistance: Towards Better Targeting of Monetary Poverty and Deprivations in Tunisia
A f r i c a n D e v e l o p m e n t B a n k
59
52 Analysis of the Impact of Food Subsidies and Programmes on the Poor and Vulnerable Segments of the Population. http://www.cres.tn/uploads/tx_wdbiblio/rapport_impact_des_subvention_01.pdf
6.6 OPTION 6: Some Food Products are No LongerSubsidized and the Savings Transferred to PNAF and OtherSubsidies (the central government budget remains constant)
Under this scenario, it is intended to remove the subsidies on a
number of products starting with products having been identified
as having little impact on poverty52. Part of the budget allocated to
these subsidies is then transferred to PNAFN or to other subsidies –
the central government budget remaining constant (Table 14 – the
detailed results are presented in Annex VIII).
These analyses show that, with effective steering, it is possible to
reconcile several objectives: eradicate extreme poverty, reduce
poverty and preserve part of the subsidies especially those with a
confirmed distributory effect while abolishing the most ineffective ones
in order to minimize the impact on the purchasing power of the other
segments of the population.
These analyses also show that the removal of those subsidies with
the lowest redistributory impact and the reallocation of that budget to
the PNAFN will have a highly significant impact on the extreme
poverty rate and poverty rate, even though the new PNAFN
methodology is not adopted. Thus, removal of the subsidy on the
French loaf alone and the transfer of that budget to PNAFN results
in a 1.1 point reduction in extreme poverty and a 2.2 percentage
drop in the poverty rate. However, if the new PNAFN methodology
is not adopted, abolition of virtually all subsidies and the
reallocation of that budget to the PNAFN would exacerbate the
situation.
If the new method is adopted, as in the case of the previous
simulations, extreme poverty will be eradicated and poverty
spectacularly reduced. However, there is no better scenario in
terms of poverty reduction than the abolition of all subsidies and
the transfer of that budget to the PNAFN. On the other hand,
the removal of targeted products produces sound performances
(poverty rate of around 8%) while having negligible impact on the
purchasing power of the 2nd and 3rd quintiles of the population (often
translating into a net gain or a drop of between TND 100 to 200
per year).

Food Subsidies and Direct Social Assistance: Towards Better Targeting of Monetary Poverty and Deprivations in Tunisia
A f r i c a n D e v e l o p m e n t B a n k
60
Table 14: Reallocation of part of the subsidy budget in the form of direct transfers usingthe former formula
Scenario 6A: Reallocation of part of the subsidy budget in the form of direct transfers usingthe former formula
Abolition of subsidies on the French « loaf »
Budget for abolished
subsidies fullyreallocated toother subsidies
Transfer of 40% ofabolished subsidiesto PNAFN and 60%reallocated to other
subsidies
Transfer of 60% ofabolished subsidiesto PNAFN and 40%reallocated to other
subsidies
Transfer of 100%ofabolished surveys
to PNAFN
Extreme Poverty Rate 4.6% 4.6% 4.2% 3.5%
Poverty Rate 15.5% 16.3% 15.2% 13.3%
Abolition of subsidies on the French « loaf » + « canned tomatoes »
Budget for abolished
subsidies fullyreallocated toother subsidies
Transfer of 40% ofabolished subsidiesto PNAFN and 60%reallocated to other
subsidies
Transfer of 60% ofabolished subsidiesto PNAFN and 40%reallocated to other
subsidies
Transfer of 100% of abolished surveys
to PNAFN
Extreme Poverty Rate 4.6% 4.6% 4.2% 3.5%
Poverty Rate 15.6% 16.3% 15.2% 13.3%
Abolition of subsidies on the French « loaf » + « canned tomatoes » + « milk » + « flour »
Budget for abolished
subsidies fullyreallocated toother subsidies
Transfer of 40% ofabolished subsidiesto PNAFN and 60%reallocated to other
subsidies
Transfer of 60% ofabolished subsidiesto PNAFN and 40%reallocated to other
subsidies
Transfer of 100%of abolished surveys
to PNAFN
Extreme Poverty Rate 4.7% 4.6% 4.3% 3.5%
Poverty Rate 15.6% 16.4% 15.2% 13.4%
Abolition of subsidies on the French « loaf » + « canned tomatoes» + « milk » + « flour » + « couscous » + « pasta » + « sugar »
Budget for abolished
subsidies fullyreallocated toother subsidies
Transfer of 40% ofabolished subsidiesto PNAFN and 60%reallocated to other
subsidies
Transfer of 60% ofabolished subsidiesto PNAFN and 40%reallocated to other
subsidies
Transfer of 100% of abolished surveys
to PNAFN
Extreme Poverty Rate 4.9% 4.8% 4.5% 3.9%
Poverty Rate 16.5% 16.9% 16% 14.3%
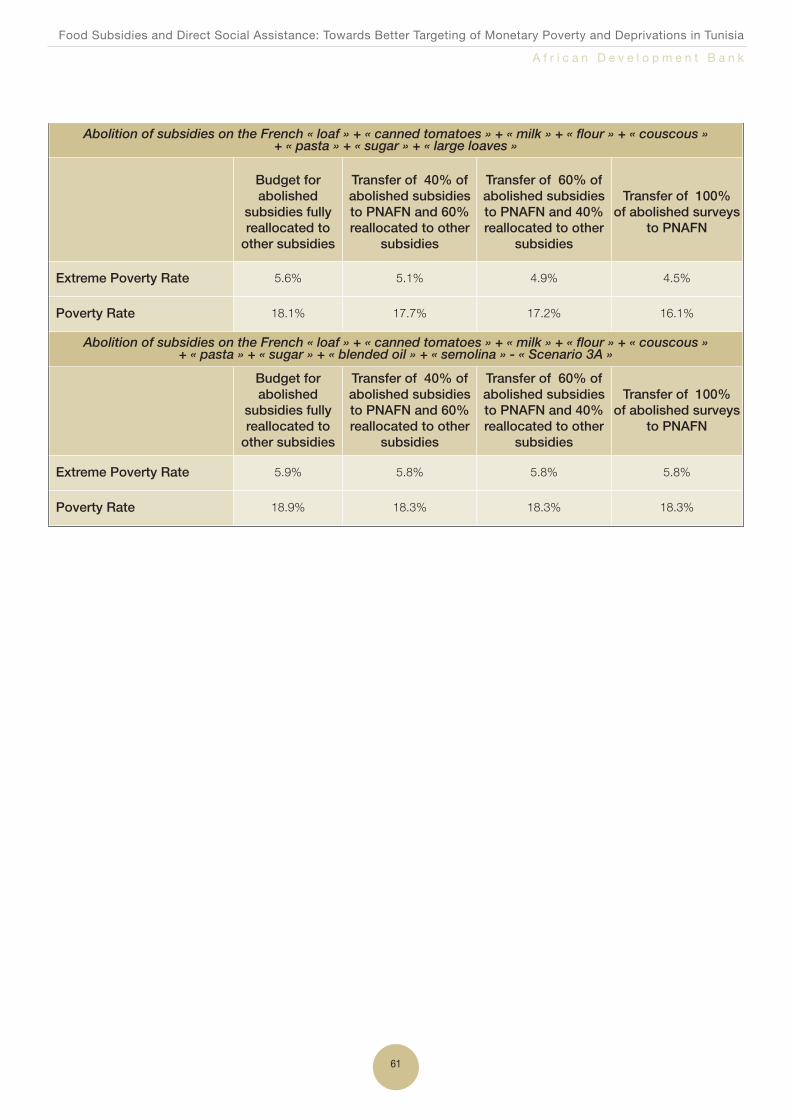
Food Subsidies and Direct Social Assistance: Towards Better Targeting of Monetary Poverty and Deprivations in Tunisia
A f r i c a n D e v e l o p m e n t B a n k
61
Abolition of subsidies on the French « loaf » + « canned tomatoes » + « milk » + « flour » + « couscous »+ « pasta » + « sugar » + « large loaves »
Budget for abolished
subsidies fullyreallocated toother subsidies
Transfer of 40% ofabolished subsidiesto PNAFN and 60%reallocated to other
subsidies
Transfer of 60% ofabolished subsidiesto PNAFN and 40%reallocated to other
subsidies
Transfer of 100% of abolished surveys
to PNAFN
Extreme Poverty Rate 5.6% 5.1% 4.9% 4.5%
Poverty Rate 18.1% 17.7% 17.2% 16.1%
Abolition of subsidies on the French « loaf » + « canned tomatoes » + « milk » + « flour » + « couscous » + « pasta » + « sugar » + « blended oil » + « semolina » - « Scenario 3A »
Budget for abolished
subsidies fullyreallocated toother subsidies
Transfer of 40% ofabolished subsidiesto PNAFN and 60%reallocated to other
subsidies
Transfer of 60% ofabolished subsidiesto PNAFN and 40%reallocated to other
subsidies
Transfer of 100% of abolished surveys
to PNAFN
Extreme Poverty Rate 5.9% 5.8% 5.8% 5.8%
Poverty Rate 18.9% 18.3% 18.3% 18.3%
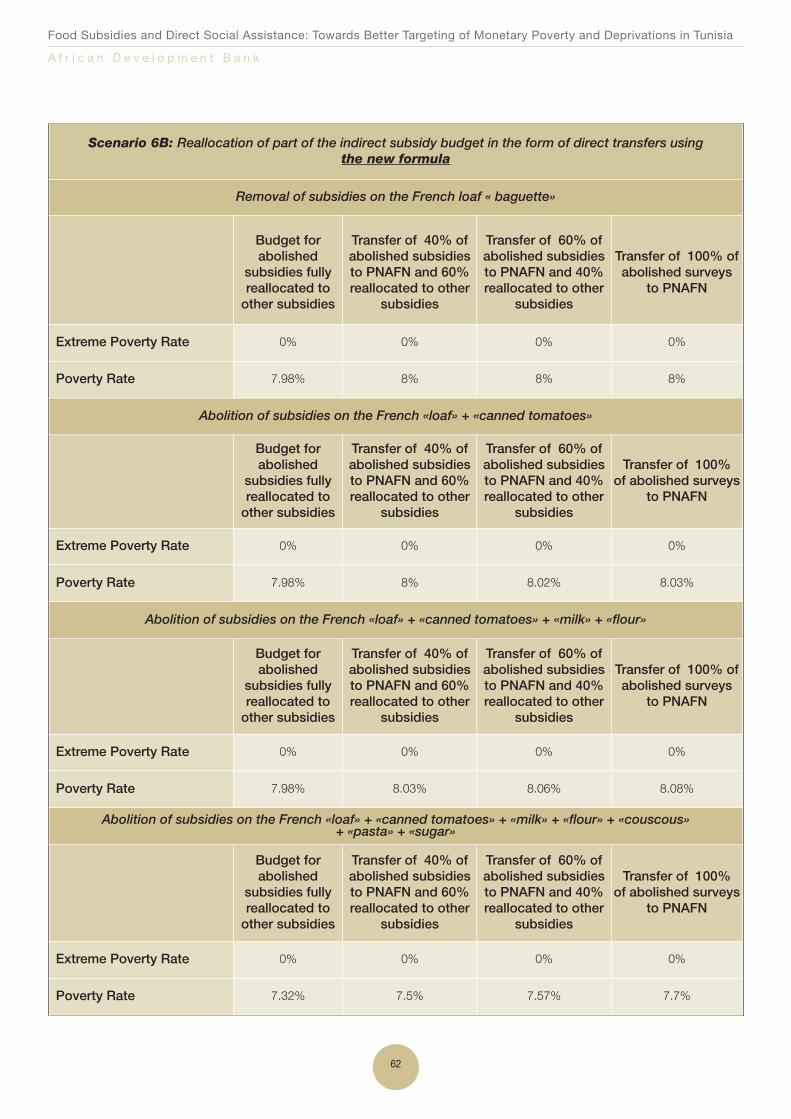
Food Subsidies and Direct Social Assistance: Towards Better Targeting of Monetary Poverty and Deprivations in Tunisia
A f r i c a n D e v e l o p m e n t B a n k
62
Scenario 6B: Reallocation of part of the indirect subsidy budget in the form of direct transfers using the new formula
Removal of subsidies on the French loaf « baguette»
Budget for abolished
subsidies fullyreallocated toother subsidies
Transfer of 40% ofabolished subsidiesto PNAFN and 60%reallocated to other
subsidies
Transfer of 60% ofabolished subsidiesto PNAFN and 40%reallocated to other
subsidies
Transfer of 100% ofabolished surveys
to PNAFN
Extreme Poverty Rate 0% 0% 0% 0%
Poverty Rate 7.98% 8% 8% 8%
Abolition of subsidies on the French «loaf» + «canned tomatoes»
Budget for abolished
subsidies fullyreallocated toother subsidies
Transfer of 40% ofabolished subsidiesto PNAFN and 60%reallocated to other
subsidies
Transfer of 60% ofabolished subsidiesto PNAFN and 40%reallocated to other
subsidies
Transfer of 100% of abolished surveys
to PNAFN
Extreme Poverty Rate 0% 0% 0% 0%
Poverty Rate 7.98% 8% 8.02% 8.03%
Abolition of subsidies on the French «loaf» + «canned tomatoes» + «milk» + «flour»
Budget for abolished
subsidies fullyreallocated toother subsidies
Transfer of 40% ofabolished subsidiesto PNAFN and 60%reallocated to other
subsidies
Transfer of 60% ofabolished subsidiesto PNAFN and 40%reallocated to other
subsidies
Transfer of 100% ofabolished surveys
to PNAFN
Extreme Poverty Rate 0% 0% 0% 0%
Poverty Rate 7.98% 8.03% 8.06% 8.08%
Abolition of subsidies on the French «loaf» + «canned tomatoes» + «milk» + «flour» + «couscous» + «pasta» + «sugar»
Budget for abolished
subsidies fullyreallocated toother subsidies
Transfer of 40% ofabolished subsidiesto PNAFN and 60%reallocated to other
subsidies
Transfer of 60% ofabolished subsidiesto PNAFN and 40%reallocated to other
subsidies
Transfer of 100% of abolished surveys
to PNAFN
Extreme Poverty Rate 0% 0% 0% 0%
Poverty Rate 7.32% 7.5% 7.57% 7.7%
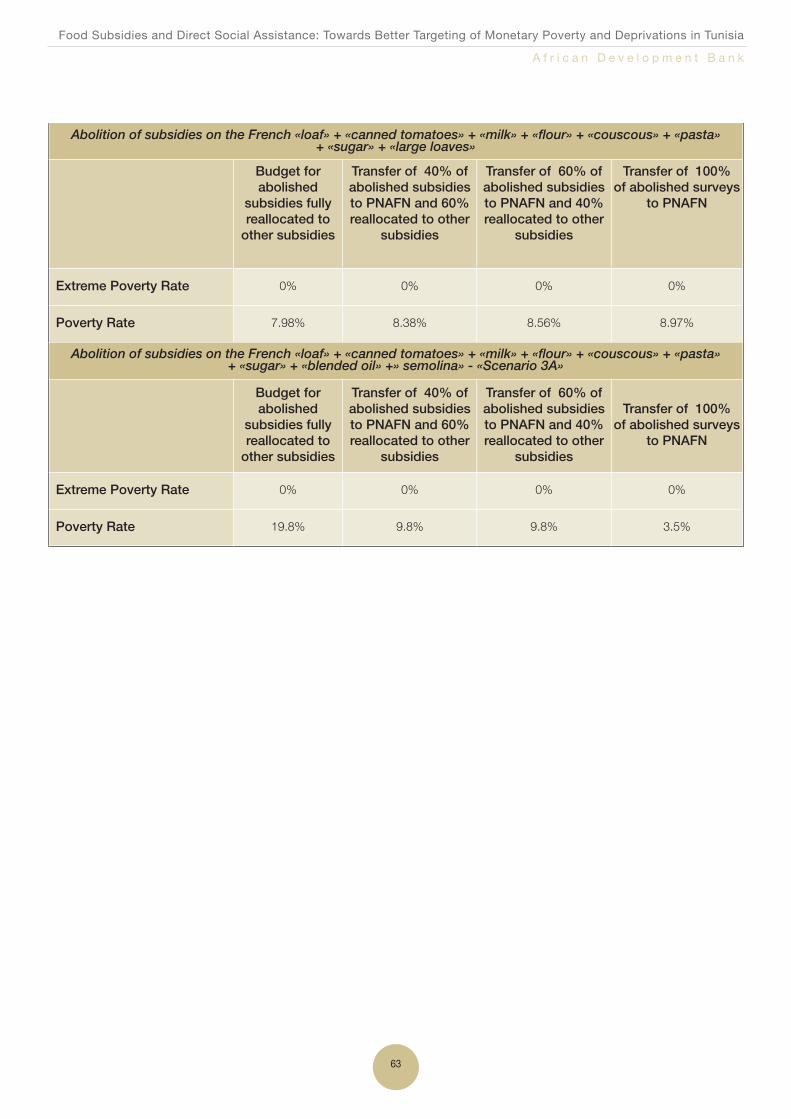
Food Subsidies and Direct Social Assistance: Towards Better Targeting of Monetary Poverty and Deprivations in Tunisia
A f r i c a n D e v e l o p m e n t B a n k
63
Abolition of subsidies on the French «loaf» + «canned tomatoes» + «milk» + «flour» + «couscous» + «pasta» + «sugar» + «large loaves»
Budget for abolished
subsidies fullyreallocated toother subsidies
Transfer of 40% ofabolished subsidiesto PNAFN and 60%reallocated to other
subsidies
Transfer of 60% ofabolished subsidiesto PNAFN and 40%reallocated to other
subsidies
Transfer of 100% of abolished surveys
to PNAFN
Extreme Poverty Rate 0% 0% 0% 0%
Poverty Rate 7.98% 8.38% 8.56% 8.97%
Abolition of subsidies on the French «loaf» + «canned tomatoes» + «milk» + «flour» + «couscous» + «pasta» + «sugar» + «blended oil» +» semolina» - «Scenario 3A»
Budget for abolished
subsidies fullyreallocated toother subsidies
Transfer of 40% ofabolished subsidiesto PNAFN and 60%reallocated to other
subsidies
Transfer of 60% ofabolished subsidiesto PNAFN and 40%reallocated to other
subsidies
Transfer of 100% of abolished surveys
to PNAFN
Extreme Poverty Rate 0% 0% 0% 0%
Poverty Rate 19.8% 9.8% 9.8% 3.5%

Food Subsidies and Direct Social Assistance: Towards Better Targeting of Monetary Poverty and Deprivations in Tunisia
A f r i c a n D e v e l o p m e n t B a n k
64
This study shows that it is possible to propose simple public
policies that will reconcile a cut in the budget allocated by the
central government to direct and indirect transfers with a reduction in
the poverty rate to low levels.
This study presents a synthetic living standard score calculated on
the basis of tangible, readily observable indicators by the field workers.
This score permits an adequate classification and multidimensional
assessment of household living standards. It takes into consideration
living standards, the capacity of household members to generate a
decent income and finally the burdens borne by active household
members. A combination of the Proxy Means Test and Multiple
Privations Approaches reduces targeting errors and consequently
wastage of taxpayer resources that such errors might cause. The
greatest impact of this targeting procedure is on the poorest segments
of the population.
Furthermore, the indicator used by this procedure is tangible and
easily verifiable by the public decision-maker in addition to being easy
to implement by the field workers. Indeed, by adopting the proposed
indicator, the Ministry of Social Affairs may communicate to its different
social workers uniform living standard assessment criteria for the
surveyed households. This new procedure thus prevents any possible
subjectivity in social workers’ assessment procedures. It will also help
to prevent targeting errors due to the fact that non-poor households,
by being untruthful about their real living standards, manage to benefit
from social assistance to the detriment of the neediest families.
The results confirm the effectiveness of the approach.
Without affecting indirect subsidies, the new targeting procedure
achieves a 1.5% extreme poverty rate even after a 50% reduction
in the PNAFN budget. With a constant PNAFN budget, the new
targeting procedure would lead to the eradication of extreme poverty
and bring down the poverty rate to 8%. If the PNAFN budget remains
unchanged, households living in extreme poverty would receive TND
2525.6 per year for all transfers combined i.e. TND 2276.8 dinars
more than under the present method. The poorest segments of the
population would then receive 52% of the total budget allocated to
direct and indirect transfers.
The use of the new procedure would also contribute to the eradication
of extreme poverty while abolishing food subsidies. However, the
number of poor households lingered at 15.5% to 16%.
However, if the food subsidy budget is reallocated to PNAFN the
results are spectacular. The transfer of the entire subsidy budget using
the new targeting method would reduce the extreme poverty level to
0% and the poverty rate to 4.1%.
The following policy scenarios, which explore different combinations
of budget allocation and reduction, all stress that there are no grounds
for maintaining indirect subsidies since no scenario results in a better
performance than the abolition of subsidies and the reallocation of the
related budget to direct transfers.
7. Conclusions


Food Subsidies and Direct Social Assistance: Towards Better Targeting of Monetary Poverty and Deprivations in Tunisia
A f r i c a n D e v e l o p m e n t B a n k
66
Annex I: Direct Targeting Statistics
Table 1.1: Distribution of Beneficiaries according to Social Programmes
Social ProgrammesHouseholds Population
Number (%) Number (%)
Beneficiary of direct transfers(AMG1)
183 012 7.2% 728 285 6.6%
Beneficiary of partial medical carecoverage (AMG2)
505 440 19.8% 2 389 865 21.8%
Non Beneficiary 1 859 713 73.0% 7 867 432 71.6%
Total 2 548 165 100% 10 985 582 100%
Source: INS 2013, Technical Note ‘Distribution and Impact of Indirect Subsidies on Poor Households’.
Table 1.2: Distribution of Beneficiaries of Direct Transfers by Quintile
Quintile 1 Quintile 2 Quintile 3 Quintile 4 Quintile 5 Total
Beneficiaries of AMG1 37.2% 23.5% 19.2% 14% 6.1% 100%
Beneficiaries of AMG2 38% 24.9% 17.1% 12.4% 7.7% 100%
Source: INS 2013, Technical Note ‘Distribution and Impact of Indirect Subsidies on Poor Households’.
Table 1.3: Distribution of beneficiaries of direct transfers between ‘poor’ and ‘non-poor’
Source: INS 2013, Technical Note ‘Distribution and Impact of Indirect Subsidies on Poor Households’.
Poor Non Poor Total
Beneficiaries of AMG1 30.9% 69.1% 100%
Beneficiaries of AMG2 27.5% 72.5% 100%
Beneficiaries of at least one programme 28.3% 71.7% 100%
Total Population 15.7% 84.3% 100%
Food Subsidies and Direct Social Assistance: Towards Better Targeting of Monetary Poverty and Deprivations in Tunisia
A f r i c a n D e v e l o p m e n t B a n k
67
The Indian experience comprised four phases, between 1992 and
2011, during which the Authorities made a series of adjustments
to improve transparency and effectiveness in the selection of standard
of living indicators, thereby reducing targeting errors. The adjustments
led to a reduction in incompatibilities between the assessment
procedures adopted by the planner and those adopted by the field
worker.
In the first phase of the targeting programme introduced in 1992, India
had applied an identification procedure for households benefiting from
assistance on the basis of income levels declared by the households.
However, the planner realized that it is particularly difficult to verify
information on the incomes of a large number of households working
in the informal or non-structured sectors given that 90% of Indian
enterprises are concentrated in these sectors.
To address this problem of targeting, and in order to reduce standard
of living assessment errors, in 1997, the Indian planners modified
the indicators used to reduce targeting errors. In the second phase
initiated, the targeting procedure comprised two stages. First, it was
necessary to identify visibly non-poor (non-needy) households on
the basis of visible characteristics (possession of durable assets,
belonging to certain economic regions, etc….). Then, in a second
phase, information is collected on the total expenditure of the
remaining households. A subsidy is therefore granted to households
with income levels below a given threshold (known as the poverty
threshold).
The Indian planner realized that the 1997 reform had several
shortcomings even though it had led to a partial reduction in targeting
errors characterizing the first phase. Indeed, the exclusion indicator
was too strict (for example, owning a moped or a fan should not be
adopted as the sole criterion for excluding a household from a
subsidy). Furthermore, the targeting procedure used in the second
phase does not take into account differences in terms of economic
environments and household needs since it used a single poverty
threshold for all regions and environments. A single poverty threshold
does not take into account the heterogeneity of needs and habits
between regions, nor did this method include any provision for
updating the lists of beneficiaries. Finally, the beneficiaries are identified
on the basis of their incomes and not on their capacity to use the
income. Indeed, if the household head is physically or mentally
impaired or is handicapped by his/her geographical location or
ethnicity, s/he will be unable to benefit from the same level of well-
being and satisfaction as a household with no handicaps.
In its third phase, initiated in 2002, India used a synthetic indicator
based on a multidimensional living standards approach for identifying
household beneficiaries of subsidies. 13 indicators with scores of 0
to 4 (0 score to the worst situation reported by the indicator and 4 to
the best situation for the indicator in question) were used. On the
basis of the individual scores of 13 selected indicators, an overall
summary score of 0 to 52 is generated. Households in each region
are ranked in ascending order of the overall score, then on the basis
of a poverty threshold disaggregated by region. It is considered that
a household may benefit from the subsidy if its score is below a
certain threshold. Households with overall scores below these
thresholds will be considered as needy and will consequently benefit
from the subsidy.
The approach adopted by the third phase was more rigorous than the
two preceding ones. However, several shortcomings were observed
concerning three components: (a) the identification method, (b) data
reliability and quality and finally (c) the informational content (Table IV.1).
Annex II: The Indian Experience

Food Subsidies and Direct Social Assistance: Towards Better Targeting of Monetary Poverty and Deprivations in Tunisia
A f r i c a n D e v e l o p m e n t B a n k
68
In order to address these shortcomings, a fourth phase was launched
in 2008. The Commission responsible for this 4th phase of the
reform made new proposals using ‘verifiable’ indicators. The
method comprises three stages:
1. Automatic exclusion of those who are visibly non-poor;
2. Automatic inclusion of those who are visibly poor and ensure
they are the first to benefit from the subsidies;
3. Classification of the other families by awarding scores reflecting
their respective deprivation levels for each of the agreed criteria, then
grant assistance to those with the lowest overall scores within the
limitations of the available budget.
Other proposals for inclusion and scoring criteria have been made
since the 2009 report, including those based on socio-demographic
characteristics. Table IV.3 assesses scoring according to type of trade,
social group, the degree of vulnerability due to age, health status and
gender.
Table 2.1: Identification of Weaknesses in the Method Used for Identification of the Beneficiariesof the Third Phase in India
a. Identification Method
• The summation of scores is open to criticism, for all the responses are qualitative whereas their values are used as if they were quantitative.
• Using the same weight for the 13 criteria is not valid.• The choice of poverty line is the subject of a number of controversies.
b. Data Quality
• Many households will do anything to be included on the list.• The objective of reaching all the households is forgotten. • Lack of control, which should eliminate false declarations and highlight omissions.
c. Informational Content of Data
• Manipulation : remove dependents and substitute other ineligible persons for them is possible.• On the basis of resources and not of capacities, there is a risk of neglecting the willingness of individuals to convert
resources into capacities. • The quality of these resources is not identified.• The Frequency: information collected 5 years ago may no longer be relevant.
Table 2.2: Scoring Criteria for the 4th Phase in India
First phase(automatic exclusion)
Second Stage(Automatic Inclusion)
Third Stage(establishing scores)
Families owning twice the average landarea.
Primitive tribesRecognized minority casts: 3 pointsThe most backward casts: 2 pointsMuslims: 1 point
Families owning 3 or 4 motorized vehiclesFamilies suffering discrimination, asidentified by the government
Farm workers without land: 4 pointsFarmers with small plots : 3 pointsCasual workers: 2 pointsSelf employed and craftspersons: 2 points
Families with at least farm equipmentsuch as a tractor or combine harvester
Households with a woman headNo adult over 35 years of age has an education level beyond primary: 1 point
Families with at least one person with asalary of 10000 rupees
The breadwinner is disabledA family member has a serious disease (tuberculosis, mental disorder, AIDS): 1 point
Family subject to taxation Household whose head is a minor Family whose head is over 60 years old: 1 point
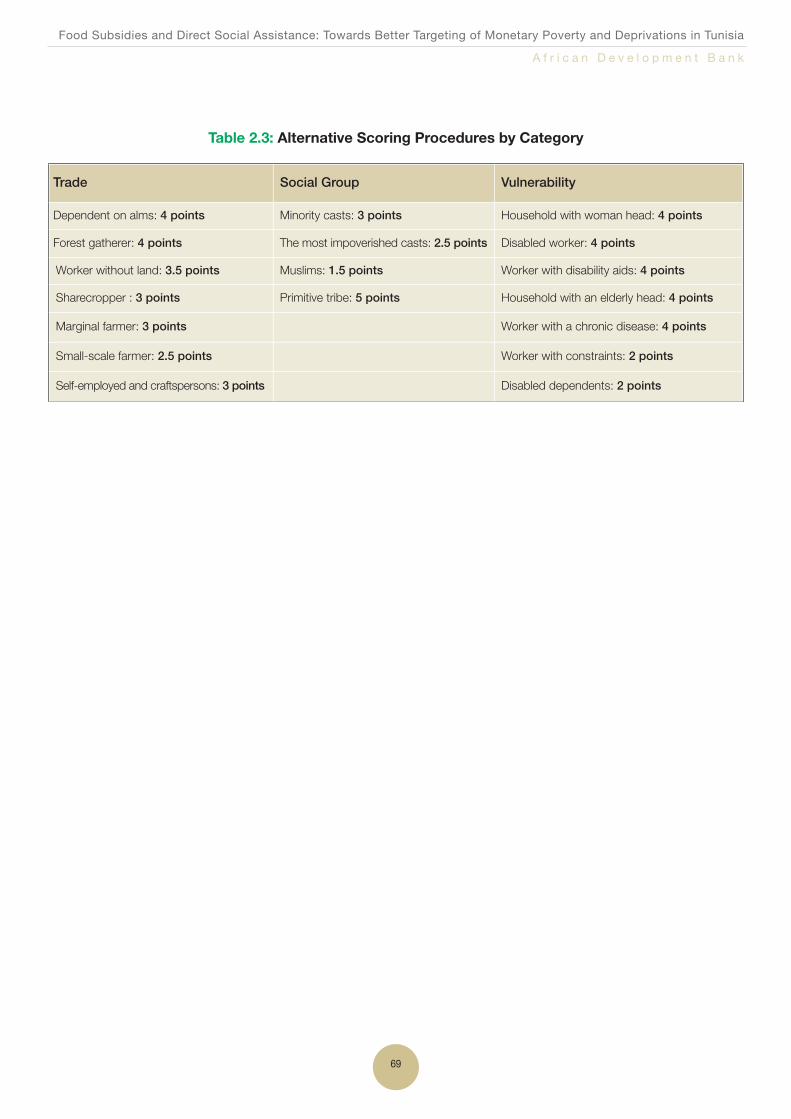
Food Subsidies and Direct Social Assistance: Towards Better Targeting of Monetary Poverty and Deprivations in Tunisia
A f r i c a n D e v e l o p m e n t B a n k
69
Table 2.3: Alternative Scoring Procedures by Category
Trade Social Group Vulnerability
Dependent on alms: 4 points Minority casts: 3 points Household with woman head: 4 points
Forest gatherer: 4 points The most impoverished casts: 2.5 points Disabled worker: 4 points
Worker without land: 3.5 points Muslims: 1.5 points Worker with disability aids: 4 points
Sharecropper : 3 points Primitive tribe: 5 points Household with an elderly head: 4 points
Marginal farmer: 3 points Worker with a chronic disease: 4 points
Small-scale farmer: 2.5 points Worker with constraints: 2 points
Self-employed and craftspersons: 3 points Disabled dependents: 2 points
Food Subsidies and Direct Social Assistance: Towards Better Targeting of Monetary Poverty and Deprivations in Tunisia
A f r i c a n D e v e l o p m e n t B a n k
70
Two types of initial conditions must be fulfilled to conduct a living
standards analysis: the selection of variables for the living
standard indicators and the existence of adequate statistical
information.
1. The variables
In order to implement an optimization procedure, the variables
retained must meet certain conditions.
(1) Each variable must be correlated with the living standard
approximated by the income or synthetic index on the basis of
appropriate weighting to ensure the targeting error is minimal.
(2) Reducing the targeting error requires the effective observation (with
no errors) of the variables used as living standard indicator. This variable
must, therefore, be readily observable and consequently not easily
concealed and non-falsifiable by the person or household interviewed
and candidate for possible targeting. For example, if the variable used
refers to the possession of a car so that any person owning a car will
not benefit from the subsidy, the household may hide and subsequently
deny the fact that it owns a car in order to benefit from the subsidy.
(3) The variable may not be easily changed by the household.
A person who owns a durable good may sell it in order to benefit
from the subsidy. The planner must, therefore take into account the
temptation of the household interviewed to cheat in order to become
eligible for social assistance. It is necessary to take asymmetrical
information into account when selecting adequate living standards in
order to ensure the lowest level of targeting errors.
2. The Database
To correctly estimate the standard of living, it is necessary to have:
(1) conditions for which a random sample is taken in compliance
with the rules of sampling and representativeness of this sample53.
(2) assurances that the synthetic living standard indicator54 is
correctly measured by the surveyor when collecting information from
households in order to prevent measurement errors which would
compound other types of targeting errors.
(3) sufficient variables to approximate the living standards of each
household in the total population. The approximation of non-observed
income or summary score for living standards on the basis of these
variables will therefore be more robust and consistent. The selection
of these variables is especially important since the living standard
approximations derived from them would be used to compile a
household classification in ascending order of eligibility for social
assistance, and provide an estimation of the amounts that could be
allocated to each needy family for almost perfect targeting.
Annex III: Statistical Prerequisites for Direct Targeting
53 A necessary condition for the absence of selectivity bias in the analysis of deprivations and in the ensuing draft targeting policy54 Measured by permanent income or by a summary living standards score

Food Subsidies and Direct Social Assistance: Towards Better Targeting of Monetary Poverty and Deprivations in Tunisia
A f r i c a n D e v e l o p m e n t B a n k
71
Table 4.1: Estimation of the Equation for Determinants of Total Expenditure
Survey Data 2005 2010 pool
Dimensions Variables Ldep Ldep Ldep
Housing Conditions
Wall 0.00540 -0.0107 -0.0188(0.0695) (0.0796) (0.0522)
Roof 0.0344 -0.0370 0.0105(0.0257) (0.0305) (0.0197)
Water -0.0220 -0.0816*** -0.0597***(0.0172) (0.0173) (0.0122)
Bath -0.414*** -0.426*** -0.425***(0.0128) (0.0131) (0.00921)
Electric -0.0295 -0.100 -0.0567(0.0444) (0.0623) (0.0359)
Sanit -0.126*** -0.0882*** -0.0877***(0.0148) (0.0298) (0.0116)
Typlog 0.0175 -0.0823 -0.00822(0.0650) (0.0923) (0.0525)
Household head’scapacity to generate a decent income
Nnqual -0.282*** -0.266*** -0.282***(0.0153) (0.0144) (0.0106)
Disabled -0.120*** -0.144*** -0.123***(0.0197) (0.0189) (0.0137)
Noprim -0.0351*** -0.125*** -0.0660***(0.0126) (0.0127) (0.00897)
Burden borne byActive Members
depend2 0.0214 -0.332*** -0.119***(0.0159) (0.0167) (0.0114)
overcrowd3 -0.422*** -0.335*** -0.389***(0.0192) (0.0214) (0.0144)
Widow 0.183*** 0.194*** 0.200***(0.0175) (0.0175) (0.0125)
Family LivingConditions
abs_amenities -0.133*** -0.158*** -0.104***(0.0117) (0.0356) (0.0105)
GPL 0.0711 -0.188** -0.0305(0.0648) (0.0787) (0.0499)
AreaRural -0.141*** -0.164*** -0.168***
(0.0160) (0.0137) (0.0104)
Region
Grttunis 0.0864*** 0.119*** 0.105***(0.0148) (0.0147) (0.0105)
Interior -0.0699*** -0.115*** -0.0920***(0.0126) (0.0122) (0.00884)
Surv. 0.0503***(0.00185)
Constant 14.61*** 14.94*** -86.31***(0.0110) (0.00946) (3.715)
Observations 12.317 11.281 23.598R-squared 0.353 0.389 0.402
Standard errors in parentheses,*** p<0.01, ** p<0.05, * p<0.1
Annex IV: Econometric Estimation

Food Subsidies and Direct Social Assistance: Towards Better Targeting of Monetary Poverty and Deprivations in Tunisia
A f r i c a n D e v e l o p m e n t B a n k
72
Table 4.2: Estimation of the Equation for the Determinants of Total Expenditure in 2010
Survey Data All Households First Quartile
Dimensions Variables Ldep Ldep
Housing Conditions
Wall -0.0107 0.00870
(0.0796) (0.0631)
Roof -0.0370 0.0256
(0.0305) (0.0262)
Water -0.0816*** -0.0667***
(0.0173) (0.0144)
Bath -0.426*** -0.0757***
(0.0131) (0.0143)
Electric -0.100 -0.127***
(0.0623) (0.0427)
Sanit -0.0882*** -0.0611***
(0.0298) (0.0211)
Typlog -0.0823 -0.0875
(0.0923) (0.0663)
Household head’s capacity to generate a decent income
Nnqual -0.266*** -0.0444***
(0.0144) (0.0131)
Disabled -0.144*** -0.00428
(0.0189) (0.0190)
Noprim -0.125*** -0.0571***
(0.0127) (0.0128)
Burden supported by Active Members
depend2 -0.332*** -0.137***
(0.0167) (0.0145)
overcrowd3 -0.335*** -0.176***
(0.0214) (0.0156)
Widow 0.194*** 0.0498**
(0.0175) (0.0211)
Family Living Conditions
abs_amenities -0.158*** -0.0552**
(0.0356) (0.0251)
GPL -0.188** -0.110**
(0.0787) (0.0543)
AreaRural -0.164*** -0.0587***
(0.0137) (0.0145)
Grttunis 0.119*** 0.0328
(0.0147) (0.0248)
Interior -0.115*** -0.0467***
(0.0122) (0.0132)
Constant 14.94*** 13.93***
(0.00946) (0.0152)
Observations 11.281 2.786
R-squared 0.389 0.211
Standard errors in parentheses, *** p<0.01, ** p<0.05, * p<0.1
Annex IV: Econometric Estimation

Food Subsidies and Direct Social Assistance: Towards Better Targeting of Monetary Poverty and Deprivations in Tunisia
A f r i c a n D e v e l o p m e n t B a n k
73
1. Definition of poverty on the basis of deprivations
Alkire and Foster (2008) (referred to as A&F) consider specific scores
for each type of deprivation, then on an aggregation of deprivation
levels taking multiple deprivations into account.
The case of N households and D dimensions of deprivation
(represented by D indicators) is considered. Each household i is
associated with a set of D indicators sid (d = 1,..,D) (representing its
status in relation to each of the possible deprivations). zd is defined
as the threshold (or line) specifying the level of deprivation in dimension
d (d=1,..,D).
A scalar of g0id is associated with each household i and each level of
deprivation d so that :
g0id = 1 if sid < zd and g0id = 0 otherwise.
Proceeding in the same manner, the deprivation mean g1id may also
be constructed by :
g1id = zd - sid if sid < zdand g1id = 0 otherwise.
This procedure may be applied for all α>1 so that:
gαid = (zd – sid )α if sid < zd and gidα = 0 otherwise.
However, a household may suffer more than one deprivation.
Aggregation of deprivations heightens the drop in living standards and
sinks the household deeper into poverty. In order to factor in the
impact of deprivations and identify their effects on poverty levels the
union or intersection approach will be used. The union approach
sstipulates that a household is poor if it is deprived in at least one
dimension. The intersection approach affirms that a household is
poor if deprived in all dimensions.
According to A&F, a household is considered as multidimensionally poor
if it is deprived in at least k dimensions. Two extreme cases of this indicator
would be: if k = 1 this identification criterion corresponds to that of the union
approach and if k = D, it corresponds to the intersection approach.
If the weights are equal, the A&F approach identifies a household as
poor if it is deprived in at least k dimensions (k=1,..D). A scalar of ci is
constructed corresponding to the number of deprivations suffered by
the household i and a scalar of ρk is defined so that:
ρk = 1 if ci ≥ kand ρk = 0 if ci < k.
A&F define a function g(x) verifying the fundamental hypotheses
imposed by the axiomatic approach to poverty for the unidimensional
case. They define an index which verifies (a) the property of
monotonicity whereby, if the number of deprivations increases, the
level of poverty also rises and (b) the property of decomposability
permitting an analysis by population group and by region.
Thus, for all α> 0, A&F define an index:
gαid (k) = gα
id if ρk = 1 and gαid (k) =0 if ρk = 0.
For α = 0, a scalar of g0i (k) may be defined which is equal to 1 if
the coefficient ρk associated with household i also equals 1, and
g0i (k) = 0 if ρk is zero.
2. A&F Multidimensional Poverty Index
Alkire and Foster (2008) adjust the multidimensional headcount
rate H = Q/N, where Q represents the number of individuals with k
deprivations in order to impose the properties of transfer, monotonicity
and decomposability required by the axiomatic approach to poverty
analysis.
Index H is undoubtedly easier to understand and estimate but,
unfortunately, does not take into account the intensity and distribution
of poverty and does not satisfy the properties of transfer and
monotonicity. Thus, if a household identified as poor becomes deprived
in an additional dimension, index Hwill remain unchanged. In addition,
this measurement is not sensitive to decomposition by dimension, (a
very useful property for economic policy recommendations).
A&F propose the adjusted FGT family of measures defined by
Mα = μ (gα) pour α ≥ 0. Pour α = 0 the A&F class of measures gives
Annex V: Optimization of Targeting by a Multiple Deprivation Score
Food Subsidies and Direct Social Assistance: Towards Better Targeting of Monetary Poverty and Deprivations in Tunisia
A f r i c a n D e v e l o p m e n t B a n k
74
the adjusted headcount rate defined by M0 = μ (g0 (k)) corresponding
to the sum of all deprivations c (k) = Σi=1N ci (k), out of the maximum
number of deprivations equal to ND. This may thus be written as:
M0 = c (k) / ND.
M0 may also be expressed as the product of the multidimensional
headcount ratio H, and the average proportion of deprivations among
poor people A = c(k) / QD x A gives the level of deprivation from which
an average multidimensional poor person suffers. This may thus be
written as M0 = HA. It is concluded that M0 contains information on:
the incidence of poverty and the average level of extension of the
deprivation of poor households to the multidimensional level. Thus,
M0 meets the axiomatic multidimensional property while remaining
easy to calculate and is also adapted to ordinal data.
The adjusted FGT family of measures also gives the adjusted poverty
gaps, M1 = μ(g1 (k)). Thus, M1 corresponds to the sum of normalized
gaps g1 (k) = Σi = 1N g1i (k) divided by ND (the maximum number of
gaps possible). Moreover, M1 may also be expressed as the product
of H, A and G (average poverty gap), where G = g1 (k) / g0 (k), tel que
M1 = μ (g1 (k)) = HAG
Thus, M1 contains information on the incidence of poverty, the average
level of deprivation and the average depth of poverty. M1therefore,
satisfies the property of monotonocity. (Thus, the deprivation of an
individual in a given dimension increases, M1 will increase).
All the indices in the family Mα are decomposable by population
groups. Thus, if we have two groups of households of sizes N1 and
N2 ( N = N1 + N2) with which the achievement matrices S1 and S2,
are associated, we have:
Mα (S1, S2, z) = (N1/N) Mα (S1,z) + (N2/N) Mα (S2,z)
Furthermore, all members of this family may be subdivided into sub-
groups of indicators. This property of decomposition is interpreted as
the contribution of the dth dimension to all multidimensional poverty.
Finally it is noted that assigning the same weight to the different
dimensions is valid in certain specific cases, but in most cases it is
necessary to assign more weight to certain dimensions.
Wd denotes the weight assigned to dimension d. The class of
adjusted FGT measures is thus defined by:
Mα (X,z,wd) = μ (gα (k,wd)) pour α ≥ 0.

Food Subsidies and Direct Social Assistance: Towards Better Targeting of Monetary Poverty and Deprivations in Tunisia
A f r i c a n D e v e l o p m e n t B a n k
75
Tot_dep. Classification Weighted Score Classification
Extreme Poverty Rate 4.3% 4.3%
Poverty Rate 14.2% 14.2%Number of Beneficiaries
(in millions)10.6 10.6
% of beneficiaries 100% 100%
Per-Unit Subsidy Q1 (in TND) 63.5 67.7
% Subsidy in rev.Q1 7.7% 6.5%
Total subsidy amount received by Q1(in million TND)
138.8 135.2
Per-unit Subsidy Q5 (in TND) 89.4 89.4
% Subsidy in rev.Q5 1.5% 2.9%
Total subsidy amount received by Q5(in million TND)
183.9 236.9
Annex VI: Assessment of the Impact of Existing Indirect Subsidies on the basis of Two Standard of LivingClassifications

Food Subsidies and Direct Social Assistance: Towards Better Targeting of Monetary Poverty and Deprivations in Tunisia
A f r i c a n D e v e l o p m e n t B a n k
76
Direct targeting requires a network that will directly reach the
targeted households. It will also help to identify the reaction
of the households concerned, the intrinsic characteristics of the
household’s social environment and validate specific information for
each household through cross-referencing with specific information
on its local environment. These are known as social channels.
1. The PNAFN Assistance Transfer System
The Department of Social Advancement under the Ministry of Social
Affairs has a network of social assistants and workers, supervised
by local commissions which are coordinated by regional commis-
sions directly attached to the Department and to the regional autho-
rities. The organization and mode of management of this network
are defined in a joint Circular to the Ministries of the Interior (Circular
No.12) and Social Affairs (Circular No. 3) dated 27 May 2011. This
network comprises over 2000 workers with permanent residence in
the different localities who visit and interview families applying for
social assistance programmes in their respective localities. They thus
identify household living standards by collecting information and
preparing assessment reports on their eligibility for the assistance
applied for.
The joint circular determines the criteria of eligibility for permanent
assistance under the PNAFN programme and specifies the orga-
nization methods for the local and regional commission which coor-
dinate actions relating to the establishment of lists of needy families.
Social Assistance Eligibility Criteria
The circular specifies that the PNAFN should target families
deprived of family and material support, unable to exercise a
professional activity/trade with an adjusted annual income not
exceeding 585 dinars. Once the conditions of disability of the
household head as well as the absence of support are verified,
the social assistant or worker assesses the adjusted average
annual household income denoted as REV, which will be used to
classify families in order of priority for PNAFN assistance. The REV
adjusts the annual family income declared by each household
taking into account the number of disabled persons in the family
and the burden it supports due to its size and housing type. This
is measured in dinars and calculated according to the following
official equation:
REV= (Annual family income – 600 x number of disabled persons – 500 (if tenant)
Number of family members
Organization of Commissions
The different commissions are required to monitor, update and
revise the lists of PNAFN beneficiaries. They are required to
guarantee full coverage of all the targeted families meeting the
aforementioned criteria.
Local Commissions
Each commission is chaired by the head of the local social Advan-
cement unit. It comprises different representatives of local social
organizations (public organizations and NGOs). It is responsible for
examining and issuing opinions on submissions prepared by the
local units concerning (1) applications for permanent assistance
benefits (PNAFN programme) and (2) proposals to remove non-
eligible persons from the list of beneficiaries of permanent
assistance55.
The local units submit to the Department of Social Advancement
the minutes of the local commission meetings accompanied by the
files examined relating to applications for benefits or reintegration
into the PNAFN (refusals and approvals are classified by order of
priority). It is, therefore, the responsibility of the regional commissions
to take the final decisions of rejection or approval concerning the
different applications following verification.
Annex VII: Social Assistance Transmission Channels
55 Of course, this assumes that the social workers of the local unit have carried out their investigations. Thus each file contains documents provided by the family and the inves-tigation report prepared by the social worker.

Food Subsidies and Direct Social Assistance: Towards Better Targeting of Monetary Poverty and Deprivations in Tunisia
A f r i c a n D e v e l o p m e n t B a n k
77
Regional Commissions
Each commission is chaired by the Director-General of Social Affairs
and comprises regional representatives of several institutions. It
examines and issues opinions on files submitted to it by the local
commissions. It has full prerogatives to request any further information
on these files that it considers to be useful. On the basis of these
files, it establishes the lists of families proposed for inclusion (or
exclusion) in the list of beneficiaries. This commission establishes
the list of beneficiaries in compliance with the quota retained for
each region (governorate).
The regional commissions are required to inform the governors of
the number of applications approved and rejected and the number
of beneficiaries removed.
Finally, it should be noted that PNAFN transfers are paid to house-
holds in the form of postal money orders made payable to the
household head. This financial assistance only covers part of the
households benefiting from the AMG 1 programme which allocates
free health care cards.
2. Shortcomings of the PNAFN Transfer System
The Department of Social Advancement is aware of certain
weaknesses concerning the procedures for assessing needs and
identifying needy families. In response to these weaknesses, the
Department proposes to prepare a comprehensive survey of PNAFN
and AMG1 beneficiaries to improve the assessment of these families’
living conditions. The Department also intends to establish a digital
database that will allow social workers to immediately verify the
information declared by households and use single scoring methods
to assess the standard of living and thus harmonize the criteria for
inclusion in or removal from PNAFN’s final list of needy families.
However, the Department raises several challenges:
a. Assessment of the family’s income (should children’s incomes
be included, and, among the latter, should the incomes of married
children with their own families to support be considered?).
The Department thus proposes to assign different weights (scoring)
to all these data by assigning a weight equal to 1 to the family head
and ever decreasing weights to children over 18 years old according
to their marital status and the burdens they are expected to shoulder
outside this family.
b. A look at the criteria for assessing ability to work and
taking into account youth unemployment as well as informal
work. There may be families in situations of extreme poverty but
who do not benefit from PNAFN assistance because their family
members include children of working age but who are unemployed.
Another scenario is possible where members declare themselves
unemployed because they are not engaged in any declared
employment, while carrying out informal work!
c. The condition and status of housing (over 80% of Tunisians
own their houses especially in rural areas). But it is rather the
condition of the house which reflects the family’s poverty level.
In this case, the problem lies in the selection of an adequate score
that will permit the classification of households by their levels of
poverty especially where the aim is to compare the situations of
households: (1) families with a very low level of income but living
in a home in good condition, (2) families with a significant income
but who neglect the condition of their houses, and (3) families
who pay rent, especially in urban areas.
d. Consideration of the disabled. This raises several questions:
(1) Should we confine ourselves to the family’s income without
special treatment of the problem of the presence of disabled
persons? (2) Should we ignore the presence of a disabled person
if the family income exceeds a certain threshold? (3) Should we
allocate specific allowances to disabled persons depending on
their number?
e. Scoring method selection. Once again several questions are
raised (1) Is scoring the only criterion for allocating assistance? (2) Will
the levels of income and subsequently monetary poverty be conside-
red alongside scoring in determining the standard of living? (3) Will a
threshold be considered (equivalent to the monetary poverty threshold)
to assess the eligibility of a household for social assistance? (4) Will
the specific budget for social assistance be adjusted on the basis of
the needs identified by the scoring method or will the budget be fixed
in advance and will the amount of assistance allocated in each gover-
norate be limited by the amount initially allocated to each governorate?
(4) How do we determine the threshold score on the basis of which
a family will be considered as a needy family?

Food Subsidies and Direct Social Assistance: Towards Better Targeting of Monetary Poverty and Deprivations in Tunisia
A f r i c a n D e v e l o p m e n t B a n k
78
f. The selection of a poverty threshold of 585 dinars,
irrespective of the area. Once again, this raises several
questions: (1) Is it necessary to determine different thresholds
by area (as in the case of the INS: large city, small towns,
rural area)? (2) Should poverty or extreme poverty lines
be taken into consideration? (3) Should monetary poverty
be ignored and a multidimensional poverty analysis
conducted?

Food Subsidies and Direct Social Assistance: Towards Better Targeting of Monetary Poverty and Deprivations in Tunisia
A f r i c a n D e v e l o p m e n t B a n k
79
Annex VIII: Detailed Results of the Impact of the Abolition of Subsidies on Targeted Products and the Reallocation of All or Part of the Budget to PNAFN
Scenario 6A.1: Reallocation of Part of the Remaining Budget for Indirect Subsidies in the form of direct transfers using the former procedure
(constant direct targeting budget) + (different levels of the indirect subsidy budget)
Reduction in Central Government Budget Allocated to Subsidies on the French Loaf
Budget fully allocated to subsidies
Transfer of 40% ofsubsidy budget to
PNAFN
Transfer of 60% ofsubsidy budget to
PNAFN
Transfer of 100%ofsubsidy budget to
PNAFN
Additional Dinars per Household
Extreme Poverty 66.3 1.4 95.7 284.3
Remaining Poor 38 -67.7 72 351.3
Remainder of First Quintile 71.5 -17.1 54.1 196.6
2nd quintile 11.2 -133.2 -26.6 186.7
3rd quintile -10.6 -222 -125.9 66.2
4th quintile -39 -303.9 -220.6 -53.9
5th quintile -89.9 -363.9 -273.7 -93.2
Percentage of Beneficiary Households within a Category as a result of the Policy
Extreme Poverty 99% 66% 100% 100%
Remaining Poor 87% 19% 93% 100%
Remainder of First Quintile 100% 26% 81% 100%
2nd quintile 100% 0% 41% 82%
3rd quintile 0% 0% 11% 56%
4th quintile 0% 0% 1% 16%
5th quintile 0% 0% 0% 5%
Total Number of Dinars Received per Household
Extreme Poverty 320.8 255.9 350.2 538.8
Remaining Poor 424.6 318.9 458.6 737.9
Remainder of First Quintile 304.5 215.9 278.2 429.6
2nd quintile 372 227.6 334.2 547.5
3rd quintile 399.4 188 284.1 476.2
4th quintile 404.9 140.1 223.4 390
5th quintile 393.9 119.9 210.1 390.6
Breakdown of Budget Allocated to Social Transfers between Categories
Extreme Poverty 12% 17% 16% 15%
Remaining Poor 16% 22% 21% 21%
Remainder of First Quintile 12% 15% 13% 12%
2nd quintile 14% 16% 16% 16%
3rd quintile 15% 13% 13% 14%
4th quintile 15% 10% 10% 11%
5th quintile 15% 8% 10% 11%
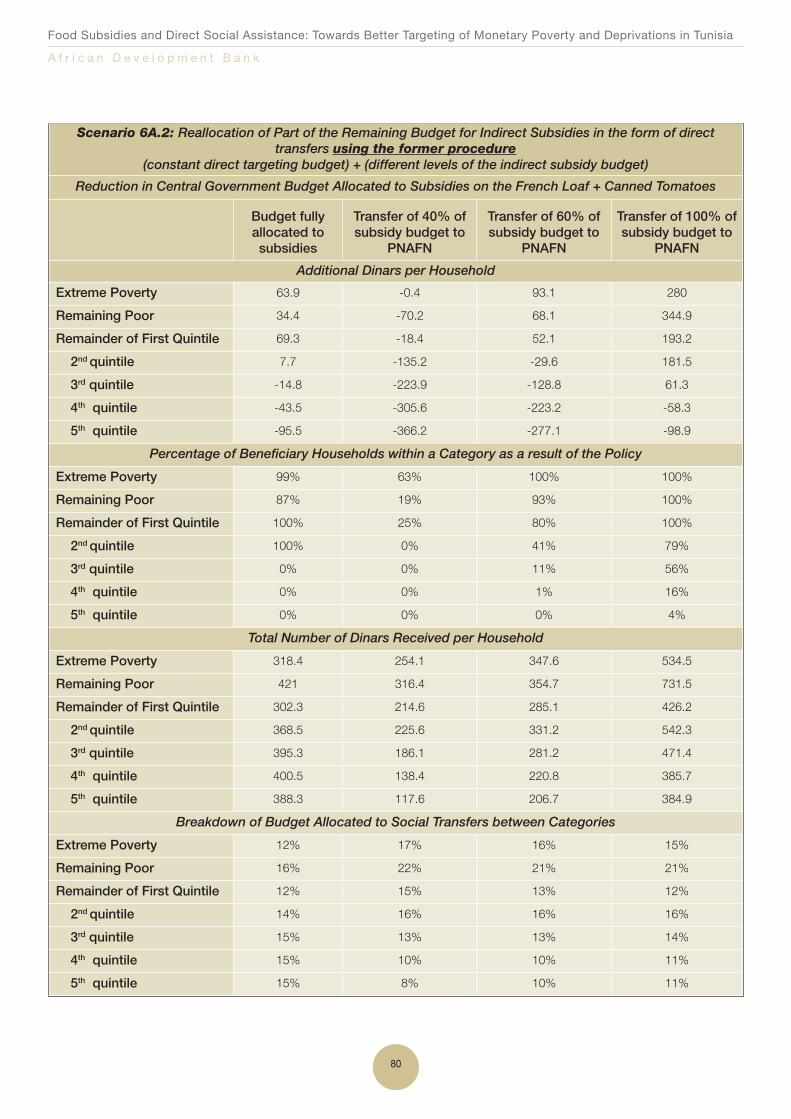
Food Subsidies and Direct Social Assistance: Towards Better Targeting of Monetary Poverty and Deprivations in Tunisia
A f r i c a n D e v e l o p m e n t B a n k
80
Scenario 6A.2: Reallocation of Part of the Remaining Budget for Indirect Subsidies in the form of direct transfers using the former procedure
(constant direct targeting budget) + (different levels of the indirect subsidy budget)
Reduction in Central Government Budget Allocated to Subsidies on the French Loaf + Canned Tomatoes
Budget fully allocated to subsidies
Transfer of 40% ofsubsidy budget to
PNAFN
Transfer of 60% ofsubsidy budget to
PNAFN
Transfer of 100% ofsubsidy budget to
PNAFN
Additional Dinars per Household
Extreme Poverty 63.9 -0.4 93.1 280
Remaining Poor 34.4 -70.2 68.1 344.9
Remainder of First Quintile 69.3 -18.4 52.1 193.2
2nd quintile 7.7 -135.2 -29.6 181.5
3rd quintile -14.8 -223.9 -128.8 61.3
4th quintile -43.5 -305.6 -223.2 -58.3
5th quintile -95.5 -366.2 -277.1 -98.9
Percentage of Beneficiary Households within a Category as a result of the Policy
Extreme Poverty 99% 63% 100% 100%
Remaining Poor 87% 19% 93% 100%
Remainder of First Quintile 100% 25% 80% 100%
2nd quintile 100% 0% 41% 79%
3rd quintile 0% 0% 11% 56%
4th quintile 0% 0% 1% 16%
5th quintile 0% 0% 0% 4%
Total Number of Dinars Received per Household
Extreme Poverty 318.4 254.1 347.6 534.5
Remaining Poor 421 316.4 354.7 731.5
Remainder of First Quintile 302.3 214.6 285.1 426.2
2nd quintile 368.5 225.6 331.2 542.3
3rd quintile 395.3 186.1 281.2 471.4
4th quintile 400.5 138.4 220.8 385.7
5th quintile 388.3 117.6 206.7 384.9
Breakdown of Budget Allocated to Social Transfers between Categories
Extreme Poverty 12% 17% 16% 15%
Remaining Poor 16% 22% 21% 21%
Remainder of First Quintile 12% 15% 13% 12%
2nd quintile 14% 16% 16% 16%
3rd quintile 15% 13% 13% 14%
4th quintile 15% 10% 10% 11%
5th quintile 15% 8% 10% 11%

Food Subsidies and Direct Social Assistance: Towards Better Targeting of Monetary Poverty and Deprivations in Tunisia
A f r i c a n D e v e l o p m e n t B a n k
81
Scenario 6A.3: Reallocation of Part of the Remaining Budget for Indirect Subsidies in the form of direct transfers using the former procedure
(constant direct targeting budget) + (different levels of the indirect subsidy budget)
Reduction in Central Government Budget Allocated to Subsidies on the French Loaf + Canned Tomatoes+ Milk + Flour
Budget fully allocated to subsidies
Transfer of 40% ofsubsidy budget to
PNAFN
Transfer of 60% ofsubsidy budget to
PNAFN
Transfer of 100% ofsubsidy budget to
PNAFN
Additional Dinars per Household
Extreme Poverty 58.3 -4.5 86.8 269.5
Remaining Poor 25.6 -76.5 58.7 329.1
Remainder of First Quintile 62.9 -22.1 46.6 184
2nd quintile -2.4 -140.9 -38.1 167.4
3rd quintile -28.5 -230.1 -138.1 45.9
4th quintile -60.7 -312.1 -232.9 -74.4
5th quintile -118.3 -375.4 -291 -122
Percentage of Beneficiary Households within a Category as a result of the Policy
Extreme Poverty 95% 57% 100% 100%
Remaining Poor 59% 15% 93% 100%
Remainder of First Quintile 100% 20% 73% 100%
2nd quintile 17% 0% 41% 79%
3rd quintile 0% 0% 11% 51%
4th quintile 0% 0% 1% 16%
5th quintile 0% 0% 0% 2%
Total Number of Dinars Received per Household
Extreme Poverty 312.8 250 341.3 524
Remaining Poor 412.2 310.1 445.3 715.7
Remainder of First Quintile 295.9 210.9 279.6 417
2nd quintile 358.4 219.9 322.7 528.2
3rd quintile 381.5 179.9 271.9 455.9
4th quintile 383.3 131.9 211.1 369.5
5th quintile 365.5 108.4 192.8 361.8
Breakdown of Budget Allocated to Social Transfers between Categories
Extreme Poverty 12% 18% 17% 16%
Remaining Poor 16% 22% 22% 21%
Remainder of First Quintile 12% 15% 14% 12%
2nd quintile 14% 16% 16% 16%
3rd quintile 15% 13% 13% 14%
4th quintile 15% 9% 10% 11%
5th quintile 15% 8% 9% 11%

Food Subsidies and Direct Social Assistance: Towards Better Targeting of Monetary Poverty and Deprivations in Tunisia
A f r i c a n D e v e l o p m e n t B a n k
82
Scenario 6A.4: Reallocation of Part of the Remaining Budget for Indirect Subsidies in the form of direct transfers using the former procedure
(constant direct targeting budget) + (different levels of the indirect subsidy budget)
Reduction in Central Government Budget Allocated to Subsidies on the French Loaf + Canned Tomatoes + Milk + Flour + Couscous + Pasta + Sugar
Budget fully allocated to subsidies
Transfer of 40% ofsubsidy budget to
PNAFN
Transfer of 60% ofsubsidy budget to
PNAFN
Transfer of 100% ofsubsidy budget to
PNAFN
Additional Dinars per Household
Extreme Poverty 0.5 -47.6 22.3 161.9
Remaining Poor -61.8 -140.1 -36.6 170.2
Remainder of First Quintile 11.2 -54.2 -1.5 103.9
2nd quintile -82.1 -188.6 -109.7 48
3rd quintile -117.9 -272.7 -202 -60.6
4th quintile -159 -349.9 -289.7 -169.1
5th quintile -233.2 -241.7 -360.4 -237.8
Percentage of Beneficiary Households within a Category as a result of the Policy
Extreme Poverty 65% 16% 90% 100%
Remaining Poor 19% 3% 47% 94%
Remainder of First Quintile 71% 9% 56% 100%
2nd quintile 0% 0% 0% 41%
3rd quintile 0% 0% 0% 11%
4th quintile 0% 0% 0% 1%
5th quintile 0% 0% 0% 0%
Total Number of Dinars Received per Household
Extreme Poverty 255 206.9 276.8 416.4
Remaining Poor 324.8 246.5 350 556.8
Remainder of First Quintile 244.2 178.8 231.5 336.9
2nd quintile 378.7 172.2 251.1 408.8
3rd quintile 292.1 137.3 208 349.4
4th quintile 284.9 94 154.3 274.8
5th quintile 250.6 62 123.4 246
Breakdown of Budget Allocated to Social Transfers between Categories
Extreme Poverty 13% 19% 17% 16%
Remaining Poor 17% 22% 22% 22%
Remainder of First Quintile 13% 16% 15% 13%
2nd quintile 14% 16% 16% 16%
3rd quintile 15% 13% 13% 13%
4th quintile 15% 9% 10% 11%
5th quintile 13% 6% 8% 9%

Food Subsidies and Direct Social Assistance: Towards Better Targeting of Monetary Poverty and Deprivations in Tunisia
A f r i c a n D e v e l o p m e n t B a n k
83
Scenario 6A.5: Reallocation of Part of the Remaining Budget for Indirect Subsidies in the form of direct transfers using the former procedure
(constant direct targeting budget) + (different levels of the indirect subsidy budget)
Reduction in Central Government Budget Allocated to Subsidies on the French Loaf + Canned Tomatoes + Milk+ Flour + Couscous + Pasta + Sugar + Large loaves
Budget fully allocated to subsidies
Transfer of 40% ofsubsidy budget to
PNAFN
Transfer of 60% ofsubsidy budget to
PNAFN
Transfer of 100% ofsubsidy budget to
PNAFN
Additional Dinars per Household
Extreme Poverty -76.9 -105.1 -64.1 18.1
Remaining Poor -180.9 -226.1 -165.6 -44.7
Remainder of First Quintile -65.8 -100.4 -70.9 -11.8
2nd quintile -202.8 -258.7 -214.9 -127.2
3rd quintile -263.9 -340.9 -304.2 -231
4th quintile -320.7 -411.8 -382.4 -323.8
5th quintile -398.2 -486.5 -457.6 -399.7
Percentage of Beneficiary Households within a Category as a result of the Policy
Extreme Poverty 6% 3% 10% 90%
Remaining Poor 1% 1% 2% 47%
Remainder of First Quintile 8% 5% 6% 53%
2nd quintile 0% 0% 0% 0%
3rd quintile 0% 0% 0% 0%
4th quintile 0% 0% 0% 0%
5th quintile 0% 0% 0% 0%
Total Number of Dinars Received per Household
Extreme Poverty 177.6 149.9 190.4 272.6
Remaining Poor 205.7 160.5 221 341.9
Remainder of First Quintile 167.2 132.6 162,1 221.2
2nd quintile 158 102.1 145.9 233.6
3rd quintile 146.1 69.2 105.8 179.1
4th quintile 123.3 32.2 61.5 120.2
5th quintile 85.6 -2.7 26.2 84.1
Breakdown of Budget Allocated to Social Transfers between Categories
Extreme Poverty 17% 23% 21% 19%
Remaining Poor 19% 25% 24% 24%
Remainder of First Quintile 16% 21% 18% 15%
2nd quintile 15% 16% 16% 16%
3rd quintile 14% 11% 12% 12%
4th quintile 12% 5% 7% 8%
5th quintile 8% 0% 3% 6%

Food Subsidies and Direct Social Assistance: Towards Better Targeting of Monetary Poverty and Deprivations in Tunisia
A f r i c a n D e v e l o p m e n t B a n k
84
Scenario 6B.1: Reallocation of Part of the Remaining Budget for Indirect Subsidies in the form of direct transfers using the new procedure
(constant direct targeting budget) + (different levels of the indirect subsidy budget)
Reduction in Central Government Budget Allocated to Subsidies on the French Loaf
Budget fully allocated to subsidies
Transfer of 40% ofsubsidy budget to
PNAFN
Transfer of 60% ofsubsidy budget to
PNAFN
Transfer of 100% ofsubsidy budget to
PNAFN
Additional Dinars per Household
Extreme Poverty 2 276.8 2 351.8 2 390.8 2 467.4
Remaining Poor 310.3 347.1 366.6 405.5
Remainder of First Quintile -81.3 -76.1 -72.8 -63.6
2nd quintile -86.8 -88.4 -89.2 -90.8
3rd quintile -86.9 -90.6 -92.5 -96.3
4th quintile -86.9 -93.9 -97.4 -104.4
5th quintile -86.8 -99.1 -105.3 -117.6
Percentage of Beneficiary Households within a Category as a result of the Policy
Extreme Poverty 100% 100% 100% 100%
Remaining Poor 51% 53% 53% 54%
Remainder of First Quintile 3% 7% 8% 11%
2nd quintile 0% 0% 0% 0%
3rd quintile 0% 0% 0% 0%
4th quintile 0% 0% 0% 0%
5th quintile 0% 0% 0% 0%
Total Number of Dinars Received per Household
Extreme Poverty 2 611.5 2 686.9 2 726.1 2 803.1
Remaining Poor 778.1 815.5 835.3 874.9
Remainder of First Quintile 440.6 446.5 450.2 460
2nd quintile 439 439 439 439
3rd quintile 431.5 431.5 431.5 431.5
4th quintile 387.7 387.7 387.7 387.7
5th quintile 323.8 323.8 323.8 323.8
Breakdown of Budget Allocated to Social Transfers between Categories
Extreme Poverty 48% 49% 49% 49%
Remaining Poor 14% 15% 15% 15%
Remainder of First Quintile 8% 8% 8% 8%
2nd quintile 8% 8% 8% 8%
3rd quintile 8% 8% 8% 8%
4th quintile 7% 7% 7% 7%
5th quintile 6% 6% 6% 6%

Food Subsidies and Direct Social Assistance: Towards Better Targeting of Monetary Poverty and Deprivations in Tunisia
A f r i c a n D e v e l o p m e n t B a n k
85
Scenario 6B.2: Reallocation of Part of the Remaining Budget for Indirect Subsidies in the form of direct transfers using the new procedure
(constant direct targeting budget) + (different levels of the indirect subsidy budget)
Reduction in Central Government Budget Allocated to Subsidies on the French Loaf + Canned Tomatoes
Budget fully allocated to subsidies
Transfer of 40% ofsubsidy budget to
PNAFN
Transfer of 60% ofsubsidy budget to
PNAFN
Transfer of 100% ofsubsidy budget to
PNAFN
Additional Dinars per Household
Extreme Poverty 2 276.8 2 376.5 2 424.9 2 513.3
Remaining Poor 310.3 358.8 382.9 427.8
Remainder of First Quintile -81.3 -75.3 -71 -59.7
2nd quintile -86.8 -90.3 -92.1 -95.6
3rd quintile -86.9 -92.3 -95 -100.5
4th quintile -86.9 -95.5 -99.8 -108.5
5th quintile -86.8 -101 -108.1 -122.3
Percentage of Beneficiary Households within a Category as a result of the Policy
Extreme Poverty 100% 100% 100% 100%
Remaining Poor 51% 53% 54% 55%
Remainder of First Quintile 3% 8% 9% 14%
2nd quintile 0% 0% 0% 0%
3rd quintile 0% 0% 0% 0%
4th quintile 0% 0% 0% 0%
5th quintile 0% 0% 0% 0%
Total Number of Dinars Received per Household
Extreme Poverty 2 609.2 2 710.2 2 759.3 2 849
Remaining Poor 774.6 825.1 850.2 897.2
Remainder of First Quintile 436.6 444.9 450.4 463.9
2nd quintile 434.3 434.3 434.3 434.3
3rd quintile 427.3 427.3 427.3 427.3
4th quintile 383.7 383.7 383.7 383.7
5th quintile 319.1 319.1 319.1 319.1
Breakdown of Budget Allocated to Social Transfers between Categories
Extreme Poverty 48% 49% 49% 49%
Remaining Poor 14% 15% 15% 16%
Remainder of First Quintile 8% 8% 8% 8%
2nd quintile 8% 8% 8% 8%
3rd quintile 8% 8% 8% 8%
4th quintile 7% 7% 7% 7%
5th quintile 6% 6% 6% 6%

Food Subsidies and Direct Social Assistance: Towards Better Targeting of Monetary Poverty and Deprivations in Tunisia
A f r i c a n D e v e l o p m e n t B a n k
86
Scenario 6B.3: Reallocation of Part of the Remaining Budget for Indirect Subsidies in the form of directtransfers using the new procedure
(constant direct targeting budget) + (different levels of the indirect subsidy budget)Reduction in Central Government Budget Allocated to Subsidies on the French Loaf + Canned Tomatoes
+ Milk + Flour
Budget fully allocated to subsidies
Transfer of 40% ofsubsidy budget to
PNAFN
Transfer of 60% ofsubsidy budget to
PNAFN
Transfer of 100% ofsubsidy budget to
PNAFN
Additional Dinars per Household
Extreme Poverty 2 276.8 2 456.3 2 537.9 2 707.9
Remaining Poor 310.3 397.8 439.3 529.4
Remainder of First Quintile -81.3 -69 -58.2 -25.7
2nd quintile -86.8 -96 -100.6 -109.8
3rd quintile -86.9 -99 -105.1 -117.3
4th quintile -86.9 -102.5 -110.4 -126
5th quintile -86.8 -108.6 -119.5 -141.2
Percentage of Beneficiary Households within a Category as a result of the Policy
Extreme Poverty 100% 100% 100% 100%
Remaining Poor 51% 54% 56% 58%
Remainder of First Quintile 3% 10% 15% 23%
2nd quintile 0% 0% 0% 0%
3rd quintile 0% 0% 0% 0%
4th quintile 0% 0% 0% 0%
5th quintile 0% 0% 0% 0%
Total Number of Dinars Received per Household
Extreme Poverty 2 603.7 2 786.7 2 870.1 3 043.6
Remaining Poor 765.9 858.8 903.1 998.8
Remainder of First Quintile 426.9 445.4 459.3 497.9
2nd quintile 420.1 420.1 420.1 420.1
3rd quintile 410.5 410.5 410.5 410.5
4th quintile 366.1 366.1 366.1 366.1
5th quintile 300.2 300.2 300.2 300.2
Breakdown of Budget Allocated to Social Transfers between Categories
Extreme Poverty 49% 50% 50% 50%
Remaining Poor 14% 15% 16% 17%
Remainder of First Quintile 8% 8% 8% 8%
2nd quintile 8% 8% 7% 7%
3rd quintile 8% 7% 7% 7%
4th quintile 7% 7% 6% 6%
5th quintile 6% 5% 5% 5%
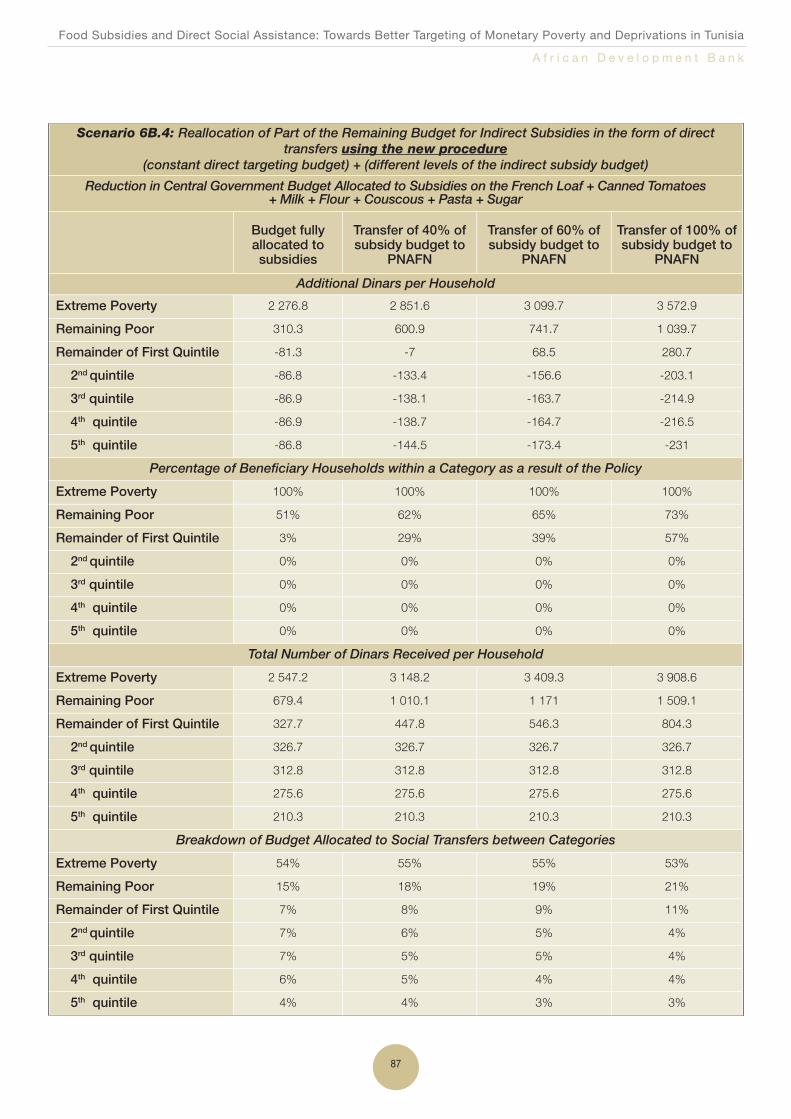
Food Subsidies and Direct Social Assistance: Towards Better Targeting of Monetary Poverty and Deprivations in Tunisia
A f r i c a n D e v e l o p m e n t B a n k
87
Scenario 6B.4: Reallocation of Part of the Remaining Budget for Indirect Subsidies in the form of direct transfers using the new procedure
(constant direct targeting budget) + (different levels of the indirect subsidy budget)
Reduction in Central Government Budget Allocated to Subsidies on the French Loaf + Canned Tomatoes+ Milk + Flour + Couscous + Pasta + Sugar
Budget fully allocated to subsidies
Transfer of 40% ofsubsidy budget to
PNAFN
Transfer of 60% ofsubsidy budget to
PNAFN
Transfer of 100% ofsubsidy budget to
PNAFN
Additional Dinars per Household
Extreme Poverty 2 276.8 2 851.6 3 099.7 3 572.9
Remaining Poor 310.3 600.9 741.7 1 039.7
Remainder of First Quintile -81.3 -7 68.5 280.7
2nd quintile -86.8 -133.4 -156.6 -203.1
3rd quintile -86.9 -138.1 -163.7 -214.9
4th quintile -86.9 -138.7 -164.7 -216.5
5th quintile -86.8 -144.5 -173.4 -231
Percentage of Beneficiary Households within a Category as a result of the Policy
Extreme Poverty 100% 100% 100% 100%
Remaining Poor 51% 62% 65% 73%
Remainder of First Quintile 3% 29% 39% 57%
2nd quintile 0% 0% 0% 0%
3rd quintile 0% 0% 0% 0%
4th quintile 0% 0% 0% 0%
5th quintile 0% 0% 0% 0%
Total Number of Dinars Received per Household
Extreme Poverty 2 547.2 3 148.2 3 409.3 3 908.6
Remaining Poor 679.4 1 010.1 1 171 1 509.1
Remainder of First Quintile 327.7 447.8 546.3 804.3
2nd quintile 326.7 326.7 326.7 326.7
3rd quintile 312.8 312.8 312.8 312.8
4th quintile 275.6 275.6 275.6 275.6
5th quintile 210.3 210.3 210.3 210.3
Breakdown of Budget Allocated to Social Transfers between Categories
Extreme Poverty 54% 55% 55% 53%
Remaining Poor 15% 18% 19% 21%
Remainder of First Quintile 7% 8% 9% 11%
2nd quintile 7% 6% 5% 4%
3rd quintile 7% 5% 5% 4%
4th quintile 6% 5% 4% 4%
5th quintile 4% 4% 3% 3%

Food Subsidies and Direct Social Assistance: Towards Better Targeting of Monetary Poverty and Deprivations in Tunisia
A f r i c a n D e v e l o p m e n t B a n k
88
Scenario 6B.5: Reallocation of Part of the Remaining Budget for Indirect Subsidies in the form of direct transfers using the new procedure
(constant direct targeting budget) + (different levels of the indirect subsidy budget)
Reduction in Central Government Budget Allocated to Subsidies on the French Loaf + Canned Tomatoes+ Milk + Flour + Couscous + Pasta + Sugar + Large loaves
Budget fully allocated to subsidies
Transfer of 40% ofsubsidy budget to
PNAFN
Transfer of 60% ofsubsidy budget to
PNAFN
Transfer of 100% ofsubsidy budget to
PNAFN
Additional Dinars per Household
Extreme Poverty 2 276.8 3 429.9 3 800.9 4 461.6
Remaining Poor 310.3 945.6 1 194.5 1 720.8
Remainder of First Quintile -81.3 208.6 411.7 918.3
2nd quintile -86.8 -198.2 -253.9 -358.7
3rd quintile -86.9 -203.2 -261.3 -377.6
4th quintile -86.9 -198.7 -254.6 -366.5
5th quintile -86.8 -188.9 -240 -342.1
Percentage of Beneficiary Households within a Category as a result of the Policy
Extreme Poverty 100% 100% 100% 100%
Remaining Poor 51% 71% 77% 92%
Remainder of First Quintile 3% 52% 65% 89%
2nd quintile 0% 0% 0% 0%
3rd quintile 0% 0% 0% 0%
4th quintile 0% 0% 0% 0%
5th quintile 0% 0% 0% 0%
Total Number of Dinars Received per Household
Extreme Poverty 2 471.6 3 681 4 080.3 4 797.3
Remaining Poor 561.4 1 284 1 576.6 2 190.2
Remainder of First Quintile 195 583.8 836.4 1 441.9
2nd quintile 164.5 164.5 164.5 171.2
3rd quintile 150.1 150.1 150.1 150.1
4th quintile 125.6 125.6 125.6 125.6
5th quintile 99.3 99.3 99.3 99.3
Breakdown of Budget Allocated to Social Transfers between Categories
Extreme Poverty 66% 60% 58% 53%
Remaining Poor 15% 21% 22% 24%
Remainder of First Quintile 5% 10% 12% 16%
2nd quintile 4% 3% 2% 2%
3rd quintile 4% 2% 2% 2%
4th quintile 3% 2% 2% 1%
5th quintile 3% 2% 1% 1%

89