setting priorities, targeting subsidies among water ... · setting priorities, targeting subsidies...
TRANSCRIPT

World Development Vol. xx, No. x, pp. xxx–xxx, 2012� 2012 Elsevier Ltd. All rights reserved
0305-750X/$ - see front matter
www.elsevier.com/locate/worlddevhttp://dx.doi.org/10.1016/j.worlddev.2012.03.004
Setting Priorities, Targeting Subsidies among Water, Sanitation,
and Preventive Health Interventions in Developing Countries
DALE WHITTINGTONUniversity of North Carolina at Chapel Hill, NC, USA
Manchester Business School, UK
MARC JEULANDDuke University, USA
KATE BARKERPopulation Council, NY, USA
and
YVONNE YUEN *
University of North Carolina at Chapel Hill, NC, USA
PleaseHealth
Summary. — The paper challenges the conventional wisdom that water and sanitation improvements and other preventive healthinterventions are always a wise economic investment. Costs and benefits are presented for six water, sanitation, and health pro-grams—handwashing, sanitation, point-of-use filtration and chlorination, insecticide-treated bed nets, and cholera vaccination. Modelparameters are specified for a range of conditions that are plausible for locations in developing countries. We find that the parametervalues needed for such cost–benefit calculations are not available for setting global priorities. We reflect on the implications of ourfindings for more “evidence-based” planning of public health and development interventions.� 2012 Elsevier Ltd. All rights reserved.
Key words — benefit–cost analysis, health, water and sanitation, technological adoption, Monte Carlo analysis
* Many individuals have assisted us with this research effort. We would
especially like to thank Paul Edwards (UNICEF), Clarissa Brocklehurst
(UNICEF), John Borrazzo (USAID), Donald T. Lauria (UNC-CH),
Subhrendu Pattanayak (Duke), Henita Kuntawala (UNC-CH), and Alex
Pfaff (Duke). Final revision accepted: March 7, 2012.
1. INTRODUCTION
Economists who do not work in water and sanitation andhygiene (WASH) and other preventive health interventionsin developing countries will likely be surprised at the currentpolicy debates in this sector. Professionals in these fields arewrestling with three related puzzles that outside observersmight well expect to have been resolved long ago.
First, although the health benefits from use of preventivehealth goods and services are purported to be high, demandfor them is usually very low among households in developingcountries. Preventive health interventions which require singleor occasional uptake, such as insecticide-impregnated mos-quito nets (bed nets) and vaccines, have been shown to beeffective in saving lives and reducing general morbidity, as wellas cost effective, yet household demand for these interventionshas been found to be consistently low and price elastic(Kremer, Leino, Miguel, & Zwane, 2009; Whittington,2010). Some of these technologies (e.g., home-based waterchlorination and bed nets) have been around for decades,yet market penetration has been very slow (in sharp contrastto cell phones), perhaps because these interventions also in-volve significant disamenities (taste and odor problems, dis-comfort or inconvenience in use, etc.). On the other hand,household demand for piped water services in developingcountries is very inelastic (Nauges & Whittington, 2009), eventhough the health benefits from these services in developingcountries are ambiguous and controversial (Bennett, 2010;Cairncross et al., 2010; Fewtrell et al., 2005; Waddington &
1
cite this article in press as: Whittington, D. et al. Setting PrioritInterventions in Developing Countries, World Development (2
Snilstveit, 2009). This may be because households value thetime savings and privacy the services provide. 1
A second puzzle relates to experts’ differing positions on theimportance of user fees for preventive services and products.Public health professionals and development economists gen-erally support free or heavily subsidized improved water andsanitation services and other preventive health interventions,such as vaccinations, bed nets, and point-of-use water treat-ments, on the basis of economic, financial, and moral argu-ments. On economic grounds they make the Pigovian casethat positive externalities from such health interventions jus-tify public subsidies (Pigou, 1932). On financial grounds theyargue that because demand is so price elastic, the revenuesgenerated by user fees do not justify the costs of administra-tion and collection. On moral grounds they argue that bothwater and health are basic human rights: user fees would pre-vent the poorest households from accessing services. The factthat penetration and/or sustained usage of many of these pre-ventive health interventions often remains low despite free orhighly subsidized provision has not led proponents of free ser-vices to reconsider these arguments (Cairncross, Shordt,
ies, Targeting Subsidies among Water, Sanitation, and Preventive012), http://dx.doi.org/10.1016/j.worlddev.2012.03.004

2 WORLD DEVELOPMENT
Zacharia, & Govindan, 2005; Pattanayak et al., 2009; Wadd-ington & Snilstveit, 2009).
On the other hand, professionals in the water and sanita-tion sector tend to insist on the need for user charges forboth network and nonnetwork water and sanitation technol-ogies. They argue that user charges achieve the financial goalof cost recovery, the economic-efficiency goal of deliveringappropriate amounts of water and preventing water wastage,and the political goal of creating a sense of ownership in thecapital facilities and management decisions (Rogers, De Sil-va, & Bhatia, 2002). The consensus that user charges areimportant in this sector may also be due to what Howells(1996) has termed “tacit knowledge,” that is, long experienceof trying without great success to provide services with nouser charges.
A third puzzle is that in contrast to public health profession-als, governments in developing countries often may supportlarge subsidies for piped water and sanitation infrastructureat the expense of other, supposedly more beneficial healthimprovements. Ramsey pricing would suggest that if revenuesneed to be raised to finance piped water services and nonnet-work water and sanitation interventions, as well as other pub-lic health interventions, prices should be increased on pipedwater services (the price inelastic good) in order to cross-sub-sidize the nonnetwork services such as point-of-use treatment(the price elastic good) (Ramsey, 1927). But what actually oc-curs is the precise opposite. Governments of developing coun-tries are typically extremely reluctant to price piped waterservices at anything close to the true costs of service, much lessto extract from them extra revenues to finance nonnetworkservices, even those with demonstrated positive public healthoutcomes (Cairncross, 2003). Governments provide massivesubsidies for piped water and sewer services (which tend tobe disproportionately captured by upper- and middle-incomehouseholds), while nonnetwork public health interventions re-ceive little funding (Evans, 1999). In fact donors attempting tosubsidize vaccination, bed nets, and point-of-use water treat-ment are often concerned that national and regional govern-ments may try to divert funds earmarked for thesepreventive health services toward other uses, or that donorfinancial support will simply become a substitute for govern-ment budget allocations for preventive health activities.
Discussion below addresses what we believe is one underly-ing reason for all three of these puzzles: the high uncertainty(for given sites) and inherent variability (across sites) in theeconomic costs and benefits of water and sanitation and hy-giene and preventive health interventions in developing coun-tries. We report on an analysis of the variation in costs andbenefits of six different interventions (promotion of handwash-ing and improved hygiene; “total sanitation” campaigns, de-signed to curb open-air defecation; biosand water filters;point-of-use chlorination of drinking water; insecticide-treatedbed nets; and cholera vaccination), and show that . . .
(1) At the median parameter values in the benefit–costmodel, all six interventions deliver positive net benefits,but the magnitude of the net benefits to a household fromall of the six interventions is relatively modest.(2) There are many combinations of parameter values thatyield a benefit–cost ratio (BCR) that is less than 1 for all sixinterventions. (For the median assumptions about uptakeand usage, anywhere from 20% to 55% of simulation out-comes have costs that outweigh benefits depending on theintervention.)(3) Given the heterogeneity in benefit–cost outcomes fromthe model simulations, developing a priority ranking ofwater and sanitation and hygiene and preventive health
Please cite this article in press as: Whittington, D. et al. Setting PrioritHealth Interventions in Developing Countries, World Development (2
interventions—and setting cross-sectoral investment priori-ties—is much more complicated than commonlyappreciated.
Our findings challenge the conventional wisdom in the waterand sanitation and public health sectors that the economiccase for such interventions is overwhelming and noncontro-versial. We also find reasons to agree with researchers whohave expressed skepticism about the confidence that healthsector professionals sometimes place in new innovations in ser-vice delivery and technology and in rigorous program evalua-tion methods such as randomized controlled trials, for finding“evidence-based” solutions to these policy puzzles (Deaton,2010). To illustrate this point we show the limited utility ofzeroing in on a better estimate of any single parameter inthe benefit–cost calculation, given the multitude of factors thatare relevant. We also demonstrate that global estimates of thecosts and benefits of such interventions are of very limitedworth given the heterogeneity one can expect to find acrosstarget locations in developing countries. Our results also haveimplications for recent debates about the role that pricing canplay in allocating public health goods and services in develop-ing countries (Ashraf, Berry, & Shapiro, 2010; Cohen & Du-pas, 2010).
In Section 2 of the paper we show why benefit–cost andcost-effectiveness calculations in the water and sanitationand hygiene and preventive health fields are fraught withuncertainty. Section 3 presents our benefit–cost model anddiscusses the assumptions made. In Section 4 we briefly de-scribe the six interventions and the specific assumptionsmade to estimate the costs and benefits of each. Section 5presents the results of our benefit–cost calculations and sen-sitivity analyses. Section 6 discusses some of the implicationsof these findings.
2. BACKGROUND
The desire to establish investment priorities in water andsanitation and hygiene and preventive health initiatives isunderstandable, virtually universal, and not new. Budgets tosupport such interventions are limited, and government agen-cies and donors want to allocate available financial resourcesso as to do the most good. But a strong desire to set globalfunding priorities does not make the task easy. Priority-settinganalyses have adopted two main analytical approaches: cost-effectiveness analysis (CEA) and benefit–cost analysis (BCA).Centralized planning institutions have always struggled to im-prove the quality and availability of the information neededfor such calculations. The kinds of information required toimplement CEA and BCA differ somewhat, but both requireup-to-date, site-specific data that have proven extremely diffi-cult to obtain.
The problem that global planners in these sectors confront isconceptually not very different from that faced by economicplanners in the former Soviet Union: how can a central plan-ning office procure accurate, reliable information from thefield to set production and investment targets? To address thisquestion, water and sanitation and hygiene and preventivehealth professionals working for donor organizations confronttwo further major hurdles. First, even if the needed data areobtained, they are nonstationary; that is, one cannot assumethat parameter estimates will remain constant over time. Forexample, when climate change, demographics, migration pat-terns, and economic growth are changing baseline conditions,studies of the burden of disease incidence or case fatality ratesmay quickly become out of date.
ies, Targeting Subsidies among Water, Sanitation, and Preventive012), http://dx.doi.org/10.1016/j.worlddev.2012.03.004
SETTING PRIORITIES, TARGETING SUBSIDIES AMONG WATER, SANITATION, AND PREVENTIVE HEALTH INTERVENTIONS INDEVELOPING COUNTRIES 3
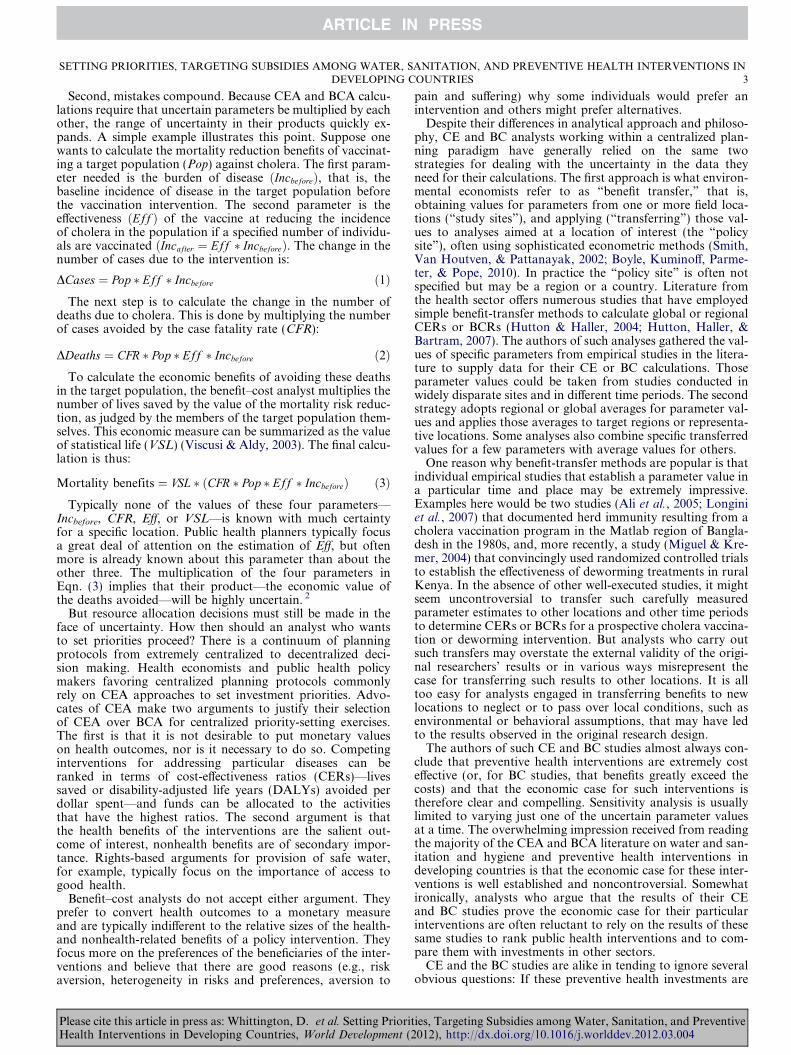
Second, mistakes compound. Because CEA and BCA calcu-lations require that uncertain parameters be multiplied by eachother, the range of uncertainty in their products quickly ex-pands. A simple example illustrates this point. Suppose onewants to calculate the mortality reduction benefits of vaccinat-ing a target population (Pop) against cholera. The first param-eter needed is the burden of disease ðIncbeforeÞ, that is, thebaseline incidence of disease in the target population beforethe vaccination intervention. The second parameter is theeffectiveness ðEff Þ of the vaccine at reducing the incidenceof cholera in the population if a specified number of individu-als are vaccinated ðIncafter ¼ Eff � IncbeforeÞ. The change in thenumber of cases due to the intervention is:
DCases ¼ Pop � Eff � Incbefore ð1ÞThe next step is to calculate the change in the number of
deaths due to cholera. This is done by multiplying the numberof cases avoided by the case fatality rate (CFR):
DDeaths ¼ CFR � Pop � Eff � Incbefore ð2ÞTo calculate the economic benefits of avoiding these deaths
in the target population, the benefit–cost analyst multiplies thenumber of lives saved by the value of the mortality risk reduc-tion, as judged by the members of the target population them-selves. This economic measure can be summarized as the valueof statistical life (VSL) (Viscusi & Aldy, 2003). The final calcu-lation is thus:
Mortality benefits ¼ VSL � ðCFR � Pop � Eff � IncbeforeÞ ð3ÞTypically none of the values of these four parameters—
Incbefore, CFR, Eff, or VSL—is known with much certaintyfor a specific location. Public health planners typically focusa great deal of attention on the estimation of Eff, but oftenmore is already known about this parameter than about theother three. The multiplication of the four parameters inEqn. (3) implies that their product—the economic value ofthe deaths avoided—will be highly uncertain. 2
But resource allocation decisions must still be made in theface of uncertainty. How then should an analyst who wantsto set priorities proceed? There is a continuum of planningprotocols from extremely centralized to decentralized deci-sion making. Health economists and public health policymakers favoring centralized planning protocols commonlyrely on CEA approaches to set investment priorities. Advo-cates of CEA make two arguments to justify their selectionof CEA over BCA for centralized priority-setting exercises.The first is that it is not desirable to put monetary valueson health outcomes, nor is it necessary to do so. Competinginterventions for addressing particular diseases can beranked in terms of cost-effectiveness ratios (CERs)—livessaved or disability-adjusted life years (DALYs) avoided perdollar spent—and funds can be allocated to the activitiesthat have the highest ratios. The second argument is thatthe health benefits of the interventions are the salient out-come of interest, nonhealth benefits are of secondary impor-tance. Rights-based arguments for provision of safe water,for example, typically focus on the importance of access togood health.
Benefit–cost analysts do not accept either argument. Theyprefer to convert health outcomes to a monetary measureand are typically indifferent to the relative sizes of the health-and nonhealth-related benefits of a policy intervention. Theyfocus more on the preferences of the beneficiaries of the inter-ventions and believe that there are good reasons (e.g., riskaversion, heterogeneity in risks and preferences, aversion to
Please cite this article in press as: Whittington, D. et al. Setting PrioritHealth Interventions in Developing Countries, World Development (2
pain and suffering) why some individuals would prefer anintervention and others might prefer alternatives.
Despite their differences in analytical approach and philoso-phy, CE and BC analysts working within a centralized plan-ning paradigm have generally relied on the same twostrategies for dealing with the uncertainty in the data theyneed for their calculations. The first approach is what environ-mental economists refer to as “benefit transfer,” that is,obtaining values for parameters from one or more field loca-tions (“study sites”), and applying (“transferring”) those val-ues to analyses aimed at a location of interest (the “policysite”), often using sophisticated econometric methods (Smith,Van Houtven, & Pattanayak, 2002; Boyle, Kuminoff, Parme-ter, & Pope, 2010). In practice the “policy site” is often notspecified but may be a region or a country. Literature fromthe health sector offers numerous studies that have employedsimple benefit-transfer methods to calculate global or regionalCERs or BCRs (Hutton & Haller, 2004; Hutton, Haller, &Bartram, 2007). The authors of such analyses gathered the val-ues of specific parameters from empirical studies in the litera-ture to supply data for their CE or BC calculations. Thoseparameter values could be taken from studies conducted inwidely disparate sites and in different time periods. The secondstrategy adopts regional or global averages for parameter val-ues and applies those averages to target regions or representa-tive locations. Some analyses also combine specific transferredvalues for a few parameters with average values for others.
One reason why benefit-transfer methods are popular is thatindividual empirical studies that establish a parameter value ina particular time and place may be extremely impressive.Examples here would be two studies (Ali et al., 2005; Longiniet al., 2007) that documented herd immunity resulting from acholera vaccination program in the Matlab region of Bangla-desh in the 1980s, and, more recently, a study (Miguel & Kre-mer, 2004) that convincingly used randomized controlled trialsto establish the effectiveness of deworming treatments in ruralKenya. In the absence of other well-executed studies, it mightseem uncontroversial to transfer such carefully measuredparameter estimates to other locations and other time periodsto determine CERs or BCRs for a prospective cholera vaccina-tion or deworming intervention. But analysts who carry outsuch transfers may overstate the external validity of the origi-nal researchers’ results or in various ways misrepresent thecase for transferring such results to other locations. It is alltoo easy for analysts engaged in transferring benefits to newlocations to neglect or to pass over local conditions, such asenvironmental or behavioral assumptions, that may have ledto the results observed in the original research design.
The authors of such CE and BC studies almost always con-clude that preventive health interventions are extremely costeffective (or, for BC studies, that benefits greatly exceed thecosts) and that the economic case for such interventions istherefore clear and compelling. Sensitivity analysis is usuallylimited to varying just one of the uncertain parameter valuesat a time. The overwhelming impression received from readingthe majority of the CEA and BCA literature on water and san-itation and hygiene and preventive health interventions indeveloping countries is that the economic case for these inter-ventions is well established and noncontroversial. Somewhatironically, analysts who argue that the results of their CEand BC studies prove the economic case for their particularinterventions are often reluctant to rely on the results of thesesame studies to rank public health interventions and to com-pare them with investments in other sectors.
CE and the BC studies are alike in tending to ignore severalobvious questions: If these preventive health investments are
ies, Targeting Subsidies among Water, Sanitation, and Preventive012), http://dx.doi.org/10.1016/j.worlddev.2012.03.004

4 WORLD DEVELOPMENT
so economically attractive, why has their uptake been relativelylimited? It is not for want of trying; donor-funded programs inthe water supply sector have been littered with white elephants(Therkildsen, 1998). Why is household demand for preventivehealth interventions typically low? Why are governments oftenreluctant to invest scarce resources in these sectors?
A few cross-sectoral BC comparisons of development prior-ities exist that have included water and sanitation and hygieneand preventive health interventions (Lomborg, 2004). But likewithin-sector analyses, these studies too have used benefit-transfer methods or global or regional averages for key param-eter values. This genre of priority-setting analyses typicallyignores behavioral evidence that suggests that adoption andusage of water and sanitation and hygiene and preventivehealth interventions vary considerably over time and placeand are often quite low, despite relatively intensive promotionor social marketing (Arnold & Colford, 2007; Cairncross et al.,2010; Hoque, Juncker, Sack, Ali, & Aziz, 1996; Waddington &Snilstveit, 2009). 3 It also ignores evidence that demand amongpotential beneficiaries varies and is not static, and thereforemay be misinterpreted by central planners; see for example Jen-kins and Curtis (2005), Mukherjee (2000), and Casabonne andKenny (2012) for examples of demand heterogeneity.
A recent paper comparing the costs and benefits of variouswater sector investments (Whittington, Hanemann, Sadoff, &Jeuland, 2009) used a different approach to compare interven-tions. In their benefit–cost model, the analysts specified rangesand distributions for each of about 25 parameters that variedacross locations in developing countries, and then conductedMonte Carlo simulations to determine outcomes for 10,000random combinations of those parameters. Although the ac-tual variation in these model parameters across locationsand time periods is poorly understood, the uncertainty sur-rounding these distributions has important consequences forsetting priorities in water and sanitation and hygiene and pre-ventive health interventions. The authors argued that the “dis-tributions of benefit–cost ratios . . . are more useful than pointestimates because they allow one to focus on the policy-rele-vant question of where water and sanitation investments arelikely to be most economically attractive.” This approach alsohelped identify which types of projects were more likely to im-prove household welfare across a wide range of plausible situ-ations in developing countries. For example, the resultsshowed that investments in conventional piped water and san-itation services were unlikely to yield net economic benefits inmany locations because of their high capital costs. A similaranalytical approach (Jeuland & Whittington, 2009) comparedthe probability distributions of BCRs for cholera vaccinationprograms versus two improved water supply interventions(deep boreholes with handpumps and biosand filters; apoint-of-use water treatment technology). These two studiessuggest that probabilistic approaches to decision-making pro-vide more useful information for setting priorities among dif-ferent types of interventions than the point estimates ofaverage benefit–cost outcomes.
3. ANALYTICAL FRAMEWORK
To more fully explore aspects of the high level of uncertaintyinherent in centralized priority-setting calculations, we hereextend the BC approach developed in the studies describedabove (Jeuland & Whittington, 2009; Whittington et al.,2009) in two ways. First, we focus more carefully on the effectthat behavioral assumptions about initial uptake and the sus-tained usage of new technologies have on the net benefits of
Please cite this article in press as: Whittington, D. et al. Setting PrioritHealth Interventions in Developing Countries, World Development (2
preventive health interventions. We define “uptake” as ahousehold’s initial acquisition of a technology or participationin a program. Usage is conceptualized as the rate (or fre-quency) of regular use among those “uptaking” households.For example, households may be perfectly happy to obtain awater filter from a new point-of-use program intervention,particularly if it is given to them free of charge, but thenmay never actually use it. With many types of technologies,such as point-of-use chlorination of drinking water, the possi-bility arises that usage rates will decline over time (Hunter,2009) or that the products may be used for nonhealth pur-poses, such as cleaning dirty laundry, or converting latrinesto storage sheds (Ashraf et al., 2010).
Second, we expand the scope of the analysis to include sixinterventions: four water and sanitation and hygiene interven-tions (handwashing, total sanitation campaigns, point-of-usechlorine treatment, and point-of-use biosand water filters)and two preventive health interventions (long-lived insecti-cide-treated bed nets and cholera vaccination programs).The water and sanitation and hygiene interventions reducemultiple diseases by reducing fecal-oral transmission. In con-trast, the preventive health interventions target specific dis-eases (malaria and cholera). It may seem odd to comparefour general health interventions with two that target specificdiseases, but many aid organizations do just that when settinginvestment priorities.
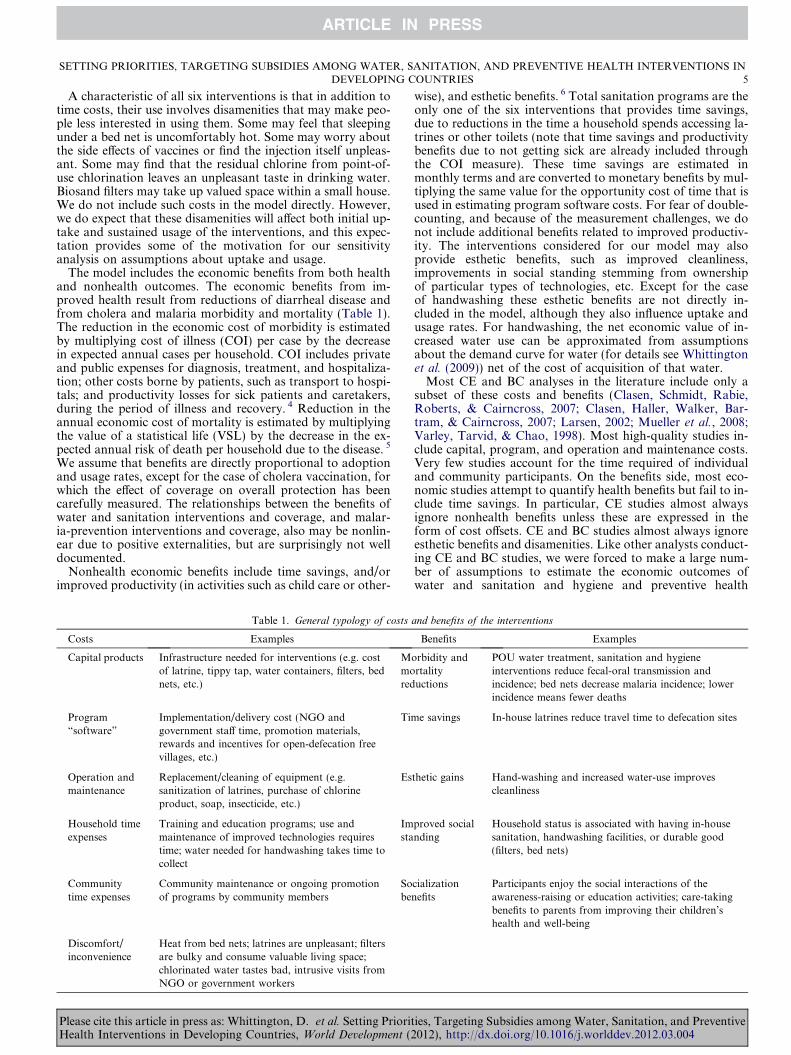
The unit of analysis for our BC calculations is the individualhousehold; the monthly costs of providing each interventionto a representative household in a given community are com-pared with the economic benefits that the household would re-ceive. We present BCRs to compare the overall economicattractiveness of these six interventions. The typology of costsand benefits used in the model is described below and pre-sented in Table 1.
The implementation of each of the six interventions involvesexpenditures for products (technology and supplies) and pro-gram “software.” The capital costs of our chosen interventionsinclude household infrastructure and supplies such as filters,bed nets, and vaccines. “Software” expenses include adminis-trative and delivery costs of programs, such as salaries andthe opportunity cost of health workers’ time, the developmentand logistical costs of promotion or educational campaigns,and/or any incentives provided to communities in order toencourage participation. In our BC model, one-time capitaland program expenses are annualized using a capital recoveryfactor that depends on two parameters: the discount rate andthe lifetime of each intervention. Annualized costs are then di-vided by 12 to obtain monthly costs.
Operation and maintenance costs are the ongoing monthlyexpenses required for upkeep of technologies or purchase ofadditional materials or supplies needed to sustain project ben-efits. Another component of the economic costs of the inter-ventions is the time spent by beneficiaries to access (or use)the services. Individuals may attend educational sessions tolearn how to use a particular technology or become informedabout hygiene behaviors that can improve their health. Com-munities may need to develop institutions to maintain pro-jects. To express “time costs,” time spent in these trainingand educational activities is converted to monetary amountsby multiplication with an (uncertain) opportunity cost of time.Because training and educational activities usually occur at thebeginning of an intervention, these costs are annualized anddivided into monthly amounts similar to the capital costs.Regular, periodic time costs for maintenance or other activi-ties related to the project are also expressed in monthly termsand monetized in the same way.
ies, Targeting Subsidies among Water, Sanitation, and Preventive012), http://dx.doi.org/10.1016/j.worlddev.2012.03.004
SETTING PRIORITIES, TARGETING SUBSIDIES AMONG WATER, SANITATION, AND PREVENTIVE HEALTH INTERVENTIONS INDEVELOPING COUNTRIES 5
A characteristic of all six interventions is that in addition totime costs, their use involves disamenities that may make peo-ple less interested in using them. Some may feel that sleepingunder a bed net is uncomfortably hot. Some may worry aboutthe side effects of vaccines or find the injection itself unpleas-ant. Some may find that the residual chlorine from point-of-use chlorination leaves an unpleasant taste in drinking water.Biosand filters may take up valued space within a small house.We do not include such costs in the model directly. However,we do expect that these disamenities will affect both initial up-take and sustained usage of the interventions, and this expec-tation provides some of the motivation for our sensitivityanalysis on assumptions about uptake and usage.
The model includes the economic benefits from both healthand nonhealth outcomes. The economic benefits from im-proved health result from reductions of diarrheal disease andfrom cholera and malaria morbidity and mortality (Table 1).The reduction in the economic cost of morbidity is estimatedby multiplying cost of illness (COI) per case by the decreasein expected annual cases per household. COI includes privateand public expenses for diagnosis, treatment, and hospitaliza-tion; other costs borne by patients, such as transport to hospi-tals; and productivity losses for sick patients and caretakers,during the period of illness and recovery. 4 Reduction in theannual economic cost of mortality is estimated by multiplyingthe value of a statistical life (VSL) by the decrease in the ex-pected annual risk of death per household due to the disease. 5
We assume that benefits are directly proportional to adoptionand usage rates, except for the case of cholera vaccination, forwhich the effect of coverage on overall protection has beencarefully measured. The relationships between the benefits ofwater and sanitation interventions and coverage, and malar-ia-prevention interventions and coverage, also may be nonlin-ear due to positive externalities, but are surprisingly not welldocumented.
Nonhealth economic benefits include time savings, and/orimproved productivity (in activities such as child care or other-
Table 1. General typology of costs
Costs Examples
Capital products Infrastructure needed for interventions (e.g. costof latrine, tippy tap, water containers, filters, bednets, etc.)
Mmored
Program“software”
Implementation/delivery cost (NGO andgovernment staff time, promotion materials,rewards and incentives for open-defecation freevillages, etc.)
Tim
Operation andmaintenance
Replacement/cleaning of equipment (e.g.sanitization of latrines, purchase of chlorineproduct, soap, insecticide, etc.)
Es
Household timeexpenses
Training and education programs; use andmaintenance of improved technologies requirestime; water needed for handwashing takes time tocollect
Imsta
Communitytime expenses
Community maintenance or ongoing promotionof programs by community members
Sobe
Discomfort/inconvenience
Heat from bed nets; latrines are unpleasant; filtersare bulky and consume valuable living space;chlorinated water tastes bad, intrusive visits fromNGO or government workers
Please cite this article in press as: Whittington, D. et al. Setting PrioritHealth Interventions in Developing Countries, World Development (2
wise), and esthetic benefits. 6 Total sanitation programs are theonly one of the six interventions that provides time savings,due to reductions in the time a household spends accessing la-trines or other toilets (note that time savings and productivitybenefits due to not getting sick are already included throughthe COI measure). These time savings are estimated inmonthly terms and are converted to monetary benefits by mul-tiplying the same value for the opportunity cost of time that isused in estimating program software costs. For fear of double-counting, and because of the measurement challenges, we donot include additional benefits related to improved productiv-ity. The interventions considered for our model may alsoprovide esthetic benefits, such as improved cleanliness,improvements in social standing stemming from ownershipof particular types of technologies, etc. Except for the caseof handwashing these esthetic benefits are not directly in-cluded in the model, although they also influence uptake andusage rates. For handwashing, the net economic value of in-creased water use can be approximated from assumptionsabout the demand curve for water (for details see Whittingtonet al. (2009)) net of the cost of acquisition of that water.
Most CE and BC analyses in the literature include only asubset of these costs and benefits (Clasen, Schmidt, Rabie,Roberts, & Cairncross, 2007; Clasen, Haller, Walker, Bar-tram, & Cairncross, 2007; Larsen, 2002; Mueller et al., 2008;Varley, Tarvid, & Chao, 1998). Most high-quality studies in-clude capital, program, and operation and maintenance costs.Very few studies account for the time required of individualand community participants. On the benefits side, most eco-nomic studies attempt to quantify health benefits but fail to in-clude time savings. In particular, CE studies almost alwaysignore nonhealth benefits unless these are expressed in theform of cost offsets. CE and BC studies almost always ignoreesthetic benefits and disamenities. Like other analysts conduct-ing CE and BC studies, we were forced to make a large num-ber of assumptions to estimate the economic outcomes ofwater and sanitation and hygiene and preventive health
and benefits of the interventions
Benefits Examples
orbidity andrtalityuctions
POU water treatment, sanitation and hygieneinterventions reduce fecal-oral transmission andincidence; bed nets decrease malaria incidence; lowerincidence means fewer deaths
e savings In-house latrines reduce travel time to defecation sites
thetic gains Hand-washing and increased water-use improvescleanliness
proved socialnding
Household status is associated with having in-housesanitation, handwashing facilities, or durable good(filters, bed nets)
cializationnefits
Participants enjoy the social interactions of theawareness-raising or education activities; care-takingbenefits to parents from improving their children’shealth and well-being
ies, Targeting Subsidies among Water, Sanitation, and Preventive012), http://dx.doi.org/10.1016/j.worlddev.2012.03.004

Table 2. Summary of field evidence on usage and uptake rates from the literature for the six interventions
Intervention Location No. of HHs Summary description User feescharged (Y/N)
Subsidy (%) Uptake rate (%) Usage rate (%) Disuse overtime (%)
Handwashing
Cairncross et al.
(2005)Kerala, India 345 Hygiene promotion + sanitation investment
evaluation conducted over 9 years (Ranges are fordifferent genders and ages)
Latrines only 100% 40% 10–84% No evidence
Wilson andChandler (1993)
Lombok,Indonesia
57 mothers 4-yr handwashing promotion with mothers N 100% N/A 79% No evidence
Borghi,Guinness,Ouedraogo, andCurtis (2002)
Burkina Faso 37,319 mothers� Cost-effectiveness study based on hygienecampaign with target population of mothers
For soap only Nearly 100% N/A 19% ?
Waterkeyn andCairncross(2005)
Zimbabwe 13,555� Integrated sanitation and hygiene campaign intwo districts, conducted through intensiveawareness-raising through Health Clubs (Range isfor each district)
N 100% 25–40% 60–88% ?
Total sanitation
Pattanayaket al. (2009)
Orissa, India 1,050 Cluster-randomized experiment to evaluate acampaign combining “shaming” and subsidies toonly poor hhs in Orissa (Usage imputed fromoverall reported usage as a fraction of uptake)
Y Poor: 85%Nonpoor:0%
29–46% 55–83% N/A
WSP (2005) Rajarghat,Bangladesh
NA Bangladesh government-run. Small program since2001, serving 180 villages
Y 40% 83% 30–70 Someevidence
Bangladesh NA NGO Forum—Bangladesh. Started in 2001 Y 67% ? 30–70 Someevidence
Bangladesh NA Plan Bangladesh. Started in 2002 Y 83% ? 30–70 No evidenceAhmednagar,
IndiaNA Government of India pilot TSC. Started in 2003 Y 80% 22% >70% No evidence
AndhraPradesh India
NA Government of India TSC. Started in 2003 N 100% 15% <30% Someevidence
Gramalaya,India
NA NGO/gov hybrid TSC. Started in 2003 Y 96% ? >70% No evidence
West Bengal,India
NA Government of India TSC. Started in 1999 Y 84% 29% >70% No evidence
Cairncross et al.
(2005)Kerala, India 345 Hygiene promotion + sanitation investment
evaluation conducted over 9 years. (Ranges arefor different genders and ages)
Y 75% 26–62% 48–100% No evidence
Hoque et al.
(1996)Bangladesh 1,068 5-yr follow-up evaluation of WASH promotion
projectN 100% Nearly 100% 77% 6%
Tremolet,Kolsky, andPerez (2010)
6 countries NA 6-country analysis of attributable increase incoverage with sanitation facilities (ExcludingBangladesh, uptake is 15–38%)
Y Varying (12–82%)
15–70% 70–82% No evidence
Line missing
6W
OR
LD
DE
VE
LO
PM
EN
T
Please
citeth
isarticle
inp
ressas:
Wh
ittingto
n,
D.
eta
l.S
etting
Prio
rities,T
argeting
Su
bsid
iesam
on
gW
ater,S
anitatio
n,
and
Preven
tiveH
ealthIn
terventio
ns
inD
evelop
ing
Co
un
tries,W
orld
Develo
pm
ent
(2012),http
://dx.doi.o
rg/10.1016/j.w
orld
dev.2012.03.004

Waterkeyn andCairncross(2005)
Zimbabwe 13,555� Integrated sanitation and hygiene campaign intwo districts, conducted through intensiveawareness-raising through Health Clubs (Range isfor each district)
Y ? 17–41% 50–95% ?
Chlorination
Quick et al.
(1996)Bolivia 42 9-week study with 3 groups: A) storage vessels &
chlorine, B) storage vessels only, C) control. HHsinterviewed and water sampled every 3 weeks
N 100% 100% 73% ?
Macy and Quick(1998)
Nicaragua 100 Storage vessels, chlorine, and educationalprogram provided; Baseline surveys recordedwater sources, storage & disinfection practicesprior to intervention. Follow-up surveys wereconducted 3 months after intervention
N 100% 100% 55% ?
Semenza,Roberts,Henderson,Bogan, andRubin (1998)
Uzbekistan 240 62 study HHs were provided with storage vesselsand trained to chlorinate the water. Other groupswere a) connected to the municipal systems, andb) control. Also found low willingness to pay for abottle of chlorine (mean US$0.30)
N 100% 100% ? ?
Mong et al.
(2001)Madagascar 123 HHs that were affected by a cyclone. Thousands
of storage vessels and chlorine were distributed toaffected villages after the cyclone; survey wasconducted to monitor the effectiveness of thedistributed aid products
N 100% 85% 65% ?
Reller et al.
(2003)Guatemala 492 Study with five groups: (1) flocculent-disinfectant,
(2) flocculent-disinfectant & vessel, (3) bleach, (4)bleach & vessel, and (5) control. Attrition over 50weeks period was high (about 15%). Diarrhea ratewas monitored weekly
N 100% 100% 35–43% ?
Sobsey,Handzel, andVenczel (2003)
Bolivia &Bangladesh
140 (Bolivia);275(Bangladesh)
Intervention with storage vessels + chlorine.Study period in Bangladesh was 8 months and 6months for Bolivia. Study accounted for low-levelchlorination of drinking water at system levelusing control group
N 100% 100% 74% ?
Olembo et al.
(2004)Zambia 1,319 Cross-sectional surveys of areas with social
marketing of chlorination products. Door-to-doorpromotion, and TV and radio ads did not increaseusage
Y Varying 64% 13% 6%
Arnold andColford (2007)
N/A N/A Meta analysis of 22 studies from 20 differentstudies in 13 countries. Found that mostintervention studies were over a short period oftime (average of 30 weeks) and there was anattenuation of diarrhea protection in childrenunder 5 for longer studies
N/A N/A ? 36–100% Someevidence
Ashraf et al.
(2010)Zambia 1,260 Study of the effect of user fees and random
discounts on uptake and usage of Chlorin liquidbleach, over 6 week period
Y Varying 45–80% 40–60% ?
(continued on next page)
Line missing
SE
TT
ING
PR
IOR
ITIE
S,
TA
RG
ET
ING
SU
BS
IDIE
SA
MO
NG
WA
TE
R,
SA
NIT
AT
ION
,A
ND
PR
EV
EN
TIV
EH
EA
LT
HIN
TE
RV
EN
TIO
NS
IND
EV
EL
OP
ING
CO
UN
TR
IES
7
Please
citeth
isarticle
inp
ressas:
Wh
ittingto
n,
D.
eta
l.S
etting
Prio
rities,T
argeting
Su
bsid
iesam
on
gW
ater,S
anitatio
n,
and
Preven
tiveH
ealthIn
terventio
ns
inD
evelop
ing
Co
un
tries,W
orld
Develo
pm
ent
(2012),http
://dx.doi.o
rg/10.1016/j.w
orld
dev.2012.03.004
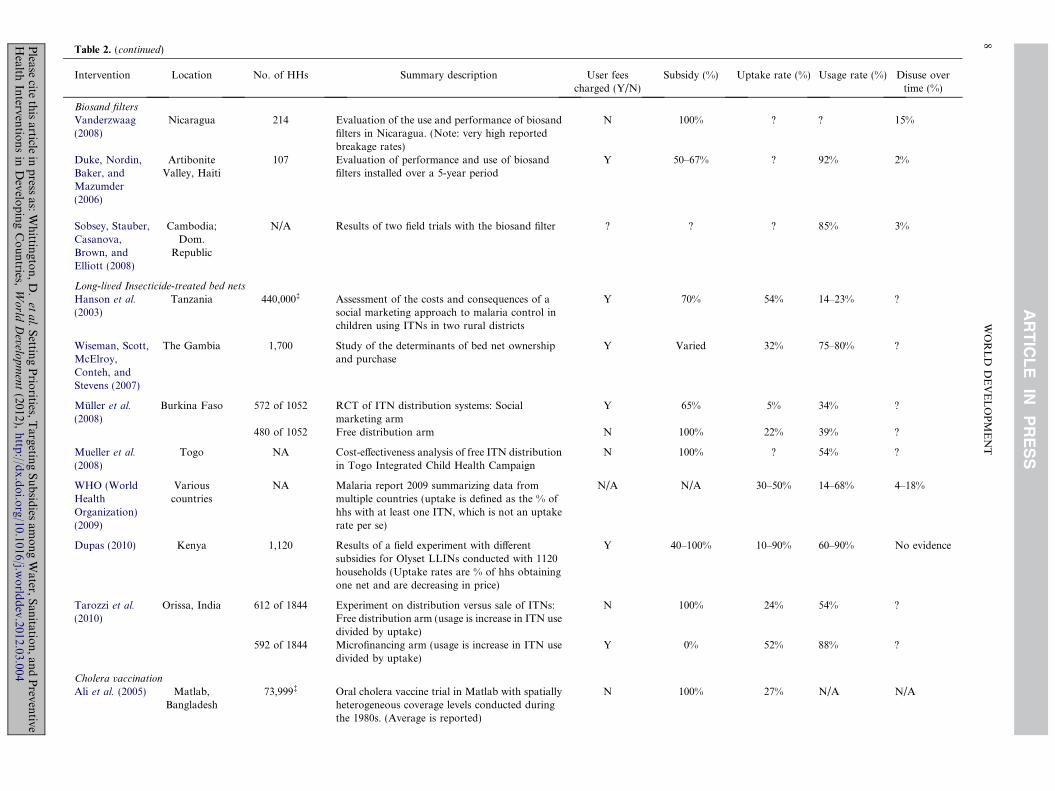
Table 2. (continued)
Intervention Location No. of HHs Summary description User feescharged (Y/N)
Subsidy (%) Uptake rate (%) Usage rate (%) Disuse overtime (%)
Biosand filters
Vanderzwaag(2008)
Nicaragua 214 Evaluation of the use and performance of biosandfilters in Nicaragua. (Note: very high reportedbreakage rates)
N 100% ? ? 15%
Duke, Nordin,Baker, andMazumder(2006)
ArtiboniteValley, Haiti
107 Evaluation of performance and use of biosandfilters installed over a 5-year period
Y 50–67% ? 92% 2%
Sobsey, Stauber,Casanova,Brown, andElliott (2008)
Cambodia;Dom.
Republic
N/A Results of two field trials with the biosand filter ? ? ? 85% 3%
Long-lived Insecticide-treated bed nets
Hanson et al.
(2003)Tanzania 440,000� Assessment of the costs and consequences of a
social marketing approach to malaria control inchildren using ITNs in two rural districts
Y 70% 54% 14–23% ?
Wiseman, Scott,McElroy,Conteh, andStevens (2007)
The Gambia 1,700 Study of the determinants of bed net ownershipand purchase
Y Varied 32% 75–80% ?
Muller et al.
(2008)Burkina Faso 572 of 1052 RCT of ITN distribution systems: Social
marketing armY 65% 5% 34% ?
480 of 1052 Free distribution arm N 100% 22% 39% ?
Mueller et al.
(2008)Togo NA Cost-effectiveness analysis of free ITN distribution
in Togo Integrated Child Health CampaignN 100% ? 54% ?
WHO (WorldHealthOrganization)(2009)
Variouscountries
NA Malaria report 2009 summarizing data frommultiple countries (uptake is defined as the % ofhhs with at least one ITN, which is not an uptakerate per se)
N/A N/A 30–50% 14–68% 4–18%
Dupas (2010) Kenya 1,120 Results of a field experiment with differentsubsidies for Olyset LLINs conducted with 1120households (Uptake rates are % of hhs obtainingone net and are decreasing in price)
Y 40–100% 10–90% 60–90% No evidence
Tarozzi et al.
(2010)Orissa, India 612 of 1844 Experiment on distribution versus sale of ITNs:
Free distribution arm (usage is increase in ITN usedivided by uptake)
N 100% 24% 54% ?
592 of 1844 Microfinancing arm (usage is increase in ITN usedivided by uptake)
Y 0% 52% 88% ?
Cholera vaccination
Ali et al. (2005) Matlab,Bangladesh
73,999� Oral cholera vaccine trial in Matlab with spatiallyheterogeneous coverage levels conducted duringthe 1980s. (Average is reported)
N 100% 27% N/A N/A
Line missing
8W
OR
LD
DE
VE
LO
PM
EN
T
Please
citeth
isarticle
inp
ressas:
Wh
ittingto
n,
D.
eta
l.S
etting
Prio
rities,T
argeting
Su
bsid
iesam
on
gW
ater,S
anitatio
n,
and
Preven
tiveH
ealthIn
terventio
ns
inD
evelop
ing
Co
un
tries,W
orld
Develo
pm
ent
(2012),http
://dx.doi.o
rg/10.1016/j.w
orld
dev.2012.03.004

Jeu
lan
d,
Lu
cas,
Cle
men
s,&
Wh
itti
ngt
on
2010
)
Bei
ra,
Mo
zam
biq
ue
11,1
75�
Ch
ole
rava
ccin
eev
alu
atio
nam
on
gta
rget
edp
op
ula
tio
nin
on
eu
rban
dis
tric
t(T
arge
tzo
ne
cove
rage
on
lyis
rep
ort
ed)
N10
0%51
%N
/AN
/A
Th
iem
eta
l.
(200
3)H
ue
Cit
y,V
ietn
am11
8,55
5�A
nal
ysis
of
mas
sim
mu
niz
atio
np
rogr
amag
ain
stch
ole
raN
100%
79%
N/A
N/A
No
tes:
(1)
Fo
rch
lori
nat
ion
,u
sage
mea
sure
db
ych
lori
nat
ion
resi
du
al.
(2)
Mo
stin
terv
enti
on
eval
uat
ion
stu
die
sar
ecr
oss
-sec
tio
nal
and
con
du
cted
sho
rtly
afte
rth
ep
rogr
amis
adm
inis
tere
d.
(3)
Few
stu
die
sm
easu
relo
ng-
term
usa
gera
tes,
sod
isu
seo
ver
tim
em
ayb
eu
nre
liab
le.
(4)
Th
esc
ale
of
pro
gram
sd
escr
ibed
her
eis
hig
hly
vari
able
,ra
ngi
ng
fro
mve
rysm
all
tola
rge.
(5)
Nu
mb
ero
fh
ou
seh
old
sis
for
the
eval
uat
ion
sam
ple
un
less
mar
ked
by
the
sym
bo
l�,
inw
hic
hca
seit
isth
ep
op
ula
tio
nco
vere
db
yth
ein
terv
enti
on
.
SETTING PRIORITIES, TARGETING SUBSIDIES AMONG WATER, SANITATION, AND PREVENTIVE HEALTH INTERVENTIONS INDEVELOPING COUNTRIES 9
Please cite this article in press as: Whittington, D. et al. Setting PrioritHealth Interventions in Developing Countries, World Development (2
interventions, because parameter values for local conditionsare both unknown and nonstationary. These assumptionsabout the parameter values and the model structure create arisk that the results of both CE and BC calculations will bemisinterpreted. This risk is especially dangerous with regardto assumptions about uptake and usage of the interventions,because it is difficult to generalize about individuals’ prefer-ence tradeoffs across time and space. To better characterizethe uncertainty in our economic results, we conducted MonteCarlo simulations of the net benefits for the six interventionsin nine hypothetical situations characterized by combinationsof low, moderate, and high uptake and usage. These nine caseswere constructed on the basis of an extensive literature searchfor information about behavioral responses to each of the sixinterventions (see Table 2 for a summary of the studies con-taining such information, and Table 3 for the ranges of valuesused in this study). The moderate case is for the median ofeach of the ranges in Table 3; low and high cases use the lowerand upper bounds, respectively. For simplicity, the low usagecase combines low usage and high rate of disuse; the oppositeis true for the high usage case.
These ranges should be interpreted carefully. We believethat it is quite plausible that usage rates found in the literatureare overestimates, because many impact assessments are car-ried out shortly after interventions occur. Also, somewhat sur-prisingly, many program evaluation studies do not trackuptake and usage. Those that do often rely on proxy measures(for example, recording whether there is soap in a household,rather than direct observation of how often it is used). Uptakeand usage rates will be influenced by the balance of disameni-ties and esthetic benefits of the interventions as perceived byhouseholds, as well as the delivery mechanism, especiallywhether users are charged the full cost of the intervention,are offered some reduced subsidy price, or receive the productfree of charge (Ashraf et al., 2010).
With respect to the delivery mechanism and pricing policy,some of the low, moderate, and high cases for each interven-tion in our Monte Carlo simulations may be unrealistic if up-take and usage are interdependent. For example, some arguefor user fees for piped network services interventions in orderto reduce the risk of providing costly services to householdsthat may not value them highly. One would expect that userfees would reduce initial uptake, but these might also yieldhigher initial and long-term usage rates among those who haveinvested in the interventions. On the other hand, free distribu-tion of, for example, soap for handwashing to all householdsin a community might result in high levels of uptake but lowlevels of usage if some households see little value in the inter-vention. However, the evidence for higher usage rates amongpurchasers is mixed (Table 2); see in particular Tarozzi et al.(2010) and Dupas (2010), emphasizing our point about thehigh degree of uncertainty in such calculations.
The Monte Carlo simulations treat all other BC modelparameters—there are 15–21 of them in this model, dependingon the intervention—as uncertain. Three types of assumptionswere made for each uncertain parameter. First, a range ofplausible values for “typical” programs was specified on thebasis of our reading of the literature and our professionaljudgment. 7 Second, the uncertain parameter values were as-sumed to be uniformly distributed over those ranges. Third,likely correlations between parameters in the model were spec-ified. A similar approach could be applied to the uptake andusage parameters, but as described above we treated uptakeand usage differently because we were particularly interestedin isolating the effect these behavioral parameters have onthe benefit–cost results.
ies, Targeting Subsidies among Water, Sanitation, and Preventive012), http://dx.doi.org/10.1016/j.worlddev.2012.03.004
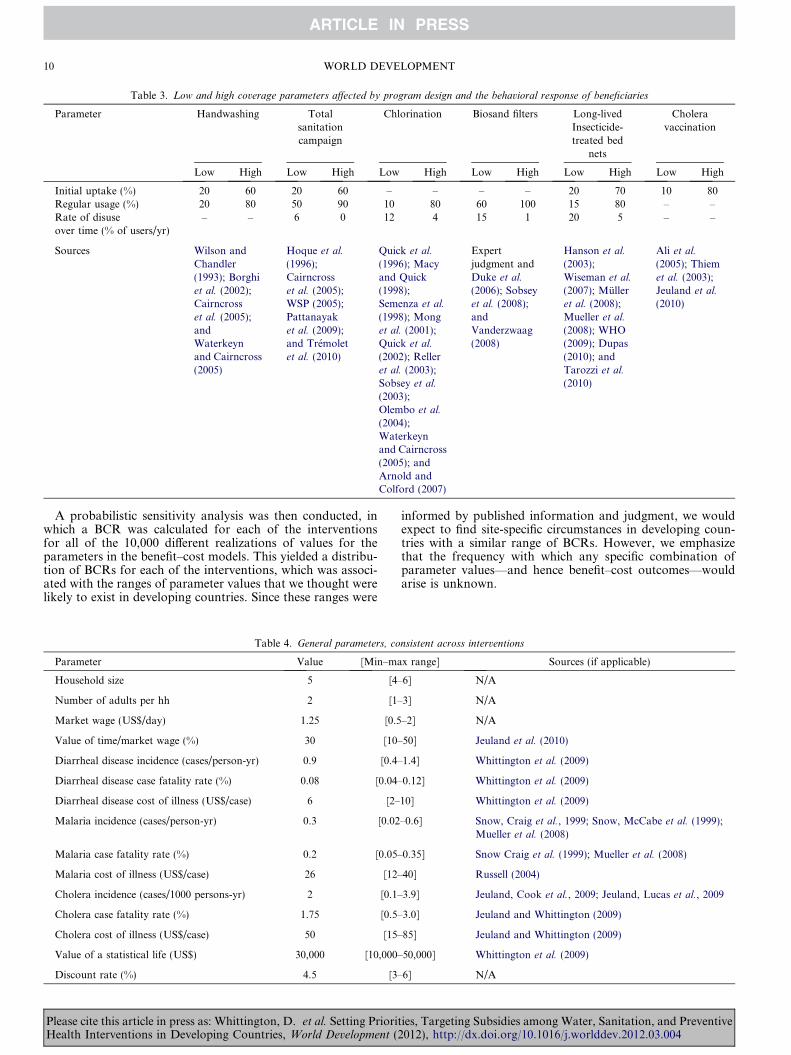
Table 3. Low and high coverage parameters affected by program design and the behavioral response of beneficiaries
Parameter Handwashing Totalsanitationcampaign
Chlorination Biosand filters Long-livedInsecticide-treated bed
nets
Choleravaccination
Low High Low High Low High Low High Low High Low High
Initial uptake (%) 20 60 20 60 – – – – 20 70 10 80Regular usage (%) 20 80 50 90 10 80 60 100 15 80 – –Rate of disuseover time (% of users/yr)
– – 6 0 12 4 15 1 20 5 – –
Sources Wilson andChandler(1993); Borghiet al. (2002);Cairncrosset al. (2005);andWaterkeynand Cairncross(2005)
Hoque et al.
(1996);Cairncrosset al. (2005);WSP (2005);Pattanayaket al. (2009);and Tremoletet al. (2010)
Quick et al.
(1996); Macyand Quick(1998);Semenza et al.
(1998); Monget al. (2001);Quick et al.
(2002); Relleret al. (2003);Sobsey et al.
(2003);Olembo et al.
(2004);Waterkeynand Cairncross(2005); andArnold andColford (2007)
Expertjudgment andDuke et al.
(2006); Sobseyet al. (2008);andVanderzwaag(2008)
Hanson et al.
(2003);Wiseman et al.
(2007); Mulleret al. (2008);Mueller et al.
(2008); WHO(2009); Dupas(2010); andTarozzi et al.
(2010)
Ali et al.
(2005); Thiemet al. (2003);Jeuland et al.
(2010)
10 WORLD DEVELOPMENT
A probabilistic sensitivity analysis was then conducted, inwhich a BCR was calculated for each of the interventionsfor all of the 10,000 different realizations of values for theparameters in the benefit–cost models. This yielded a distribu-tion of BCRs for each of the interventions, which was associ-ated with the ranges of parameter values that we thought werelikely to exist in developing countries. Since these ranges were
Table 4. General parameters, co
Parameter Value [Min–ma
Household size 5 [4–
Number of adults per hh 2 [1–
Market wage (US$/day) 1.25 [0.5
Value of time/market wage (%) 30 [10–
Diarrheal disease incidence (cases/person-yr) 0.9 [0.4–
Diarrheal disease case fatality rate (%) 0.08 [0.04–
Diarrheal disease cost of illness (US$/case) 6 [2–
Malaria incidence (cases/person-yr) 0.3 [0.02
Malaria case fatality rate (%) 0.2 [0.05–
Malaria cost of illness (US$/case) 26 [12–
Cholera incidence (cases/1000 persons-yr) 2 [0.1–
Cholera case fatality rate (%) 1.75 [0.5–
Cholera cost of illness (US$/case) 50 [15–
Value of a statistical life (US$) 30,000 [10,000–
Discount rate (%) 4.5 [3–
Please cite this article in press as: Whittington, D. et al. Setting PrioritHealth Interventions in Developing Countries, World Development (2
informed by published information and judgment, we wouldexpect to find site-specific circumstances in developing coun-tries with a similar range of BCRs. However, we emphasizethat the frequency with which any specific combination ofparameter values—and hence benefit–cost outcomes—wouldarise is unknown.
nsistent across interventions
x range] Sources (if applicable)
6] N/A
3] N/A
–2] N/A
50] Jeuland et al. (2010)
1.4] Whittington et al. (2009)
0.12] Whittington et al. (2009)
10] Whittington et al. (2009)
–0.6] Snow, Craig et al., 1999; Snow, McCabe et al. (1999);Mueller et al. (2008)
0.35] Snow Craig et al. (1999); Mueller et al. (2008)
40] Russell (2004)
3.9] Jeuland, Cook et al., 2009; Jeuland, Lucas et al., 2009
3.0] Jeuland and Whittington (2009)
85] Jeuland and Whittington (2009)
50,000] Whittington et al. (2009)
6] N/A
ies, Targeting Subsidies among Water, Sanitation, and Preventive012), http://dx.doi.org/10.1016/j.worlddev.2012.03.004
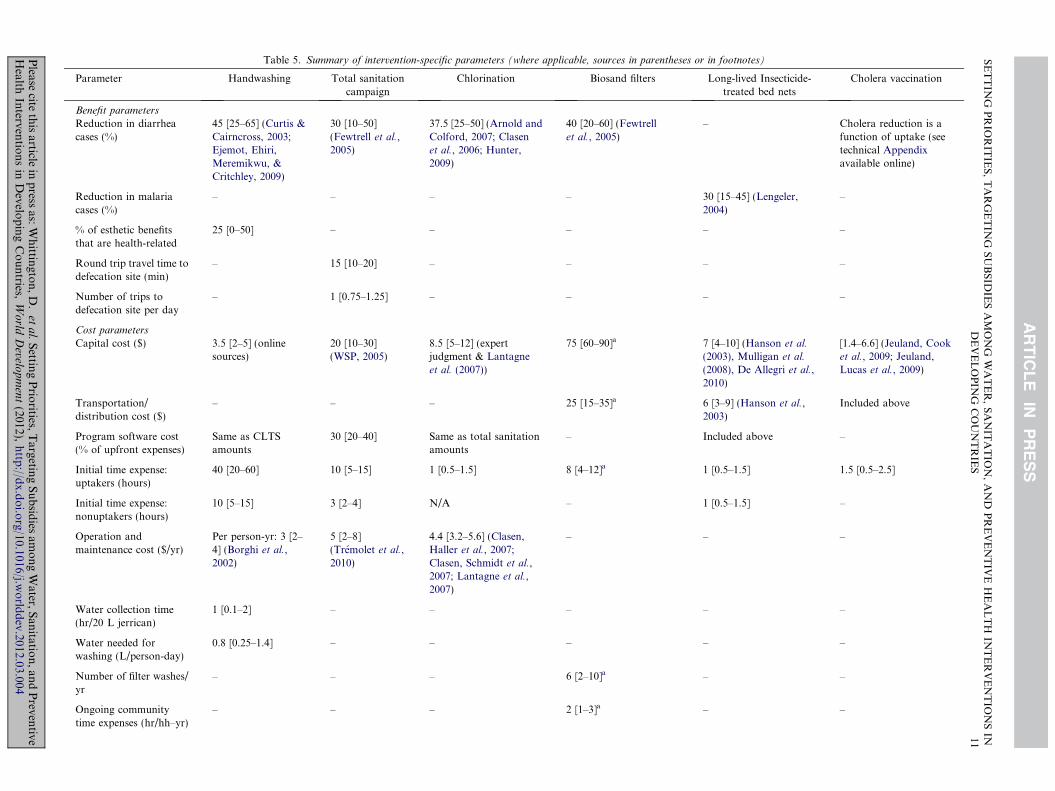
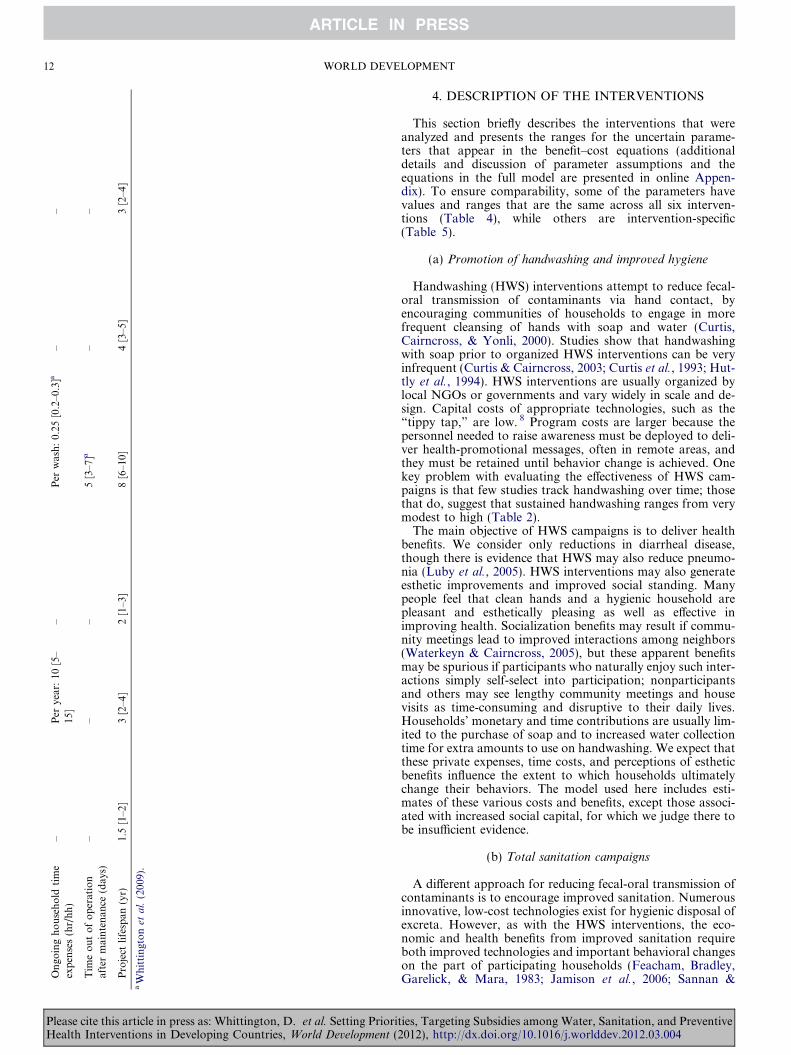
Table 5. Summary of intervention-specific parameters (where applicable, sources in parentheses or in footnotes)
Parameter Handwashing Total sanitationcampaign
Chlorination Biosand filters Long-lived Insecticide-treated bed nets
Cholera vaccination
Benefit parameters
Reduction in diarrheacases (%)
45 [25–65] (Curtis &Cairncross, 2003;Ejemot, Ehiri,Meremikwu, &Critchley, 2009)
30 [10–50](Fewtrell et al.,2005)
37.5 [25–50] (Arnold andColford, 2007; Clasenet al., 2006; Hunter,2009)
40 [20–60] (Fewtrellet al., 2005)
– Cholera reduction is afunction of uptake (seetechnical Appendixavailable online)
Reduction in malariacases (%)
– – – – 30 [15–45] (Lengeler,2004)
–
% of esthetic benefitsthat are health-related
25 [0–50] – – – – –
Round trip travel time todefecation site (min)
– 15 [10–20] – – – –
Number of trips todefecation site per day
– 1 [0.75–1.25] – – – –
Cost parameters
Capital cost ($) 3.5 [2–5] (onlinesources)
20 [10–30](WSP, 2005)
8.5 [5–12] (expertjudgment & Lantagneet al. (2007))
75 [60–90]a 7 [4–10] (Hanson et al.
(2003), Mulligan et al.
(2008), De Allegri et al.,2010)
[1.4–6.6] (Jeuland, Cooket al., 2009; Jeuland,Lucas et al., 2009)
Transportation/distribution cost ($)
– – – 25 [15–35]a 6 [3–9] (Hanson et al.,2003)
Included above
Program software cost(% of upfront expenses)
Same as CLTSamounts
30 [20–40] Same as total sanitationamounts
– Included above –
Initial time expense:uptakers (hours)
40 [20–60] 10 [5–15] 1 [0.5–1.5] 8 [4–12]a 1 [0.5–1.5] 1.5 [0.5–2.5]
Initial time expense:nonuptakers (hours)
10 [5–15] 3 [2–4] N/A – 1 [0.5–1.5] –
Operation andmaintenance cost ($/yr)
Per person-yr: 3 [2–4] (Borghi et al.,2002)
5 [2–8](Tremolet et al.,2010)
4.4 [3.2–5.6] (Clasen,Haller et al., 2007;Clasen, Schmidt et al.,2007; Lantagne et al.,2007)
– – –
Water collection time(hr/20 L jerrican)
1 [0.1–2] – – – – –
Water needed forwashing (L/person-day)
0.8 [0.25–1.4] – – – – –
Number of filter washes/yr
– – – 6 [2–10]a – –
Ongoing communitytime expenses (hr/hh–yr)
– – – 2 [1–3]a – –
Line missing
SE
TT
ING
PR
IOR
ITIE
S,
TA
RG
ET
ING
SU
BS
IDIE
SA
MO
NG
WA
TE
R,
SA
NIT
AT
ION
,A
ND
PR
EV
EN
TIV
EH
EA
LT
HIN
TE
RV
EN
TIO
NS
IND
EV
EL
OP
ING
CO
UN
TR
IES
11
Please
citeth
isarticle
inp
ressas:
Wh
ittingto
n,
D.
eta
l.S
etting
Prio
rities,T
argeting
Su
bsid
iesam
on
gW
ater,S
anitatio
n,
and
Preven
tiveH
ealthIn
terventio
ns
inD
evelop
ing
Co
un
tries,W
orld
Develo
pm
ent
(2012),http
://dx.doi.o
rg/10.1016/j.w
orld
dev.2012.03.004
On
goin
gh
ou
seh
old
tim
eex
pen
ses
(hr/
hh
)–
Per
year
:10
[5–
15]
–P
erw
ash
:0.
25[0
.2–0
.3]a
––
Tim
eo
ut
of
op
erat
ion
afte
rm
ain
ten
ance
(day
s)–
––
5[3
–7]a
––
Pro
ject
life
span
(yr)
1.5
[1–2
]3
[2–4
]2
[1–3
]8
[6–1
0]4
[3–5
]3
[2–4
]a
Wh
itti
ngt
on
eta
l.(2
009)
.
12 WORLD DEVELOPMENT
Please cite this article in press as: Whittington, D. et al. Setting PrioritHealth Interventions in Developing Countries, World Development (2
4. DESCRIPTION OF THE INTERVENTIONS
This section briefly describes the interventions that wereanalyzed and presents the ranges for the uncertain parame-ters that appear in the benefit–cost equations (additionaldetails and discussion of parameter assumptions and theequations in the full model are presented in online Appen-dix). To ensure comparability, some of the parameters havevalues and ranges that are the same across all six interven-tions (Table 4), while others are intervention-specific(Table 5).
(a) Promotion of handwashing and improved hygiene
Handwashing (HWS) interventions attempt to reduce fecal-oral transmission of contaminants via hand contact, byencouraging communities of households to engage in morefrequent cleansing of hands with soap and water (Curtis,Cairncross, & Yonli, 2000). Studies show that handwashingwith soap prior to organized HWS interventions can be veryinfrequent (Curtis & Cairncross, 2003; Curtis et al., 1993; Hut-tly et al., 1994). HWS interventions are usually organized bylocal NGOs or governments and vary widely in scale and de-sign. Capital costs of appropriate technologies, such as the“tippy tap,” are low. 8 Program costs are larger because thepersonnel needed to raise awareness must be deployed to deli-ver health-promotional messages, often in remote areas, andthey must be retained until behavior change is achieved. Onekey problem with evaluating the effectiveness of HWS cam-paigns is that few studies track handwashing over time; thosethat do, suggest that sustained handwashing ranges from verymodest to high (Table 2).
The main objective of HWS campaigns is to deliver healthbenefits. We consider only reductions in diarrheal disease,though there is evidence that HWS may also reduce pneumo-nia (Luby et al., 2005). HWS interventions may also generateesthetic improvements and improved social standing. Manypeople feel that clean hands and a hygienic household arepleasant and esthetically pleasing as well as effective inimproving health. Socialization benefits may result if commu-nity meetings lead to improved interactions among neighbors(Waterkeyn & Cairncross, 2005), but these apparent benefitsmay be spurious if participants who naturally enjoy such inter-actions simply self-select into participation; nonparticipantsand others may see lengthy community meetings and housevisits as time-consuming and disruptive to their daily lives.Households’ monetary and time contributions are usually lim-ited to the purchase of soap and to increased water collectiontime for extra amounts to use on handwashing. We expect thatthese private expenses, time costs, and perceptions of estheticbenefits influence the extent to which households ultimatelychange their behaviors. The model used here includes esti-mates of these various costs and benefits, except those associ-ated with increased social capital, for which we judge there tobe insufficient evidence.
(b) Total sanitation campaigns
A different approach for reducing fecal-oral transmission ofcontaminants is to encourage improved sanitation. Numerousinnovative, low-cost technologies exist for hygienic disposal ofexcreta. However, as with the HWS interventions, the eco-nomic and health benefits from improved sanitation requireboth improved technologies and important behavioral changeson the part of participating households (Feacham, Bradley,Garelick, & Mara, 1983; Jamison et al., 2006; Sannan &
ies, Targeting Subsidies among Water, Sanitation, and Preventive012), http://dx.doi.org/10.1016/j.worlddev.2012.03.004

SETTING PRIORITIES, TARGETING SUBSIDIES AMONG WATER, SANITATION, AND PREVENTIVE HEALTH INTERVENTIONS INDEVELOPING COUNTRIES 13
Moulik, 2007; WSP (Water & Sanitation Program), 2005). 9 Alow-cost Community-Led Total Sanitation (CLTS) approachhas recently been popularized in South Asia, and is now a cen-tral element in government water and sanitation programmesin India and Bangladesh (WSP, 2005). It focuses on mobilizingcommunities to achieve total sanitation, or open-defecation-free environments, through intensive promotion campaignsaiming at behavior-change galvanized by the application of so-cial pressure and walks of shame. Efforts to take this approachfrom the pilot stage to scale have met with varied success: re-ported uptake and long-term usage varies considerably acrossintervention sites (Table 2).
As with the program implementation model for large-scalehygiene and handwashing campaigns, sanitation programsare typically designed by NGOs in collaboration with com-munities and local governments and require considerableprogram infrastructure to be successful. Capital costs varydepending on which toilet technologies are chosen by house-holds. The most basic improved latrine technologies are rel-atively inexpensive, and program rules initially emphasizedthe need to avoid the use of subsidies; but protocols haveevolved, and households no longer always pay the full cap-ital costs. The awards or incentives provided to communitiesthat achieve open-defecation-free status must also be in-cluded in the costs. Private costs include time spent in com-munity meetings and also maintenance costs (time, water,cleaning agents, purchase of proper footwear). Project ben-efits include improvements in health, convenience, and timesavings, and the privacy and dignity that come with propertoilet usage. The BC model used here does not account foreither the privacy and dignity benefits associated with latrineuse, or the disamenities associated with having space-con-suming or malodorous latrines within the dwelling or yard.The model also does not include benefits from innovativedesigns that allow the productive reuse of urine or fecalmaterial, such as humanure or ecofert toilets being testedin Zimbabwe. 10
(c) Biosand filters
A third approach for breaking the fecal-oral transmissionpathway is to improve the quality of drinking water at thepoint of use (POU). Water may become contaminated duringtransport from the drinking water source or from a water in-take treatment plant to the home, or while stored in the house.Biosand filters are one simple technology that households canuse to remove pathogens from their drinking and cookingwater. They have important advantages over other POU tech-nologies, such as boiling, chlorination (see next intervention),solar disinfection, other types of filters, or single-use chemicalpackets. For example, biosand filters are built from materialsthat are commonly available locally (PVC pipe, sand, graveland a concrete or plastic chamber). They are also convenient,durable, and simple to use; household members simply pourwater into the top of the filter and allow water to pass throughthe sand. Water can then be safely consumed almost immedi-ately, and the health improvements are large (Clasen & Basta-ble, 2003; Clasen, Roberts, Rabie, Schmidt, & Cairncross,2006; Fewtrell et al., 2005). Vanderzwaag (2008) reports highbreakage rates for filters in Nicaragua, but this does not ap-pear to be a common problem.
The full costs of biosand filters are fairly high, especiallywhen they must be transported (they are bulky and heavy).Program software costs for dissemination are limited to shorttraining activities explaining the need to maintain the filtersand the process for doing so). In programs implemented to
Please cite this article in press as: Whittington, D. et al. Setting PrioritHealth Interventions in Developing Countries, World Development (2
date, households have paid very little to receive the filters.Thus uptake rates appear to be very high in intervention com-munities, though these are rarely reported (Table 2). The filtersdo require cleaning every few months and are less effective atpathogen removal for three to five days after cleaning. The BCmodel used here includes all of the filter costs and benefits, ex-cept the disamenities that arise from the space required by thebiosand filter within the home, which can be significant, espe-cially in densely populated slums.
(d) Point-of use chlorination of drinking water
Chlorination at the point of use may also help reduce theburden of waterborne diseases. Chlorination is highly effec-tive for killing most bacteria and viruses and provides resid-ual protection during storage if the dosage is correct. It iswidely available and very cheap (Lantagne, Quick, & Mintz,2007). There are also significant disadvantages associatedwith chlorination. For example, it is ineffective against somewaterborne protozoa and viruses (including for examplecryptosporidium); it is ineffective for treating turbid water;it requires careful monitoring of dosage and storage times;and many people complain that it causes taste and odorproblems. Perhaps because of these factors, household chlo-rination rates have been found to decrease significantly overtime following promotion campaigns (Lantagne et al., 2007;Olembo, Kaona, Tuba, & Burnham, 2004). One approachfor addressing this problem when people collect water fromsources away from home might be to provide easy-to-usechlorine dispensers at the water source rather than expectingpeople to chlorinate their drinking water at home (Kremeret al., 2008). But chlorination at the source would requirethe establishment of new institutional roles and responsibil-ities, and the delivery of such services in remote rural areasis likely to be complicated.
Our analysis is based on parameter values from the SafeWater System (SWS) programs conducted over the last20 years by the Pan American Health Organization andthe US Center for Disease Control (Lantagne et al., 2007).The only capital costs in the SWS are for purchase of a safecontainer such as a 20-liter jerry can with a screw cap. Mostprograms depend on local NGOs for promotion, training,and marketing of products and therefore involve significantprogram costs, including training (on dosage) and generalhygiene education. Operation and maintenance costs arefor purchase and delivery of chlorine supplies. Many POUchlorination programs provide supplies to households freeof charge, and social marketing of products is common. Ini-tial uptake of subsidized products is typically high, but sus-tained usage varies widely (measured by the presence of achlorine residual) (Table 2). The BC model does not includethe esthetic disamenities resulting from taste and odor prob-lems, but these may account for the wide variation reportedin usage.
(e) Insecticide-treated bed nets
Numerous CE studies find that insecticide-treated nets(ITNs) are cost effective for the prevention of malaria (Hansonet al., 2003; Lengeler, 2004; Mueller et al., 2008). Differenttypes of nets exist, one of which is the long-lasting insecti-cide-treated net (LLIN). LLINs have two main advantages:they are durable; and unlike normal ITNs, they do not requirereimpregnation with insecticide every six months, a mainte-nance need that has proven problematic in other ITN inter-ventions (Snow, Craig, Deichmann, & Marsh, 1999; Snow,
ies, Targeting Subsidies among Water, Sanitation, and Preventive012), http://dx.doi.org/10.1016/j.worlddev.2012.03.004

14 WORLD DEVELOPMENT
McCabe et al., 1999). There are various mechanisms forencouraging uptake and use of bed nets, ranging from free dis-tribution to social marketing strategies, and these appear tohave a substantial influence on rates of uptake (De Allegriet al., 2010; Dupas, 2010; Mulligan, Yukich, & Hanson,2008). There is much less information, however, on how differ-ent distribution methods influence long-term usage (Table 2).The dissemination of LLINs requires up-front expendituresfor impregnated bed nets and for delivery and program admin-istration. Users must accept the potential discomfort associ-ated with sleeping under nets, which restrict movement andmay restrict air flow; our BC model does not account for suchdisamenities. There are no operation and maintenance costs,and negligible training costs, associated with LLINs.
(f) Cholera vaccination
One strategy for preventing cholera cases is immunizationwith new-generation vaccines. These oral vaccines are cheap,are now being produced in Vietnam and India, and have beenshown to be effective in field trials (Thiem et al., 2006; Trachet al., 1997). Cholera vaccination also provides herd protectionto nonvaccinated individuals. As vaccine coverage rises amongthe target population, herd protection increases but at adecreasing rate (Ali et al., 2005). Herd protection and lower lo-cal production costs greatly improve the cost-effectiveness ofcholera vaccination programs (Jeuland, Cook, Poulos, Clem-ens, & Whittington, 2009; Jeuland, Lucas, Clemens, & Whit-tington, 2009). However, delivery costs and nonpecuniaryprivate time costs of vaccine acquisition are important, espe-cially because vaccine protection is thought to last only two tothree years. User fees are rare for vaccinations, but uptake ratesstill vary a great deal depending on the design of the vaccinationprogram (Table 2). One major advantage of vaccination, similarto the LLINs, is that no ongoing operation and maintenancecosts are involved. In addition, household members do notexperience any disamenities following immunization, thoughthey may not like the vaccination experience itself.
5. RESULTS
This section presents the results of the benefit–cost analysesof the six interventions and the associated sensitivity analyses.We begin with a discussion of the magnitude of the differentcomponents of costs and benefits for each of the interventions,assuming that all parameters, including uptake and usage,take the midpoint values of the assumed ranges presented inTables 3–5. We then present the range of outcomes from theMonte Carlo analysis for the different cases of usage and up-take. We close with additional sensitivity analyses concerningthose behavioral assumptions.
(a) The components of the net benefits of the six interventions
At the median parameter values most of the economic ben-efits of these six interventions are due to improved health out-comes (Figure 1). Furthermore, the majority of these healthbenefits are due to reductions in mortality, not in morbidity.Because disease incidence factors into calculation of both mor-tality and morbidity, the morbidity burden reductions becomerelatively more important only if the VSL and disease casefatality rates are low, or if the COI is high. Total sanitationis the only intervention of the six that appears to deliver signif-icant time savings, but the economic value of these is relativelysmall in comparison with that intervention’s total health ben-efits. At the median parameter values, all interventions deliver
Please cite this article in press as: Whittington, D. et al. Setting PrioritHealth Interventions in Developing Countries, World Development (2
positive net benefits. This result is consistent with the usualfinding from the CEA and BCA literature that WASH inter-ventions are economically attractive.
However, at the median parameter values the magnitude ofthe net benefits to a household from all of the six interventionsis relatively modest. In absolute terms, the biosand filter andPOU chlorination interventions offer the largest benefits to ahousehold’s well-being. These interventions would increase ahousehold with a real income of US$1 per capita by about2%, if the interventions were given to them free of charge.The handwashing and total sanitation interventions would in-crease such a household’s real income by perhaps 1%, andcholera vaccination and impregnated bed nets by perhaps0.5%, again assuming no user fees.
(b) Heterogeneity of benefit–cost ratios
The results of the Monte Carlo simulations tell a morenuanced story. If the behavioral parameters for uptake andusage are at their median values, there are many combinationsof other parameter values that yield a BCR that is less than 1for all six interventions (Figure 2). Depending on the interven-tion, anywhere from 20% to 55% of simulation outcomes havecosts that outweigh benefits. When uptake and usage are bothlow, the proportion of outcomes with BCRs less than 1 in-creases from 40% to 90%. On the other hand, with high uptakeand usage, fewer than 10% of simulations yield BCRs that areless than 1, except for the case of cholera vaccination (this re-sult is explained below). The 90% confidence intervals fromthe simulations for all nine combinations of low and high up-take are presented in Table 6. These results show that there arenearly always plausible situations in developing countries forwhich each of the six interventions would fail a BC test, andthat the magnitude of poor economic outcomes is highestwhen uptake is high and usage is low.
The results of these Monte Carlo simulations also show thatdeveloping a priority ranking of the interventions is muchmore complicated than commonly appreciated. Consider asingle comparison of simulation outcomes, between the POUchlorination and total sanitation interventions. When usageand uptake are low (for both interventions), the majority ofcombinations of parameters lead to better BCRs for the totalsanitation campaigns (that is, most outcomes lie above thedotted diagonal line in Figure 3). 11 When usage is high, themajority of combinations of parameters lead to better BCRsfor POU chlorination. Yet in both cases there are a large num-ber of simulation outcomes for which this ranking is reversed,in part because the factors that influence uptake of improvedlatrines and participation in total sanitation campaigns willgenerally be very different from those that lead to high uptakeand sustained usage of POU chlorination. Our point is not tosay that sanitation is more or less effective at delivering bene-fits than is chlorination, but simply to emphasize that the fac-tors that lead to high sustained usage are not well known, andthat these are likely to be highly contextual. Even for a casethat would appear to favor one intervention (for example,the high-uptake case that appears to favor LLINs over choleravaccines; see Figure 2), there are still parameter combinationsfor which cholera vaccination outperforms the LLINs.
We conclude that even if one could accurately predict up-take and usage (which is itself doubtful and highly dependenton unobserved factors that explain the demand for improvedhealth services), it is impossible to develop a clear ranking ofthese interventions, without knowing the values of the otherparameters in the BC model. These other parameters are lar-gely site-specific and generally unknown.
ies, Targeting Subsidies among Water, Sanitation, and Preventive012), http://dx.doi.org/10.1016/j.worlddev.2012.03.004
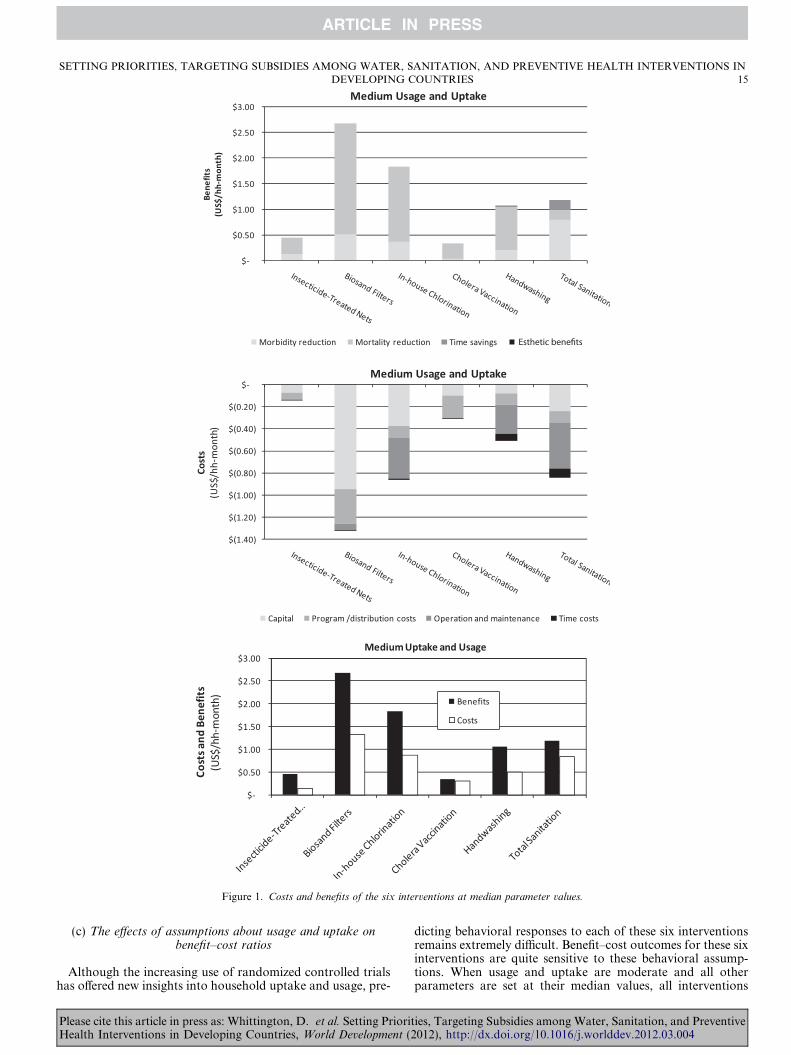
Figure 1. Costs and benefits of the six interventions at median parameter values.
SETTING PRIORITIES, TARGETING SUBSIDIES AMONG WATER, SANITATION, AND PREVENTIVE HEALTH INTERVENTIONS INDEVELOPING COUNTRIES 15
(c) The effects of assumptions about usage and uptake onbenefit–cost ratios
Although the increasing use of randomized controlled trialshas offered new insights into household uptake and usage, pre-
Please cite this article in press as: Whittington, D. et al. Setting PrioritHealth Interventions in Developing Countries, World Development (2
dicting behavioral responses to each of these six interventionsremains extremely difficult. Benefit–cost outcomes for these sixinterventions are quite sensitive to these behavioral assump-tions. When usage and uptake are moderate and all otherparameters are set at their median values, all interventions
ies, Targeting Subsidies among Water, Sanitation, and Preventive012), http://dx.doi.org/10.1016/j.worlddev.2012.03.004

Figure 2. Benefit–cost ratios from simulations for low, moderate and high cases of uptake and usage.
16 WORLD DEVELOPMENT
deliver positive net benefits, though only barely for choleravaccination. If usage and uptake are low, however, only thebiosand filters and cholera vaccination deliver positive netbenefits. If usage and uptake are high and if all other param-eters are at their median values, cholera vaccination fails a BCtest (the other five interventions all pass). When other param-eters deviate from the median values, these outcomes will be
Please cite this article in press as: Whittington, D. et al. Setting PrioritHealth Interventions in Developing Countries, World Development (2
better or worse, depending on the direction of those devia-tions.
For cholera vaccination, higher levels of uptake yield moreoutcomes with benefits less than costs than for lower levels ofuptake. This result runs counter to the conventional wisdomamong public health decision-makers that higher coverage lev-els are more desirable. Because herd protection increases with
ies, Targeting Subsidies among Water, Sanitation, and Preventive012), http://dx.doi.org/10.1016/j.worlddev.2012.03.004

Table 6. 90% Confidence intervals for benefit–cost ratios for the six interventions with different behavioral responses
Usage Uptake
Low Median High No variationin uptake
5–95% 5–95% 5–95% 5–95%
Low
Handwashing �0.2 to 0.9 �0.2 to 2.0 �0.3 to 3.0Total sanitation �0.7 to 1.3 �0.6 to 3.0 �0.6 to 4.8Chlorination �0.9 to 0.8Biosand filters �0.8 to 7.1Long-lived insecticide nets �0.1 to 0.0 �0.2 to 0.1 �0.3 to 0.1
Median
Handwashing �0.1 to 2.5 �0.1 to 5.2 �0.1 to 7.8Total sanitation �0.6 to 2.1 �0.4 to 4.7 �0.4 to 7.3Chlorination �0.2 to 7.2Biosand filters �0.5 to 11.8Long-lived insecticide nets 0.0 to 0.8 �0.1 to 1.8 �0.1 to 2.9
High
Handwashing �0.1 to 4.1 �0.1 to 8.4 0.0 to 12.6Total sanitation �0.5 to 3.0 �0.3 to 6.5 �0.1 to 10.0Chlorination 0.3 to 14.0Biosand filters 0.0 to 18.7Long-lived insecticide nets 0.0 to 2.7 0.0 to 6.0 0.0 to 9.3
No usage
Vaccination 0.0 to 0.9 �0.3 to 2.0 �0.6 to 2.1
SETTING PRIORITIES, TARGETING SUBSIDIES AMONG WATER, SANITATION, AND PREVENTIVE HEALTH INTERVENTIONS INDEVELOPING COUNTRIES 17
vaccine coverage levels at a decreasing rate, each additionalvaccination delivers marginal protection that is decreasing incoverage. Unless significant economies of scale (decreasingunit costs) are also gained by delivering large numbers of vac-cinations, which is unlikely, the marginal net benefits of vacci-nation will thus decrease as coverage increases (Cook et al.,2009). This is indeed what happens in our model results, asherd effects have been included and marginal costs of vaccina-tions are assumed to be constant.
Although empirical evidence of herd protection for the otherinterventions is largely absent, this result may well apply to theother preventive health interventions modeled in this analysis.The possibility of a nonlinear relationship between herd pro-tection and extent of coverage warrants careful considerationin the design of subsidy schemes and user fees, because the neteconomic benefits of achieving higher uptake may be over-stated by our analysis. The advantages of subsidized provisionwould thus be reduced, and the optimal subsidy (from an eco-nomic efficiency perspective) would be lower than expected.
One-way sensitivity analyses confirm that these economicoutcomes are quite sensitive to behavioral assumptions.For example, Figure 4 shows that the LLIN interventionoutcomes are highly sensitive to assumed usage rates; thisis both because reported usage rates vary widely for thisintervention (15–80%) and because almost all of the costsof the intervention are the up-front costs of providing theLLINs. The net benefits of in-house chlorination are alsosensitive to usage rates (again due to the wide variation inmeasured usage, 10–80%). The biosand filter and LLIN out-comes are especially sensitive to declines in usage over time.Cholera vaccination is most sensitive to uptake rates. Totalsanitation is also most sensitive to uptake rates becauseusage appears to be relatively high among households thatinvest in this technology.
Isolating the effects of uptake and usage reveals severalother important points (Figure 5). First, the contribution of
Please cite this article in press as: Whittington, D. et al. Setting PrioritHealth Interventions in Developing Countries, World Development (2
uncertainty about usage to variation in economic outcomesis greatest when uptake is high. This is because a greater num-ber of people could potentially receive health benefits whenownership of the improved technologies is high and costs havebeen incurred. Usage then makes a large difference in the ex-tent to which those benefits are realized.
Second, when usage is low, increasing uptake may actuallyreduce net benefits on average (as shown for LLINs in Fig-ure 5). This occurs because capital costs increase faster thanbenefits, which are suppressed by low usage rates. This poten-tial problem will be most important for capital-intensiveinterventions or in locations where the other parameters (inci-dence, case fatality rates, etc.) result in lower benefits. Thiseffect of capital intensiveness is one important reason whythe water/sanitation and hygiene sector has widely adopteda demand-driven planning model and user fees, that is, toavoid including in a program people or communities thatare unlikely to utilize and/or maintain a technology. In con-trast, the nonWASH preventive health sector has favored freedistribution of impregnated bed nets and vaccines in order toincrease uptake.
Third, for interventions that suffer from declining usage overtime, user attrition can significantly reduce net benefits. Again,this effect is greatest when uptake is high, because the fixedcosts of program software have already been incurred.
Fourth, as shown by the example of cholera vaccination,the possibility of herd protection effects adds significantlyto the uncertainty in the economic analysis. If herd protec-tion were to be demonstrated for the five interventions inaddition to cholera vaccination, the most efficient levels ofuptake would be hard to predict and would depend on thenature of the relationship between herd protection and typeof coverage. This would be true even if one ignored behav-ioral feedback from herd protection (owing to reduced riskof disease) and the resulting reduced uptake or usage ofthe intervention.
ies, Targeting Subsidies among Water, Sanitation, and Preventive012), http://dx.doi.org/10.1016/j.worlddev.2012.03.004

Figure 4. One-way sensitivity analyses on the behavioral parameters—
assumed values are shown—for the different interventions (all other
parameters set at median values).
Figure 3. Scatter plot of BCR outcomes from simulations of chlorination
and total sanitation interventions, for low and high cases of uptake and usage
(dotted diagonal represents the line for which the two BCRs are equal).
18 WORLD DEVELOPMENT
6. DISCUSSION
Researchers have spent decades debating the effectiveness ofwater and sanitation and hygiene and preventive health inter-ventions and trying to bring them successfully to scale. Manyquestions remain, and the market penetration of such inter-ventions, particularly in places that appear to need them themost, often remains limited. It seems that households in manydeveloping countries remain unconvinced that the interven-tions provide them with the benefits that many donors andpublic health experts anticipate. We have illustrated here onereason why debates over the economic attractiveness andimplementation of these interventions continue. Informationon parameters such as burden of a disease and case fatalityrates, which are critical in households’ economic calculationsbut are generally unknown to policymakers, is very expensiveto obtain. Moreover, local conditions are nonstationary,which implies that point estimates carefully measured by com-prehensive research enterprises may quickly become outdated.Research results can take decades to be translated into prac-tice; in the meantime, new technologies are developed, new
Please cite this article in press as: Whittington, D. et al. Setting PrioritHealth Interventions in Developing Countries, World Development (2
policies are implemented, and households’ behavioral incen-tives and priorities change.
Our calculations indicate that typical water and sanitationand hygiene and preventive health interventions (such asthose analyzed in this paper) may be extremely attractiveeconomic investments in many locations, but not in others.This finding has a number of important implications, andcontradicts the prevailing wisdom that the economic casefor them is always clear cut (see for example the argumentspresented by the Water and Sanitation Program of theWorld Bank, available at: http://www.wsp.org/wsp/content/economic-impacts-sanitation). It follows that setting priori-ties among competing interventions at the global level, andbetween these health interventions and investments in othersectors, is generally inappropriate. Using benefit–cost ratherthan cost-effectiveness analysis, it is easier to see why there issuch pervasive uncertainty associated with the economic out-comes experienced by households in developing countries.
ies, Targeting Subsidies among Water, Sanitation, and Preventive012), http://dx.doi.org/10.1016/j.worlddev.2012.03.004

Figure 5. Selected model relationships between net benefits and usage and
uptake parameters (all parameters not shown are set at median value).
SETTING PRIORITIES, TARGETING SUBSIDIES AMONG WATER, SANITATION, AND PREVENTIVE HEALTH INTERVENTIONS INDEVELOPING COUNTRIES 19
Benefit–cost analysis requires identification not only ofhealth outcomes but of the nonhealth outcomes, which areespecially important in understanding how households’behavior can shape predictions of usage and uptake of de-sired interventions.
The wide variation in plausible benefit–cost outcomes andthe extreme uncertainty of the calculations in the analysispresented here raise a fundamental question: Is centralizedpriority-setting the best planning approach? One criticalassumption in the current donor push for “evidence-basedpolicy” is that central planners will be able to chart the mosteffective course of action once they know the results from afew more rigorously-designed randomized control trials. Incontrast, our findings suggest that intensified research willnot easily remove the high level of uncertainty that plaguesglobal priority-setting exercises. Too many of the importantparameters that factor into benefit–cost (or cost-effectiveness)calculations for the interventions being compared may varyover space and time and may remain unknown to policy
Please cite this article in press as: Whittington, D. et al. Setting PrioritHealth Interventions in Developing Countries, World Development (2
makers. Moreover, most existing program evaluations prob-ably overestimate usage and underestimate disuse over time,due to Hawthorne effects and the short duration of the eval-uations.
Global health planners face severe information constraintsin their efforts to set program priorities and target subsidies.Thus the establishment of “evidence-based” priorities remainsan elusive goal, fostered by what some have called “scientisticprejudice” (Hayek, 1974), and the external validity of re-search findings is weak (Zoellick, 2010). As a result, there isa strong case for decentralizing program design and invest-ment decisions to the regional and local levels where peopleare more likely to have firsthand, experiential data that theycan use in decision making about efficient allocation of re-sources. Part of this task involves building decision-makingcapacity among government officials in developing countriesand among sector professionals engaged in fieldwork, andenabling cross-sectoral investment planning at the regionaland local levels. Local knowledge and information seems animportant tool in avoiding white-elephant projects and out-comes (Altaf, 2011). So long as potential beneficiaries areproperly consulted when planning interventions, localauthorities closest to beneficiary households are most likelyto predict accurately whether the context for particular inter-ventions is right and whether uptake and usage of interven-tions at a specific time and place is likely to be satisfactory.As we have shown, these interactions between context andbehavior greatly affect economic outcomes. However, trans-parent and sufficient user consultation at the local levelshould not be assumed, and local authorities may allocate re-sources based on favoritism rather than on actual benefits,suggesting the need for enhancing accountability in decentral-ized programs.
One reaction to the findings presented here might be toquestion whether a “mistake” could be made, in the senseof investing in one of the analyzed interventions where coststurned out to exceed benefits. One could argue that all suchinitiatives have some wastage; are not some “mistakes” inev-itable? And on equity grounds, is it not justifiable to deliverbenefits to poor beneficiaries via highly subsidized services,even if economic efficiency suffers? Our own view is thatbehavioral, financial, and institutional issues need to be care-fully considered to ensure long-term success for programs ofthis nature. Donor funding alone will never be sufficient tofinance completely the health care and basic infrastructureneeds of poor populations. The active involvement of localand national governments in setting investment priorities,managing programs, and paying for services is also neces-sary. Without local ownership, it will be difficult to avoidthe moral hazard that could diminish the financial resourcesallocated to maintain free or highly subsidized goods andservices.
Overgeneralization and misunderstanding of individuals’preference tradeoffs are one reason why many internationalaid projects prove unsustainable in the long term. Unfortu-nately, from the perspective of global planners, there are noeasy answers to this problem. All of the interventions selectedfor our analysis rely on personal and community behaviorchange to be successful. A key challenge is to adapt and imple-ment context-appropriate mechanisms and incentives toaccomplish desired changes, so as to avoid costly mistakes.Sometimes this may involve limiting uptake using price as a“demand filter”; other times uptake might need to be stimu-lated. Which strategy to pursue will depend on localcircumstances. Seen in this light, innovations in design (tech-nological features, community participation, facilitation of
ies, Targeting Subsidies among Water, Sanitation, and Preventive012), http://dx.doi.org/10.1016/j.worlddev.2012.03.004

20 WORLD DEVELOPMENT
operation and maintenance) and delivery mechanism (free orsubsidized distribution, social marketing, market provision,etc.) can only do so much. These innovations are unlikely toprovide a silver bullet for resolving the problem of scaling-up interventions. The difficult task remains of establishingand developing effective institutions that deliver financiallysustainable services. This is especially true for capital-intensiveinterventions in the water and sanitation sector, where servicesmust be rendered and monitored on a continuous, long-termbasis (unlike one-time or occasional interventions such as vac-cines or bed nets).
With modest “demand filters,” the chances of a “mistake” ininvesting in piped water and sanitation services in a dynamic,growing economy are relatively modest. There is compellingglobal evidence that people everywhere want piped waterand will use it, even when they cannot afford the full costs(Devoto, Duflo, Dupas, Pariente, & Pons, 2011; Whittington,2010). The screening effect of “demand filters” may in some in-stances better reveal which households really want and benefitfrom particular interventions than do observable householdcharacteristics (Ashraf et al., 2010). For piped water and san-itation, subsidies are widespread because governments havecorrectly read household preferences (Whittington, 2010).We are not convinced this is always the case for the six inter-ventions analyzed here. Cholera vaccination programs will dolittle good if the burden of disease is low. Bed nets that aresimply packed away or water disinfectant that is used onlyfor washing clothes will not do much to increase humanwell-being.
Our findings resonate with the following observation byDouglas North, the 1993 Nobel Laureate in Economics:
We should be very tentative about how we understand the world. Thatdoesn’t mean you don’t do things. You’ve got to do things, but you’vegot to recognize that you may be wrong. We don’t know enough. Andso it is terribly important to recognize that you can be wrong, and tobe, therefore, very susceptible to modifying the theories you hold inlight of new evidence (quoted in King and Schulz (2009)).
More recently, other scholars have also emphasized the needfor caution in setting policy on the basis of “evidence” andwhat analysts claim to know (Green, Ottoson, Garcıa, &Hiatt, 2009; Manski, 2010). Even so, as North notes, decisionsmust be taken in the face of uncertainty, and we believe ourresults point toward three concrete policy directions.
First, the information required for the economic analysis ofwater and sanitation and hygiene and preventive health inter-ventions at the global level, with the precision needed to setprogrammatic priorities, is generally unavailable. This prob-lem is not going to be solved. This finding provides strong sup-port for a policy of decentralization, moving decisions about
Please cite this article in press as: Whittington, D. et al. Setting PrioritHealth Interventions in Developing Countries, World Development (2
priority setting and targeting subsidies out of the central offi-ces of large donors and international organizations. Incorpo-rating local knowledge of health and environmentalconditions and of household preferences and behavior intodecisions on the targeting of subsidies among competing inter-ventions requires greater involvement by governments and lo-cal decision makers in developing countries. We are notarguing that local decision makers have all the informationthey need for setting priorities, or that decentralization is apanacea. But decision makers in developing countries are bestpositioned to use their knowledge, experience, and intuitionabout what will actually work at a particular time and place.
Second, government officials in developing countries oftenseek assistance from the global community in thinking system-atically about issues of targeting and priority setting. Our find-ings point to the need for capacity-building efforts in economicanalysis at both the national and regional levels to ensuretimely and successful health interventions. Professionals in thissector need training in the use of policy and decision analysis,including economic tools such as cost-effectiveness and bene-fit–cost analysis, in order to evaluate investment options sys-tematically and grasp the implications of findings andexperience from other parts of the world. Many donors andorganizations (e.g., the Global Development Network) arenow actively engaged in such capacity-building efforts, andthis work should be more strongly supported.
Third, improved basic knowledge of the determinants ofusage and uptake in water/sanitation and hygiene and preven-tive health interventions under a variety of local conditions isan important global public good. Of particular importance isdeveloping a better understanding of when user fees areneeded to screen potential recipients efficiently, and when theyare not, so as to maximize the net benefits of particular inter-ventions. Also critical are efforts of the research and donorcommunity to understand the heterogeneity of impacts amongusers, particularly when groups marginalized by the powerstructure—for example women or children—are involved. Inaddition, governments and other institutions working in devel-oping countries routinely seek assistance in understandingprogram effectiveness and measuring program outcomes.These institutions will likely continue to ask for such help inthe future. International organizations and academic research-ers have a comparative advantage in supporting the produc-tion of this kind of knowledge, but they will need tocontinue to collaborate and engage with experienced local, re-gional, and national sources from a wide variety of developingcountries to most effectively produce and disseminate suchknowledge.
NOTES
1. Household demand for water from nonnetwork suppliers (e.g., watervendors) is also price inelastic. Households are often willing to pay forincreases in water quantity, but demand for water-quality improvements islow in many places.
2. Consider a simple example calculation. Suppose that the followingranges are possible for each of these parameters in a given location: (a)Incbefore = 0.1–0.5 cases/person-yr; (b) CFR = 1–3%; (c) Eff = 50–80%;(d) VSL = $100,000–$300,000. The mortality gains could range from alower bound of $50/person-yr to an upper bound of $3,600/person-yr. In
general, even in a specific location, there will be much more uncertainty ineach of these parameters than this simple case suggests. Generalizing to alarge number of locations will be even harder.
3. One explanation that is frequently offered for the low uptake andusage of these and other similar types of interventions is that individualsdo not understand their own self-interest. There is evidence to support thisinterpretation, but we believe that observed outcomes are not solely due to“irrational” behavior.
ies, Targeting Subsidies among Water, Sanitation, and Preventive012), http://dx.doi.org/10.1016/j.worlddev.2012.03.004
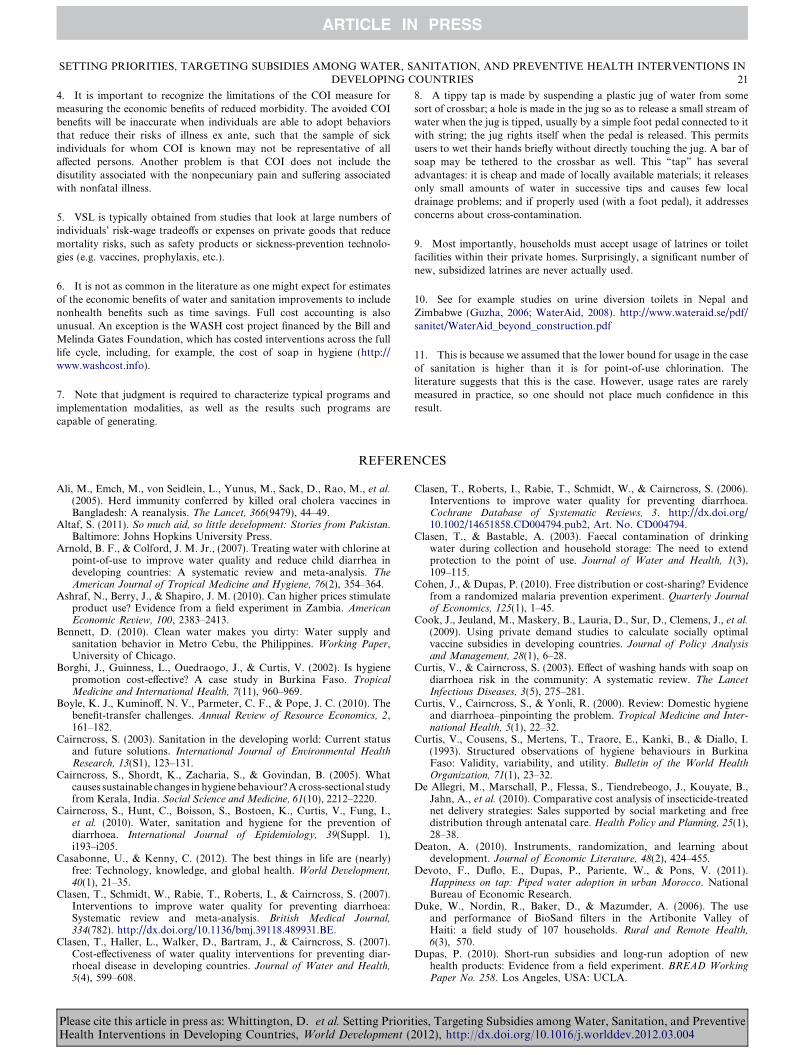
SETTING PRIORITIES, TARGETING SUBSIDIES AMONG WATER, SANITATION, AND PREVENTIVE HEALTH INTERVENTIONS INDEVELOPING COUNTRIES 21
4. It is important to recognize the limitations of the COI measure formeasuring the economic benefits of reduced morbidity. The avoided COIbenefits will be inaccurate when individuals are able to adopt behaviorsthat reduce their risks of illness ex ante, such that the sample of sickindividuals for whom COI is known may not be representative of allaffected persons. Another problem is that COI does not include thedisutility associated with the nonpecuniary pain and suffering associatedwith nonfatal illness.
5. VSL is typically obtained from studies that look at large numbers ofindividuals’ risk-wage tradeoffs or expenses on private goods that reducemortality risks, such as safety products or sickness-prevention technolo-gies (e.g. vaccines, prophylaxis, etc.).
6. It is not as common in the literature as one might expect for estimatesof the economic benefits of water and sanitation improvements to includenonhealth benefits such as time savings. Full cost accounting is alsounusual. An exception is the WASH cost project financed by the Bill andMelinda Gates Foundation, which has costed interventions across the fulllife cycle, including, for example, the cost of soap in hygiene (http://www.washcost.info).
7. Note that judgment is required to characterize typical programs andimplementation modalities, as well as the results such programs arecapable of generating.
Please cite this article in press as: Whittington, D. et al. Setting PrioritHealth Interventions in Developing Countries, World Development (2
8. A tippy tap is made by suspending a plastic jug of water from somesort of crossbar; a hole is made in the jug so as to release a small stream ofwater when the jug is tipped, usually by a simple foot pedal connected to itwith string; the jug rights itself when the pedal is released. This permitsusers to wet their hands briefly without directly touching the jug. A bar ofsoap may be tethered to the crossbar as well. This “tap” has severaladvantages: it is cheap and made of locally available materials; it releasesonly small amounts of water in successive tips and causes few localdrainage problems; and if properly used (with a foot pedal), it addressesconcerns about cross-contamination.
9. Most importantly, households must accept usage of latrines or toiletfacilities within their private homes. Surprisingly, a significant number ofnew, subsidized latrines are never actually used.
10. See for example studies on urine diversion toilets in Nepal andZimbabwe (Guzha, 2006; WaterAid, 2008). http://www.wateraid.se/pdf/sanitet/WaterAid_beyond_construction.pdf
11. This is because we assumed that the lower bound for usage in the caseof sanitation is higher than it is for point-of-use chlorination. Theliterature suggests that this is the case. However, usage rates are rarelymeasured in practice, so one should not place much confidence in thisresult.
REFERENCES
Ali, M., Emch, M., von Seidlein, L., Yunus, M., Sack, D., Rao, M., et al.(2005). Herd immunity conferred by killed oral cholera vaccines inBangladesh: A reanalysis. The Lancet, 366(9479), 44–49.
Altaf, S. (2011). So much aid, so little development: Stories from Pakistan.Baltimore: Johns Hopkins University Press.
Arnold, B. F., & Colford, J. M. Jr., (2007). Treating water with chlorine atpoint-of-use to improve water quality and reduce child diarrhea indeveloping countries: A systematic review and meta-analysis. TheAmerican Journal of Tropical Medicine and Hygiene, 76(2), 354–364.
Ashraf, N., Berry, J., & Shapiro, J. M. (2010). Can higher prices stimulateproduct use? Evidence from a field experiment in Zambia. AmericanEconomic Review, 100, 2383–2413.
Bennett, D. (2010). Clean water makes you dirty: Water supply andsanitation behavior in Metro Cebu, the Philippines. Working Paper,University of Chicago.
Borghi, J., Guinness, L., Ouedraogo, J., & Curtis, V. (2002). Is hygienepromotion cost-effective? A case study in Burkina Faso. TropicalMedicine and International Health, 7(11), 960–969.
Boyle, K. J., Kuminoff, N. V., Parmeter, C. F., & Pope, J. C. (2010). Thebenefit-transfer challenges. Annual Review of Resource Economics, 2,161–182.
Cairncross, S. (2003). Sanitation in the developing world: Current statusand future solutions. International Journal of Environmental HealthResearch, 13(S1), 123–131.
Cairncross, S., Shordt, K., Zacharia, S., & Govindan, B. (2005). Whatcauses sustainable changes in hygiene behaviour? A cross-sectional studyfrom Kerala, India. Social Science and Medicine, 61(10), 2212–2220.
Cairncross, S., Hunt, C., Boisson, S., Bostoen, K., Curtis, V., Fung, I.,et al. (2010). Water, sanitation and hygiene for the prevention ofdiarrhoea. International Journal of Epidemiology, 39(Suppl. 1),i193–i205.
Casabonne, U., & Kenny, C. (2012). The best things in life are (nearly)free: Technology, knowledge, and global health. World Development,40(1), 21–35.
Clasen, T., Schmidt, W., Rabie, T., Roberts, I., & Cairncross, S. (2007).Interventions to improve water quality for preventing diarrhoea:Systematic review and meta-analysis. British Medical Journal,334(782). http://dx.doi.org/10.1136/bmj.39118.489931.BE.
Clasen, T., Haller, L., Walker, D., Bartram, J., & Cairncross, S. (2007).Cost-effectiveness of water quality interventions for preventing diar-rhoeal disease in developing countries. Journal of Water and Health,5(4), 599–608.
Clasen, T., Roberts, I., Rabie, T., Schmidt, W., & Cairncross, S. (2006).Interventions to improve water quality for preventing diarrhoea.Cochrane Database of Systematic Reviews, 3. http://dx.doi.org/10.1002/14651858.CD004794.pub2, Art. No. CD004794.
Clasen, T., & Bastable, A. (2003). Faecal contamination of drinkingwater during collection and household storage: The need to extendprotection to the point of use. Journal of Water and Health, 1(3),109–115.
Cohen, J., & Dupas, P. (2010). Free distribution or cost-sharing? Evidencefrom a randomized malaria prevention experiment. Quarterly Journalof Economics, 125(1), 1–45.
Cook, J., Jeuland, M., Maskery, B., Lauria, D., Sur, D., Clemens, J., et al.(2009). Using private demand studies to calculate socially optimalvaccine subsidies in developing countries. Journal of Policy Analysisand Management, 28(1), 6–28.
Curtis, V., & Cairncross, S. (2003). Effect of washing hands with soap ondiarrhoea risk in the community: A systematic review. The LancetInfectious Diseases, 3(5), 275–281.
Curtis, V., Cairncross, S., & Yonli, R. (2000). Review: Domestic hygieneand diarrhoea–pinpointing the problem. Tropical Medicine and Inter-national Health, 5(1), 22–32.
Curtis, V., Cousens, S., Mertens, T., Traore, E., Kanki, B., & Diallo, I.(1993). Structured observations of hygiene behaviours in BurkinaFaso: Validity, variability, and utility. Bulletin of the World HealthOrganization, 71(1), 23–32.
De Allegri, M., Marschall, P., Flessa, S., Tiendrebeogo, J., Kouyate, B.,Jahn, A., et al. (2010). Comparative cost analysis of insecticide-treatednet delivery strategies: Sales supported by social marketing and freedistribution through antenatal care. Health Policy and Planning, 25(1),28–38.
Deaton, A. (2010). Instruments, randomization, and learning aboutdevelopment. Journal of Economic Literature, 48(2), 424–455.
Devoto, F., Duflo, E., Dupas, P., Pariente, W., & Pons, V. (2011).Happiness on tap: Piped water adoption in urban Morocco. NationalBureau of Economic Research.
Duke, W., Nordin, R., Baker, D., & Mazumder, A. (2006). The useand performance of BioSand filters in the Artibonite Valley ofHaiti: a field study of 107 households. Rural and Remote Health,6(3), 570.
Dupas, P. (2010). Short-run subsidies and long-run adoption of newhealth products: Evidence from a field experiment. BREAD WorkingPaper No. 258. Los Angeles, USA: UCLA.
ies, Targeting Subsidies among Water, Sanitation, and Preventive012), http://dx.doi.org/10.1016/j.worlddev.2012.03.004

22 WORLD DEVELOPMENT
Ejemot, R. I., Ehiri, J. E., Meremikwu, M. M., & Critchley, J. A. (2009).Cochrane review: Hand washing for preventing diarrhoea. Evidence-Based Child Health, 4(2), 893–939.
Evans, B. (1999). Willing to pay but unwilling to charge: Do willingness topay studies make a difference?. New Delhi: UNDP-World Bank Waterand Sanitation Program – South Asia.
Feacham, R. G., Bradley, D. J., Garelick, H., & Mara, D. D. (Eds.). Sanitation and disease: Health aspects of excreta and wastewatermanagement. Chichester, UK: John Wiley & Sons.
Fewtrell, L., Kaufmann, R., Kay, D., Enanoria, W., Haller, L., &Colford, J. (2005). Water, sanitation, and hygiene interventions toreduce diarrhoea in less developed countries: A systematic review andmeta-analysis. The Lancet Infectious Diseases, 5(1), 42–52.
Green, L. W., Ottoson, J. M., Garcıa, C., & Hiatt, R. A. (2009). Diffusiontheory and knowledge dissemination, utilization, and integration inpublic health. American Journal of Public Health, 30, 151–174.
Guzha, E. (2006). Six hundred families realize double fold yield by reusingfaeces (humanure) and urine (ecofert) in Zimbabwe. Paper presented atthe 2nd Dry Toilet Conference, 16–19 August, Tampere, Finland.
Hanson, K., Kikumbih, N., Schellenberg, J. A., Mponda, H., Nathan, R.,Lake, S., et al. (2003). Cost-effectiveness of social marketing ofinsecticide-treated nets for malaria control in the United Republic ofTanzania. Bulletin of the World Health Organization, 81, 269–276.
Hayek, F. (1974). The pretence of knowledge (Nobel Memorial Lecture,December 11, 1974). American Economic Review, 79(6), 3–7.
Hoque, B., Juncker, T., Sack, R., Ali, M., & Aziz, K. (1996). Sustain-ability of a water, sanitation and hygiene education project in ruralBangladesh: A 5-year follow-up. Bulletin of the World Health Orga-nization, 74(4), 431–437.
Howells, J. (1996). Tacit knowledge, innovation, and technology transfer.Technology Analysis and Strategic Management, 8(2), 91–106.
Hunter, P. R. (2009). Household water treatment in developing countries:Comparing different intervention types using meta-regression. Envi-ronmental Science and Technology, 43, 8991–8997.
Huttly, S., Lanata, C., Gonzales, H., Aguilar, I., Fukumoto, M.,Verastegui, H., et al. (1994). Observations on handwashing anddefecation practices in a shanty town of Lima, Peru. DiarrhoealDiseases Research, 12(1), 14–18.
Hutton, G., & Haller, L. (2004). Evaluation of the costs and benefits ofwater and sanitation improvements at the global level. Geneva: WorldHealth Organization.
Hutton, G., Haller, L., & Bartram, J. (2007). Global cost–benefit analysisof water supply and sanitation interventions. Journal of Water andHealth, 5(4), 481–502.
Jamison, D., Breman, J., Measham, A., Alleyne, G., Claeson, M., Evans,D., et al. (2006). Disease control priorities in developing countries.Oxford: Oxford University Press.
Jenkins, M., & Curtis, V. (2005). Achieving the ‘good life’: Why somepeople want latrines in rural Benin. Social Science & Medicine, 61(11),2446–2459.
Jeuland, M., Cook, J., Poulos, C., Clemens, J., & Whittington, D. (2009).Cost-effectiveness of new-generation oral cholera vaccines: A multisiteanalysis. Value in Health, 12(6), 899–908.
Jeuland, M., & Whittington, D. (2009). Cost–benefit comparisons ofinvestments in improved water supply and cholera vaccinationprograms. Vaccine, 27(23), 3109–3120.
Jeuland, M., Lucas, M., Clemens, J., & Whittington, D. (2009). A cost–benefit analysis of cholera vaccination programs in Beira, Mozam-bique. The World Bank Economic Review, 23(2), 235–267.
Jeuland, M., Lucas, M., Clemens, J., & Whittington, D. (2010). Estimat-ing the private benefits of vaccination against cholera in Beira,Mozambique: A travel cost approach. Journal of DevelopmentEconomics, 91(2), 310–322.
King, A., & Schulz, N. (2009). From poverty to prosperity – Intangibleassets, hidden liabilities and the lasting triumph over scarcity. New York:Encounter Books.
Kremer, M., Leino, J., Miguel, E., & Zwane, A. (2009). Spring cleaning:Rural water impacts, valuation, and property rights institutions.NBER Working Paper 15280.
Kremer, M., Null, C., Miguel, E., & Zwane, A. (2008). Trickle down:Diffusion of chlorine for drinking water treatment in Kenya. WorkingPaper.
Lantagne, D., Quick, R., & Mintz, E. D. (2007). Household watertreatment and safe storage options in developing countries: A review ofcurrent implementation practices. In M. Parker, A. Williams, & C.
Please cite this article in press as: Whittington, D. et al. Setting PrioritHealth Interventions in Developing Countries, World Development (2
Youngblood (Eds.), Water stories: Expanding opportunities in small-scale water and sanitation projects (pp. 17–38). Washington, DC:Woodrow Wilson International Center for Scholars, EnvironmentalChange and Security Program.
Larsen, B. (2002). Hygiene and health in developing countries:Defining priorities: A cost–benefit assessment. Presented at the2nd IFH conference on home hygiene and the prevention ofinfectious disease in developing countries: A responsibility for all.New Delhi.
Lengeler, C. (2004). Insecticide-treated bed nets and curtains for prevent-ing malaria. Cochrane Database of Systematic Reviews, 2, 1465–1858.
Lomborg, B. (2004). Global crises, global solutions. Cambridge: CambridgeUniversity Press.
Longini, I. M., Nizam, A., Ali, M., Yunus, M., Shevi, N., & Clemens, J.D. (2007). Controlling endemic cholera with oral vaccines. PLOSMedicine, 4(11), 1776–1783.
Luby, S. P., Agboatwalla, M., Feikin, D. R., Painter, J., Billhimer, W.,Altaf, A., et al. (2005). Effect of handwashing on child health: Arandomised controlled trial. The Lancet, 366(9481), 225–233.
Macy, J., & Quick, R. (1998). Evaluation of a novel drinking watertreatment and storage intervention in Nicaragua. Revista Panamerica-na de Salud Publica, 3, 135–136.
Manski, C. (2010). Policy analysis with incredible certitude. NBERWorking Paper 16207.
Miguel, E., & Kremer, M. (2004). Worms: Identifying impacts oneducation and health in the presence of treatment externalities.Econometrica, 72(1), 159–217.
Mong, Y., Kaiser, R., Ibrahim, D., Rasoatiana Razafimbololona, L., &Quick, R. E. (2001). Impact of the Safe Water System on water qualityin cyclone-affected communities in Madagascar. American Journal ofPublic Health, 91(10), 1577–1579.
Mueller, D. H., Wiseman, V., Bakusa, D., Morgah, K., Dare, A., &Tchamdja, P. (2008). Cost-effectiveness analysis of insecticide-treatednet distribution as part of the Togo Integrated Child HealthCampaign. Malaria Journal, 7, 73–80.
Mukherjee, N. (2000). Myth vs. reality in sanitation and hygiene promotion:Field note. Jakarta: Water and Sanitation Program.
Muller, O., De Allegri, M., Becher, H., Tiendrebogo, J., Beiersmann, C.,Ye, M., et al. (2008). Distribution systems of insecticide-treated bednets for malaria control in rural Burkina Faso: Cluster-randomizedcontrolled trial. PLoS One, 3(9), e3182. http://dx.doi.org/10.1371/journal.pone.0003182.
Mulligan, J. A., Yukich, J., & Hanson, K. (2008). Costs and effects of theTanzanian national voucher scheme for insecticide-treated nets.Malaria Journal, 7(1). http://dx.doi.org/10.1186/1475-2875-7-32.
Nauges, C., & Whittington, D. (2009). Estimation of water demand indeveloping countries: An overview. The World Bank ResearchObserver, 1–32.
Olembo, L., Kaona, F. A. D., Tuba, M., & Burnham, G. (2004). Safewater systems: An evaluation of the Zambia CLORIN program, USAgency for International Development Environmental Health Project.Available from http://www.ehproject.org/pdf/others/zambia%20report%20format.pdf.
Pattanayak, S. K., Yang, J. C., Dickinson, K. L., Poulos, C., Patil, S. R.,Mallick, R. K., et al. (2009). Shame or subsidy revisited: Socialmobilization for sanitation in Orissa, India. Bulletin of the WorldHealth Organization, 87, 580–587.
Pigou, A. C. (1932). The economics of welfare. London: Macmillan andCo.
Quick, R., Venczel, L., Gonzalez, O., Mintz, E., Highsmith, A., Espada,A., et al. (1996). Narrow-mouthed water storage vessels and in situchlorination in a Bolivian community: A simple method to improvedrinking water quality. The American Journal of Tropical Medicine andHygiene, 54(5), 511–516.
Quick, R., Kimura, A., Thevos, A., Tembo, M., Shamputa, I., Hutwagner,L., et al. (2002). Diarrhea prevention through household-level waterdisinfection and safe storage in Zambia. The American Journal ofTropical Medicine and Hygiene, 66(5), 584–589.
Ramsey, F. P. (1927). A contribution to the theory of taxation. EconomicJournal, 37(145), 47–61.
Reller, M., Mendoza, C., Lopez, M., Alvarez, M., Hoekstra, R., Olson,C., et al. (2003). A randomized controlled trial of household-basedflocculant-disinfectant drinking water treatment for diarrhea preven-tion in rural Guatemala. The American Journal of Tropical Medicineand Hygiene, 69(4), 411–419.
ies, Targeting Subsidies among Water, Sanitation, and Preventive012), http://dx.doi.org/10.1016/j.worlddev.2012.03.004

SETTING PRIORITIES, TARGETING SUBSIDIES AMONG WATER, SANITATION, AND PREVENTIVE HEALTH INTERVENTIONS INDEVELOPING COUNTRIES 23
Rogers, P., De Silva, R., & Bhatia, R. (2002). Water is an economic good:How to use prices to promote equity, efficiency, and sustainability.Water Policy, 4(1), 1–17.
Russell, S. (2004). The economic burden of illness for households indeveloping countries: A review of studies focusing on malaria,tuberculosis, and human immunodeficiency virus/acquired immuno-deficiency syndrome. The American Journal of Tropical Medicine andHygiene, 71(2 Suppl.), 147–155.
Sannan, D., & Moulik, S. G. (2007). Community-led total sanitation inrural areas: An approach that works (field note). New Delhi: Water andSanitation Program – South Asia.
Semenza, J., Roberts, L., Henderson, A., Bogan, J., & Rubin, C. (1998).Water distribution system and diarrheal disease transmission: A casestudy in Uzbekistan. The American Journal of Tropical Medicine andHygiene, 59(6), 941–946.
Smith, V., Van Houtven, G., & Pattanayak, S. (2002). Benefit transfer viapreference calibration: ‘Prudential algebra’ for policy. Land Economics,78(1), 132–152.
Snow, R. W., Craig, M., Deichmann, U., & Marsh, K. (1999). Estimatingmortality, morbidity and disability due to malaria among Africa’s non-pregnant population. Bulletin of the World Health Organization, 77(8),624.
Snow, R. W., McCabe, E. C., Mbogo, N. M., Molyneux, C. S., Some, E.S., Mung’ala, V. O., et al. (1999). The effect of delivery mechanisms onthe uptake of bed net reimpregnation in Kilifi District, Kenya. HealthPolicy and Planning, 14(1), 18–25.
Sobsey, M., Handzel, T., & Venczel, L. (2003). Chlorination and safestorage of household drinking water in developing countries to reducewaterborne disease. Water Science and Technology, 47(3), 221–228.
Sobsey, M., Stauber, C., Casanova, L., Brown, J., & Elliott, M. (2008).Point of use household drinking water filtration: A practical, effectivesolution for providing sustained access to safe drinking water in thedeveloping world. Environmental Science and Technology, 42(12),4261–4267.
Tarozzi, A., Mahajan, A., Blackburn, B., Kopf, D., Krishnan, L., &Yoong, J. (2010). Micro-loans, bednets and malaria: Evidence from arandomized controlled trial in Orissa (India). Unpublished manuscript.Duke University: Durham, USA.
Therkildsen, O. (1998). Watering white elephants? Lessons from donorfunded planning and implementation of rural water supplies in Tanzania.Scandinavian Institute of African Studies.
Thiem, V., Deen, J. L., von Seidlein, L., Canh, D. G., Anh, D. D., Park, J.K., et al. (2006). Long term effectiveness against cholera of oral killedwhole-cell vaccine produced in Vietnam. Vaccine, 24(20), 4297–4303.
Thiem, V., Hossain, M., Son, N., Hoa, N., Rao, M., Canh, D. G., et al.(2003). Coverage and costs of mass immunization of an oral choleravaccine in Vietnam. Journal of Health Population and Nutrition, 21(4),304–308.
Trach, D., Clemens, J., Ke, N., Thuy, H., Son, N., & Canh, D. (1997).Field trial of a locally produced, killed, oral cholera vaccine inVietnam. The Lancet, 349(9047), 231–235.
Tremolet, S., Kolsky, P., & Perez, E. (2010). Financing on-site sanitationfor the poor: A six country comparative review and analysis. Washing-ton, DC: The World Bank Water and Sanitation Program.
Please cite this article in press as: Whittington, D. et al. Setting PrioritHealth Interventions in Developing Countries, World Development (2
Vanderzwaag, J. C. (2008). Use and performance of biosand filters inPosoltega, Nicaragua. MSc. thesis. Civil Engineering, University ofBritish Columbia, Vancouver.
Varley, R. C., Tarvid, J., & Chao, D. N. (1998). A reassessment of thecost-effectiveness of water and sanitation interventions in programmesfor controlling childhood diarrhoea. Bulletin of the World HealthOrganization, 76(6), 617–631.
Viscusi, W. K., & Aldy, J. E. (2003). The value of a statistical life: Acritical review of market estimates throughout the world. Journal ofRisk and Uncertainty, 27(1), 5–76.
Waddington, H., & Snilstveit, B. (2009). Effectiveness and sustainability ofwater, sanitation, and hygiene interventions in combating diarrhoea.Journal of Development Effectiveness, 1(3), 295–335.
WaterAid (2008). Beyond construction: Use by all. Workshop onsanitation and hygiene. Dhaka, Bangladesh, 29–31 January, 2008.
Waterkeyn, J., & Cairncross, S. (2005). Creating demand for sanitationand hygiene through Community Health Clubs: A cost-effectiveintervention in two districts in Zimbabwe. Social Science and Medicine,61(9), 1958–1970.
Whittington, D. (2010). What have we learned from twenty years of statedpreference studies in less developed countries?. Annual Review ofResource Economics, 2, 209–236.
Whittington, D., Hanemann, W. M., Sadoff, C., & Jeuland, M. (2009).The challenge of improving water and sanitation services in lessdeveloped countries. Foundations and Trends in Microeconomics, 4(6),469–609.
WHO (World Health Organization) (2009). World Malaria Report 2009.Geneva.
Wilson, J., & Chandler, G. (1993). Sustained improvements in hygienebehaviour amongst village women in Lombok, Indonesia. Transactionsof the Royal Society of Tropical Medicine and Hygiene, 87(6), 615–616.
Wiseman, V., Scott, A., McElroy, B., Conteh, L., & Stevens, W. (2007).Determinants of bed net use in the Gambia: Implications for malariacontrol. The American Journal of Tropical Medicine and Hygiene, 76(5),830–836.
WSP (Water and Sanitation Program) (2005). Scaling-up rural sanitationin South Asia: Lessons learned from Bangladesh, India, and Pakistan.Washington, DC: The World Bank.
Zoellick, R. (2010). Democratizing development economics. Presented atGeorgetown University, Washington, DC, 29 September, 2010.
APPENDIX A. SUPPLEMENTARY DATA
Supplementary data associated with this article can befound, in the online version, at http://dx.doi.org/10.1016/j.worlddev.2012.03.004.
ies, Targeting Subsidies among Water, Sanitation, and Preventive012), http://dx.doi.org/10.1016/j.worlddev.2012.03.004