food safety ir cover - usda aphis
TRANSCRIPT

United StatesDepartment ofAgriculture
Animal andPlant HealthInspection Service
VeterinaryServices
NationalAnimal HealthMonitoringSystem
March 2011
Dairy 2007Salmonella, Listeria, and Campylobacter onU.S. Dairy Operations, 1996–2007

The U.S. Department of Agriculture (USDA) prohibits
discrimination in all its programs and activities on the
basis of race, color, national origin, age, disability, and
where applicable, sex, marital status, familial status,
parental status, religion, sexual orientation, genetic
information, political beliefs, reprisal, or because all or
part of an individual’s income is derived from any public
assistance program. (Not all prohibited bases apply to
all programs.) Persons with disabilities who require
alternative means for communication of program
information (Braille, large print, audiotape, etc.) should
contact USDA’s TARGET Center at (202) 720-2600
(voice and TDD).
To file a complaint of discrimination, write to USDA
Director, Office of Civil Rights, 1400 Independence
Avenue, S.W., Washington, D.C. 20250-9410, or call
(800) 795-3272 (voice) or (202) 720-6382 (TDD).
USDA is an equal opportunity provider and employer.
Mention of companies or commercial products does not
imply recommendation or endorsement by the USDA
over others not mentioned. USDA neither guarantees
nor warrants the standard of any product mentioned.
Product names are mentioned solely to report factually
on available data and to provide specific information.
USDA:APHIS:VS:CEAH
NRRC Building B, M.S. 2E7
2150 Centre Avenue
Fort Collins, CO 80526-8117
(970) 494-7000
Email: [email protected]
http://nahms.aphis.usda.gov
#578.0311
Cover photo courtesy of Agricultural Research Service

USDA APHIS VS / i
This report provides an in-depth look at the
prevalence of food safety pathogens on U.S.
dairy operations from 1996 to 2007, as
identified from three National Animal Health
Monitoring System studies: Dairy 1996, Dairy
2002, and Dairy 2007. Estimates in this report
from bulk-tank milk testing are reported as
population estimates. Estimates based on fecal
culture represent a convenience sample and are
not population estimates.
Here are a few highlights from the report:
In 2007, the percentage of operations on which
a milk filter tested positive for Salmonella
(24.7 percent) was more than double the
percentage of operations on which a bulk-tank
milk sample tested positive (10.8 percent).
Likewise, the percentage of operations on which
a milk filter tested positive for any Listeria
(28.3 percent) was more than three times the
percentage of operations on which a bulk-tank
milk sample tested positive for any Listeria
(9.0 percent). Milk filters were not tested in
2002 or 1996.
The percentage of operations on which bulk-
tank milk tested positive for Salmonella by
RT-PCR was similar in 2002 and 2007 (11.9 and
10.8 percent, respectively). In addition, the
percentage of operations on which bulk-tank
milk tested positive for Listeria monocytogenes
was similar in 2002 and 2007 (3.8 and
3.7 percent, respectively). Bulk-tank milk was
not tested in 1996.
The percentage of operations positive for
Salmonella via fecal culture increased from
1996 to 2007. In 1996, 20.0 percent of
operations had any Salmonella-positive cows
compared with 30.9 percent of operations in
2002 and 39.7 percent in 2007. In 1996 and
2007, the percentage of cows positive for
Salmonella was 5.4 and 13.8 percent,
respectively.
During the Dairy 1996, 2002, and 2007 studies,
a higher percentage of operations with 500 or
more cows were Salmonella positive than
operations with fewer than 100 cows.
The percentage of Salmonella isolates resistant
to at least one antimicrobial decreased from
2002 to 2007 (17.7 and 3.4 percent,
respectively). Similarly, for any specific
antimicrobial to which resistance was observed,
a lower percentage of isolates were resistant in
2007 than in 2002.
In the Dairy 1996, 2002, and 2007 studies,
nearly all operations had at least one cow that
was shedding Campylobacter (100, 97.9, and
92.6 percent of operations, respectively).
In 2002 and 2007, less than 5 percent of
C. jejuni isolates were resistant to any single
antimicrobial tested, with the exception of
tetracycline. In 2007, 62.4 percent of C. jejuni
isolates were resistant to tetracycline compared
with 47.5 percent in 2002.
SelectSelectSelectSelectSelected Highlightsed Highlightsed Highlightsed Highlightsed Highlights

ii / Dairy 2007
AAAAAcccccknoknoknoknoknowwwwwledgmentsledgmentsledgmentsledgmentsledgmentsThis report has been prepared from material
received and analyzed by the U.S. Department
of Agriculture (USDA), Animal and Plant
Health Inspection Service (APHIS), Veterinary
Services (VS) via three national studies of
health management and animal health on U.S.
dairy operations conducted in 1996, 2002, and
2007.
The Dairy 1996, Dairy 2002, and Dairy 2007
studies were cooperative efforts between State
and Federal animal health officials, statisticians,
university researchers, and extension personnel.
We want to thank the National Agricultural
Statistics Service (NASS) enumerators, State
and Federal veterinary medical officers
(VMOs), and animal health technicians (AHTs)
who visited the farms and collected the data.
Their hard work and dedication to the National
Animal Health Monitoring System (NAHMS)
are invaluable. The roles of the producers, Area
Veterinarians in Charge (AVIC), NAHMS
Coordinators, VMOs, AHTs, and NASS
enumerators were critical in providing quality
data for all dairy reports. Recognition also goes
to the personnel at the Centers for Epidemiology
and Animal Health (CEAH) for their efforts in
generating and distributing valuable reports
from NAHMS dairy studies.
Additional biological sampling and testing were
afforded by the generous contributions of
collaborators for the dairy studies, including
• USDA–APHIS, National Veterinary Services
Laboratories;
• USDA–ARS, National Animal Disease
Center;
• USDA–ARS, Beltsville Agricultural Research
Center;
• USDA–ARS, Russell Research Center;
• Antel BioSystems, Inc.;
• BIOCOR Animal Health;
• Colorado State University, College of
Veterinary Medicine and Biomedical
Sciences;
• Cornell University Animal Health Diagnostic
Laboratory;
• IDEXX Laboratories;
• Quality Milk Production Services;
• Tetracore, Inc.;
• TREK Diagnostic Systems;
• University of British Columbia, Canada,
Animal Welfare Program;
• University of California - Davis;
• University of Pennsylvania, New Bolton
Center;
• University of Wisconsin, Madison; and
• Wisconsin Veterinary Diagnostic Laboratory.
All participants are to be commended,
particularly the producers whose voluntary
efforts made the dairy studies possible.
Larry M. Granger
Director
Centers for Epidemiology and Animal Health

USDA APHIS VS / iii
Suggested bibliographic citation for this report:
USDA. 2011. Salmonella, Listeria, and Campylobacter on U.S. Dairy Operations, 1996–2007.
USDA–APHIS–VS, CEAH. Fort Collins, CO
#578.0311
Contacts for further information:
Questions or comments on data analysis: Dr. Jason Lombard (970) 494–7000
Information on reprints or other reports: Ms. Abby Fienhold (970) 494–7000
Email: [email protected]
Feedback
Feedback, comments, and suggestions regarding the Dairy 2007 study reports are welcome. Please
forward correspondence via email to: [email protected], or you may submit feedback via
online survey at: http://nahms.aphis.usda.gov (Click on “FEEDBACK on NAHMS reports.”)

iv / Dairy 2007
TTTTTable of Contable of Contable of Contable of Contable of ContentsentsentsentsentsIntroduction 1Study Objectives and Related Outputs 5
Terms Used in This Report 7
Section I: Population Estimates 8A. Salmonella Detection in Bulk-tank Milk and Milk Filters 81. Background 8
2. Sampling and testing overview 9
3. Prevalence 10
4. Serotypes 12
B. Listeria Detection in Bulk-tank Milk 131. Background 13
2. Sampling and testing overview 14
3. Prevalence 15
Section II: Pathogen Detection in Feces 17A. Salmonella 171. Sampling and testing overview 17
2. Prevalence 19
3. Serotypes 28
4. Comparison of serotypes isolated from cattle and humans 30
5. Antimicrobial susceptibility 34
6. Multidrug resistance patterns 36
B. Campylobacter 371. Background 37
2. Sampling and testing overview 38
3. Prevalence 41
4. Antimicrobial susceptibility 45
5. Multidrug resistance patterns 47
Section III: Sampling and Diagnostic Testing 48A. Farm Selection 48
B. Sampling Methods 501. Bulk-tank milk and milk filter sampling 50
2. Fecal sampling 50

USDA APHIS VS / v
C. Laboratory Methods 521. Salmonella testing of bulk-tank milk and milk filters 52
2. Listeria testing of bulk-tank milk and milk filters 54
3. Salmonella testing of fecal samples 55
4. Campylobacter testing of fecal samples 58
D. Testing Methods Overview 61
Appendix I: NAHMS Study Methodology—Phase II 62
Appendix II: References 63
Appendix III. Previously Published Material 69


USDA APHIS VS / 1
Introduction
IntrIntrIntrIntrIntroductionoductionoductionoductionoductionThere are more than 250 known diseases caused
by bacteria, fungi, viruses, and parasites
transmitted through food to humans. Foodborne
pathogens or toxins enter the body through the
gastrointestinal tract where the first symptoms of
illness often appear. As a result, nausea,
vomiting, abdominal cramps, and diarrhea are
common symptoms in many foodborne diseases.
The majority of foodborne illnesses are mild
and cause symptoms for only 1 to 2 days;
however, some cases are more serious, resulting
in severe illness or death (CDC, 2005).
While the food supply in the United States is
one of the safest in the world, the Centers for
Disease Control and Prevention (CDC)
estimates that each year 76 million people in the
United States get sick from foodborne
pathogens, of which 325,000 are hospitalized
and 5,000 die (Mead et al., 1999). The most
commonly recognized foodborne infections
caused by bacteria are due to Campylobacter,
Salmonella, and Escherichia coli (E. coli)
O157:H7 (CDC, 2005). The Foodborne
Diseases Active Surveillance Network
(FoodNet) of CDC’s Emerging Infections
Program collects data in 10 U.S. States on
diseases caused by enteric pathogens transmitted
commonly through food. In 2008, FoodNet
reported that the incidence per 100,000 people
for Salmonella, Campylobacter, E. coli
O157:H7, and Listeria remained unchanged for
the preceding 3 years (CDC, 2009). Preventing
illness and death associated with foodborne
pathogens remains a major public health
challenge.
In addition to the effect on human health,
foodborne illnesses have an economic impact.
The health-related cost of foodborne illness in
the United States is estimated to be
approximately $152 billion annually (Scharff,
2010).
Many organisms capable of causing foodborne
illness are present in the intestines of healthy
animals raised for food. As a result, food can be
contaminated as it is produced. For example,
meat and poultry carcasses can be contaminated
if they come in contact with small amounts of
intestinal contents during slaughter. Similarly,
fresh fruits and vegetables can be contaminated
if they are washed or irrigated with water
contaminated with animal manure or human
sewage (Doyle and Erickson, 2008; Hanning et
al., 2009). Other foods of animal origin, such as
raw eggs, unpasteurized milk, and raw shellfish
might also be contaminated. In general,
commingling products from many individual
animals—such as bulk raw milk, pooled raw
eggs, or ground beef—presents an increased risk
of contamination; a pathogen present in any one
animal can contaminate products from multiple
animals.
There are several reasons that food safety is of
concern to the dairy industry. Raw milk can
contain Salmonella, Campylobacter, or Listeria,
all of which can cause human disease; however,
outbreaks of disease in humans caused by milk
products have primarily been due to the
consumption of unpasteurized milk or cheeses
made from unpasteurized milk. In addition, cull
dairy cows account for about 17 percent of the

2 / Dairy 2007
Introduction
ground beef available for national consumption
(Troutt and Osburn, 1997) and may be a
potential source of human exposure to
foodborne pathogens if the meat from these
animals is contaminated with fecal material
during slaughter or processing.
This report compares the prevalence and
antimicrobial resistance of Salmonella,
Campylobacter, and Listeria on U.S. dairy
operations as reported in the NAHMS Dairy
1996, Dairy 2002, and Dairy 2007 studies.
These pathogens were selected because data
relating to them could be compared across study
years; only results that could be compared with
Dairy 2007 results were included. For example,
results from the composite fecal sample testing
for Salmonella conducted during Dairy 2007 are
not reported here because composite fecal
Salmonella samples were not collected and
tested during the Dairy 1996 and Dairy 2002
studies.
Further information on NAHMS studies and
reports is available online at:
http://nahms.aphis.usda.gov
For questions about this report or additional
copies, please contact:
USDA–APHIS–VS–CEAH
NRRC Building B, M.S. 2E7
2150 Centre Avenue
Fort Collins, CO 80526-8117
970.494.7000

USDA APHIS VS / 3
Introduction
NNNNNAHMS DairAHMS DairAHMS DairAHMS DairAHMS Dairy Sy Sy Sy Sy Studiestudiestudiestudiestudies
The National Animal Health Monitoring System
(NAHMS) is a nonregulatory division of the
U.S. Department of Agriculture’s (USDA)
Animal and Plant Health Inspection Service
(APHIS). NAHMS is designed to help meet the
Nation’s animal-health information needs and
has collected data on dairy health and
management practices through four previous
studies.
The NAHMS 1991-92 National Dairy Heifer
Evaluation Project (NDHEP) provided the dairy
industry’s first national information on the
health and management of dairy heifers in the
United States. Just months after the study’s first
results were released in 1993, cases of acute
bovine viral diarrhea (BVD) surfaced in the
United States following a 1993 outbreak in
Canada. NDHEP information on producer
vaccination and biosecurity practices helped
officials address the risk of disease spread and
target educational efforts on vaccination
protocols. An outbreak of human illness was
reported in 1993 in the Pacific Northwest, this
time related to Escherichia coli 0157:H7.
NDHEP data on the bacteria’s prevalence in
dairy cattle helped officials define public risks
as well as research needs. This baseline picture
of the industry also helped identify additional
research and educational efforts in various
production areas, such as feed management and
weaning age.
Information from the NAHMS Dairy 1996 study
helped the U.S. dairy industry identify
educational needs and prioritize research efforts
on such timely topics as antibiotic usage and
Johne’s disease, as well as digital dermatitis,
bovine leukosis virus, and potential foodborne
pathogens, including E. coli, Salmonella, and
Campylobacter.
A major focus of the Dairy 2002 study was to
describe management strategies that prevent and
reduce Johne’s disease and to determine
management factors associated with
Mycoplasma and Listeria in bulk-tank milk.
Additionally, levels of participation in quality
assurance programs, the incidence of digital
dermatitis, a profile of animal waste handling
systems used on U.S. dairy operations, and
industry changes since the NDHEP in 1991 and
Dairy 1996 were examined.
One of the objectives of the Dairy 2007 study
was calf health, including colostrum
management and passive transfer of immunity.
Additional study topics included an evaluation
of cow comfort and the analysis of hygiene and
hock scores. Additionally, diseases of concern
such as BVD, Johne’s disease, and contagious
mastitis were evaluated. The Dairy 2007 study
also took and in-depth look at reproductive
practices.
An objective for all three studies, Dairy 1996,
Dairy 2002, and Dairy 2007, was to determine
the prevalence of specific food safety pathogens
and to describe antimicrobial resistance patterns
on U.S. dairy operations.

4 / Dairy 2007
Introduction
USDA APHIS VS / 5
Introduction
SSSSStudy Objectivtudy Objectivtudy Objectivtudy Objectivtudy Objectives andes andes andes andes andRRRRRelatelatelatelatelated Outputsed Outputsed Outputsed Outputsed Outputs
1. Describe trends in dairy cattle health and
management practices
• Part II: Changes in the U.S. Dairy Cattle
Industry, 1991–2007, March 2008
• Part V: Changes in Dairy Cattle Health and
Management Practices in the United States,
1996–2007, July 2009
2. Evaluate management factors related to cow
comfort and removal rates
• Facility Characteristics and Cow Comfort on
U.S. Dairy Operations, 2007, Interpretive
Report, October 2010
3. Describe dairy calf health and nutrition from
birth to weaning and evaluate heifer disease
prevention practices
• Part I: Reference of Dairy Cattle Health and
Management Practices in the United States,
2007, October 2007
• Off-Site Heifer Raising on U.S. Dairy
Operations, 2007, info sheet, November 2007
• Colostrum Feeding and Management on U.S.
Dairy Operations, 1991–2007, info sheet,
March 2008
• Part IV: Reference of Dairy Cattle Health and
Management Practices in the United States,
2007, February 2009
• Calving Intervention on U.S. Dairy
Operations, 2007, info sheet, February 2009
• Heifer Calf Health and Management Practices
on U.S. Dairy Operations, 2007, Interpretive
Report, February 2010
• Passive Transfer in Dairy Heifer Calves,
1991–2007, info sheet, March 2010
4. Estimate the prevalence of herds infected with
bovine viral diarrhea virus (BVDV)
• Bovine Viral Diarrhea (BVD) Management
Practices and Detection in Bulk Tank Milk in
the United States, 2007, info sheet, October
2008
5. Describe current milking procedures and
estimate the prevalence of contagious mastitis
pathogens
• Part III: Reference of Dairy Cattle Health and
Management Practices in the United States,
2007, September 2008
• Milking Procedures on U.S. Dairy Operations,
2007, info sheet, October 2008
• Prevalence of Contagious Mastitis Pathogens
on U.S. Dairy Operations, 2007, info sheet,
October 2008
6. Estimate the herd-level prevalence and
associated costs of Mycobacterium avium
subspecies paratuberculosis
• Johne’s Disease on U.S. Dairies, 1991–2007,
info sheet, April 2008
7. Describe current biosecurity practices and
determine producer motivation for
implementing or not implementing biosecurity
practices
• Part I: Reference of Dairy Cattle Health and
Management Practices in the United States,
2007, October 2007
• Part III: Reference of Dairy Cattle Health and
Management Practices in the United States,
2007, September 2008
• Biosecurity Practices on U.S. Dairy
operations, 1991–2007, Interpretive Report,
May 2010

6 / Dairy 2007
Introduction
8. Determine the prevalence of specific food-
safety pathogens and describe antimicrobial
resistance patterns
• Antibiotic Use on U.S. Dairy Operations, 2002
and 2007, info sheet, October 2008
• Prevalence of Salmonella and Listeria in Bulk
Tank Milk and In-line Filters on U.S. Dairies,
2007, info sheet, July 2009
• Salmonella and Campylobacter on U.S. Dairy
Operations, 2002–07, info sheet, July 2009
• Salmonella, Listeria, and Campylobacter on
U.S. Dairy Operations, 2007, Interpretive
Report, March 2011
• Prevalence of Coxiella burnetii on U.S. Dairy
Operations, 2007, technical brief, March 2011
• Prevalence of Clostridium difficile on U.S.
Dairy Operations, 2007, technical brief, April
2011
Additional information sheets
• Dairy Cattle Identification Practices in the
United States, 2007, info sheet, November
2007
• Bovine Leukosis Virus (BLV) on U.S. Dairy
Operations, 2007, info sheet, October 2008
• Reproduction Practices on U.S. Dairy
Operations, 2007, info sheet, February 2009
• Injection Practices on U.S. Dairy Operations,
2007, info sheet, February 2009
• Methicillin-Resistant Staphylococcus aureus
(MRSA) Isolation from Bulk Tank Milk in the
United States, 2007,technical brief, March
2011

USDA APHIS VS / 7
Introduction
TTTTTerererererms Used in This Rms Used in This Rms Used in This Rms Used in This Rms Used in This Reporeporeporeporeporttttt
Herd size: Herd size is based on January 1
dairy cow inventory for each study year. Small
herds are those with fewer than 100 head;
medium herds are those with 100 to 499 head;
and large herds are those with 500 or more head.
Population estimates: The estimates in this
report for bulk-tank milk and milk filter
sampling make inference to all of the operations
with dairy cows in the target population. Data
from the operations responding to the survey are
weighted to reflect their probability of selection
during sampling and to account for survey
nonresponse.
Precision of population estimates: Population
estimates in this report are provided with a
measure of precision called the standard error. A
95-percent confidence interval can be created
with bounds equal to the estimate plus or minus
two standard errors. If the only error is sampling
error, the confidence intervals created in this
manner will contain the true population mean 95
out of 100 times. In the example to the right, an
estimate of 7.5 with a standard error of 1.0
results in limits of 5.5 to 9.5 (two times the
standard error above and below the estimate).
The second estimate of 3.4 shows a standard
error of 0.3 and results in limits of 2.8 and 4.0.
Alternatively, the 90-percent confidence interval
would be created by multiplying the standard
error by 1.65 instead of 2. Most estimates in this
report are rounded to the nearest tenth. If
rounded to 0, the standard error was reported
(0.0). References to population estimates being
higher or lower than other estimates are based
Regions:
West: California, Colorado, Idaho, New
Mexico, Oregon, Texas, Washington
East: Florida, Illinois, Indiana, Iowa, Kentucky,
Michigan, Minnesota, Missouri, Ohio,
Pennsylvania, New York, Tennessee, Vermont,
Virginia, Wisconsin
Standard Errors(1.0)
10
9
8
7
6
5
4
3
2
1
0(0.3)
Examples of a 95% Confidence Interval
95% Confidence Intervals
on the 95-percent confidence intervals not
overlapping. The estimates in this report without
standard errors are not considered populatin
estimates.

8 / Dairy 2007
Section I: Population Estimates—A. Salmonella Detection in Bulk-tank Milk and Milk Filters
Section I: PSection I: PSection I: PSection I: PSection I: PopulationopulationopulationopulationopulationEsEsEsEsEstimattimattimattimattimatesesesesesAAAAA. . . . . SalmonellaSalmonellaSalmonellaSalmonellaSalmonella De De De De Detttttection in Bulkection in Bulkection in Bulkection in Bulkection in Bulk-t-t-t-t-tank Milk and Milk Fank Milk and Milk Fank Milk and Milk Fank Milk and Milk Fank Milk and Milk Filtiltiltiltiltererererersssss
1. Background Salmonellae are gram-negative bacteria that can
cause gastrointestinal infection in animals and
humans. Salmonella causes an estimated
1.4 million human illnesses and over 500 deaths
annually in the United States (Mead et al.,
1999). Clinical signs of salmonellosis in humans
include diarrhea, fever, and abdominal cramps
12 to 72 hours after infection. Clinical signs
usually last 4 to 7 days, and most people recover
without treatment (CDC, 2008a). In the elderly,
infants, and immunocompromised individuals,
Salmonella infection may spread from the
intestines to the bloodstream and cause more
severe, sometimes life-threatening, infections.
Economic losses associated with human
Salmonella infections have attracted increasing
attention in a number of countries.
Salmonellosis is estimated to cost the United
States $14.6 billion annually (Scharff, 2010).
In dairy cows, Salmonella infection can result in
mortality of adult cows, higher treatment costs,
increased cull rates, higher labor costs, and
lower milk production. Calf mortality and
morbidity also add to the total cost of disease.
Clinical signs of salmonellosis in adult cattle
include depression, dehydration, diarrhea, fever
(106–108°F), anorexia, vaginal discharge,
abortion, and decreased milk production. The
effects of infection can range from no clinical
signs to endotoxemia and death. Calves with
clinical Salmonella infections can present with
diarrhea, fever, lethargy, and an inability to rise.
Infected calves can also become septic and die
(Smith, 2002). Evidence indicates that calves
are more likely to experience mortality than
cows (Cummings et al., 2009b), and preweaned
calves are more likely to be affected by clinical
salmonellosis compared with other cattle
(Cummings et al., 2009a). Cattle can shed
Salmonella in their feces without showing
clinical signs.
Dairy operations represent a potential source of
Salmonella infection for humans. Salmonella
species can colonize the gastrointestinal tracts of
cattle and other animals. Humans can become
infected with Salmonella through fecal
contamination of food products or water.
Several outbreaks of salmonellosis have been
linked to beef and dairy products (CDC, 2003,
2006a, 2006b; Van Duynhoven et al., 2009).
Another source of human infection, primarily
affecting farm families, employees, and visitors,
is direct contact with ill animals (Holmberg et
al., 1984; Troutt and Osburn, 1997). Cull dairy
cows contribute about 17 percent of the ground
beef available for national consumption (Troutt
and Osburn, 1997) and can be a potential source
of human exposure to Salmonella when the meat
is contaminated with fecal material during
slaughter. Pasteurization is very effective against
Salmonella organisms, and foodborne outbreaks
associated with this pathogen in pasteurized
milk or dairy products are very rare.
Testing for Salmonella in milk is not a routine
practice by milk producers. Bacteriological
analysis of raw milk is typically limited to tests
for bacteria (i.e., standard plate count and
coliform count) or for specific mastitis-causing
bacteria (Jayarao et al., 2001). Salmonella
serotyping allows for monitoring changes in the

USDA APHIS VS / 9
Section I: Population Estimates—A. Salmonella Detection in Bulk-tank Milk and Milk Filters
causative organisms. A change in a herd’s
serotype profile could indicate a new source of
infection. Antimicrobial susceptibility testing is
important for determining effective therapy and
for guiding prudent antibiotic use.
Salmonella contamination in bulk-tank milk is
believed to result from fecal contamination
attributable to poor hygiene during the milking
process rather than from intramammary
infection with Salmonella, which is rare (Van
Kessel et al., 2004; Jayarao et al., 2006).
Standard hygiene practices during milking
reduce but do not eliminate the risk of milk
contamination. Pasteurization decreases the
number of pathogenic organisms, decreases
transmission of pathogens, and improves the
safety of milk more than other measures,
including certification of raw milk (Potter et al.,
1984). Interstate sale of raw milk is banned in
the United States by the Food and Drug
Administration, but intrastate sales are allowable
on a State-by-State basis, depending upon each
State’s regulation. Consumption of raw bulk-
tank milk is a common practice among farm
families (Jayarao et al., 2006). Among the
nonfarming population, a growing number of
consumers claim that raw milk is healthier, and
they choose raw milk over pasteurized milk
(Bren, 2004; Jayarao et al., 2006). Pasteurizing
raw milk is an important public health tool for
preventing foodborne disease. Because of
pasteurization, contamination of dairy products
currently accounts for a small percentage of
foodborne illness in the United States. However,
it is clear that consuming raw milk and products
made with raw milk present a risk of foodborne
illness to humans.
2. Sampling andtesting overview
Bulk-tank milk samples were collected and
tested for the presence of Salmonella during the
Dairy 2002 and Dairy 2007 studies. Bulk-tank
milk was not tested for Salmonella in Dairy
1996. In 2002 and 2007, one bulk-tank milk
sample was collected per operation using aseptic
techniques. In addition, a milk filter was
collected from each operation in 2007.
For Dairy 2002, both culture and real-time
polymerase chain reaction (RT-PCR) were used
to detect Salmonella in bulk-tank milk samples,
while only PCR was used in Dairy 2007. Culture
was performed on PCR-positive samples from
Dairy 2007 so that serotyping could be done. In
2002, culture results for bulk-tank milk were
available from 852 dairy operations, and
RT-PCR results were available from 838
operations. In the Dairy 2007 study, test results
from bulk-tank milk or milk filters were
available from 538 dairy operations: 517 from
bulk-tank milk and milk filters, 19 from bulk-
tank milk only, and 2 from milk filters only.
For more information on sampling and
diagnostic testing methods, see Section III, p 48.

10 / Dairy 2007
Section I: Population Estimates—A. Salmonella Detection in Bulk-tank Milk and Milk Filters
3. Prevalence In 2007, the percentage of operations on which
a milk filter tested positive for Salmonella
(24.7 percent) was more than double the
percentage of operations on which a bulk-tank
milk sample tested positive (10.8 percent).
The percentage of operations on which bulk-
tank milk tested positive for Salmonella by
RT-PCR was similar in 2002 and 2007 (11.9 and
10.8 percent of operations, respectively). The
percentage of operations on which a bulk-tank
milk sample tested positive for Salmonella by
RT-PCR was similar across herd sizes in 2002
and 2007.
b. Percentage of operations on which a bulk-tank milk sample tested positive for Salmonella by RT-PCR, by herd size
Herd Size (Number of Cows)
Small (Fewer
than 100) Medium
(100–499) Large
(500 or More) All
Operations
Study Pct. Std. Error Pct.
Std. Error Pct.
Std. Error Pct.
Std. Error
Dairy 2002 12.4 (2.2) 10.2 (2.1) 13.9 (3.1) 11.9 (1.7)
Dairy 2007 8.1 (2.3) 16.2 (3.2) 19.6 (4.6) 10.8 (1.8)
a. Percentage of operations on which a bulk-tank milk and/or a milk-filter sample tested positive for Salmonella in Dairy 2007, by testing method
Testing Method
Bulk-tank Milk RT-PCR Milk Filter RT-PCR Bulk-tank Milk or Milk
Filter RT-PCR
Percent Std. Error Percent Std. Error Percent Std. Error
10.8 (1.8) 24.7 (2.4) 28.1 (2.6)

USDA APHIS VS / 11
Section I: Population Estimates—A. Salmonella Detection in Bulk-tank Milk and Milk Filters
In 2002 and 2007, there was no regional
difference in the percentage of operations on
which a bulk-tank milk sample tested positive
for Salmonella by RT-PCR.
c. Percentage of operations on which a bulk-tank milk sample tested positive for Salmonella by RT-PCR, by region
Region
East West
Study Percent Std. Error Percent Std. Error
Dairy 2002 11.9 (1.8) 11.5 (3.8)
Dairy 2007 10.7 (2.0) 12.7 (3.1)

12 / Dairy 2007
Section I: Population Estimates—A. Salmonella Detection in Bulk-tank Milk and Milk Filters
4. Serotypes Eight Salmonella serotypes were found in bulk-
tank milk in 2002. S. Montevideo was found in
bulk-tank milk on seven operations in 2002. In
2007, 14 and 22 Salmonella serotypes were
found in bulk-tank milk and milk filters,
respectively. S. Cerro was identified in the
highest number of both sample types.
a. Number of operations on which the following Salmonella serotypes were identified, by sample type used for identification
Sample Type
Dairy 2002 Dairy 2007
Bulk-tank Milk Bulk-tank Milk Milk Filters
Serotype
Number Operations
(852 Sampled)
Number Operations
(536 Sampled)
Number Operations
(519 Sampled)
Cerro 3 8 27
Kentucky 0 5 16
Muenster 2 5 10
Newport 4 1 9
Anatum* 1 4 8
Montevideo 7 2 7
Meleagridis 2 1 6
Mbandaka 0 3 5
Typhimurium* 0 1 4
Dublin 1 2 3
Senftenberg 0 1 2
Give* 0 0 2
Untypable 3 0 2
Agona 0 1 1
Infantis 0 1 1
Schwarzengrund 0 1 1
Derby 0 0 1
Muenchen 0 0 1
Reading 0 0 1
Saintpaul 0 0 1
Soerenga 0 0 1
Thompson 0 0 1
*Includes variant species (e.g., Typhimurium var. 5-, formerly Typhimurium var. Copenhagen).

USDA APHIS VS / 13
Section I: Population Estimates—B. Listeria Detection in Bulk-tank Milk
B. B. B. B. B. LisLisLisLisListtttterererereriaiaiaiaia De De De De Detttttection in Bulkection in Bulkection in Bulkection in Bulkection in Bulk-t-t-t-t-tank Milkank Milkank Milkank Milkank Milk
1. Background Listeria species are gram-positive bacteria that
can cause serious infections in humans. Listeria
monocytogenes is the most important Listeria
species in terms of public health risk and
frequency of appearance in foodstuffs.
L. monocytogenes is widespread in the
environment. The main source of infection for
ruminants is spoiled silage, but cattle may also
ingest the organism by fecal-oral transmission.
Adult cattle observed with clinical disease
(listeriosis) most often have encephalitis, a
nervous system disorder. Signs of disease in
cattle include facial paralysis, depression,
circling, and abortion.
Although the occurrence of human listeriosis is
generally infrequent, it often leads to serious
illness. Listeriosis in humans can be
accompanied by fever, muscle aches, nausea,
and diarrhea. If infection spreads to the nervous
system, symptoms such as headache, stiff neck,
loss of balance, or convulsions can occur.
Infections during pregnancy can lead to
miscarriage or stillbirth. Pregnant women, the
elderly, and those with immunosuppression are
most susceptible to listeriosis. In the United
States, the annual cost of illness in humans due
to L. monocytogenes is estimated at $8.8 billion
(Scharff, 2010). Estimates indicate that
approximately 2,500 listeriosis cases in humans
occur each year in the United States, with nearly
all cases attributed to a food source (Mead et al.,
1999). Approximately 92 percent of individuals
with illness caused by L. monocytogenes
listeriosis are hospitalized (20 percent of these
cases are fatal), making L. monocytogenes
responsible for the highest hospitalization rate
among foodborne pathogens (Mead et al.,
1999).
It is not possible to remove all Listeria
organisms from the environment.
L. monocytogenes is found in soil and water,
which can lead to contamination of fruits,
vegetables, and other foods typically eaten raw.
Listeria is killed by pasteurization and cooking
but is relatively cold tolerant. L. monocytogenes
survives refrigeration temperatures and can
grow under these conditions, an unusual
characteristic among foodborne pathogens
(Walker et al., 1990). With regard to milk and
dairy products, listeriosis is most often
associated with products made from
unpasteurized milk. Because of its ability to
grow under refrigeration, contamination of cold
cuts or other ready-to-eat foods after processing
is a concern and has been associated with human
illness.
Pasteurizing raw milk is an important public
health tool for foodborne disease prevention.
Because of pasteurization, contamination of
dairy products currently accounts for a small
percentage of foodborne illness in the United
States. However, it is clear that consuming raw
milk and products made with raw milk present a
risk of foodborne illness to humans.
14 / Dairy 2007
Section I: Population Estimates—B. Listeria Detection in Bulk-tank Milk
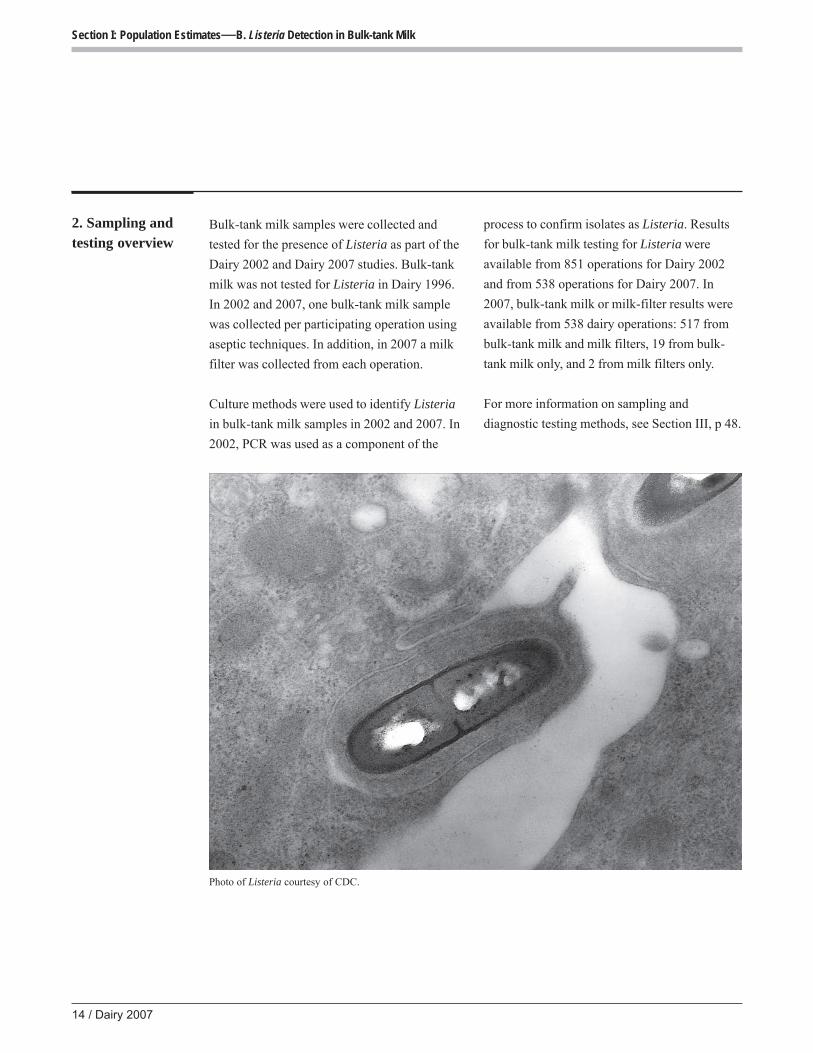
2. Sampling andtesting overview
Bulk-tank milk samples were collected and
tested for the presence of Listeria as part of the
Dairy 2002 and Dairy 2007 studies. Bulk-tank
milk was not tested for Listeria in Dairy 1996.
In 2002 and 2007, one bulk-tank milk sample
was collected per participating operation using
aseptic techniques. In addition, in 2007 a milk
filter was collected from each operation.
Culture methods were used to identify Listeria
in bulk-tank milk samples in 2002 and 2007. In
2002, PCR was used as a component of the
process to confirm isolates as Listeria. Results
for bulk-tank milk testing for Listeria were
available from 851 operations for Dairy 2002
and from 538 operations for Dairy 2007. In
2007, bulk-tank milk or milk-filter results were
available from 538 dairy operations: 517 from
bulk-tank milk and milk filters, 19 from bulk-
tank milk only, and 2 from milk filters only.
For more information on sampling and
diagnostic testing methods, see Section III, p 48.
Photo of Listeria courtesy of CDC.

USDA APHIS VS / 15
Section I: Population Estimates—B. Listeria Detection in Bulk-tank Milk
3. Prevalence The percentage of operations on which a bulk-
tank milk sample tested positive for
L. monocytogenes was similar in 2002 and 2007
(3.8 and 3.7 percent, respectively). In Dairy
2007, the percentage of operations on which a
milk filter tested positive for any Listeria
species (28.3 percent) was more than three times
the percentage of operations on which a bulk-
tank milk sample tested positive for any Listeria
species (9.0 percent).
The percentage of operations on which a bulk-
tank milk sample tested positive for
L. monocytogenes was similar across herd sizes
in 2002 and 2007.
a. Percentage of operations on which a bulk-tank milk and/or a milk filter sample tested positive for Listeria, by sample type
Dairy 2002 Dairy 2007
L. mono-
cytogenes Any Listeria L. mono-
cytogenes
Sample Type Pct. Std. Error Pct.
Std. Error Pct.
Std. Error
Bulk-tank milk 3.8 (0.7) 9.0 (1.9) 3.7 (1.2)
Milk filter NA 28.3 (2.9) 5.1 (1.2)
Bulk-tank milk or milk filter NA 32.1 (2.9) 7.1 (1.5)
b. Percentage of operations on which a bulk-tank milk sample tested positive for L. monocytogenes, by herd size
Herd Size (Number of Cows)
Small (Fewer
than 100) Medium
(100–499) Large
(500 or More) All
Operations
Study Pct. Std. Error Pct.
Std. Error Pct.
Std. Error Pct.
Std. Error
Dairy 2002 3.0 (0.9) 5.4 (1.2) 7.8 (2.4) 3.8 (0.7)
Dairy 2007 2.3 (1.4) 7.5 (2.5) 4.0 (1.7) 3.7 (1.2)

16 / Dairy 2007
Section I: Population Estimates—B. Listeria Detection in Bulk-tank Milk
There were no regional differences in 2002 and
2007 in the percentage of operations on which a
bulk-tank milk sample tested positive for
L. monocytogenes.
c. Percentage of operations on which a bulk-tank milk sample tested positive for L. monocytogenes, by region
Region
East West
Study Percent Std. Error Percent Std. Error
Dairy 2002 3.9 (0.8) 2.9 (1.4)
Dairy 2007 3.3 (1.2) 8.3 (4.2)

USDA APHIS VS / 17
Section II: Pathogen Detection in Feces—A. Salmonella
Section II: PSection II: PSection II: PSection II: PSection II: PatatatatathoghoghoghoghogenenenenenDeDeDeDeDetttttection in Fection in Fection in Fection in Fection in FecesecesecesecesecesAAAAA. . . . . SalmonellaSalmonellaSalmonellaSalmonellaSalmonella
1. Sampling andtesting overview
NAHMS has examined Salmonella occurrence
using individual fecal samples from dairy cows
in three separate studies: Dairy 1996, Dairy
2002, and Dairy 2007. Typically, NAHMS
studies generate population-based estimates, and
appropriate sample sizes are used to arrive at
such estimates. Field resources, laboratory
capacity, and the expense of culturing samples
make it difficult to provide a national estimate
of Salmonella prevalence based on fecal
culturing of individual animals. Therefore, for
the Salmonella estimates in this section, all three
NAHMS dairy studies used a sample of
approximately 100 operations, which is not an
optimal sample size for providing national
estimates of prevalence. Despite this limitation,
the NAHMS studies provide valuable
information on Salmonella occurrence and
antimicrobial susceptibility patterns on
U.S. dairies and represent the only national
examination of Salmonella on dairy operations
in the United States. Other research studies have
examined Salmonella occurrence in dairy cattle
but have been limited to specific regions of the
United States.
At the time of sampling, records were kept as to
whether each cow was sick, healthy (from the
milking string), scheduled for culling (within
7 days of leaving the operation), or dry (dry
cows were sampled only in Dairy 1996 and
Dairy 2002). Dry cows were grouped with
healthy cows in the following estimates. Dairy
1996 compared the prevalence of Salmonella in
milk cows on-farm to that of cows on-farm that
were scheduled for culling within the next
7 days and to cull cows at markets.
Dairy 2007 evaluated strategies for detecting
Salmonella using fecal samples from individual
cows, fecal samples pooled from five cows, and
composite fecal samples from the dairy
environment. To allow for comparison across
the three studies, results presented in this report
are primarily limited to healthy cows. An
operation was classified as infected if one or
more fecal samples were culture positive for
Salmonella. The following table presents an
overview of the sampling procedures used for
the three dairy studies.
For more information on sampling and
diagnostic testing methods, see Section III, p 48.

18 / Dairy 2007
Section II: Pathogen Detection in Feces—A. Salmonella
Salmonella fecal sampling methods, by study
Study
Number of Operations Sampled*
Sampling Period
Number of Samples per
Operation Notes
Dairy 1996
91 dairy operations/ 19 States
Feb. 26 to July 10, 1996
40 or 50, depending on herd size, plus all cows scheduled for culling
All samples were taken rectally from individual cows. There were no specific targets as to the number of sick, dry, or milking string cows, other than the sample was to be representative of the cows on hand on the day of the visit. Cow type was noted at the time of collection. Dairies with 30–99 cows: Operations were visited once. Up to 40 fecal samples were collected, which included samples from all cows scheduled for culling present on the day of the visit. Dairies with 100 or more cows: Operations were visited three times. During one visit, 50 cows (from milking string, dry, or sick) were sampled along with up to 20 cows scheduled for culling in the next 7 days. On 2 other visits, up to 20 samples were taken from cows scheduled for culling in the next 7 days.
97 cull cow markets/ 20 States
Feb. 26 to July 10, 1996
25 Twenty-five fresh fecal samples per market—either by rectal retrieval from individual cows or from pen floors if restraining facilities were not available.
Dairy 2002
97 dairy operations/ 21 States
Mar. 27 to Sept. 25, 2002
40
The goal was to collect 40 individual fecal samples during a single visit, all via rectal retrieval. If the herd had fewer than 40 cows, all cows were sampled. There were no specific targets for number of sick, dry, or milking string cows to be sampled, but cow type was noted at the time of collection.
Dairy 2007
121 dairy operations/ 17 States
Feb. 28 to Aug. 30, 2007
35
The goal was to collect 35 individual fecal samples during a single visit, all via rectal retrieval. Up to five sick cows and up to five cows scheduled for culling (within 7 days of leaving the operation) were sampled, with the remainder (up to 35) being from cows with saleable milk.
260 dairy operations/ 17 States
Feb. 28 to Aug. 30, 2007
6
Manure/slurry (composite fecal) samples from six different adult cow areas where manure accumulates were taken (area samples). Each area sample was composed of about 4 oz of manure/slurry from each of six sites within the area. Areas recommended for sampling included common alleyways, common pens, exits from parlors, floors of holding pens, flush water, gutter cleaner, lagoons or manure pits, and manure spreaders.
*Operations with 30 or more dairy cows.

USDA APHIS VS / 19
Section II: Pathogen Detection in Feces—A. Salmonella
2. Prevalence The table below presents both herd- and animal-
level Salmonella prevalence estimates from the
three NAHMS dairy studies. For purposes of
comparison, estimates are limited to healthy
cows because these sample numbers remained
relatively consistent across the three studies.
Culture methods were similar for the three
NAHMS dairy studies. In 2007, the percentage
of Salmonella-positive operations was almost
double that in 1996, and the percentage of
Salmonella-positive cows more than doubled
over the same time period. Differences in types
of operations sampled by region and herd size
might account for some of the differences
among the three studies; however, it is possible
that Salmonella is becoming more common on
U.S. dairies.
a. Percentage of operations and percentage of cows fecal-culture positive for Salmonella1
Study Operations2 Cows
Dairy 1996 20.0 (18/90) 5.4 (194/3,585)
Dairy 2002 30.9 (30/97) 7.1 (259/3,645)
Dairy 2007 39.7 (48/121) 13.7 (523/3,804) 1Only cows healthy at the time of collection are included. 2Operations with at least one culture-positive cow were considered positive.
Photo courtesy of Judy Rodriguez

20 / Dairy 2007
Section II: Pathogen Detection in Feces—A. Salmonella

USDA APHIS VS / 21
Section II: Pathogen Detection in Feces—A. Salmonella
In several previous studies, operations with 100
or more dairy cows have been more likely than
operations with fewer than 100 cows to be
Salmonella positive (Warnick et al., 2001; Wells
et al., 2001; Huston et al., 2002; Fossler et al.,
2004; Blau et al., 2005; Davison et al., 2006;
Cummings et al., 2009a). This finding was true
in all three NAHMS dairy studies: the
percentage of large operations culture positive
for Salmonella was at least double that of small
operations.
b. Percentage of operations1 fecal-culture positive for Salmonella, by herd size2
Herd Size (Number of Cows)
Study Small
(Fewer than 100) Medium
(100–499) Large
(500 or More)
Dairy 1996 4.8 (2/42) 29.0 (9/31) 41.2 (7/17)
Dairy 2002 18.2 (6/33) 28.2 (11/39) 52.0 (13/25)
Dairy 2007 24.3 (9/37) 44.7 (21/47) 48.7 (18/37) 1Operations with at least one culture-positive cow were considered positive. 2Only cows healthy at the time of collection are included.
22 / Dairy 2007
Section II: Pathogen Detection in Feces—A. Salmonella
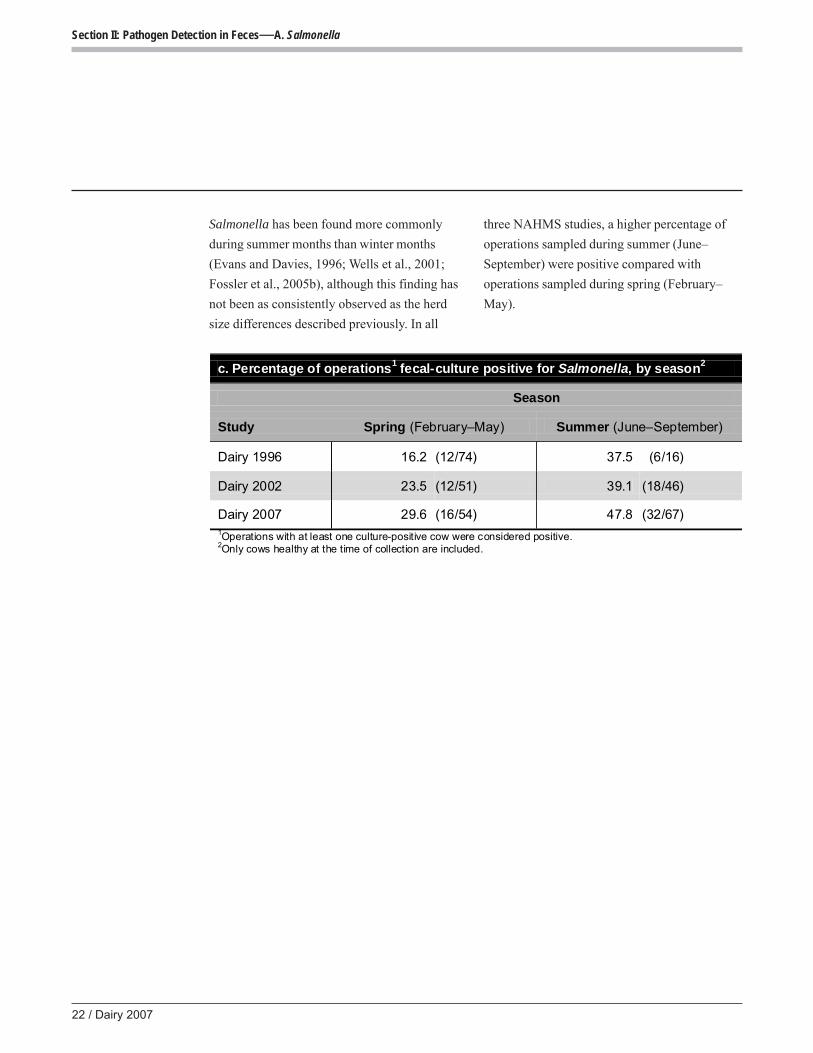
Salmonella has been found more commonly
during summer months than winter months
(Evans and Davies, 1996; Wells et al., 2001;
Fossler et al., 2005b), although this finding has
not been as consistently observed as the herd
size differences described previously. In all
three NAHMS studies, a higher percentage of
operations sampled during summer (June–
September) were positive compared with
operations sampled during spring (February–
May).
c. Percentage of operations1 fecal-culture positive for Salmonella, by season2
Season
Study Spring (February–May) Summer (June–September)
Dairy 1996 16.2 (12/74) 37.5 (6/16)
Dairy 2002 23.5 (12/51) 39.1 (18/46)
Dairy 2007 29.6 (16/54) 47.8 (32/67) 1Operations with at least one culture-positive cow were considered positive. 2Only cows healthy at the time of collection are included.

USDA APHIS VS / 23
Section II: Pathogen Detection in Feces—A. Salmonella
There were no consistent trends in the
percentage of Salmonella-positive operations by
region. In 1996 and 2002, a higher percentage
of operations in the West region than in the East
region were Salmonella positive. In contrast, in
2007 a higher percentage of operations in the
East region than in the West region were
Salmonella positive (43.6 and 20.0 percent,
respectively). It is difficult to draw any
conclusions with regard to regional differences
while ignoring herd size differences. As shown
in table on the next page, during Dairy 1996 and
Dairy 2002 there were fewer participating
operations with 500 or more cows in the East
region than there were in Dairy 2007. Thus, any
apparent trends with regard to regional
differences are likely due to herd sizes within
each region.
d. Percentage of operations1 fecal-culture positive for Salmonella, by region2
Region
Study East West
Dairy 1996 13.8 (9/65) 36.0 (9/25)
Dairy 2002 26.1 (18/69) 42.9 (12/28)
Dairy 2007 43.6 (44/101) 20.0 (4/20) 1Operations with at least one culture-positive cow were considered positive. 2Only cows healthy at the time of collection are included.

24 / Dairy 2007
Section II: Pathogen Detection in Feces—A. Salmonella
For the West region in 1996 and 2002, a higher
percentage of operations with 500 or more cows
were Salmonella positive compared with
operations with fewer than 500 cows. For the
East region in 2007, a higher percentage of
operations with 500 or more cows were
Salmonella positive compared with operations
with fewer than 500 cows (65.2 and
37.2 percent, respectively). In the West region in
2007, there was little difference by herd size in
the percentage of Salmonella-positive
operations, which was also true in the East
region in 1996 and 2002, although there were
relatively few participating operations with 500
or more cows in the East region in 1996 and
2002.
e. Percentage of operations1 fecal-culture positive for Salmonella, by herd size and by region2
Dairy 1996 Dairy 2002 Dairy 2007
Region
Herd size (Number of Cows) East West East West East West Fewer than 500
13.3 (8/60) 23.1 (3/13) 25.8 (16/62) 10.0 (1/10) 37.2 (29/78) 16.7 (1/6)
500 or more 20.0 (1/5) 50.0 (6/12) 28.6 (2/7) 61.1 (11/18) 65.2 (15/23) 21.4 (3/14) 1Operations with at least one culture-positive cow were considered positive. 2Only cows healthy at the time of collection are included.

USDA APHIS VS / 25
Section II: Pathogen Detection in Feces—A. Salmonella
In all three dairy studies, a lower percentage of
healthy cows were Salmonella positive on small
operations than on medium and large operations.
Large operations had the highest percentage of
Salmonella-positive cows in 1996 and 2002.
In 1996 and 2002, a higher percentage of
healthy cows were positive for Salmonella in the
West region than in the East region. In contrast,
in 2007 a higher percentage of cows were
positive for Salmonella in the East region than
in the West region; however, a much smaller
number of cows were sampled in the West
region than in the East region in 2007 (580 and
3,224, respectively).
f. Percentage of healthy cows fecal-culture positive for Salmonella, by herd size
Herd Size (Number of Cows)
Study Small
(Fewer than 100) Medium
(100–499) Large
(500 or More)
Dairy 1996 0.6 (9/1,494) 6.3 (81/1,292) 13.0 (104/799)
Dairy 2002 1.8 (21/1,152) 7.7 (118/1,535) 12.5 (120/958)
Dairy 2007 5.5 (66/1,209) 17.9 (270/1,508) 17.2 (187/1,087)
g. Percentage of healthy cows fecal-culture positive for Salmonella, by region
Region
Study East West
Dairy 1996 1.6 (39/2,429) 13.4 (155/1,156)
Dairy 2002 5.3 (136/2,569) 11.4 (123/1,076)
Dairy 2007 15.5 (499/3,224) 4.1 (24/580)

26 / Dairy 2007
Section II: Pathogen Detection in Feces—A. Salmonella
One of the goals of the Dairy 1996 study was to
evaluate whether cows scheduled for culling
were more likely to be Salmonella positive than
other cows on the operation. Aside from cows
scheduled for culling, other cows sampled were
to be representative of all cows on the operation
on the day of sampling, including sick cows, dry
cows, and cows in the milking string. It was
noted at the time of sampling whether a cow was
sick, dry, from the milking string, or scheduled
for culling, but there were no requirements for
sampling a specified number of sick cows.
Likewise, for Dairy 2002 there were no
requirements for sampling different types of
cows, but it was noted at the time of sampling
whether a cow was sick, scheduled for culling
within 7 days, dry, or from the milking string. In
contrast, in the Dairy 2007 study there were
specific instructions to collect samples from up
to 5 sick cows and up to 5 cows scheduled for
culling, with the remainder of samples—up to
35—taken from cows with saleable milk.
The following results should be interpreted with
these sampling differences in mind. For all three
NAHMS studies, a higher percentage of cows
designated as sick on the day of the visit were
culture positive for Salmonella compared with
cows designated as healthy. These results are
supported by a previous study which collected
samples from preweaned calves, sick cows,
cows scheduled to be culled, periparturient cows
(within 14 days of calving), and healthy cows
and found that sick cows had the highest odds of
being Salmonella positive (Fossler, 2005a). It is
possible that the primary cause of illness in the
sick cattle was salmonellosis, or that battling
another illness or condition may make the
animals more susceptible to secondary
infections with Salmonella.
In 1996, a higher percentage of cows scheduled
for culling were culture positive for Salmonella
compared with healthy cows. In Dairy 2007,
there was no difference in Salmonella
prevalence between cows scheduled for culling
and healthy cows.
h. Percentage of cows fecal-culture positive for Salmonella, by cow status
Cow Status Dairy 1996 Dairy 2002 Dairy 2007
Healthy 5.4 (194/3,585) 7.1 (259/3,645) 13.7 (523/3,804)
Sick 7.3 (4/55) 30.8 (8/26) 18.2 (40/220)
Scheduled for culling
18.1 (121/668) 0.0 (0/17) 12.6 (17/135)
All 7.4 (319/4,308) 7.2 (267/3,688) 13.9 (580/4,159)

USDA APHIS VS / 27
Section II: Pathogen Detection in Feces—A. Salmonella
Longitudinal studies with repeated sampling
suggest that Salmonella can be found on almost
all dairy operations. A study in which 110
dairies were sampled 5 times over the course of
1 year found 92.7 percent of operations to be
culture positive for Salmonella (Fossler et al.,
2004). In that study, between 31 and 55 percent
of farms were positive on a per-visit basis and
25.0 percent of dairies accounted for 75 percent
of the Salmonella-positive samples, implying
that a relatively small percentage of dairy
operations account for a majority of Salmonella-
positive cattle.
Each of the three NAHMS dairy studies
sampled operations at a single point in time, and
the majority of operations were negative when
tested for Salmonella. On many of the
operations that tested positive for Salmonella,
less than 10 percent of the cows sampled tested
positive. Among culture-positive operations in
1996, 2002, and 2007, the median within-herd
prevalence was 6.4, 10.3, and 21.9 percent,
respectively. Among culture-positive operations
in 1996, 2002, and 2007, the 75th percentile for
within-herd prevalence was 40.0, 34.6, and
60.0 percent, respectively.
In each of the NAHMS dairy studies,
approximately 10 percent of the sampled
operations accounted for 75 percent or more of
the positive samples from healthy cows. In
1996, 4 of the 90 operations accounted for
77.8 percent of the positive samples from
healthy cows; in 2002, 9 of the 97 operations
accounted for 74.5 percent of the positive
samples from healthy cows; and in 2007, 16 of
the 121 operations accounted for 74.6 percent of
the positive samples from healthy cows.
i. Number of operations by within-herd prevalence of Salmonella*
Within-herd Prevalence Dairy 1996 Dairy 2002 Dairy 2007
0.0 72 67 73
0.1 to 10.0 11 16 20
10.1 to 20.0 1 2 4
20.1 to 30.0 1 3 4
30.1 to 40.0 1 3 3
40.1 to 50.0 0 1 2
50.1 to 60.0 0 3 4
60.1 to 70.0 1 0 2
70.1 to 80.0 0 0 1
80.1 to 90.0 3 1 4
90.1 to 100.0 0 1 4
Total 90 97 121
*Only cows healthy at the time of collection were included.
28 / Dairy 2007
Section II: Pathogen Detection in Feces—A. Salmonella
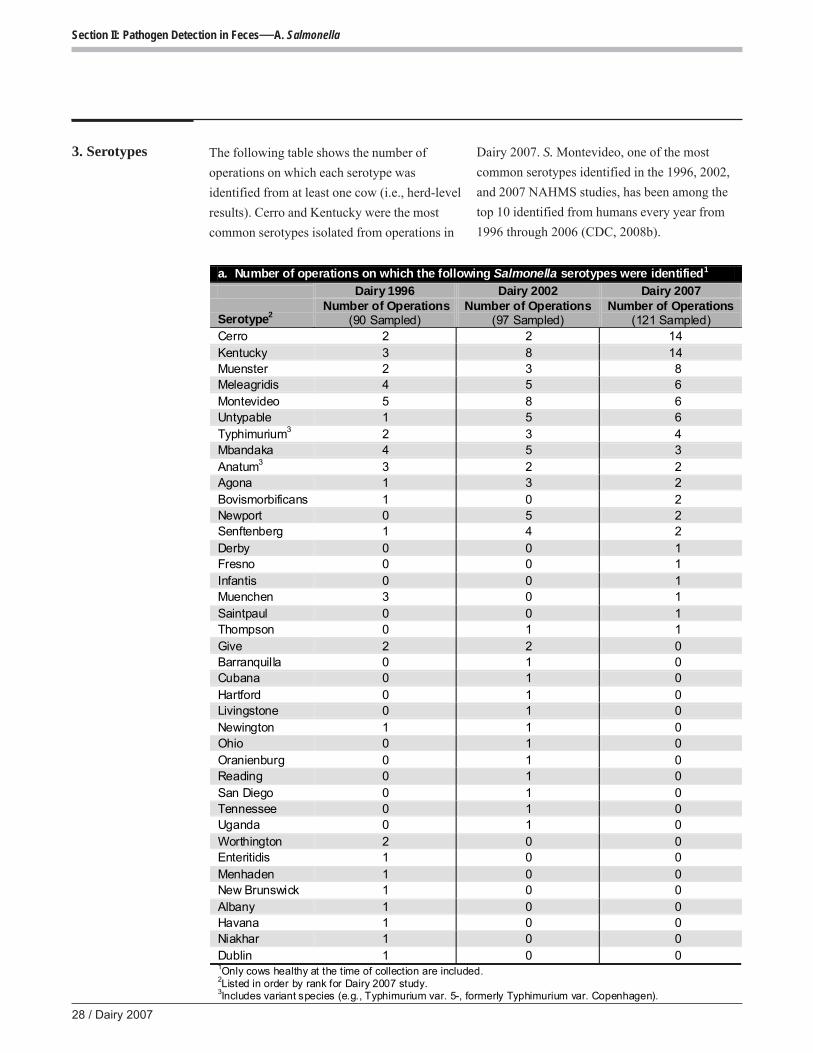
3. Serotypes The following table shows the number of
operations on which each serotype was
identified from at least one cow (i.e., herd-level
results). Cerro and Kentucky were the most
common serotypes isolated from operations in
Dairy 2007. S. Montevideo, one of the most
common serotypes identified in the 1996, 2002,
and 2007 NAHMS studies, has been among the
top 10 identified from humans every year from
1996 through 2006 (CDC, 2008b).
a. Number of operations on which the following Salmonella serotypes were identified1
Dairy 1996 Dairy 2002 Dairy 2007
Serotype2 Number of Operations
(90 Sampled) Number of Operations
(97 Sampled) Number of Operations
(121 Sampled) Cerro 2 2 14 Kentucky 3 8 14 Muenster 2 3 8 Meleagridis 4 5 6 Montevideo 5 8 6 Untypable 1 5 6 Typhimurium3 2 3 4 Mbandaka 4 5 3 Anatum3 3 2 2 Agona 1 3 2 Bovismorbificans 1 0 2 Newport 0 5 2 Senftenberg 1 4 2 Derby 0 0 1 Fresno 0 0 1 Infantis 0 0 1 Muenchen 3 0 1 Saintpaul 0 0 1 Thompson 0 1 1 Give 2 2 0 Barranquilla 0 1 0 Cubana 0 1 0 Hartford 0 1 0 Livingstone 0 1 0 Newington 1 1 0 Ohio 0 1 0 Oranienburg 0 1 0 Reading 0 1 0 San Diego 0 1 0 Tennessee 0 1 0 Uganda 0 1 0 Worthington 2 0 0 Enteritidis 1 0 0 Menhaden 1 0 0 New Brunswick 1 0 0 Albany 1 0 0 Havana 1 0 0 Niakhar 1 0 0 Dublin 1 0 0 1Only cows healthy at the time of collection are included. 2Listed in order by rank for Dairy 2007 study. 3Includes variant species (e.g., Typhimurium var. 5-, formerly Typhimurium var. Copenhagen).

USDA APHIS VS / 29
Section II: Pathogen Detection in Feces—A. Salmonella
The top 10 serotypes identified from Salmonella
isolates for each of the three NAHMS dairy
studies are listed in the following table.
Serotypes not among the top 10 were grouped
into the “other” category. Three serotypes—
Meleagridis, Montevideo, and Kentucky—
ranked in the top five serotypes indentified in
1996, 2002, and 2007. The top 10 account for
81.1, 82.7, and 94.6 percent of total isolates in
1996, 2002, and 2007, respectively.
b. Number of Salmonella isolates from healthy cows, by serotype
Dairy 1996 Dairy 2002 Dairy 2007
Serotype No. Isolates
(n=228) Serotype No. Isolates
(n=283) Serotype No. Isolates
(n=556)
Montevideo 49 Meleagridis 71 Cerro 157
Kentucky 29 Montevideo 34 Kentucky 130
Menhaden 27 Typhimurium* 29 Montevideo 66
Cerro 17 Kentucky 28 Mbandaka 47
Meleagridis 16 Agona 21 Meleagridis 40
Mbandaka 12 Mbandaka 12 Derby 27
Anatum 11 Ohio 12 Muenster 18
New Brunswick 9 Senftenberg 11 Anatum 17
Muenster 8 Cerro 8 Senftenberg 13
Albany 7 Newport 8 Newport 11
Other 43 Other 49 Other 30
*Includes variant species (e.g., Typhimurium var. 5-, formerly Typhimurium var. Copenhagen).

30 / Dairy 2007
Section II: Pathogen Detection in Feces—A. Salmonella
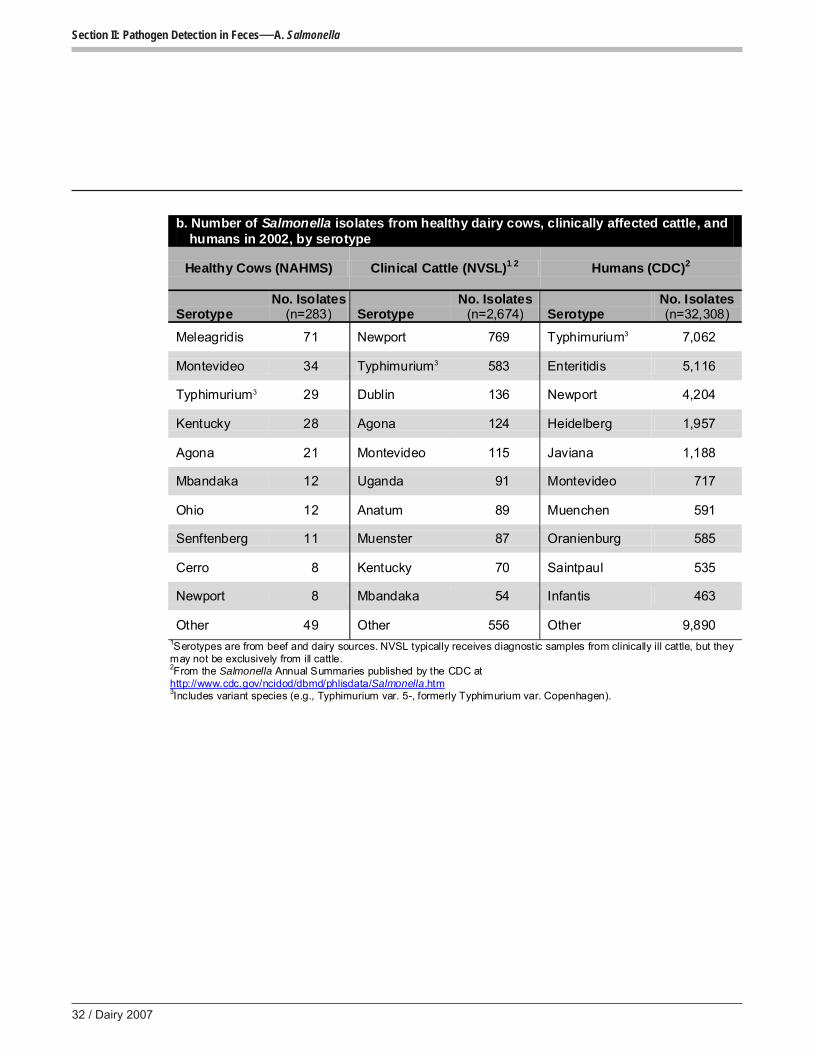
4. Comparison ofserotypes isolatedfrom cattle andhumans
The following tables (a. through c.) compare
Salmonella serotypes identified from cattle and
humans in 1996, 2002, and 2007. Serotype data
on healthy cows were taken from the respective
NAHMS studies. Data on clinically ill cows
originated from diagnostic samples submitted to
the National Veterinary Services Laboratories
(NVSL). Serotype data on humans were
provided by the CDC through the Public Health
Laboratory Information System. Salmonellosis
is on the CDC’s list of Nationally Notifiable
Infectious Diseases.
The two most common serotypes identified in
humans were S. Typhimurium and S. Enteritidis
in 1996, 2002, and 2007. Sources of individual
cases of salmonellosis in humans are often not
identified, and the role of livestock in human
cases of salmonellosis is unknown. There are
many avenues other than food of animal origin,
such as produce, by which people can get sick.
Poultry is generally considered the most
common source of salmonellosis in humans
from S. Enteritidis. Hogs were the most common
source of S. Typhimurium isolates among
clinical animal submissions to NVSL in the most
recent report in 2006. S. Montevideo was the
only serotype that ranked among the 10 most
common serotypes found in healthy cows,
clinically ill cows, and humans in 1996, 2002,
and 2007. However, S. Montevideo was a
relatively uncommon serotype in humans,
making up only 2 to 3 percent of isolates
identified from humans in 1996, 2002, and
2007. S. Typhimurium was among the two most
common serotypes identified in clinically ill
cattle and humans in all 3 years but was
uncommon among healthy cows. A recent study
in which dairy herds were monitored for
approximately 1 year for clinical signs of
salmonellosis found S. Newport and
S. Typhimurium to be the most common
serotypes identified (Cummings, 2009b), which
coincides with the NVSL results on clinically ill
cattle. S. Typhimurium and S. Newport were
among the four most common serotypes
identified from humans in all 3 years. Clinically
affected cattle may pose a greater threat to
public health than healthy cattle (Cummings et
al., 2009b) However, these serotype data alone
do not provide sufficient evidence of
transmission of Salmonella from cattle to
humans.

USDA APHIS VS / 31
Section II: Pathogen Detection in Feces—A. Salmonella
a. Number of Salmonella isolates from healthy dairy cows, clinically affected cattle, andhumans in 1996, by serotype
Healthy Cows (NAHMS) Clinical Cattle (NVSL)1 2 Humans (CDC)2
Serotype No. Isolates
(n=228) Serotype No. Isolates
(n=4,183) Serotype No. Isolates (n=39,035)
Montevideo 49 Typhimurium3 1,081 Enteritidis 9,570
Kentucky 29 Montevideo 589 Typhimurium3 9,501
Menhaden 27 Cerro 239 Heidelberg 1,998
Cerro 17 Kentucky 230 Newport 1,985
Meleagridis 16 Anatum 228 Montevideo 1,227
Mbandaka 12 Dublin 213 Javiana 749
Anatum 11 Muenster 201 Oranienburg 690
New Brunswick 9 Meleagridis 172 Hadar 658
Muenster 8 Menhaden 118 Agona 606
Albany 7 Give 118 Muenchen 595
Other 43 Other 994 Other 11,4561Serotypes are from beef and dairy sources. NVSL typically receives diagnostic samples from clinically ill cattle, but they may not be exclusively from ill cattle.2From the Salmonella Annual Summaries published by the CDC at http://www.cdc.gov/ncidod/dbmd/phlisdata/Salmonella.htm 3Includes variant species (e.g., Typhimurium var. 5-, formerly Typhimurium var. Copenhagen).
32 / Dairy 2007
Section II: Pathogen Detection in Feces—A. Salmonella
b. Number of Salmonella isolates from healthy dairy cows, clinically affected cattle, andhumans in 2002, by serotype
Healthy Cows (NAHMS) Clinical Cattle (NVSL)1 2 Humans (CDC)2
Serotype No. Isolates
(n=283) Serotype No. Isolates
(n=2,674) Serotype No. Isolates (n=32,308)
Meleagridis 71 Newport 769 Typhimurium3 7,062
Montevideo 34 Typhimurium3 583 Enteritidis 5,116
Typhimurium3 29 Dublin 136 Newport 4,204
Kentucky 28 Agona 124 Heidelberg 1,957
Agona 21 Montevideo 115 Javiana 1,188
Mbandaka 12 Uganda 91 Montevideo 717
Ohio 12 Anatum 89 Muenchen 591
Senftenberg 11 Muenster 87 Oranienburg 585
Cerro 8 Kentucky 70 Saintpaul 535
Newport 8 Mbandaka 54 Infantis 463
Other 49 Other 556 Other 9,8901Serotypes are from beef and dairy sources. NVSL typically receives diagnostic samples from clinically ill cattle, but they may not be exclusively from ill cattle.2From the Salmonella Annual Summaries published by the CDC at http://www.cdc.gov/ncidod/dbmd/phlisdata/Salmonella.htm 3Includes variant species (e.g., Typhimurium var. 5-, formerly Typhimurium var. Copenhagen).

USDA APHIS VS / 33
Section II: Pathogen Detection in Feces—A. Salmonella
c. Number of Salmonella isolates from healthy dairy cows, clinically affected cattle, andhumans in 2007, by serotype
Healthy Cows (NAHMS) Clinical Cattle (NVSL)1 2 Humans (CDC)2
Serotype No. Isolates
(n=556) Serotype No. Isolates
(n=3,770) Serotype No. Isolates (n=40,666)
Cerro 157 Newport 436 Typhimurium3 6,872
Kentucky 130 Typhimurium3 425 Enteritidis 6,740
Montevideo 66 Orion var. 15+,34+
365 Newport 3,373
Mbandaka 47 Dublin 335 Heidelberg 1,495
Meleagridis 40 Montevideo 293 Javiana 1,433
Derby 27 Agona 239 I 4,[5],12:i- 1,200
Muenster 18 Anatum 210 Montevideo 1,061
Anatum 17 Kentucky 164 Muenchen 753
Senftenberg 13 Muenster 163 Oranienburg 719
Newport 11 Cerro 155 Mississippi 604
Other 30 Other 985 Other 16,4161Serotypes are from beef and dairy sources. NVSL typically receives diagnostic samples from clinically ill cattle, but they may not be exclusively from ill cattle.2From the Salmonella Annual Summaries published by the CDC at http://www.cdc.gov/ncidod/dbmd/phlisdata/Salmonella.htm 3Includes variant species (e.g., Typhimurium var. 5-, formerly Typhimurium var. Copenhagen).

34 / Dairy 2007
Section II: Pathogen Detection in Feces—A. Salmonella
5. Antimicrobialsusceptibility
Salmonella isolates from healthy cows showed
relatively little resistance to antimicrobial agents
in 1996, 2002, and 2007. Of all Salmonella
isolates found in healthy cows and tested for
antimicrobial susceptibility in 1996, 2002, and
2007, 92.3, 82.3, and 96.6 percent, respectively,
were susceptible to all antimicrobials tested. In
each of the studies, no more than 5 percent of
Salmonella isolates from healthy cows were
resistant to two or more antimicrobials.
Photo of S. Typhimurium courtesy of Agriculture Research Service
a. Percentage of Salmonella isolates by number of antimicrobials in which antimicrobial resistance1 was observed2
Study (n=Number of Isolates)
Susceptible to All
Antimicrobials
Resistant to a Single
Antimicrobial
Resistant to Two or More
Antimicrobials Total
Dairy 1996 (n=220) 92.3 3.6 4.1 100.0
Dairy 2002 (n=283) 82.3 12.7 5.0 100.0
Dairy 2007 (n=556) 96.6 0.7 2.7 100.0 1Intermediate isolates were classified as susceptible. 2Only cows healthy at the time of sample collection are included.

USDA APHIS VS / 35
Section II: Pathogen Detection in Feces—A. Salmonella
Resistance to amikacin, ciprofloxacin, nalidixic
acid, and trimethoprim-sulfamethoxazole was
not observed in any of the three dairy studies.
Resistance to ceftriaxone was observed in Dairy
2002 and Dairy 2007, but it was observed in
only one isolate in Dairy 2007. Salmonella
resistance to ceftriaxone is of interest because it
is commonly used to treat severe Salmonella
infections in children (Zhao et al., 2003).
b. Percentage of resistant1 isolates from all Salmonella isolates tested for antimicrobial susceptibility, by antimicrobial2
Antimicrobial Dairy 1996
(n=220) Dairy 2002
(n=283) Dairy 2007
(n=556)
Amikacin (AMI) 0.0 0.0 0.0
Amoxicillin-clavulanic acid (AMO)
0.9 4.9 1.8
Ampicillin (AMP) 3.6 4.6 2.2
Apramycin (APR) 0.0 NA NA
Cefoxitin (FOX) NA 3.9 1.6
Ceftiofur (TIO) 0.0 4.6 2.0
Ceftriaxone (AXO) 0.0 2.5 0.2
Cephalothin (CEP) 2.3 4.9 NA
Chloramphenicol (CHL) 1.4 4.6 2.5
Ciprofloxacin (CIP) 0.0 0.0 0.0
Gentamicin (GEN) 0.0 0.7 0.2
Kanamycin (KAN) 1.4 0.7 0.0
Nalidixic acid (NAL) 0.0 0.0 0.0
Streptomycin (STR) 4.1 9.9 2.7
Sulfamethoxazole3 (SUL) 1.8 3.9 2.3
Tetracycline (TET) 2.3 12.4 3.1
Ticarcillin (TIC) 3.2 NA NA
Trimethoprim-sulfamethoxazole (TRI) 0.0 0.0 0.0 1Intermediate isolates were classified as susceptible. Resistance break points were those current at the time of sample collection. Break points for extended spectrum cephalosporins changed in 2010 and testing was done prior to this change. 2Only cows healthy at the time of collection are included. 3Sulfisoxazole replaced sulfamethoxazole in 2007.

36 / Dairy 2007
Section II: Pathogen Detection in Feces—A. Salmonella
6. Multidrugresistance patterns
There were 53 multidrug-resistant isolates
identified over the 3 study years. In 1996 and
2002, more S. Typhimurium isolates were
resistant to multiple drugs compared with other
serotypes. In 2007, however, no multidrug-
resistant S. Typhimurium was observed. Dairy
2007 was the first NAHMS dairy study in which
multidrug resistance was observed in
S. Montevideo, which was one of the top three
serotypes identified in each of the previous
NAHMS studies.
Number of multidrug-resistant isolates by serotype and by resistance pattern1
Serotype Resistance Pattern2
Dairy 1996
Isolates (n=356)
Dairy 2002
Isolates (n=291)
Dairy 2007
Isolates (n=620)
Agona AMO, AMP, FOX, TIO, CHL, KAN, STR, SUL, TET, TRI
0 0 1
CHL, STR, SUL, TET 0 0 2
Albany AMO, AMP, CEP, TIC 1 0 0 Anatum AMO, CEP 1 0 0
Cerro CHL, TET 0 0 1 Dublin AMP, CHL, KAN, STR, SUL, TET, TIC 2 0 0
Kentucky AMP, CEP, TIC 1 0 0 Mbandaka AMO, CEP, TET 0 1 0
AMP, CEP, TIC 1 0 0 Menhaden AMO, CEP 1 0 0
Montevideo AMO, AMP, FOX, TIO, CHL, STR, SUL, TET
0 0 8
AMO, AMP, TIO, CHL, STR, SUL, TET 0 0 1
AMP, TIO, CHL, STR, SUL, TET 0 0 1 Muenster AMP, CEP, TIC 1 0 0
Newport AMO, AMP, FOX, TIO, AXO, CHL, STR, SUL, TET
0 0 1
AMO, AMP, FOX, TIO, CEP, CHL, GEN, KAN, STR, SUL, TET
0 1 0
AMO, AMP, FOX, TIO, CEP, CHL, STR, SUL, TET 0 5 0
AMO, AMP, FOX, TIO, CEP, CHL, STR, TET
0 1 0
AMO, AMP, FOX, TIO, CHL, STR, SUL, TET
0 0 8
Reading AMO, AMP, FOX, TIO, CEP, CHL, GEN, KAN, STR, SUL, TET
0 1 0
AMO, AMP, FOX, TIO, CHL, STR, SUL, TET
0 0 4
Saintpaul AMP, GEN, TET 0 0 1
Typhimurium AMO, AMP, CEP, CHL, GEN, KAN, STR, SUL, TET, TIC, TRI
1 0 0
AMO, AMP, FOX, TIO, CEP, CHL, STR, SUL, TET
0 2 0
AMO, AMP, FOX, TIO, CEP, CHL, STR, TET
0 1 0
AMO, AMP, TIO, CEP, CHL, STR, SUL, TET 0 2 0
AMP, CHL, SUL, TET, TIC 1 0 0 AMP, KAN, STR, SUL, TET, TIC 1 0 0 Total multidrug-resistant isolates 11 14 28 1Healthy, sick, and to-be-culled cows are included. 2See previous table for the full name of the antimicrobial corresponding to the abbreviations listed here.

USDA APHIS VS / 37
Section II: Pathogen Detection in Feces—B. Campylobacter
B.B.B.B.B. Cam Cam Cam Cam Campppppyyyyylobactlobactlobactlobactlobactererererer
1. Background Campylobacter is recognized as a major cause
of acute bacterial gastroenteritis in humans
worldwide, comparable with or even surpassing
Salmonella (Friedman et al., 2000). Mead et al.
(1999) estimated that in the United States there
are approximately 2.5 million cases of
Campylobacter jejuni (C. jejuni) infections each
year, 80 percent of which are food related.
Campylobacter coli (C. coli) was estimated to
cause approximately 26,000 cases in 2000 (Tam
et al., 2003). Human cases of campylo-
bacteriosis in the United States are estimated to
cost $18.8 billion annually (Scharff, 2010).
Typical signs of Campylobacter infection in
humans include abdominal cramping, vomiting,
fever, and diarrhea (with or without blood),
lasting from several days to more than a week
(Skirrow and Blaser, 2000). Of individuals that
recover from the disease, 20 percent may
relapse or experience prolonged or severe
illness requiring antimicrobial treatment. The
disease is rarely fatal, and only about 10 percent
of infected individuals are hospitalized.
The recently recognized association between
development of Guillain-Barré syndrome in
humans and prior C. jejuni infection, along with
other sequelae, has increased the level of public
health concern for this pathogen. Guillain-Barré
syndrome is an autoimmune disease of the
nervous system that can result in paralysis, pain,
and muscle wasting; it has an annual incidence
of about 2 in 100,000 persons in the United
States (Allos, 2001). An estimated 0.1 percent of
reported Campylobacter illnesses result in
Guillain-Barré syndrome (CDC, 2010).
C. jejuni and C. coli, commonly found in the
intestinal tracts of food animals, are the most
frequently isolated Campylobacter species
found in cases of human infection (Engberg et
al., 2000). Poultry and poultry products have
been documented as a major source of
Campylobacter infection in humans (Corry and
Atabay, 2001). Beef and dairy cattle are also
common carriers of Campylobacter (Atabay and
Corry, 1998; Wesley et al., 2000; Stanley and
Jones, 2003; Bae et al., 2005). Young animals
are more often colonized than older animals
(Sato et al., 2004). Feedlot cattle are more likely
than grazing cattle to carry Campylobacter
(Giacoboni et al., 1993; Beach et al., 2002).
Although Campylobacter species can be
considered commensal organisms or normal
flora in livestock, they can produce clinical
disease with diarrhea in neonatal calves and may
cause abortion, infertility, and early embryonic
death (Wesley et al., 2000; Smith, 2002).
Campylobacter spp. has been identified from
many livestock species. Although cattle can be
colonized by C. coli, C. jejuni is the most
common Campylobacter species isolated in
cattle (Wesley et al., 2000; Harvey et al., 2004;
Bae et al., 2005).
Foodborne transmission of Campylobacter can
occur through fecal contamination of carcasses
at slaughter, although Campylobacter is not
frequently isolated from cattle carcasses or fresh
beef (Minihan et al., 2004; Whyte et al., 2004;
Hakkinen et al., 2007). Fecal contamination of
milk or water is another potential route of
human exposure (CDC, 2002; Clark et al.,
2003). Unpasteurized milk has emerged as a risk

38 / Dairy 2007
Section II: Pathogen Detection in Feces—B. Campylobacter
factor for human campylobacteriosis in
epidemiological studies (Jacobs-Reitsma, 2000;
Studahl and Andersson, 2000; Neimann et al.,
2003), and numerous outbreaks of human
Campylobacter infection have occurred through
consumption of raw dairy products (Evans et al.,
1996; Altekruse et al., 1999; Schildt et al.,
2006).
2. Sampling andtesting overview
NAHMS has examined Campylobacter
occurrence using individual fecal samples from
dairy cows in three separate studies: Dairy 1996,
Dairy 2002, and Dairy 2007. Typically,
NAHMS studies generate population-based
estimates, and appropriate sample sizes are used
to arrive at such estimates. Field resources,
laboratory capacity, and the expense of culturing
samples make it difficult to provide a national
estimate of Campylobacter prevalence based on
fecal culturing of individual animals. Therefore,
for the Campylobacter estimates in this section,
all three NAHMS dairy studies used a sample of
approximately 100 operations, which is not an
optimal sample size for providing national
estimates of prevalence. Despite this limitation,
the NAHMS studies provide valuable
information on Campylobacter occurrence and
antimicrobial susceptibility patterns on
U.S. dairies and represent the only national
examination of Campylobacter on dairy
operations in the United States. Other research
studies have examined Campylobacter
occurrence in dairy cattle but have been limited
to specific regions of the United States.
Campylobacter monitoring in the NAHMS
studies focused on C. jejuni and C. coli because
these species are most commonly associated
with human disease. Each of the three studies
investigated the prevalence of Campylobacter
on U.S. dairy operations. Antimicrobial
susceptibility patterns of the Campylobacter
isolates were evaluated in 2002 and 2007. At the
time of sampling, records were kept as to
whether each cow was sick, healthy (from the
milking string), scheduled for culling (within
7 days of leaving the operation), or dry (dry
cows were sampled only in Dairy 1996 and
Dairy 2002; dry cows were grouped with
healthy cows in the following estimates). Dairy
1996 compared the prevalence of
Campylobacter in milk cows on-farm to that of
milk cows on-farm scheduled for culling within
7 days, and to cull cows at markets. To allow for
comparisons across the three studies, results
presented in this report focused primarily on
healthy cows.
The methods used to identify samples as
Campylobacter positive varied across the three
NAHMS studies. Dairy 1996 used PCR
methods, and Dairy 2002 and Dairy 2007 used
culture and PCR methods. A different PCR was
used in Dairy 1996 than was used in Dairy 2002
and Dairy 2007. These differences in
identification methods should be noted when
interpreting Campylobacter results for the
NAHMS dairy studies. Because Dairy 1996
identification methods were limited to PCR
only, no antimicrobial susceptibility testing was
performed. In addition, the PCR test from Dairy
1996 identified isolates with a 460-bp fragment
as C. coli and isolates with both 160- and

USDA APHIS VS / 39
Section II: Pathogen Detection in Feces—B. Campylobacter
460-bp fragments as C. jejuni. Because of the
overlap between species at 460 bp, it could not
be determined whether any samples were
positive for both C. jejuni and C. coli. There
were only 14 C. coli isolates in Dairy 1996, and
for the purposes of this report it was assumed
that no samples were positive for both C. jejuni
and C. coli. For Dairy 2002, isolates were
characterized as presumptive positive based on
culture and microscopy, with PCR being used to
confirm isolates as Campylobacter and to
determine species. However, PCR was
performed on only a subset of the presumptive-
positive isolates. For Dairy 2007, species
identification was performed on all positive
isolates, and antimicrobial susceptibility testing
was performed on all viable C. jejuni and C. coli
isolates.
Photo of C. jejuni courtesy of CDC.
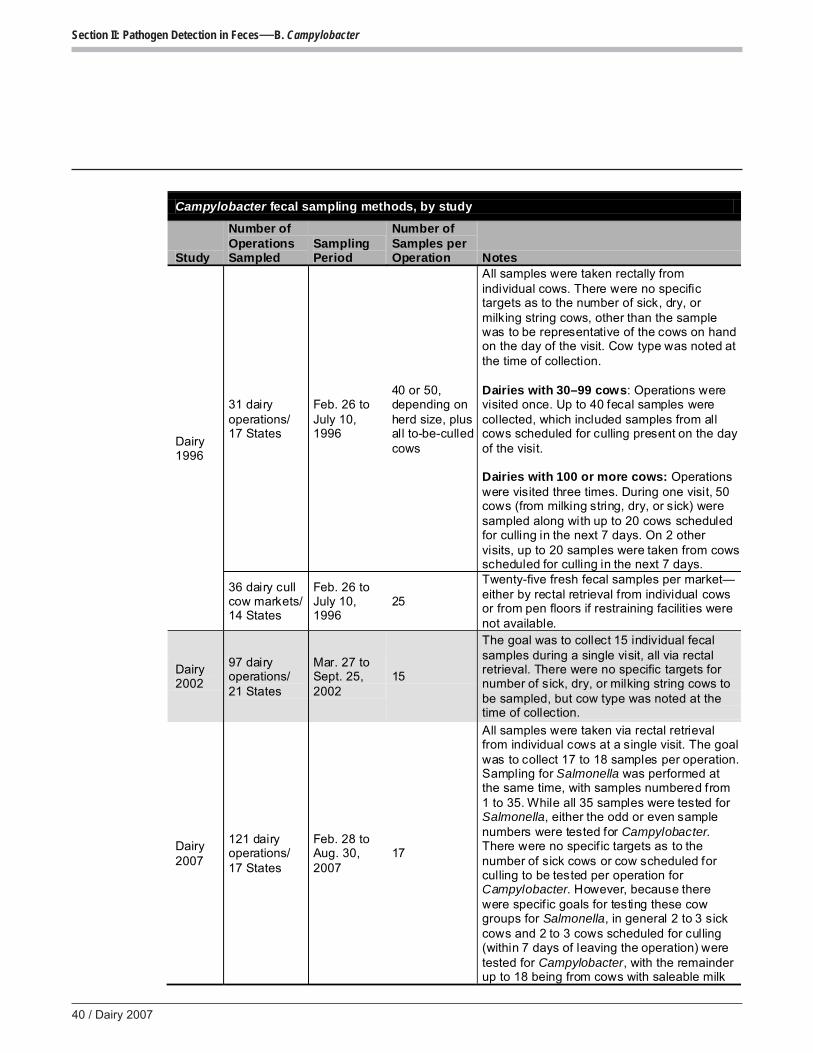
40 / Dairy 2007
Section II: Pathogen Detection in Feces—B. Campylobacter
Campylobacter fecal sampling methods, by study
Study
Number of Operations Sampled
Sampling Period
Number of Samples per Operation Notes
Dairy 1996
31 dairy operations/ 17 States
Feb. 26 to July 10, 1996
40 or 50, depending on herd size, plus all to-be-culled cows
All samples were taken rectally from individual cows. There were no specific targets as to the number of sick, dry, or milking string cows, other than the sample was to be representative of the cows on hand on the day of the visit. Cow type was noted at the time of collection. Dairies with 30–99 cows: Operations were visited once. Up to 40 fecal samples were collected, which included samples from all cows scheduled for culling present on the day of the visit. Dairies with 100 or more cows: Operations were visited three times. During one visit, 50 cows (from milking string, dry, or sick) were sampled along with up to 20 cows scheduled for culling in the next 7 days. On 2 other visits, up to 20 samples were taken from cows scheduled for culling in the next 7 days.
36 dairy cull cow markets/ 14 States
Feb. 26 to July 10, 1996
25
Twenty-five fresh fecal samples per market—either by rectal retrieval from individual cows or from pen floors if restraining facilities were not available.
Dairy 2002
97 dairy operations/ 21 States
Mar. 27 to Sept. 25, 2002
15
The goal was to collect 15 individual fecal samples during a single visit, all via rectal retrieval. There were no specific targets for number of sick, dry, or milking string cows to be sampled, but cow type was noted at the time of collection.
Dairy 2007
121 dairy operations/ 17 States
Feb. 28 to Aug. 30, 2007
17
All samples were taken via rectal retrieval from individual cows at a single visit. The goal was to collect 17 to 18 samples per operation. Sampling for Salmonella was performed at the same time, with samples numbered from 1 to 35. While all 35 samples were tested for Salmonella, either the odd or even sample numbers were tested for Campylobacter. There were no specif ic targets as to the number of sick cows or cow scheduled for culling to be tested per operation for Campylobacter. However, because there were specif ic goals for testing these cow groups for Salmonella, in general 2 to 3 sick cows and 2 to 3 cows scheduled for culling (within 7 days of leaving the operation) were tested for Campylobacter, with the remainder up to 18 being from cows with saleable milk

USDA APHIS VS / 41
Section II: Pathogen Detection in Feces—B. Campylobacter
3. Prevalence In 1996, Campylobacter was detected in at least
one cow on all 31 sampled operations. In 2002,
97.9 percent of operations sampled had at least
one cow shedding Campylobacter in feces. In
2007, 92.6 percent of operations had at least one
cow shedding Campylobacter in feces.
a. Percentage of operations and percentage of healthy cows fecal-culture positive for Campylobacter
Study Operations1 Cows
Dairy 19962 100.0 (31/31) 44.1 (505/1,144)
Dairy 20023 97.9 (95/97) 51.4 (732/1,424)
Dairy 2007 92.6 (112/121) 33.7 (635/1,885) 1Operations with at least one positive cow were considered positive. 2Only milk cow or cull cow was recorded for Campylobacter results for Dairy 1996, so a few operations might have had a small number of sick cows sampled. 3Data for 2002 were presumptive positives based on culture and microscopy. Confirmatory testing was performed only on a subset of these presumptive-positive isolates.

42 / Dairy 2007
Section II: Pathogen Detection in Feces—B. Campylobacter
C. jejuni was found on all of the
Campylobacter-positive operations from the
1996, 2002, and 2007 studies for which species
identification was performed. In contrast, C. coli
was found on 19.4 to 39.8 percent of
Campylobacter-positive operations during the
three NAHMS studies.
For Dairy 2002 and Dairy 2007, a slightly
higher percentage of sick cows were fecal-
culture positive for Campylobacter compared
with other cow types.
b. Of the Campylobacter isolates tested for species identification, percentage of operations1 and percentage of healthy cows fecal-culture positive for C. jejuni or C. coli
C. jejuni C. coli
Study Percent Cows Percent Cows
Dairy 19962 100.0 (31/31) 97.2 (491/505) 19.4 (6/31) 2.8 (14/505)
Dairy 20023 100.0 (93/93) 89.1 (465/522) 39.8 (37/93) 10.9 (57/522)
Dairy 2007 100.0 (112/112) 90.1 (554/6154) 25.0 (28/112) 9.3 (57/6154) 1Operations with at least one positive cow were considered positive. 2Only milk cow or cull cow was recorded for Campylobacter results for Dairy 1996, so a few operations may have had a small number of sick cows sampled. 3Species identification was performed on a subset of presumptive-positive isolates from Dairy 2002. 4Four of the 615 isolates in 2007 were C. lari. Twenty isolates were nonviable at the time of species identification, and these are not included in the isolates listed here.
c. Percentage of cows fecal-culture positive for Campylobacter, by cow type
Cow Type
Study Healthy Sick Scheduled for Culling All Cows
Dairy 2002 51.4 (732/1,424) 56.3 (9/16) 40.0 (2/5) 51.4 (743/1,445)
Dairy 2007 33.7 (635/1,885) 46.4 (51/110) 35.4 (28/79) 34.4 (714/2,074)

USDA APHIS VS / 43
Section II: Pathogen Detection in Feces—B. Campylobacter
During all three study years, a lower percentage
of cows on small operations than on large
operations were fecal-culture positive for
Campylobacter.
In 1996, the percentage of cows PCR positive
for Campylobacter was similar in the East and
West regions. In 2002 and 2007, a slightly
higher percentage of cows in the West region
were culture positive for Campylobacter
compared with cows in the East region.
d. Percentage of healthy cows fecal-culture positive for Campylobacter, by herd size
Herd Size (Number of Cows)
Study Small
(Fewer than 100) Medium
(100–499) Large
(500 or More)
Dairy 1996* 38.5 (150/390) 45.2 (208/460) 50.0 (147/294)
Dairy 2002 43.7 (211/483) 49.2 (287/583) 65.4 (234/358)
Dairy 2007 22.1 (133/603) 36.3 (269/742) 43.1 (233/540)
*Only milk cow or cull cow was recorded for Campylobacter results for Dairy 1996, so a few operations may have had a small number of sick cows sampled.
e. Percentage of healthy cows fecal-culture positive for Campylobacter, by region
Region
Study East West
Dairy 1996* 44.6 (323/724) 43.3 (182/420)
Dairy 2002 46.9 (477/1,018) 62.8 (255/406)
Dairy 2007 31.7 (507/1,597) 44.4 (128/288)
*Only milk cow or cull cow was recorded for Campylobacter results for Dairy 1996, so a few operations may have had a small number of sick cows sampled.

44 / Dairy 2007
Section II: Pathogen Detection in Feces—B. Campylobacter
In 1996, 2002, and 2007 over 90 percent of
operations were positive for Campylobacter.
Among all operations tested, the median within-
herd prevalence in 1996, 2002, and 2007 was
42.9, 58.3, and 30.8 percent, respectively.
Among all operations, the top quartile within-
herd prevalence was 64.0, 73.3, and
52.9 percent in 1996, 2002, and 2007,
respectively.
The within-herd prevalence for Salmonella and
Campylobacter in healthy cows differed greatly
on dairy operations. The majority of operations
were Salmonella negative, and the highest
percentage of positive herds had a within-herd
prevalence of 10 percent or less. In contrast, for
Campylobacter most operations were
Campylobacter positive, and most positive
herds had a within-herd prevalence of over
10 percent.
f. Number of operations by within-herd prevalence of Campylobacter1
Within-herd Prevalence Dairy 1996 Dairy 2002 Dairy 2007
0.0 0 2 9
0.1–10.0 1 4 7
10.1–20.0 3 7 24
20.1–30.0 6 7 20
30.1–40.0 5 17 18
40.1–50.0 5 6 14
50.1–60.0 4 22 11
60.1–70.0 6 7 8
70.1–80.0 0 15 7
80.1–90.0 0 4 2
90.1–100.0 1 6 1
Total 31 97 121

USDA APHIS VS / 45
Section II: Pathogen Detection in Feces—B. Campylobacter
4. Antimicrobialsusceptibility
Antimicrobial susceptibility testing was
conducted on a subset of Campylobacter
isolates from Dairy 2002 and on all isolates
from Dairy 2007. Antimicrobial susceptibility
testing was not performed in Dairy 1996. In
Dairy 2002, 49.2 percent of the C. jejuni
isolates from healthy cows were susceptible to
all antimicrobials against which they were
tested. In Dairy 2007, 37.1 percent of the
C. jejuni isolates from healthy cows were
susceptible to all antimicrobials. A relatively
low percentage of isolates were resistant to two
or more antimicrobials.
a. Percentage of C. jejuni isolates by number of antimicrobials in which antimicrobial resistance1 was observed2
Study (n=Number of Isolates)
Susceptible to All Antimicrobials
Resistant to a Single
Antimicrobial
Resistant to Two or More
Antimicrobials Total
Dairy 2002 (n=465) 49.2 47.4 3.4 100.0
Dairy 2007 (n=553) 37.1 60.9 2.0 100.0 1Intermediate isolates were classified as susceptible. 2Only cows healthy at the time of collection are included.

46 / Dairy 2007
Section II: Pathogen Detection in Feces—B. Campylobacter
Of the antimicrobials in the table below,
ciprofloxacin and erythromycin are especially
important because they are often used when
treatment is indicated for Campylobacter
infection in humans (Gupta et al., 2004). Very
few of the C. jejuni isolates were resistant to
ciprofloxacin or erythromycin in 2002 and
2007. The highest percentages of C. jejuni
isolates were resistant to tetracycline in 2002
and 2007 (47.5 and 62.4 percent, respectively).
b. Percentage of resistant1 isolates from all C. jejuni isolates tested for antimicrobial susceptibility, by antimicrobial2
Antimicrobial Dairy 2002 (n=465) Dairy 2007 (n=553)
Azithromycin (AZI) 0.9 0.4
Ciprofloxacin (CIP) 2.6 1.3
Chloramphenicol (CHL) 0.0 NA
Clindamycin (CLI) 0.6 0.2
Erythromycin (ERY) 0.4 0.4
Florfenicol (FLO) NA 0.0
Gentamicin (GEN) 0.2 0.0
Nalidixic acid (NAL) 4.1 1.6
Telithromycin (TEL) NA 0.0
Tetracycline (TET) 47.5 62.4 1Intermediate isolates were classified as susceptible. 2Only cows healthy at the time of collection are included.

USDA APHIS VS / 47
Section II: Pathogen Detection in Feces—B. Campylobacter
5. Multidrugresistance patterns
The table below shows resistance patterns for
C. jejuni and C. coli isolates from all cow types
for 2002 and 2007. No isolates were resistant to
more than four antimicrobials. No isolates were
resistant to both ciprofloxacin and erythromycin.
Number of Campylobacter isolates, by resistance pattern1
Species Resistance Pattern2 Dairy 2002
Isolates Dairy 2007
Isolates
jejuni
AZI, CLI, ERY, TET 0 1
AZI, CLI, ERY, NAL 1 0
AZI, CLI, TET 1 0
AZI, ERY, TET 1 1
CIP, NAL, TET 6 7
CIP, NAL 6 3
NAL, TET 0 2
AZI, CLI 1 0
NAL 6 0
GEN 1 0
TET 214 381
Pansusceptible 234 228
Total 471 623
coli
AZI, CLI, ERY, NAL 1 0
AZI, CLI, ERY, TET 2 1
AZI, ERY, TET 2 1
AZI, CLI, NAL 1 0
CIP, NAL, TET 0 6
CLI, TET 1 0
GEN, TET 2 0
NAL, TET 3 0
TET 29 32
Pansusceptible 18 24
Total 59 64 1Healthy, sick, and to-be-culled cows are included.
2See preceding table for the full name of the antimicrobials.

48 / Dairy 2007
Section III: Sampling and Diagnostic Testing—A. Farm Selection
Section III: Sampling andSection III: Sampling andSection III: Sampling andSection III: Sampling andSection III: Sampling andDiagnosDiagnosDiagnosDiagnosDiagnostic Ttic Ttic Ttic Ttic TesesesesestingtingtingtingtingAAAAA. F. F. F. F. Farararararm Selectionm Selectionm Selectionm Selectionm Selection
Dairy 1996
A stratified random sample of dairy operations
from the USDA National Agricultural Statistics
Service (NASS) list frame in each of 20 selected
States,1 representing 80.2 percent of U.S. dairy
operations and 83.1 percent of U.S. dairy cows,
was the basis for selecting participating
operations in the Dairy 1996 study. More than
2,500 and 1,200 dairy producers participated in
Phase I and Phase II of the study, respectively. A
convenience sample of 100 of the 1,200 dairies
was selected for participation in Salmonella
sampling. This sample included 50 dairies with
30 to 99 dairy cows, and 50 dairies with 100 or
more dairy cows. The number of small and large
operations allocated to each State was
proportional to the number of small and large
operations in the State. Cull-cow markets were
also selected for fecal sampling in these
20 States, allocated based on the number of cull
dairy-cow markets within the State. Previous
history of salmonellosis was not a selection
factor. Samples were collected from February 26
to July 10, 1996.
Dairy 2002
A stratified random sample of dairies was
chosen based on herd size from the NASS
listing for each of 21 selected States.2 This
sample represented 85.5 percent of the
U.S. dairy cows and 82.8 percent of U.S. dairy
operations. Dairy operations reporting one or
more milk cows in inventory on January 1,
2002, were eligible for Phase I of the study, and
operations with at least 30 dairy cows were
eligible for Phase II. Participation in the study
included over 2,400 dairy producers in Phase I
and 1,000 producers in Phase II. Of the Phase II
operations, bulk-tank milk samples from
861 operations were collected by Federal and
State veterinary medical officers or animal
health technicians. Samples were collected from
February 27 to July 1, 2002. A convenience
sample of 100 of these operations with at least
30 milk cows was selected for fecal sampling.
Approximately five operations per State were
selected. Previous history of salmonellosis was
not a selection factor. Samples were collected
from March 27 to September 25, 2002.
1California, Florida, Idaho, Illinois, Indiana, Iowa,Kentucky, Michigan, Missouri, New Mexico, New York,Minnesota, Ohio, Oregon, Pennsylvania, Tennessee, Texas,Vermont, Washington, and Wisconsin.
2California, Colorado, Florida, Idaho, Illinois, Indiana,Iowa, Kentucky, Michigan, Minnesota, Missouri, NewMexico, New York, Pennsylvania, Ohio, Tennessee, Texas,Vermont, Virginia, Washington, and Wisconsin.

USDA APHIS VS / 49
Section III: Sampling and Diagnostic Testing—A. Farm Selection
Dairy 2007
Data were collected during the NAHMS Dairy
2007 study from dairy operations in 17 major
dairy States3 representing 79.5 percent of
U.S. dairy operations and 82.5 percent of U.S.
dairy cows. The survey design was a stratified
random sample with unequal selection
probabilities within each stratum to ensure that
large dairy operations were well represented in
the sample. Dairy operations reporting one or
more milk cows in inventory on January 1,
2007, were eligible for Phase I of the study, and
3California, Idaho, Indiana, Iowa, Kentucky, Michigan,Minnesota, Missouri, New Mexico, New York, Ohio,Pennsylvania, Texas, Vermont, Virginia, Washington, andWisconsin.
operations with at least 30 dairy cows were
eligible for Phase II. Participation in the study
included over 2,194 dairy producers in Phase I
and 582 producers in Phase II. Of the Phase II
operations, bulk-tank milk and in-line milk filter
samples from 538 operations were collected by
Federal and State veterinary medical officers or
animal health technicians. A convenience sample
of 121 of these operations with at least 30 milk
cows was selected for individual cow fecal
sampling. Previous history of salmonellosis was
not a selection factor. Samples were collected
from February 28 to August 29, 2007.
Photo courtesy of Agriculture Research Service

50 / Dairy 2007
Section III: Sampling and Diagnostic Testing—B. Sampling Methods
B. SamB. SamB. SamB. SamB. Sampling Mepling Mepling Mepling Mepling Mettttthodshodshodshodshods
1. Bulk-tank milkand milk filtersampling
A single bulk-tank milk sample from each
participating operation was collected during the
Dairy 2002 and Dairy 2007 studies and tested
for Listeria and Salmonella. Bulk-tank milk was
not tested for Salmonella or Listeria in Dairy
1996. Milk filters were collected only in 2007.
Dairy 2002 used both culture and PCR methods
for Salmonella detection, but only PCR was
used for Dairy 2007. Bulk-tank milk samples
were aseptically collected only when milk from
at least 70 percent of the operation’s lactating
cows was represented in the sample.
Additionally, for Dairy 2007, milk filters were
collected at the time of sampling. If the milk
filter was not available for removal from the
milk line during the sample visit, farm operators
were requested ahead of time to place the filter
from the most recent milking in a clean plastic
bag and store in the refrigerator. For Dairy
2007, sample collectors were instructed not to
freeze samples. In some cases for Dairy 2002,
the samples were frozen prior to shipping. Bulk-
tank milk and milk filters were shipped
overnight with ice packs to the USDA–
Agricultural Research Service (ARS)
Environmental Microbial Safety Laboratory
(EMSL) in Beltsville, MD.
2. Fecal sampling Each of the three dairy studies had slightly
different objectives with regard to Salmonella
sampling, which led to differences in the types
of cattle sampled. Although the numbers of
samples taken on each operation were similar
across studies, they were not identical. A subset
of samples taken for Salmonella testing during
the three dairy studies was tested for
Campylobacter. Thus, the type of cattle
sampled, the number of cattle sampled, and the
sampling collection methods were the same for
Salmonella and for Campylobacter, but fewer
samples were tested for Campylobacter than for
Salmonella.
Dairy 1996
The Dairy 1996 study set out to determine if
Salmonella prevalence differed among milk
cows on the farm, cows scheduled for culling
within 7 days, and cull cows at livestock
markets. Small dairies (30 to 99 cows) were
visited once for fecal sampling, and up to
40 samples were collected at this single visit. All
cows scheduled for culling within 7 days were
sampled, and the remainder of samples—up to
40—were taken from other cows, including
healthy milking cows, dry cows, and sick cows.
Dairies with 100 or more cows were visited
3 times. At one visit, 50 cows (milking string,
dry, or sick) were sampled along with up to
20 cows scheduled for culling. During the other
two visits, up to 20 samples were taken from
cows scheduled for culling. There were no
specific target numbers for sick, dry, or milking

USDA APHIS VS / 51
Section III: Sampling and Diagnostic Testing—B. Sampling Methods
string cows, other than samples were to be
representative of the cows on hand on the day of
the visit. Cow type was recorded at the time of
collection. At each livestock market, 25 fresh
fecal samples were taken, either by rectal
retrieval or from pen floors if restraining
facilities were not available. Samples were taken
by rectal retrieval, and a separate glove was
used to collect each fecal sample to avoid cross-
contamination during sampling. Samples were
placed in sterile screw-top vials. Fecal samples
were approximately golf-ball sized and were
kept on ice and shipped to NVSL. Salmonella-
positive samples were sent to the USDA–
ARS Bacterial Epidemiology and Antimicrobial
Resistance Unit (BEAR) [formerly the
Antimicrobial Resistance Research Unit] in
Athens, GA, for antimicrobial susceptibility
testing. At 50 samples per herd (40 per herd for
operations with fewer than 100 cows), this
sample provided 95-percent confidence of
detecting at least 1 positive animal if the within-
herd prevalence was greater than or equal to
5 percent, assuming an equal risk of fecal
shedding for each cow sampled. Campylobacter
testing was done on all samples from 31 of the
operations.
Dairy 2002
The Dairy 2002 study set out to estimate
Salmonella prevalence and describe
antimicrobial resistance on U.S. dairies.
Operations were visited once. The goal was to
collect 40 samples per operation regardless of
herd size, or from all cows if the operation had
fewer than 40 cows. There were no specific
targets for numbers of sick, dry, or milking
string cows to be sampled, but cow type was
recorded at the time of collection. Samples were
taken by rectal retrieval, and a separate glove
was used to collect each fecal sample to avoid
cross-contamination during sampling. Samples
were placed in sterile Whirl-pak® bags. Fecal
samples were approximately golf-ball sized and
were shipped on ice to BEAR for culturing and
antimicrobial susceptibility testing.
Campylobacter testing was done on 15 of the
samples per operation.
Dairy 2007
The Dairy 2007 study set out to estimate
Salmonella prevalence and describe
antimicrobial resistance on U.S. dairies. An
additional goal was to evaluate testing strategies
for detecting Salmonella using fecal samples
from individual cows, pooled fecal samples, and
composite fecal samples. Operations were
visited once. Up to
35 fecal samples per operation were taken via
rectal retrieval. The goal was to collect 35 fecal
samples from every operation, regardless of
operation size. Up to 5 sick cows and up to
5 cows scheduled for culling were sampled, with
the remainder (up to 35) taken from cows with
saleable milk. A separate glove was used to
collect each fecal sample to avoid cross-
contamination during sampling. Fecal samples
were approximately golf-ball sized. Samples
were placed in sterile Whirl-pak bags. Samples
were kept on ice and shipped to BEAR for
culturing and antimicrobial susceptibility
testing. Samples from individual cows were
pooled at the laboratory, with each pool
representing five cows.

52 / Dairy 2007
Section III: Sampling and Diagnostic Testing—C. Laboratory Methods
C. LaborC. LaborC. LaborC. LaborC. Laboratatatatatororororory Mey Mey Mey Mey Mettttthodshodshodshodshods
1. Salmonellatesting of bulk-tank milk and milkfilters
Dairy 2002
Culture was one of the testing methods used to
detect Salmonella in milk samples (Van Kessel
et al., 2004). Briefly, milk (250 μL) was plated
in triplicate directly onto XLT4 agar (XLT4 agar
base with XLT4 supplement; BD Diagnostics)
using an Autoplate 4000. Plates were incubated
at 37°C and scored for presumptive Salmonella
colonies (black colonies) at 24 and 48 h. For
enrichment of Salmonella, 5 to 10 mL of milk
was added to 90 mL of tetrathionate broth. The
variation in volume was due to variation in
available sample volume. Enrichment bottles
were incubated at 37°C for 24 h and then the
broth was streaked (10 μL) onto XLT4 agar.
Plates were incubated at 37°C and examined at
24 and 48 h for the presence of black colonies.
Isolated, presumptive Salmonella colonies were
transferred from XLT4 plates onto XLT4,
brilliant green, and L-agar. Colonies that
exhibited the Salmonella phenotype (black on
XLT4 and pink on brilliant green) were
preserved for future analysis. Colony biomass
was transferred from the L-agar plates to a vial
containing 0.5 mL of a 1:1 mixture of Lennox
broth and the 2x freezing medium for cells
(Schleif and Wensink, 1981). The isolates were
stored at -80°C. L-agar slants were inoculated
and, after incubation at 37°C for 24 h, sent to
NVSL for serotyping.
PCR was also used to detect Salmonella in milk
samples using RT-PCR, as described by Van
Kessel, et al. (2003). Briefly, 5 to 10 mL of milk
was added to 95 mL of tetrathionate broth. The
variation in volume was due to variation in
available sample volume. Enrichment bottles
were incubated at 37°C for 24 h. After
incubation, enriched samples (1.5 mL) were
centrifuged (13,000 x g) in microcentrifuge
tubes, the supernatants were discarded, and the
pellets were stored at -20°C. DNA was extracted
from bacterial pellets using 200 μL of InstaGene
Matrix (Bio-Rad Laboratories, Hercules, CA)
following the manufacturer’s directions. The
DNA preparations were stored at -20°C and
later analyzed for the presence or absence of
Salmonella via RT-PCR . RT-PCR was carried
out using the Ruggedized Advanced Pathogen
Identification Device (RAPID) [Idaho
Technology Inc., Salt Lake City, Utah].
Premixed, freeze-dried PCR reagents that target
the spaQ gene on the chromosome of
Salmonella were used according to the
manufacturer’s directions using 2 μL of sample.
Preincubation was at 94°C for 60 s. Forty-five
PCR cycles were run under the following
conditions: 95°C for 0 s (the cuvettes are heated
to 95°C but not held there), followed by 60°C
for 20 s with a temperature transition rate of
20°C/s. Other variable parameters included:
channel 2, gain 8, and mode 1. The RAPID
system, in conjunction with the Salmonella
detection kit, has the capability of running
melting point curves on the PCR reaction
products. Melting point curves were run on all
samples that were identified as Salmonella-
positive by the RAPID software. The initial
temperature was 94°C for 1 min; the
temperature was reduced to 50°C, and then
increased from 50 to 94°C at a rate of 0.2°C/s.
The fluorescence in the sample was read at each
stage of the temperature gradient and a first
derivative plot of fluorescence vs. temperature
was used to determine the melting point of any

USDA APHIS VS / 53
Section III: Sampling and Diagnostic Testing—C. Laboratory Methods
PCR products present. The software supplied by
the manufacturer provided a score for each
reaction based upon the degree that the
maximum level of fluorescence recorded during
the PCR run differed from the baseline
calculated in the early stages of the run. Thus,
the score depended upon the magnitude of
fluorescent signal generated and the quality of
the baseline. The higher the score, the more the
maximum fluorescent signal varied from the
baseline. For samples with a very low PCR
score, a subjective analysis of the melting point
curve and the RT-PCR amplification curve was
used to decide if a sample was finally
considered Salmonella-positive or Salmonella-
negative (Van Kessel et al., 2003). Logistic
regression analysis of the relationship between
RT-PCR signal and the likelihood of obtaining a
positive culture was done using the PROC
PROBIT procedure in SAS 9.1 (SAS Inst. Inc.,
Cary, NC). Samples that gave a positive result in
the real-time assay were subjected to two rounds
of conventional PCR using primer set 139-141
targeting the invA gene as described by Rahn et
al. (1992) and shown by Malorny et al. (2003)
to detect a wide range of Salmonella. The
conditions for the first round of PCR were those
described by Malorny et al. (2003) except that 1
U of Amplitaq Gold (Applied Biosystems,
Foster City, CA) was used per 25 μL reaction, a
10-min incubation at 95°C was added to activate
the enzyme at the beginning of the reaction, and
the PCR was run for 40 cycles. A portion (1 to 3
μL) of the InstaGene preparation from the
tetrathionate broth enrichments of raw milk
samples was added to each reaction. For the
second round of PCR, 5 μL of first-round
product was added to 20 μL of fresh PCR mix to
give the same final composition as the first-
round reactions. Amplification was done on a
Biometra Personal Cycler (Biometra, Göttingen,
Germany). The PCR products were separated by
electrophoresis on a 2-percent horizontal
agarose gel in Tris-borate buffer as described by
Maniatis et al. (1982). The gel contained 0.5 μg/
mL ethidium bromide; bands were visualized on
a UV transilluminator, and documented with a
video camera. Detection of a band in the region
of 284 bp indicated the presence of Salmonella.
Dairy 2007
Bulk-tank milk and/or in-line milk filter samples
were analyzed by RT-PCR. Ten mL of milk were
added to 10 mL of 2X tetrathionate broth and
incubated overnight at 37°C. Milk filters were
cut into pieces and mixed with buffered peptone
water in a stomacher bag and pummeled for 2
min. Five mL of the liquid of the stomacher bag
were added to 5 mL of 2X tetrathionate broth
and incubated at 37°C overnight. After
incubation, 1.5 mL of the broth was centrifuged
(16,000 x g) for 2 min in microcentrifuge tubes.
The supernatant was discarded, and the DNA
was extracted from the pellet biomass using 200
μL of InstageneGene Matrix (Bio-Rad Labor-
atories, Hercules, CA) following manufacturer’s
instructions. The DNA preparations were stored
at -20°C and analyzed for presence of
Salmonella via PCR for the invA gene using the
primers described by Rahn et al. (1992) and
shown by Malorny et al. (2003) to be effective
for the detection of multiple serotypes of
Salmonella. The PCR reactions were run at
EMSL and monitored in real time through the
addition of EVAGreen dye (Biotium, Inc.,
Hayward, CA). PCR-positive samples were then
cultured to allow for Salmonella serotyping.

54 / Dairy 2007
Section III: Sampling and Diagnostic Testing—C. Laboratory Methods
2. Listeria testingof bulk-tank milkand milk filters
Dairy 2002
Milk (250 μL) was plated in triplicate directly
onto Modified Oxford Medium (MOX) agar
(BD Diagnostics) using an Autoplate 4000.
Plates were incubated at 37°C and scored for
presumptive Listeria colonies (esculin
hydrolysis, black colonies) at 24 and 48 h. For
enrichment of Listeria, 5 to 10 mL of milk were
added to 90 mL of Modified Listeria
Enrichment Broth (BD Diagnostics).
Enrichment bottles were incubated at 37°C for
48 h, and then the broth was streaked
(10μL) onto MOX agar. Plates were incubated
and scored as described previously. Isolated,
presumptive Listeria colonies were transferred
from MOX plates onto MOX, PALCAM (BD
Diagnostics), and trypticase soy agar with 0.6
percent yeast extract (TSA-YE). Colonies that
exhibited the Listeria phenotype (black on
MOX and gray-green with esculin hydrolysis on
PALCAM) were preserved for future analysis.
Colony biomass was transferred from the
TSA-YE plates to 1.5 mL of tryptic soy broth
and incubated at 37°C for 48 h. The enriched
broth was centrifuged (16,000 x g), and the
supernatants were discarded. The bacterial pellet
was resuspended in 0.5 mL of 1x freezing
medium for cells of Schleif and Wensink (1981),
and the isolates were stored at -80°C.
Presumptive Listeria isolates were grown on
TSA-YE for further testing. Isolates were tested
for oxidase with 1-percent tetramethyl-p-
phenylenediamine dihydrochloride
(BD Diagnostics), catalase with 3 percent
hydrogen peroxide, and gram-stained using a
3-step staining kit (BD Diagnostics). Hemolytic
activity was determined by stabbing blood agar
(Columbia with 5 percent sheep blood; Remel,
Lenexa, KS) and incubating at 37°C for
48 hours. The Christie-Atkins-Munch-Peterson
test was performed on each isolate using
Staphylococcus aureus Beta Lysin Disks
(Remel) and Rhodococcus equi (ATCC 6939;
American Type Culture Collection, Manassas,
VA) on sheep blood agar. Additionally, RT-PCR
was run on DNA extracts of the presumptive
Listeria isolates. Isolates were grown in 1.0 mL
of tryptic soy broth at 37°C for 48 h. The
enriched broth was centrifuged (16,000 x g),
and the supernatants were discarded. The DNA
was extracted from the bacterial pellets using a
commercially prepared extraction preparation
(InstaGene Matrix; Bio- Rad Laboratories,
Hercules, CA) following the manufacturer’s
directions. The DNA preparations (200 μL)
were stored at -20°C prior to analysis. RT-PCR
was run according to the method described by
Nogva et al. (2000) using a Mx4000 Multiplex
Quantitative PCR System (Stratagene, La Jolla,
CA). Amplification reactions (50 μL) contained
300 nM of each primer, 250 nM probe, 12.6 μg
of BSA, 25 μL of TaqMan Master Mix (Applied
Biosystems, Foster City, CA), and 5 μL of
extracted DNA product. The thermal profile
used for PCR was 50°C for 2 min followed by
95°C for 10 min followed by 40 cycles of 95°C
for 15 s and 60°C for 60 s. Serotyping of the L.
monocytyogenes isolates was conducted using a
previously described ELISA (Palumbo et al.,
2003).

USDA APHIS VS / 55
Section III: Sampling and Diagnostic Testing—C. Laboratory Methods
Dairy 2007
Ten mL of milk was mixed with 90 mL 1X
modified Listeria Enrichment Broth (mLEB) for
enrichment of Listeria and incubated at 37°C for
40 to 48 h. Milk filters were cut into pieces and
mixed with 2 parts (w/w) buffered peptone
water in a stomacher bag and pummeled for
2 min. Then 5 mL of liquid from stomacher bag
was mixed with 5 mL 2X mLEB and incubated
at 37°C for 40 to 48 h. After 48 h, 2 mL of each
enrichment was harvested by centrifuging at
16K x g for 2 min in a 2-mL cryovial. The
supernatant was removed and the pelleted
biomass was suspended in 0.5 mL of
preservation medium and frozen at -80°C to
archive live cells (Preservations). Biomass was
harvested from 1.5 mL of each enrichment in a
1.7-mL microcentrifuge tube. The supernatant
was removed and the pellet was saved for DNA
extraction by freezing at -20°C. A 10-μL loop
was used to streak 10 μL of each enrichment
onto Modified Oxford Agar plates (MOX).
Plates were incubated at 37°C for 48 h and
examined for colonies with morphology
resembling Listeria. Identity of colonies was
confirmed as Listeria and determined to be
L. monocytyogenes vs. non-L. monocytyogenes
by patching suspect colonies onto PALCAM and
BCM media. Any phospholipase-positive
isolates were further characterized with a CAMP
test to distinguish L. ivanovii from
L. monocytyogenes.
3. Salmonellatesting of fecalsamples
Various diagnostic testing methods are available
for detecting Salmonella, including culture,
PCR, and ELISA. Culture methods must be used
if antimicrobial susceptibility testing is to be
performed. Culture was the diagnostic method
used in the Dairy 1996, Dairy 2002, and Dairy
2007 studies, and culture methods were similar
across studies. The following culture methods
apply to Dairy 1996, Dairy 2002, and Dairy
2007, unless noted otherwise.
Approximately 1 g of feces from each sample
was placed into each of two culture media—
gram-negative Hajna broth and tetrathionite
broth—which were incubated at 37°C for 24
and 48 h, respectively. Following primary
enrichments, 100 μL culture aliquots from each
broth enrichment were transferred into
Rappaport R-10 medium for secondary
enrichment, giving two Rappaport secondary
enrichments per sample. In each case,
Rappaport R-10 medium was incubated
overnight at 37°C and then streaked onto
brilliant green agar with sulfadiazine and
xylosine-lysine-tergitol-4 (XLT-4) plates,
resulting in four plates per sample. All plates
were incubated overnight at 37°C. At least three
(Dairy 1996) or four (Dairy 2002 and 2007)
colonies having the typical appearance of
Salmonella were inoculated into triple sugar
iron and lysine iron agar slants. All slants were
incubated overnight at 37°C. All isolates
presumed to be Salmonella were serogrouped
using serogroup-specific sera and sent to NVSL
for serotyping. Isolates with different serogroups
from each sample were kept. If all four colonies
from a sample had the same serogroup, only one
isolate was kept.

56 / Dairy 2007
Section III: Sampling and Diagnostic Testing—C. Laboratory Methods
Salmonella isolates were tested for
antimicrobial drug susceptibility at BEAR. For
Dairy 1996, Dairy 2002, and Dairy 2007,
susceptibility testing was conducted with a
custom-designed panel of antimicrobial drugs
using a Sensititre semi-automated testing system
(TREK Diagnostic Systems, Inc.). Antimicrobial
agents included in the custom designed panel
differed slightly for each of the three NAHMS
studies. The minimum inhibitory concentration
(MIC) for each isolate was determined, and each
isolate was classified as susceptible,
intermediate, or resistant, according to
guidelines published by the National Committee
on Clinical Laboratory Standards for broth-
microdilution susceptibility testing, when
available. When guidelines were not available,
breakpoint interpretations were determined
using National Antimicrobial Resistance
Monitoring System (NARMS) guidelines. The
antimicrobials included for all studies included
amikacin, amoxicillin-clavulanic acid,
ampicillin, ceftiofur, ceftriaxone,
chloramphenicol, ciprofloxacin, gentamicin,
kanamycin, nalidixic acid, streptomycin,
tetracycline, and trimethoprim-
sulfamethoxazole. Apramycin was included in
Dairy 1996 only. Cefoxitin was included in
Dairy 2002 and 2007 but not Dairy 1996.
Cephalothin was included in Dairy 1996 and
2002 but not 2007. Ticarcillin was included in
Dairy 1996 only. Sulfamethoxazole was
included in Dairy 1996 and 2002, and then a
similar sulfa antimicrobial, sulfisoxazole,
replaced it in Dairy 2007.

USDA APHIS VS / 57
Section III: Sampling and Diagnostic Testing—C. Laboratory Methods
Breakpoints used for susceptibility testing of Salmonella1,2
Breakpoints (µg/mL)
Antimicrobial Class
Antimicrobial Agent
Susceptible (less than or equal) Intermediate
Resistant (greater than
or equal)
Aminoglycosides
Amikacin 16 32 64
Gentamicin 4 8 16
Kanamycin 16 32 64
Streptomycin 32 NA 64
β-lactam/β-lactamase inhibitor combinations
Amoxicillin-clavulanic acid
8/4 16/8 32/16
Cephems
Cefoxitin 8 16 32
Ceftiofur 2 4 8
Ceftriaxone2 8 16–32 64
Folate pathway inhibitors
Sulfamethoxazole/ sulfisoxazole3
256 NA 512
Trimethoprin-sulfamethoxazole
2/38 NA 4/76
Penicillin Ampicillin 8 16 32
Phenicols Chloramphenicol 8 16 32
Quinolones Ciprofloxacin 1 2 4
Nalidixic acid 16 NA 32
Tetracyclines Tetracycline 4 8 16 1Breakpoints were adopted from CLSI (Clinical and Laboratory Standards Institute), except for streptomycin, which has no CLSI breakpoints. 2CLSI revised the breakpoints for ceftriaxone in its M100-S20 document published in January 2010. The old breakpoints were used for the data in this report. 3Sulfamethoxazole was tested from 1996 through 2003 and was replaced by sulfisoxazole in 2004.

58 / Dairy 2007
Section III: Sampling and Diagnostic Testing—C. Laboratory Methods
4. Campylobactertesting of fecalsamples
Various diagnostic testing methods are available
for detecting Campylobacter. Culture is the
traditional identification method, but PCR is
also commonly used. Culture methods are
required in order to perform antimicrobial
susceptibility testing. Specific PCR and culture
methods differed among the dairy studies, and
diagnostic procedures follow.
Dairy 1996
For Campylobacter testing, a multiplex PCR
was used that allowed for the simultaneous
identification of C. jejuni and C. coli (Harmon
et al., 1997). The assay targeted the flA genes of
C. jejuni and C. coli, which yielded a 460-bp
product. A second set of primers identified a
nucleic acid sequence unique to C. jejuni and
yielded a 160-bp product. Within 36 h of sample
collection, approximately 1 g of feces was
diluted (10 percent wt/vol) in buffered peptone
water (9 mL). An aliquot (0.4 mL) of the fecal
suspension was plated to the surface of modified
blood-free charcoal, cefoperazone deoxycholate
agar (CM 739; Oxoid Ogdensburg, NY) and
incubated microaerobically for 2 to 3 d at 42°C
(Ono et al., 1995). After incubation, bacterial
growth from the first quadrant was harvested
with a bacteriological loop, placed in Tris-
EDTA buffer (pH 7.4, 200μL) and frozen
(-20°C) prior to PCR analysis. The bacterial
suspension in Tris-EDTA (200 μL) was boiled
for 5 min prior to PCR analysis and centrifuged
(13,000 x g, 1 min at room temperature), and a
5-μL aliquot was used as the PCR template.
Samples were subjected to an initial
denaturation step (94°C for 4 min), followed by
25 amplification cycles. Each amplification
cycle consisted of denaturation (1 min at 94°C),
primer annealing (1 min at 45°C), and primer
extension (1 min at 72°C). Final primer
extension (7 min at 72°C) followed the last
amplification cycle. PCR products were
electrophoretically separated (120 V, 45–55
min). C. coli were identified by the appearance
of a 460-bp product, and C. jejuni was identified
by presence of both a 460-bp and a 160-bp
product. Antimicrobial susceptibility testing was
not performed on Campylobacter isolates from
the Dairy 1996 study.
Dairy 2002
Fecal samples were diluted 1:4 and 1:40 in
phosphate-buffered saline. 100-μL aliquots of
each dilution were spread uniformly on
duplicate Campy-Cefex plates (Stern et al.,
1992). The plates were placed in zip-top bags
and incubated microaerobically (5 percent O2,
10 percent CO2, and 85 percent N
2) for 48 h at
42°C. Campylobacter was presumptively
identified from microscope wet mounts of cells
using phase contrast optics at 100x. Samples
from 97 operations were tested for
Campylobacter, and antimicrobial susceptibility
testing was performed on isolates from
94 operations. For 26 operations, all available
isolates were tested for antimicrobial
susceptibility. For cost reasons, 5 isolates (or as
many as were available for operations with
fewer than 5 isolates) were randomly chosen for
antimicrobial susceptibility testing from the
remaining 68 operations. From each sample with
Campylobacter growth, a single colony was
selected for antimicrobial susceptibility testing.
The isolates were identified to the species level

USDA APHIS VS / 59
Section III: Sampling and Diagnostic Testing—C. Laboratory Methods
using the Campylobacter BAX® PCR (DuPont
Qualicon, Wilmington, DE), a multiplex assay
specific for C. coli and C. jejuni (Englen and
Fedorka-Cray, 2002). A total of 532 isolates,
including 473 C. jejuni and 59 C. coli, were
selected for susceptibility testing to
8 antimicrobials. The Etest® method (AB-
Biodisk, Piscataway, NJ) was used according to
the manufacturer’s directions as described by
Englen et al. (2005). Briefly, 150-mm Mueller
Hinton plates containing 5 percent lysed horse
blood (B-D Biosciences, Sparks, MD) were
inoculated with 100 μL of a cell suspension
equal to a 1.0 McFarland standard. The
inoculum was swabbed evenly across the entire
plate surface, and four Etest strips were laid at
right angles onto each plate. The plates were put
into zip-top bags and incubated in a
microaerobic atmosphere (5 percent O2,
10 percent CO2, and 85 percent N
2) for 48 h at
42°C. Following incubation, the point at which
the zone of growth inhibition intersected the
strip was read as the MIC of the antimicrobial in
μg mL-1. Quality control ATCC strains C. jejuni
33560, Escherichia coli 25922, and
Staphylococcus aureus 25923 were tested
biweekly to confirm susceptibility to all eight
antimicrobials. The antimicrobial resistance
break points (MICs) used were those established
by NARMS in accordance with Clinical and
Laboratory Standards Institute guidelines:
azithromycin, >2 μg mL-1; chloramphenicol,
>32 μg mL-1; ciprofloxacin, >4 μg mL-1;
clindamycin, >4 μg mL-1; erythromycin,
>8 μg ml-1; gentamicin, >16 μg ml-1; nalidixic
acid, >32 μg ml-1; tetracycline, >16 μg ml-1.
Dairy 2007
Fecal samples were diluted 1:10 in phosphate-
buffered saline before being enriched in
Bolton’s enrichment broth for 48 h at 42°C
under microaerophilic conditions (5 percent O2,
10 percent CO2, 85 percent N
2). Aliquots
(10 μL) were spread onto Campy-Cefex plates
(Stern et al., 1992) which were incubated as in
2002. Presumptive Campylobacter colonies
were selected by observation of cellular
morphology and motility using a wet mount
under phase-contrast microscopy. Isolates were
identified using the Campylobacter BAX PCR
(DuPont Qualicon, Wilmington, DE), a
multiplex assay specific for C. coli and
C. jejuni. The assay was performed according to
manufacturer directions as previously described
(Englen and Fedorka-Cray, 2002). If a PCR
product was not obtained using the BAX PCR, a
traditional PCR was used as previously
described (Wang et al., 2002). This traditional
PCR can identify C. jejuni, C. coli, C. lari,
C. fetus, and C. upsaliensis. Campylobacter
isolates were susceptibility tested using broth
microdilution in a custom panel of nine
antimicrobials: azithromycin, ciprofloxacin,
clindamycin, erythromycin, florfenicol,
genamicin, nalidixic acid, telithromycin, and
tetracycline. The semi-automated Sensititre™
System (TREK Diagnostic Systems, Inc.,
Cleveland, OH) was used per manufacturer’s
instruction. MICs were determined for each
isolate and classified as susceptible,

60 / Dairy 2007
Section III: Sampling and Diagnostic Testing—C. Laboratory Methods
intermediate, or resistant according to Clinical
and Laboratory Standards Institute standards,
where available. Otherwise, breakpoint
determinations were based on those used by
NARMS (FDA, 2009).
Breakpoints used for susceptibility testing of Campylobacter1
Breakpoints (µg/mL)
Antimicrobial Class
Antimicrobial Agent
Susceptible (less than or equal) Intermediate
Resistant (greater than
or equal)
Aminoglycosides Gentamicin 2 4 8
Ketolides Telithromycin 4 8 16
Lincosamides Clindamycin 2 4 8
Macrolides Azithromycin 2 4 8
Erythromycin 8 16 32
Phenicols Florfenicol2 4 NA 8
Quinolones Ciprofloxacin 1 2 4
Nalidixic acid 16 32 64
Tetracyclines Tetracycline 4 8 16 1Breakpoints were adopted from CLSI (Clinical and Laboratory Standards Institute) when available. 2For florfenicol, only a susceptible breakpoint (=4 µg/mL) has been established. In this report, isolates with an MIC =8 µg/mL are categorized as resistant.

USDA APHIS VS / 61
Section III: Sampling and Diagnostic Testing—D. Testing Methods Overview
D. TD. TD. TD. TD. Tesesesesesting Meting Meting Meting Meting Mettttthods Ovhods Ovhods Ovhods Ovhods Overerererervievievievieviewwwww
The table below presents a synopsis of the
testing methods used on each NAHMS dairy
study, by organism and type of sample.
c. Testing method by NAHMS study, organism, and type of sample
Study Year
1996 2002 2007
Organism/ Sample Type Culture PCR Culture PCR Culture PCR
Salmonella
Individual cow fecal samples X X X
Composite fecal (environmental) samples
X
Bulk-tank milk sample
X X X
Milk filter samples X
Campylobacter
Individual cow fecal samples X X X
Listeria
Bulk-tank milk samples
X X
Milk filter samples X

62 / Dairy 2007
Appendix I: NAHMS Study Methodology—Phase II
Appendix I: NAppendix I: NAppendix I: NAppendix I: NAppendix I: NAHMS SAHMS SAHMS SAHMS SAHMS StudytudytudytudytudyMeMeMeMeMettttthodology—Phase IIhodology—Phase IIhodology—Phase IIhodology—Phase IIhodology—Phase II*****
*For more detailed information about the methodology foreach study, see methodology section of each descriptivereport at: http://nahms.aphis.usda.gov
NAHMS Dairy Studies
1996 2002 2007
Data collection dates 2/26–7/10 3/27–9/25 2/28–8/30
Minimum number of dairy cattle 30 30 30
Number of States 20 21 17
Data collectors State and Federal veterinary medical officers and animal health technicians
Participating States as a percentage of U.S. population coverage
Operations 85.6 86.9 84.7
Cows 82.7 85.7 82.5
Respondent sample profile (herd size)
Small (fewer than 100 cows) 630 400 233
Medium (100–499 cows) 502 392 215
Large (500 or more cows) 87 221 134
Respondent sample profile (region)
East 931 805 474
West 288 208 108
Response category
Survey complete 1,219 1,013 582
Percent of total 76.0 70.4 54.0
Refused 340 335 380
Did not contact 16 76 111
Ineligible 29 14 4
Total 1,604 1,438 1,077

USDA APHIS VS / 63
Appendix II: References
Appendix II: RAppendix II: RAppendix II: RAppendix II: RAppendix II: Refefefefeferererererencesencesencesencesences
Allos BM. Campylobacter jejuni Infections:
update on emerging issues and trends. Clin
Infect Dis 2001; 32(8):1201–1206. Epub 2001
Mar 28. Review.
Altekruse SF, Stern NJ, Fields PI, Swerdlow
DL. Campylobacter jejuni—an emerging
foodborne pathogen. Emerg Infect Dis 1999;
5:28–35.
Atabay HI, Corry JE. The isolation and
prevalence of Campylobacters from dairy cattle
using a variety of methods. J Appl Microbiol
1998; 84:733–740.
Bae W, Kaya KN, Hancock DD, Call DR, Park
YH, Besser TE. Prevalence and antimicrobial
resistance of thermophilic Campylobacter spp.
from cattle farms in Washington State. Appl
Environ Microbiol 2005; 71(1):169–174.
Beach JC, Murano EA, Acuff GR. Prevalence of
Salmonella and Campylobacter in beef cattle
from transport to slaughter. J Food Prot 2002;
65(11):1687–1693.
Blau DM, McCluskey BJ, Ladely SR, Dargatz
DA, Fedorka-Cray PJ, Ferris KE, Headrick ML.
Salmonella in dairy operations in the United
States: prevalence and antimicrobial drug
susceptibility. J Food Prot 2005; 68(4):696–
702.
Bren L. Got milk? Make sure it’s pasteurized.
FDA Consum 2004; 38:29–31.
Centers for Disease Control and Prevention
(CDC). Outbreak of Campylobacter jejuni infections associated with drinking unpasteurized milk procured through a cow-
leasing program—Wisconsin, 2001. MMWR Morb Mortal Wkly Rep 2002; 28:51(25):548–
549.
Centers for Disease Control and Prevention
(CDC). Multistate outbreak of Salmonella serotype typhimurium infections associated with drinking unpasteurized milk—Illinois, Indiana, Ohio, and Tennessee, 2002–2003. MMWR Morb Mortal Wkly Rep 2003; 52(26):613–615.
Centers for Disease Control and Prevention
(CDC). Foodborne disease: frequently asked questions January 10, 2005.
Centers for Disease Control and Prevention
(CDC). Human salmonellosis associated with animal-derived pet treats—United States and Canada, 2005. MMWR Morb Mortal Wkly Rep 2006a; 55(25):702–705.
Centers for Disease Control and Prevention
(CDC). Multistate outbreak of Salmonella typhimurium infections associated with eating ground beef—United States, 2004. MMWR Morb Mortal Wkly Rep 2006b; 55(7):180–182.
Centers for Disease Control and Prevention
(CDC). Preliminary data on the incidence of infection with pathogens transmitted commonly through food—10 States, 2008a. MMWR Morb Mortal Wkly Rep 2009; 58(13):333–337.

64 / Dairy 2007
Appendix II: References
Centers for Disease Control and Prevention
(CDC). Salmonella Surveillance: Annual Summaries, 1996–2006. 2008b. Available at http://www.cdc.gov/ncidod/dbmd/phlisdata/
Salmonella.htm
Centers for Disease Control and Prevention
(CDC). Salmonellosis Disease Listing. 2009. Accessed Nov. 1, 2009.
Centers for Disease Control and Prevention
(CDC). Campylobacteriosis Disease Listing. 2010. Accessed Sept. 27, 2010.
Clark CG, Price L, Ahmed R, Woodward DL, Melito PL, Rodgers FG, Jamieson F, Ciebin B, Li A, Ellis A. Characterization of waterborne outbreak-associated Campylobacter jejuni, Walkerton, Ontario. Emerg Infect Dis 2003;
(10):1232–1241.
Corry JE, Atabay HI. Poultry as a source of Campylobacter and related organisms. Symp Ser Soc Appl Microbiol 2001; 90:96S–114S.
Cummings KJ, Warnick LD, Alexander KA, Cripps CJ, Gröhn YT, James KL, McDonough PL, Reed KE. The duration of fecal Salmonella shedding following clinical disease among dairy cattle in the northeastern USA. Prev Vet Med 2009a; 92(1-2):134–139.
Cummings KJ, Warnick LD, Alexander KA,
Cripps CJ, Gröhn YT, McDonough PL, Nydam
DV, Reed KE. The incidence of salmonellosis
among dairy herds in the northeastern United
States. J Dairy Sci 2009b; 92(8):3766–3774.
Davison HC, Sayers AR, Smith RP, Pascoe SJ,
Davies RH, Weaver JP, Evans SJ. Risk factors
associated with the Salmonella status of dairy
farms in England and Wales. Vet Rec 2006;
159(26):871–880.
Doyle MP, Erickson MC. Summer meeting
2007—the problems with fresh produce: an
overview. J Appl Microbiol 2008; 105(2):317-
330.
Engberg J, On SL, Harrington CS, Gerner-Smidt
P. Prevalence of Campylobacter, Arcobacter,
Helicobacter, and Sutterella spp. in human fecal
samples as estimated by a reevaluation of
isolation methods for Campylobacters. J Clin
Microbiol 2000; 38(1):286–291.
Englen MD, Fedorka-Cray PJ. Evaluation of a
commercial diagnostic PCR for the
identification of Campylobacter jejuni and
Campylobacter coli. Lett Appl Microbiol 2002;
35(4):353–356.
Englen MD, Fedorka-Cray PJ, Ladely SR,
Dargatz DA. Antimicrobial resistance patterns
of Campylobacter from feedlot cattle. J Appl
Microbiol 2005; 99(2):285–291.

USDA APHIS VS / 65
Appendix II: References
Evans S, Davies R. Case control study of
multiple-resistant Salmonella typhimurium
DT104 infection of cattle in Great Britain. Vet
Rec 1996; 139(23):557–558.
Evans MR, Roberts RJ, Ribeiro CD, Gardner D,
Kembrey D. A milk-borne Campylobacter
outbreak following an educational farm visit.
Epidemiol Infect 1996; 117(3):457–462.
Food and Drug Administration (FDA). National
Antimicrobial Resistance Monitoring System—
Enteric Bacteria (NARMS): 2006 Executive
Report, Rockville, MD: U.S. Department of
Health and Human Services, Food and Drug
Administration, 2009.
Fossler CP, Wells SJ, Kaneene JB, Ruegg PL,
Warnick LD, Bender JB, Godden SM, Halbert
LW, Campbell AM, Zwald AM. Prevalence of
Salmonella spp. on conventional and organic
dairy farms. J Am Vet Med Assoc 2004;
225(4):567–573.
Fossler CP, Wells SJ, Kaneene JB, Ruegg PL,
Warnick LD, Bender JB, Eberly LE, Godden
SM, Halbert LW. Herd-level factors associated
with isolation of Salmonella in a multi-state
study of conventional and organic dairy farms I.
Salmonella shedding in cows. Prev Vet Med
2005a; 70(3-4):257–277.
Fossler CP, Wells SJ, Kaneene JB, Ruegg PL,
Warnick LD, Eberly LE, Godden SM, Halbert
LW, Campbell AM, Bolin CA, Zwald AM.
Cattle and environmental sample-level factors
associated with the presence of Salmonella in a
multi-state study of conventional and organic
dairy farms. Prev Vet Med 2005b; 67(1):39–53.
Friedman CR, Neimann J, Wegner HC, Tauxe
RV. Epidemiology of Campylobacter jejuni
Infections in the United States and other
industrialized nations. In Campylobacter, 2nd
ed. Nachamkin I, Blaser MJ. 2000; 121–138.
Washington, DC, American Society for
Microbiology.
Giacoboni GI, Itoh K, Hirayama K, Takahashi
E, Mitsuoka T. Comparison of fecal
Campylobacter in calves and cattle of different
ages and areas in Japan. J Vet Med Sci 1993;
55(4):555–559.
Gupta A, Nelson JM, Barrett TJ, et al.
Antimicrobial resistance among Campylobacter
strains, United States, 1997–2001. Emerg Infect
Dis 2004; 10(6):1102–1109.
Hakkinen M, Heiska H, Hänninen ML.
Prevalence of Campylobacter spp. in cattle in
Finland and antimicrobial susceptibilities of
bovine Campylobacter jejuni strains. Appl
Environ Microbiol 2007; 73(10):3232–3238.
Hanning IB, Nutt JD, Ricke SC. Salmonellosis
outbreaks in the United States due to fresh
produce: sources and potential intervention
measures. Foodborne Pathog Dis 2009;
6(6):635–648.

66 / Dairy 2007
Appendix II: References
Harmon KM, Ransom GM, Wesley IV.
Differentiation of Campylobacter jejuni and
Campylobacter coli by polymerase chain
reaction. Mol Cell Probes 1997; 11(3):195–200.
Harvey RB, Droleskey RE, Sheffield CL,
Edrington TS, Callaway TR, Anderson RC,
Drinnon DL, Ziprin RL, et al. Campylobacter
prevalence in lactating dairy cows in the United
States. J Food Prot 2004; 67: 1476–1479.
Holmberg SD, Wells JG, Cohen ML. Animal-to-
man transmission of antimicrobial-resistant
Salmonella: investigations of U.S. outbreaks,
1971–1983. Science 1984; 225(4664):833–835.
Huston CL, Wittum TE, Love BC, Keen JE.
Prevalence of fecal shedding of Salmonella spp.
in dairy herds. J Am Vet Med Assoc 2002;
220(5):645–649.
Jacobs-Reitsma WF. Campylobacter in the food
supply. In Campylobacter, 2nd ed. Nachamkin I,
Blaser MJ. 2000; 467–481. Washington, DC,
American Society for Microbiology.
Jayarao BM, Henning DR. Prevalence of
foodborne pathogens in bulk tank milk. J Dairy
Sci 2001; 84(10): 2157–2162.
Jayarao BM, Donaldson SC, Straley BA,
Sawant AA, Hegde NV, Brown JL. A survey of
foodborne pathogens in bulk tank milk and raw
milk consumption among farm families in
Pennsylvania. J Dairy Sci 2006; 89(7):2451–
2458.
Kabagambe EK, Wells SJ, Garber LP, Salman
MD, Wagner B, Fedorka-Cray PJ. Risk factors
for fecal shedding of Salmonella in 91 U.S.
dairy herds in 1996. Prev Vet Med 2000;
43(3):177–194.
Malorny B, Hoorfar J, Bunge C, Helmuth R.
Multicenter validation of the analytical accuracy
of Salmonella PCR: towards an international
standard. Appl Environ Microbiol 2003;
69(1):290–296.
Maniatis T, Fritsch EF, Sambrook J. Molecular
Cloning—A Laboratory Manual. 1982; Cold
Spring Harbor Laboratory, Cold Spring Harbor,
NY.
Mead PS, Slutsker L, Dietz V, McCaig LF,
Bresee JS, Shapiro C, Griffin PM, Tauxe RV.
Food-related illness and death in the United
States. Emerg Infect Dis 1999; 5:607–625.
Minihan D, Whyte P, O’Mahony M, Fanning S,
McGill K, Collins JD. 2004. Campylobacter
spp. in Irish feedlot cattle: a longitudinal study
involving pre-harvest and harvest phases of the
food chain. J Vet Med 2004; B51:28–33.
Neimann J, Engberg J, Mølbak K, Wegener HC.
A case-control study of risk factors for sporadic
Campylobacter infections in Denmark.
Epidemiol Infect 2003; 130(3):353–366.
Ono I, Masaki H, Tokumaru Y. Isolation of
Campylobacter spp. from slaughtered cattle and
swine on blood-free selective medium. J Vet
Med Sci 1995; 57(6):1085–1087.

USDA APHIS VS / 67
Appendix II: References
Palumbo JD, Borucki MK, Mandrell RE, Gorski L. Serotyping of Listeria monocytogenes by enzyme-linked immunosorbent assay and identification of mixed-serotype cultures by colony immunoblotting. J Clin Microbiol 2003; 41(2):264–571.
Potter ME, Kaufmann AF, Blake PA, Feldman RA. Unpasteurized milk. The hazards of a health fetish. J Am Med Assoc 1984;
252(15):2048–2052.
Rahn K, De Grandis SA, Clarke RC, McEwen SA, Galán JE, Ginocchio C, Curtiss R 3rd, Gyles CL. Amplification of an invA gene sequence of Salmonella typhimurium by polymerase chain reaction as a specific method of detection of Salmonella. Mol Cell Probes 1992; 6(4):271–
279.
Sato K, Bartlett PC, Kaneene JB, Downes FP. Comparison of prevalence and antimicrobial susceptibilities of Campylobacter spp. isolates from organic and conventional dairy herds in Wisconsin. Appl Environ Microbiol 2004;
70:1442–1447.
Scharff RL. Health-related costs from foodborne illness in the United States. 2010. Accessed Sept.
27, 2010, at http://www.publichealth.lacounty.gov/eh/docs/ReportPublication/HlthRelatedCostsFromFoodborneIllinessUS.pdf
Schildt M, Savolainen S, Hänninen ML. Long-
lasting Campylobacter jejuni contamination of
milk associated with gastrointestinal illness in a
farming family. Epidemiol Infect 2006;
134(2):401–405.
Schleif RF, Wensink PC. Practical Methods in
Molecular Biology. 1981, Springer-Verlag, New
York, NY.
Skirrow MB, Blaser MJ. Clinical aspects of
Campylobacter infection. In Campylobacter,
2nd ed. Nachamkin I, Blaser MJ. 2000; 69–88.
Washington, DC, American Society for
Microbiology.
Smith BP, ed. Large Animal Internal Medicine.
3rd ed. St. Louis, MO, Mosby, Inc. 2002; 775–
779, 355, 1320.
Stanley K, Jones K. Cattle and sheep farms as
reservoirs of Campylobacter. J Appl Microbiol
2003; 94:104S–113S.
Stern NJ, Wojton B, Kwiatek KA. A differential-
selective medium and dry-ice-generated
atmosphere for recovery of Campylobacter
jejuni. J Food Prot 1992; 55:514–517.
Studahl A, Andersson Y. Risk factors for
indigenous Campylobacter infection: a Swedish
case-control study. Epidemiol Infect 2000;
125(2):269–275.
Tam CC, O’Brien SJ, Adak GK, Meakins SM,
Frost JA. Campylobacter coli—an important
foodborne pathogen. J Infect 2003; 47(1):28–
32.

68 / Dairy 2007
Appendix II: References
Troutt HF, Osburn BI. Meat from dairy cows:
possible microbiological hazards and risks. Rev
Sci Tech 1997; 16(2):405–414. Review.
Van Duynhoven YT, Isken LD, Borgen K,
Besselse M, Soethoudt K, Haitsma O, Mulder
B, Notermans DW, De Jonge R, Kock P, Van
Pelt W, Stenvers O, Van Steenbergen J.
Outbreak Investigation Team. A prolonged
outbreak of Salmonella typhimurium infection
related to an uncommon vehicle: hard cheese
made from raw milk. Epidemiol Infect 2009;
137(11):1548–1557.
Van Kessel JS, Karns JS, Gorski L, McCluskey
BJ, Perdue ML. Prevalence of Salmonellae,
Listeria monocytogenes, and fecal coliforms in
bulk tank milk on U.S. dairies. J Dairy Sci
2004; 87(9):2822–2830.
Van Kessel JS, Karns JS, Perdue ML. Using a
portable real-time PCR assay to detect
Salmonella in raw milk. J Food Prot 2003;
66(10):1762–1767.
Walker SJ, Archer P, Banks, JG. Growth of
Listeria monocytogenes at refrigeration
temperatures. J Appl Bacteriol 1990;
68(2):157–162.
Warnick LD, Crofton LM, Pelzer KD, Hawkins
MJ. Risk factors for clinical salmonellosis in
Virginia, USA cattle herds. Prev Vet Med 2001;
49(3–4):259–275.
Wells SJ, Fedorka-Cray PJ, Dargatz DA, Ferris
K, Green A. Fecal shedding of Salmonella spp.
by dairy cows on farm and at cull cow markets.
J Food Prot 2001; 64(1):3–11.
Wesley IV, Wells SJ, Harmon KM, Green A,
Schroeder-Tucker L, Glover M, Siddique I.
Fecal shedding of Campylobacter and
Arcobacter spp. in dairy cattle. Appl Environ
Microbiol 2000; 66:1994–2000.
Whyte P, McGill K, Cowley D, Madden RH,
Moran L, Scates P, Carroll C, O’Leary A,
Fanning S, Collins JD, McNamara E, Moore JE,
Cormican M. Occurrence of Campylobacter in
retail foods in Ireland. Int J Food Microbiol
2004; 95:111–118.
Zhao S, Qaiyumi S, Friedman S, Singh R, Foley
SL, White DG, McDermott PF, Donkar T, Bolin
C, Munro S, Baron EJ, Walker RD.
Characterization of Salmonella enterica
serotype Newport isolated from humans and
food animals. J Clin Microbiol 2003; 41:12;
5366–5371.

USDA APHIS VS / 69
Appendix III: Previously Published Material
Appendix III. PrAppendix III. PrAppendix III. PrAppendix III. PrAppendix III. PreeeeeviouslviouslviouslviouslviouslyyyyyPublished MatPublished MatPublished MatPublished MatPublished Materererererialialialialial
Dairy 1996
USDA. 1998. E. coli O157 and Salmonella status on U.S. dairy operations. USDA–APHIS–
VS, CEAH. Fort Collins, CO. Available at: http://www.aphis.usda.gov/nahms
Wells SJ, Fedorka-Cray PJ, Dargatz DA, Ferris K, Green A. 2001. Fecal shedding of Salmonella spp. by dairy cows on farm and at cull cow markets. J Food Prot 64(1):3–11.
Wesley IV, Wells SJ, Harmon KM, Green A, Schroeder-Tucker L, Glover M, Siddique I. 2000. Fecal shedding of Campylobacter and Arcobacter spp. in dairy cattle. Appl Environ Microbiol 66:1994–2000.
Dairy 2002
Blau DM, McCluskey BJ, Ladely SR, Dargatz DA, Fedorka-Cray PJ, Ferris KE Headrick M. 2005. Salmonella in dairy operations in the United States: prevalence and antimicrobial drug
susceptibility. J Food Prot 68(4):696–702.
Englen MD, Hill AE, Dargatz DA, Ladely SR, Fedorka-Cray PJ. 2007. Prevalence and antimicrobial resistance of Campylobacter in U.S. dairy cattle. J Appl Microbiol
102(6):1570–1577.
Karns JS, Van Kessel JS, McCluskey BJ, Perdue ML. 2005. Prevalence of Salmonella enteric in bulk tank milk from U.S. dairies as determined by polymerase chain reaction. J Dairy Sci
88(10):3475–3479.
USDA. 2003. Salmonella and Campylobacter on U.S. dairy operations. USDA–APHIS–VS, CEAH. Fort Collins, CO. Available at: http://www.aphis.usda.gov/nahms
USDA. 2003. Salmonella and Listeria in bulk tank milk on U.S. dairies. USDA–APHIS–VS, CEAH. Fort Collins, CO. Available at: http://www.aphis.usda.gov/nahms
USDA. 2005. Salmonella on U.S. dairy operations: prevalence and antimicrobial drug susceptibility. USDA–APHIS–VS, CEAH. Fort Collins, CO. Available at: http://www.aphis.usda.gov/nahms
Van Kessel JS, Karns JS, Gorski L, McCluskey BJ, Perdue ML. 2004. Prevalence of Salmonella, Listeria monocytogenes, and fecal coliforms in bulk tank milk on U.S. dairies. J Dairy Sci 87(9):2822–2830.
Dairy 2007
Ruzante JM, Lombard JE, Wagner B, Fossler CP, Karns JS, Van Kessel JA, Gardner IA. 2010. Factors associated with Salmonella presence in environmental samples and bulk tank milk from U.S. dairies. Zoonoses Pub Health. 57:e217-
e225

70 / Dairy 2007
Appendix III: Previously Published Material
USDA. 2009. Prevalence of Salmonella and Listeria in bulk tank milk and in-line filters on U.S. dairies, 2007. USDA–APHIS–VS, CEAH. Fort Collins, CO. Available at: http://www.aphis.usda.gov/nahms
USDA. 2009. Salmonella and Campylobacter on U.S. dairy operations, 1996–2007. USDA–
APHIS–VS, CEAH. Fort Collins, CO. Available at: http://www.aphis.usda.gov/nahms

