food marketers and consumers: implications of rationality asymmetries for food choice and health...
TRANSCRIPT

Food Marketers and Consumers: Implications of Rationality Asymmetries for Food Choice and Health
David R. JustCharles H. Dyson School of Applied Economics and Management
Cornell University

Food Choice and the Rational Man
► Food policy is often designed based on the idea that individuals use information efficiently The consumer will use available information Can weigh the various consequences of their
actions Gives appropriate weight to vague or narrow
information
► Individuals make more than 300 food related decision each day Paying close attention to each would be a waste
of time We naturally fall back on heuristics, habits and
rules of thumb

The Implications of Heuristic Choice
►Heuristics are at best approximations They are subject to serious error under
the wrong conditions E.g., clean plate rule can be reasonable
under some circumstances and not in others
May represent misperceptions►The implication
The consumer makes systematic errors The consumer could be better off
►Cognitive costs are prohibitive
Implications of Heuristics
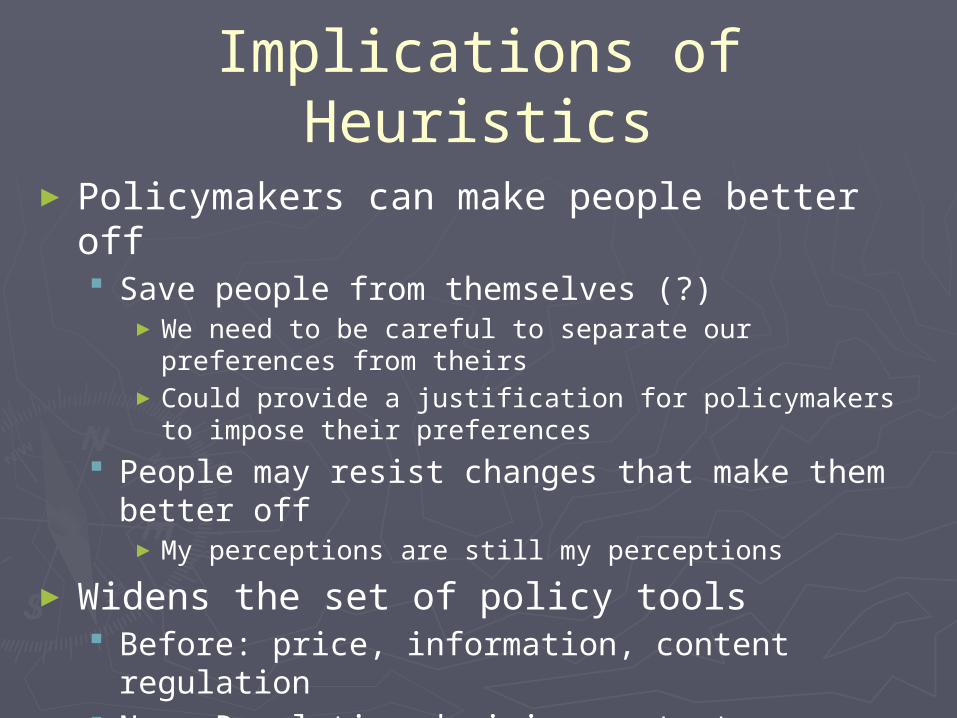
► Policymakers can make people better off Save people from themselves (?)
►We need to be careful to separate our preferences from theirs
►Could provide a justification for policymakers to impose their preferences
People may resist changes that make them better off
►My perceptions are still my perceptions
► Widens the set of policy tools Before: price, information, content regulation Now: Regulating decision context

Some General Principles
► Subtle factors can influence choice Suggestive names, lighting, shapes, colors,
image, etc. Marketers have used this to advantage
► In food decisions, much of the problem stems from not being able to monitor consumption Monitoring consumption requires cognitive resources Factors that make this task more difficult tend to increase
consumption Individuals distort perceived consumption proportional to
serving size Containers or packaging can make monitoring easier
► We are different people when we are distracted
An Extended Example: Portion Sizes and Purchasing
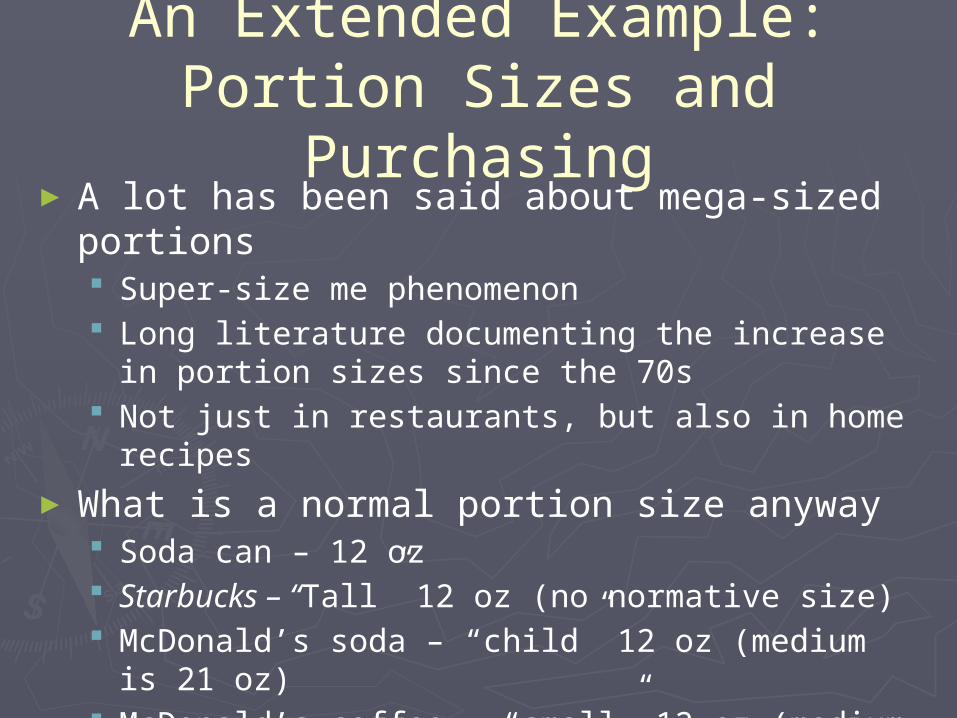
► A lot has been said about mega-sized portions Super-size me phenomenon Long literature documenting the increase in
portion sizes since the 70s Not just in restaurants, but also in home recipes
► What is a normal portion size anyway Soda can – 12 oz Starbucks – “Tall” 12 oz (no normative size) McDonald’s soda – “child” 12 oz (medium is 21
oz) McDonald’s coffee – “small” 12 oz (medium is 16
oz)

Normative Portion Sizes
► Food marketers put a lot of effort into these normative size names►E.g., Wendy’s offers a Single burger, Double,
Triple, a Jr. and a Double Jr. Deluxe (!)
► Why do food retailers use such normative language?
► Two possible motivations►Informational►Framing
Standard Models of Portion Size
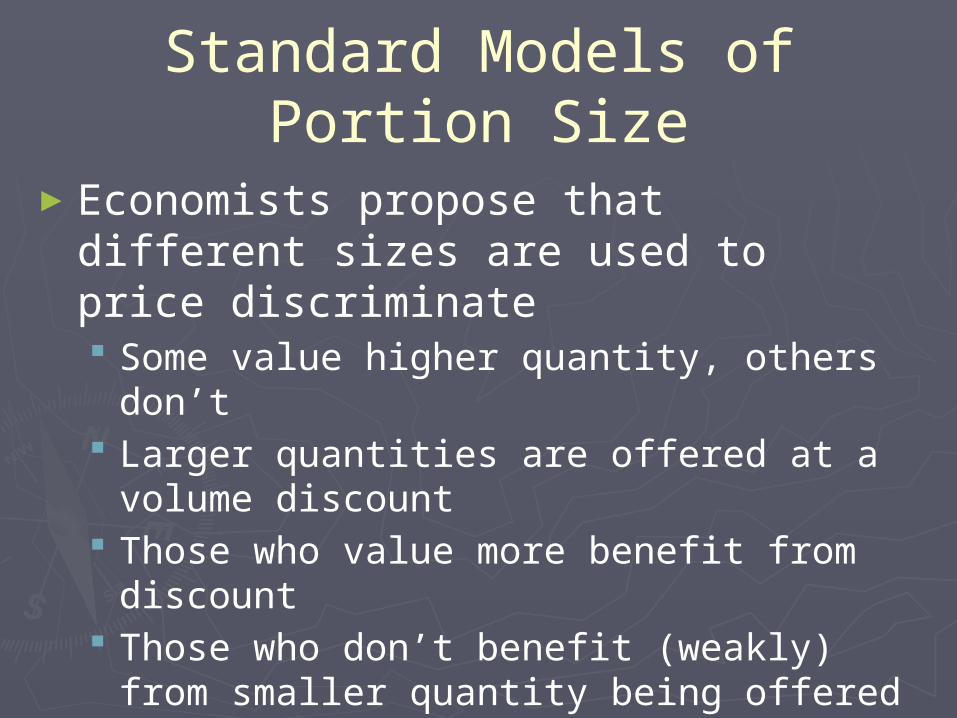
►Economists propose that different sizes are used to price discriminate Some value higher quantity, others don’t Larger quantities are offered at a volume
discount Those who value more benefit from
discount Those who don’t benefit (weakly) from
smaller quantity being offered Profits increase
►Quantity determines utility

Quantity
►Fast Food and Cafeterias Sizes are usually on display Sizes are often posted next to the
normative names►What extra information could the
labels provide? Information about what others are doing? Information about what they want you to
buy?

Framing Effects►How we phrase the question affects
the answer (Tversky and Kahneman)
►If Program A is adopted, 200 people will be saved (72%)
►If Program B is adopted, there is a 1/3 probability that 600 people will be saved and another 2/3 probability that no people will be saved (28%)
►If Program C is adopted, 400 people will die (22%)
►If Program D is adopted, there is a 1/3 probability that nobody will die and 2/3 probability that 600 people will die (78%)
►Imagine that the U.S. is preparing for the outbreak of an unusual Asian disease, whish is expected to kill 600 people. Two alternative programs to combat the disease have been proposed. Assume that the exact scientific estimate of the consequences of the program are as follows:

Framing Effects
► People measure utility against reference points Lower marginal utility for gains than for losses Ratio about ½
► Benartzi and Thaler find evidence in stock prices
► Tversky and Kahneman suggest that framing impacts are prevalent in consumption decisions.
► Normative size names could establish a reference point Regular is the status quo Upgrades above not as valuable as downgrades
below

A Model of Framing Sizes
► Suppose individuals solve
► Subject to► Where
X is a vector of quantities purchased C is the set of available quantity choices
(including origin) p (x) is price (possibly nonlinear) θ is a vector of quantities given the normative
label
max |U x
xC
y p x x
A Model of Framing Cont.
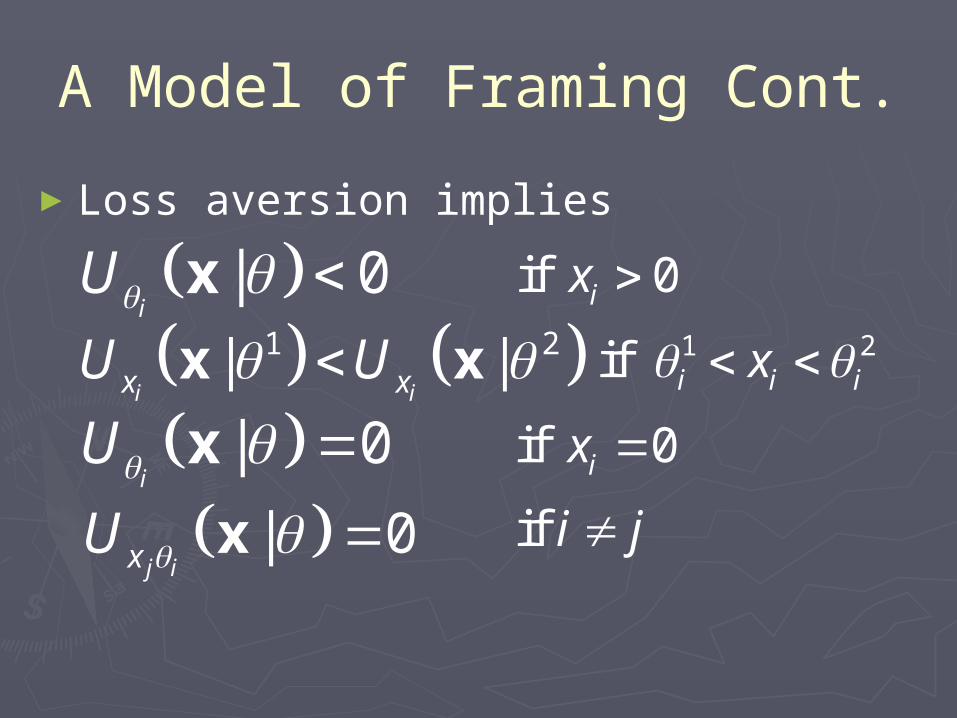
►Loss aversion implies
| 0i
U x if 0ix
1 2| |i ix xU U x x 1 2if i i ix
| 0i
U x if 0ix
| 0j ixU x if i j
Implications of Framing
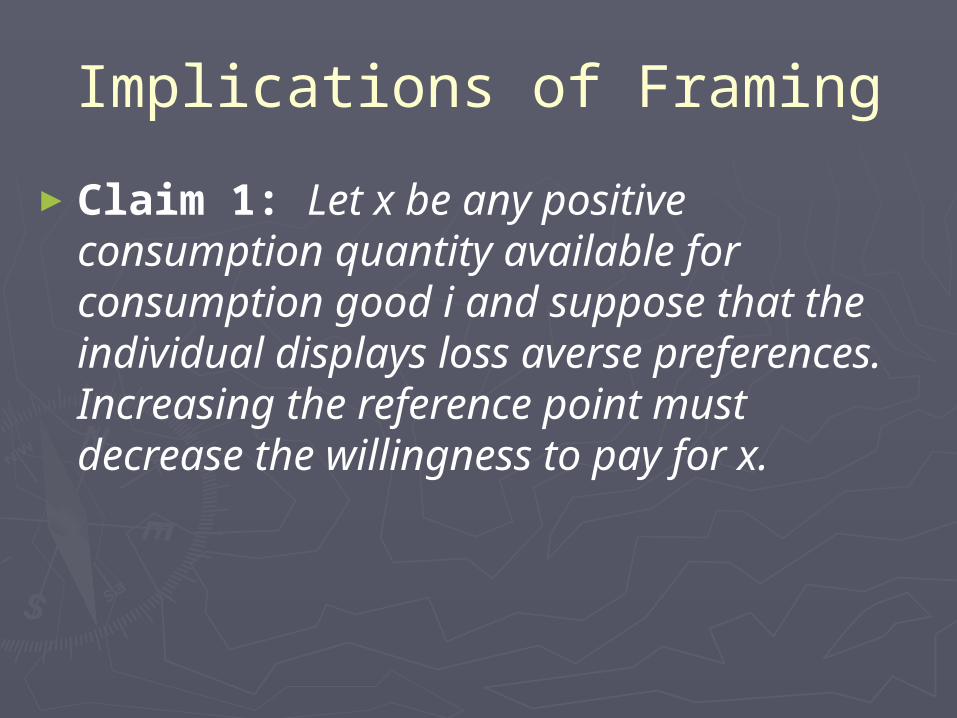
►Claim 1: Let x be any positive consumption quantity available for consumption good i and suppose that the individual displays loss averse preferences. Increasing the reference point must decrease the willingness to pay for x.

Implications of Framing
►Claim 2: Let be any two consumption quantities for a consumption good i and suppose that the individual displays loss averse preferences. If , then increasing θi will increase the willingness to pay for relative to .
x x
,i x x
x x

Implications of Framing
►Claim 3: Let be the only two positive consumption quantities available for consumption good i and suppose that the individual displays loss averse preferences. Changing the reference point from to
may decrease the probability of purchasing either or .
x x
i x
i x
ix x ix x

Framing
►Three hypotheses Increase norm – ambiguous change in
probability of purchase (unless only other choice is 0, then decreases)
Increase norm – increase the WTP to upgrade
Increase norm – decrease WTP for all sizes of goods
►Implication for managers Decrease normative sizes.
Our Experiment
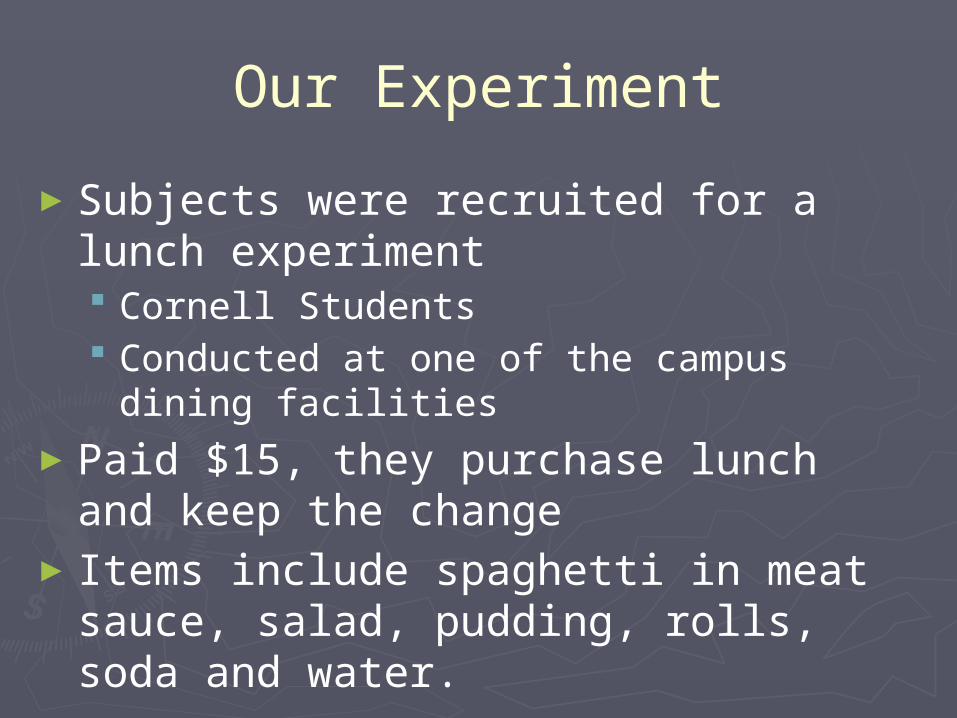
►Subjects were recruited for a lunch experiment Cornell Students Conducted at one of the campus dining
facilities►Paid $15, they purchase lunch and
keep the change►Items include spaghetti in meat sauce,
salad, pudding, rolls, soda and water.

Our Experiment
►Two different sizes were offered (one twice as large as the other) for Pudding Spaghetti Salad
►Sometimes the sizes were labeled “Half” and “Regular”
►Sometime they were labeled “Regular” and “Double”
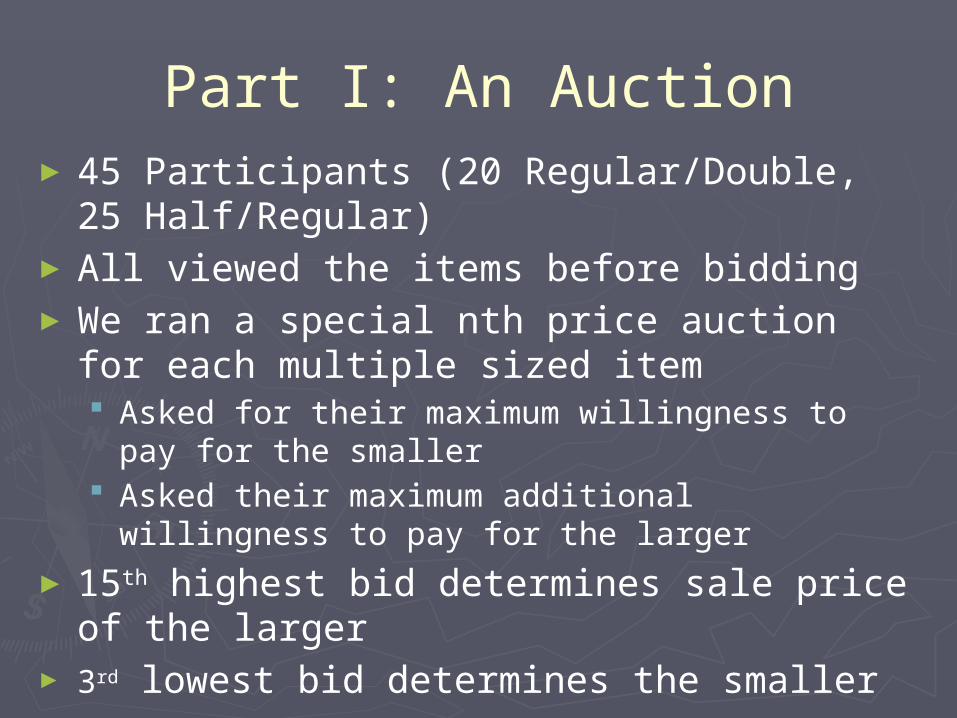
Part I: An Auction► 45 Participants (20 Regular/Double, 25
Half/Regular)► All viewed the items before bidding► We ran a special nth price auction for each
multiple sized item Asked for their maximum willingness to pay for
the smaller Asked their maximum additional willingness to
pay for the larger
► 15th highest bid determines sale price of the larger
► 3rd lowest bid determines the smaller
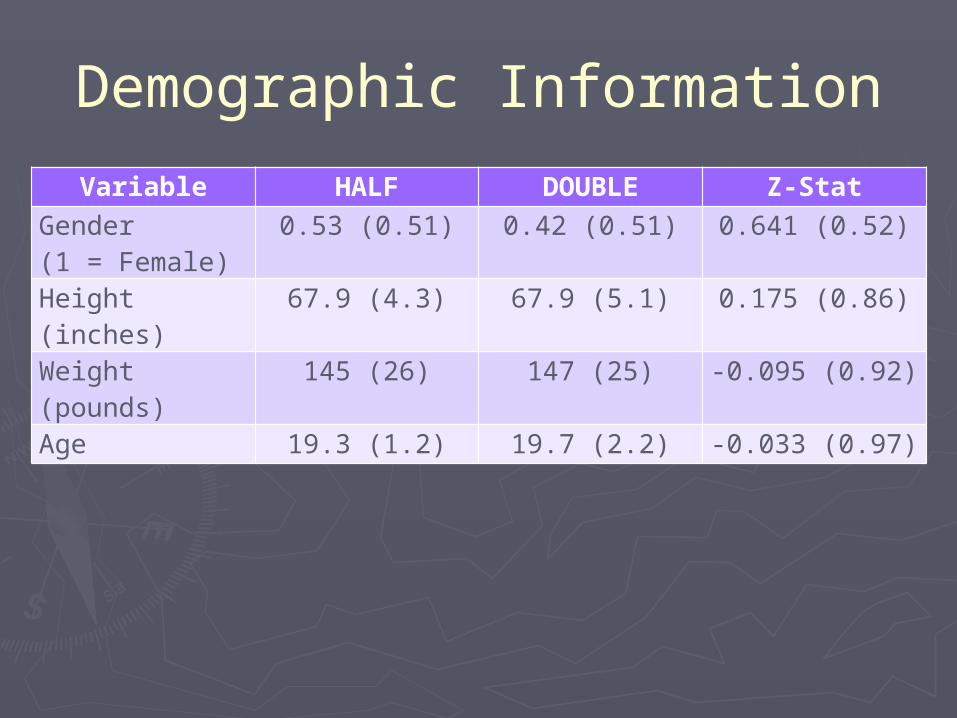
Demographic InformationVariable HALF DOUBLE Z-Stat
Gender (1 = Female)
0.53 (0.51) 0.42 (0.51) 0.641 (0.52)
Height (inches) 67.9 (4.3) 67.9 (5.1) 0.175 (0.86)
Weight (pounds) 145 (26) 147 (25) -0.095 (0.92)
Age 19.3 (1.2) 19.7 (2.2) -0.033 (0.97)
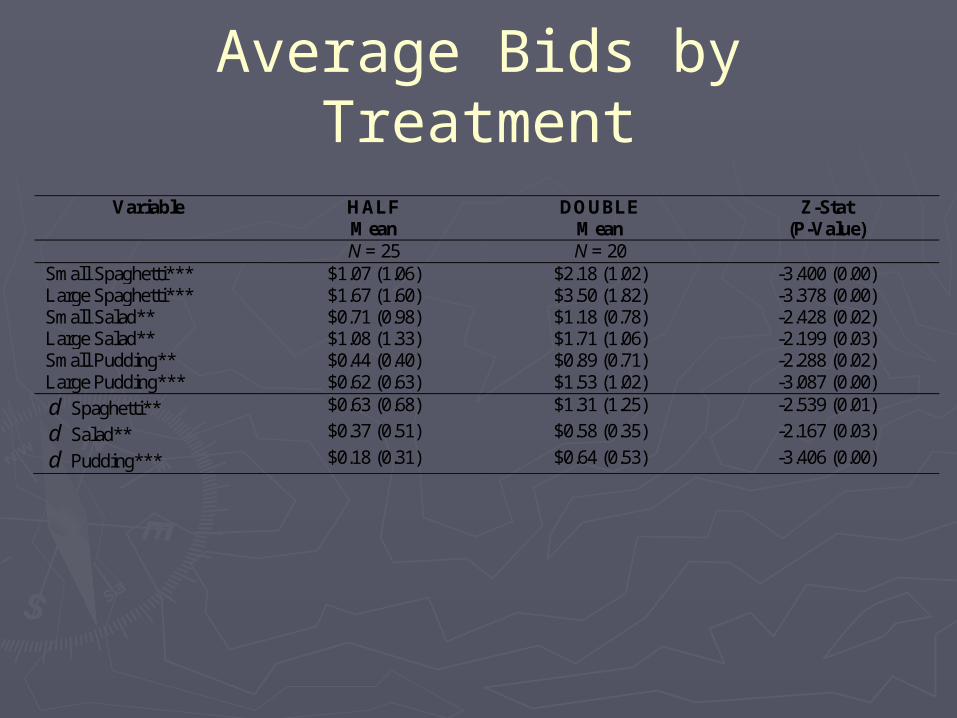
Average Bids by Treatment
Variable HALF Mean
DOUBLE Mean
Z-Stat (P-Value)
N = 25 N = 20 Small Spaghetti*** $1.07 (1.06) $2.18 (1.02) -3.400 (0.00) Large Spaghetti*** $1.67 (1.60) $3.50 (1.82) -3.378 (0.00) Small Salad** $0.71 (0.98) $1.18 (0.78) -2.428 (0.02) Large Salad** $1.08 (1.33) $1.71 (1.06) -2.199 (0.03) Small Pudding** $0.44 (0.40) $0.89 (0.71) -2.288 (0.02) Large Pudding*** $0.62 (0.63) $1.53 (1.02) -3.087 (0.00)
d Spaghetti** $0.63 (0.68) $1.31 (1.25) -2.539 (0.01)
d Salad** $0.37 (0.51) $0.58 (0.35) -2.167 (0.03)
d Pudding*** $0.18 (0.31) $0.64 (0.53) -3.406 (0.00)
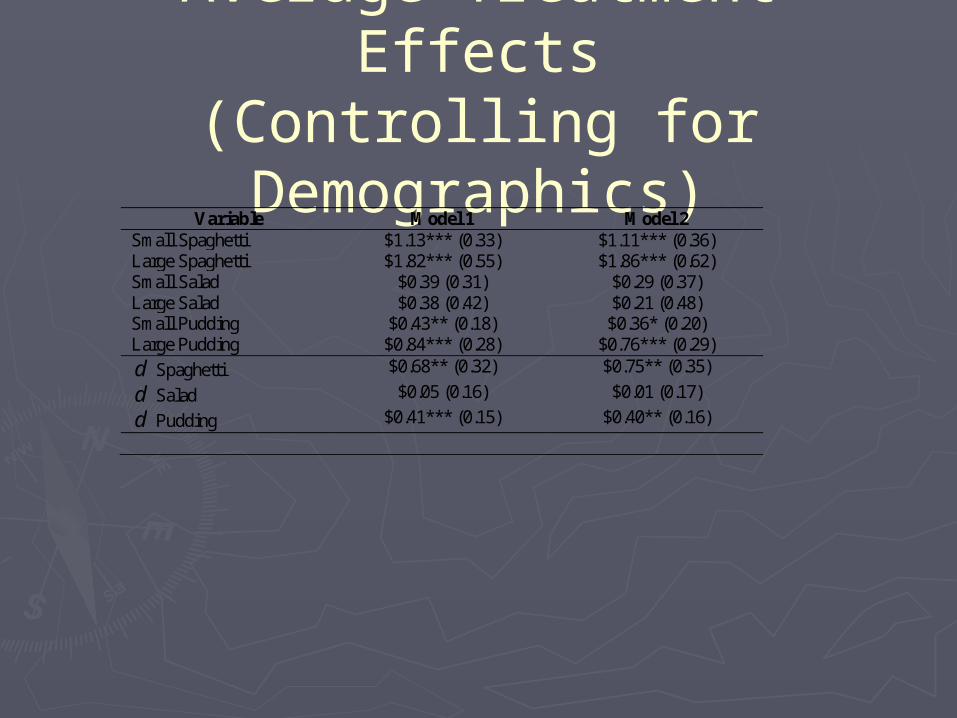
Average Treatment Effects(Controlling for Demographics)
Variable Model 1 Model 2 Small Spaghetti $1.13*** (0.33) $1.11*** (0.36) Large Spaghetti $1.82*** (0.55) $1.86*** (0.62) Small Salad $0.39 (0.31) $0.29 (0.37) Large Salad $0.38 (0.42) $0.21 (0.48) Small Pudding $0.43** (0.18) $0.36* (0.20) Large Pudding $0.84*** (0.28) $0.76*** (0.29)
d Spaghetti $0.68** (0.32) $0.75** (0.35)
d Salad $0.05 (0.16) $0.01 (0.17)
d Pudding $0.41*** (0.15) $0.40** (0.16)
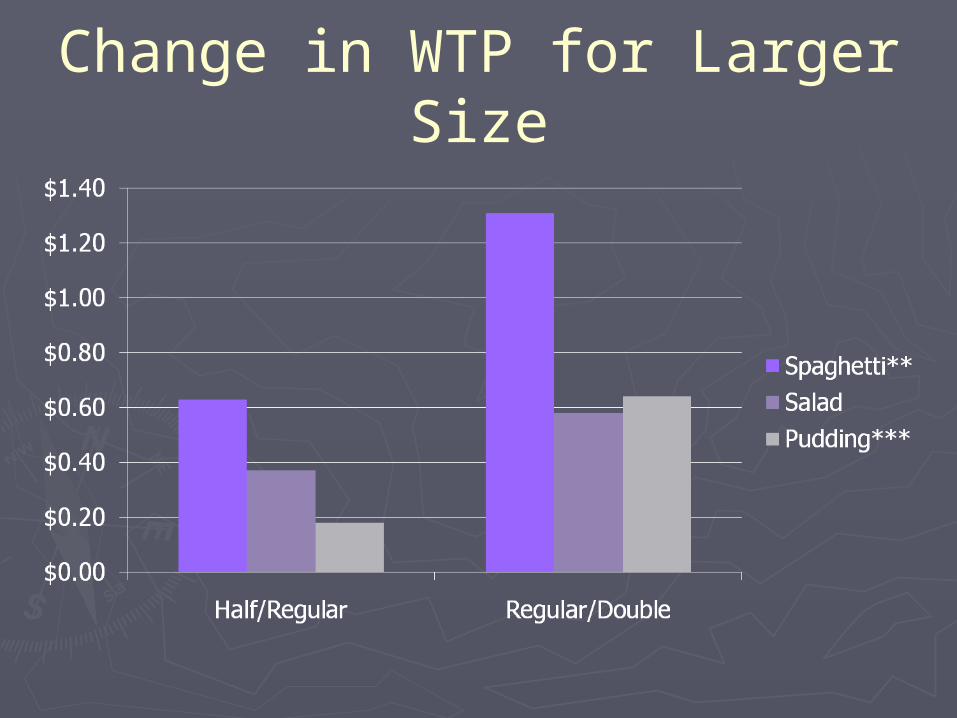
Change in WTP for Larger Size
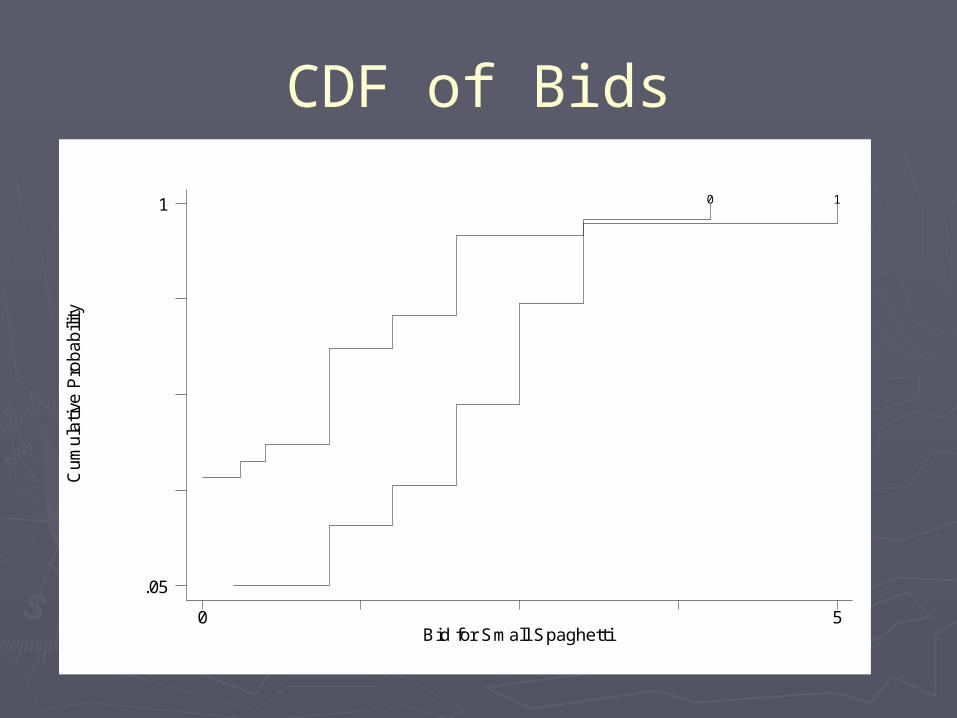
CDF of BidsC
um
ula
tive
Pro
ba
bili
ty
Bid for Small Spaghetti0 5
.05
1 0 1
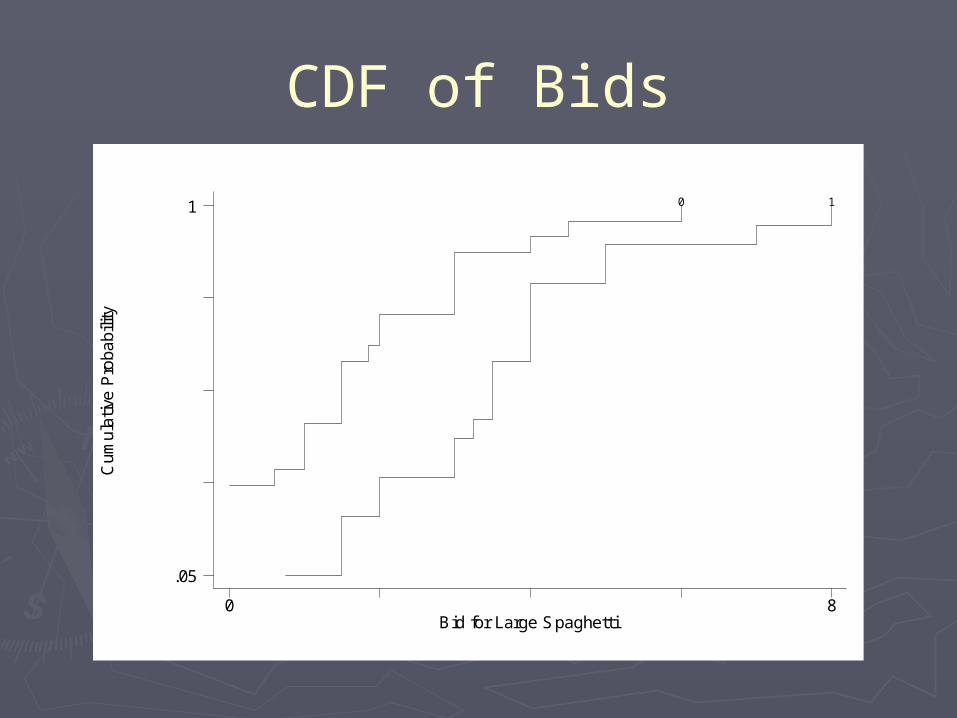
CDF of BidsC
um
ula
tive
Pro
ba
bili
ty
Bid for Large Spaghetti0 8
.05
1 0 1
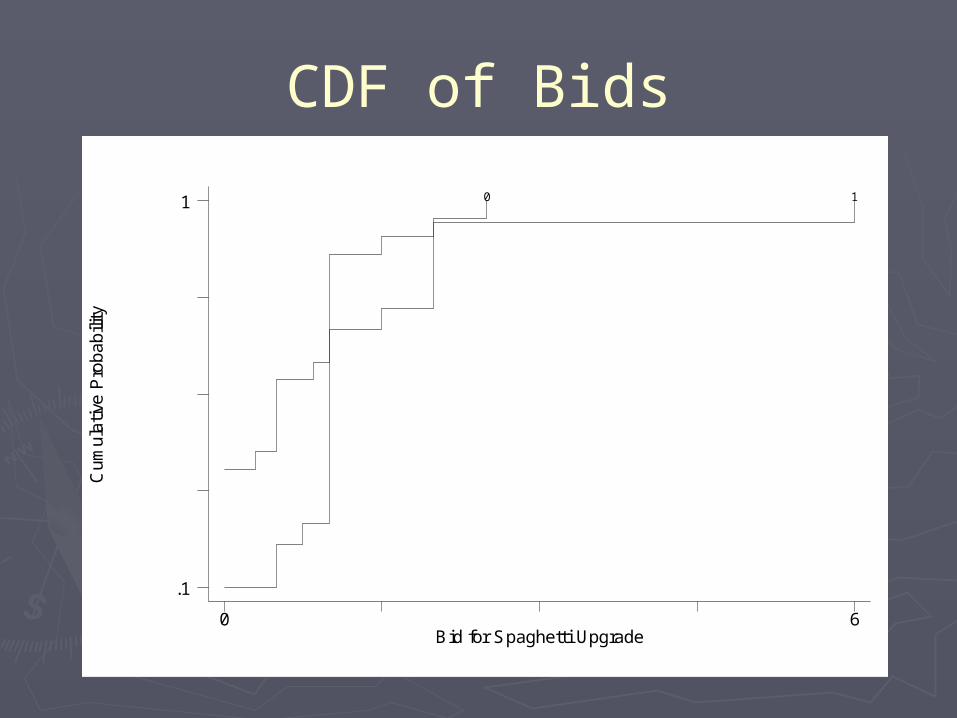
CDF of BidsC
um
ula
tive
Pro
ba
bili
ty
Bid for Spaghetti Upgrade0 6
.1
1 0 1

Interpretation
► There are substantial incentives to name the sizes correctly Total bids increased from $3.37 to $6.97 (P =
0.00)
► The effect was much stronger for the hedonic item Salad increased in price by 66% and 60%
respectively Pudding increased by 102% and 147%
respectively Spaghetti increased by 105% and 108%
respectively
►Note on size of bidding pool

Interpretation
►All bids increase with smaller normative size This is not consistent with LA
►Bids for larger sizes are bigger for regular to double than for half to regular This is also inconsistent with LA
►Hunger attenuates significance (somewhat) Visceral effects (Loewenstein)?
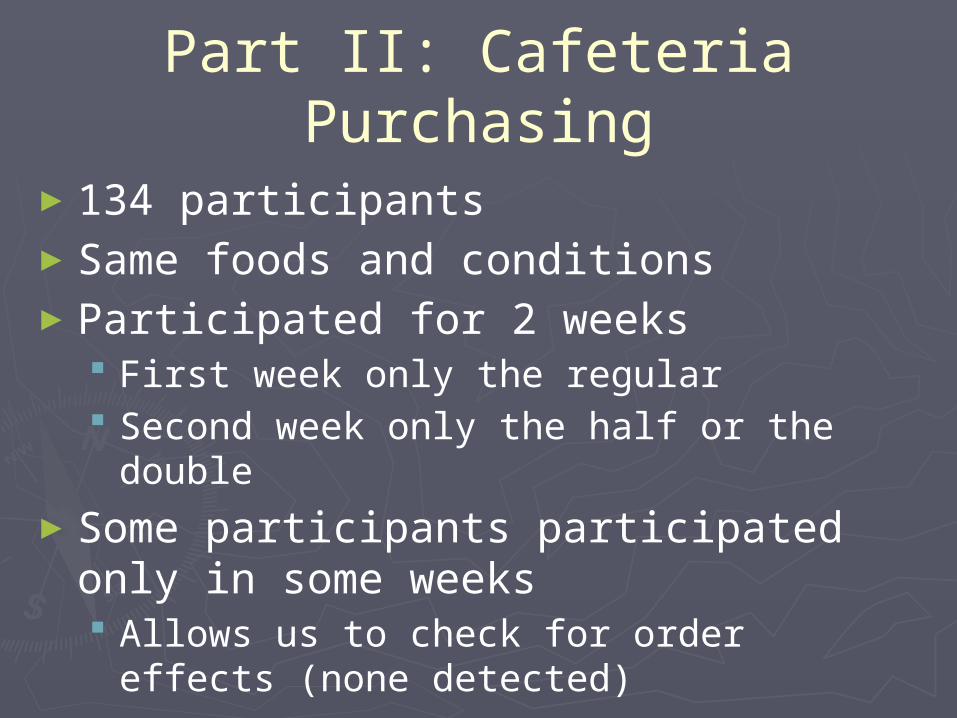
Part II: Cafeteria Purchasing
►134 participants►Same foods and conditions►Participated for 2 weeks
First week only the regular Second week only the half or the double
►Some participants participated only in some weeks Allows us to check for order effects (none
detected)

Cafeteria Prices
► Small Spaghetti$2.50
► Large Spaghetti$3.50
► Small Salad$1.50► Large Salad$2.00► Small Pudding
$1.50► Large Pudding
$2.00
► Roll $0.50► Pepsi $1.00► Ginger Ale $1.00► Water$1.00
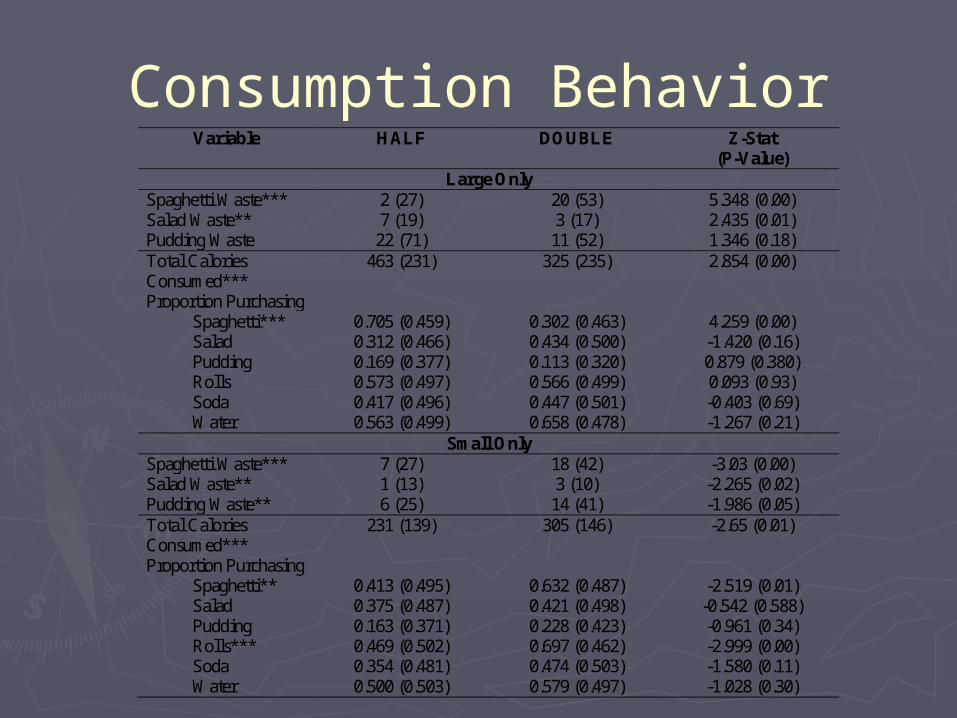
Consumption BehaviorVariable HALF DOUBLE Z-Stat
(P-Value) Large Only
Spaghetti Waste*** 2 (27) 20 (53) 5.348 (0.00) Salad Waste** 7 (19) 3 (17) 2.435 (0.01) Pudding Waste 22 (71) 11 (52) 1.346 (0.18) Total Calories Consumed***
463 (231) 325 (235) 2.854 (0.00)
Proportion Purchasing Spaghetti*** 0.705 (0.459) 0.302 (0.463) 4.259 (0.00) Salad 0.312 (0.466) 0.434 (0.500) -1.420 (0.16) Pudding 0.169 (0.377) 0.113 (0.320) 0.879 (0.380) Rolls 0.573 (0.497) 0.566 (0.499) 0.093 (0.93) Soda 0.417 (0.496) 0.447 (0.501) -0.403 (0.69) Water 0.563 (0.499) 0.658 (0.478) -1.267 (0.21)
Small Only Spaghetti Waste*** 7 (27) 18 (42) -3.03 (0.00) Salad Waste** 1 (13) 3 (10) -2.265 (0.02) Pudding Waste** 6 (25) 14 (41) -1.986 (0.05) Total Calories Consumed***
231 (139) 305 (146) -2.65 (0.01)
Proportion Purchasing Spaghetti** 0.413 (0.495) 0.632 (0.487) -2.519 (0.01) Salad 0.375 (0.487) 0.421 (0.498) -0.542 (0.588) Pudding 0.163 (0.371) 0.228 (0.423) -0.961 (0.34) Rolls*** 0.469 (0.502) 0.697 (0.462) -2.999 (0.00) Soda 0.354 (0.481) 0.474 (0.503) -1.580 (0.11) Water 0.500 (0.503) 0.579 (0.497) -1.028 (0.30)

Controlling for Demographics
Variable Model 1 Model 2 Large Only
Spaghetti Waste -86*** (18) -82*** (20) Salad Waste -5 (3) -7** (3) Pudding Waste -18 (12) -3 (14) Total Calories Consumed
-102** (46) -83 (53)
Small Only Spaghetti Waste 13** (6) 12* (7) Salad Waste 1 (2) 1 (3) Pudding Waste 8 (7) 10 (8) Total Calories Consumed
76*** (25) 58** (28)
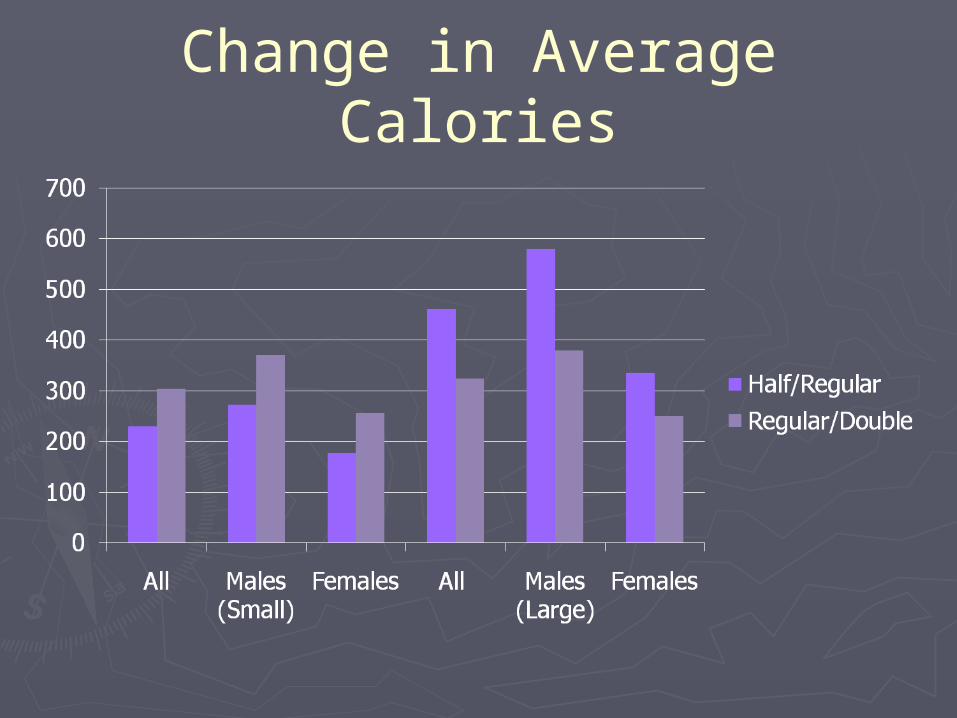
Change in Average Calories

Percent Purchasing

Interpreting
► People consume more calories when we call it a regular 32% or 36% depending on size
► Probability of purchase goes both ways (only significant up when regular) Seems to depend on type of dish LA says decreases
►People use size names to determine how much to leave!

Implications
► Willingness to pay responds to normative language Significant increases in WTP by lowering norm
(like a social norm) Upgrades more valuable above the norm
(violates LA, also inconsistent with social norms) “Regular” increases purchase only for some
foods (like loss aversion)
►Do we need another model? Maybe the label is informative
Labels as Information
► Individuals respond poorly to visual cues Can’t estimate size well (tall vs. short) Respond to plate and utensil size We eat with our eyes (soup bowls)
► What if people use names as a crutch I know about how much I am willing to pay for a
“regular” – but adjust for perceived size Double that for a double (with some adjustment
downward) Halve it for a half (with some adjustment
upward)
►Might explain the plate waste
Implications for Retailers
►Higher WTP for larger names may encourage larger and larger portions Credibility issues may lead to a treadmill
►Responds like an anomaly Exacerbated by stress, hunger,
distractions Thus, normative sizes more effective in
fast food or convenience food What about more hedonic food?
Factors Affecting Food Choice
► Cognitive Experiential Self Theory (Epstein, 1993) Two systems used to evaluate every stimulus Experiential system makes snap judgments based on affect Cognitive process makes deliberative evaluations based on
rational thinking Processing resources (time, stress, distractions) determines
which rules► When resources are few, convenience, affect, and
salience dominate► When resources are many, prices and health
information► Hedonic vs. utilitarian foods
“wants” vs. “shoulds” More willing to acquire a should than give up a want Significant reactance
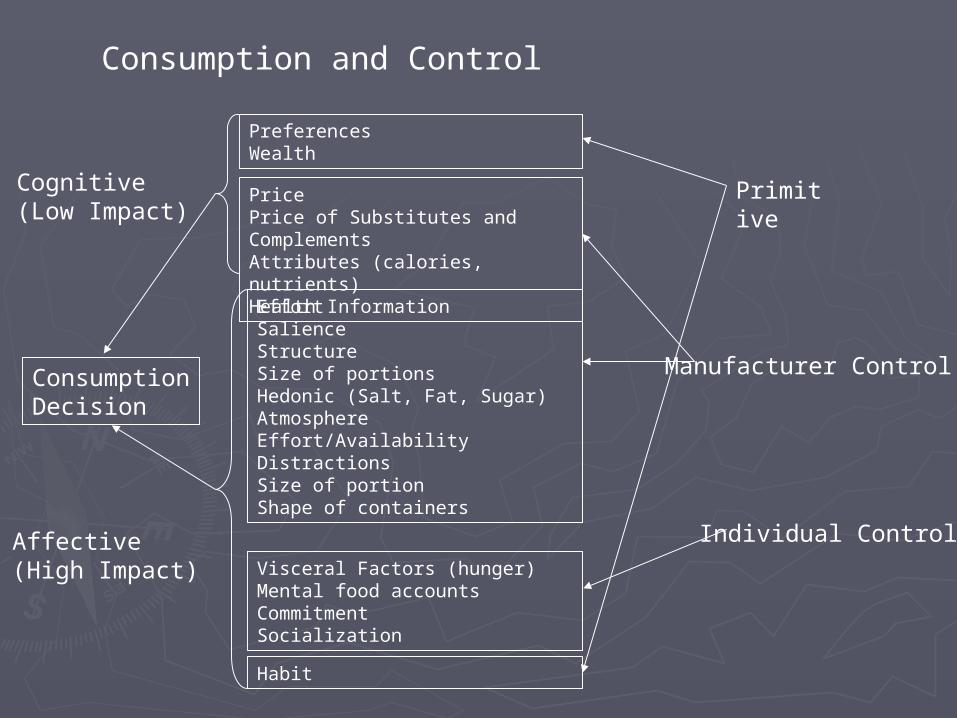
ConsumptionDecision
Visceral Factors (hunger)Mental food accountsCommitmentSocialization
Cognitive(Low Impact)
Affective(High Impact)
PricePrice of Substitutes and ComplementsAttributes (calories, nutrients)Health Information
PreferencesWealth
EffortSalienceStructureSize of portionsHedonic (Salt, Fat, Sugar)AtmosphereEffort/AvailabilityDistractionsSize of portionShape of containers
Habit
Individual Control
Primitive
Manufacturer Control
Consumption and Control
The Role of Marketing
► Individuals control some of the important factors► Food manufacturers, retailers and marketers control
the majority of factors► Hence, consumption decisions (food and amount)
are the result of a game between manufacturers and consumers Consumers are not entirely aware of their
behavior Marketers are!
►Or maybe just behave ‘as if’► This is a mechanism design problem
Could result in a loss of wellbeing due to incomplete or asymmetric information
Does asymmetric rationality work the same way?

The Consumer► The consumer problem can be represented
as
► Where ϕ is the level of cognitive resources determined exogenously At least the individual isn’t aware of how their
actions affect it
► The variable s is an external cue that influences choice, like portion size
► The variable q is the choice variable (e.g., quantity) that influences utility (taste and health)
,
max 1 |s
c a sq Q s S
U u q u q s p

Food Manufacturers/Retailers
►Food sellers wish to maximize profits To do this they choose the available cues
(S ), prices and the available choices (QS ) Of course sellers may respond to
heuristics also►I assume that over time they happen
upon the profit maximizing choice sets They behave as if they know the
consumer’s active preferences

A Model of Food Transactions
►The producer solves
subject to
►Here k is the unit for which the individual is charged Package size, or quantity consumed, etc.
, ,max ( , ) ,
s ss
S Q pp k q s c q s
,
max 1 |s
c a sq Q s S
U u q u q s p

Asymmetry of Rationality
►The seller knows she will receive
►The consumer behaves as if there is probability ϕ of receiving
and probability (1- ϕ) of receiving► In actuality the consumer always
receives
* ( *, *) *, *sp k q s c q s
* *c su q p
* | * *a su q s p
* *c su q p
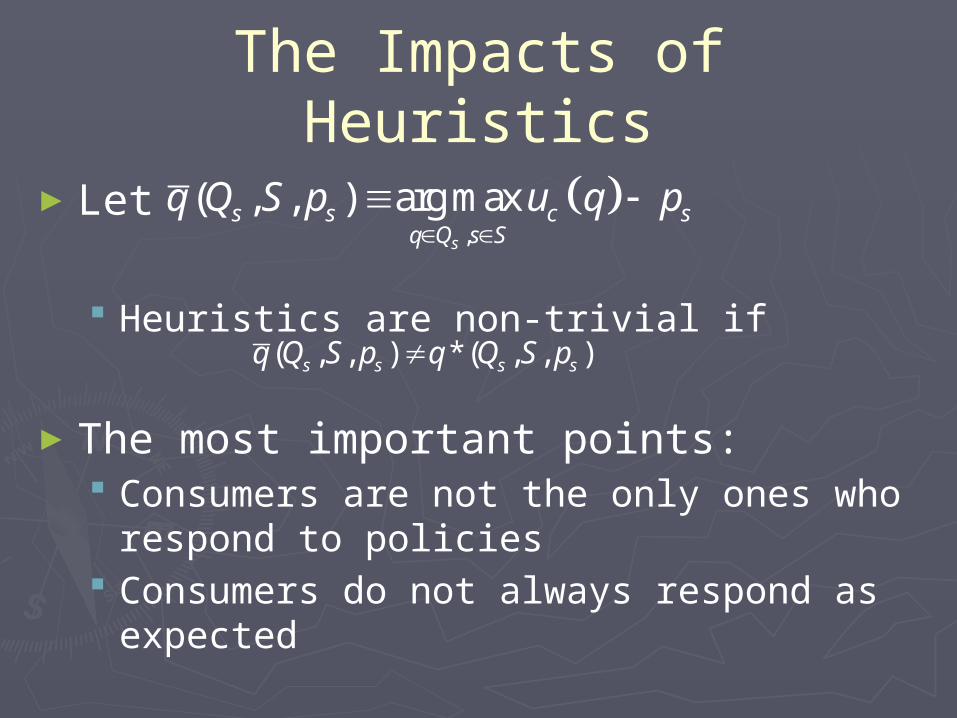
The Impacts of Heuristics
►Let
Heuristics are non-trivial if
►The most important points: Consumers are not the only ones who
respond to policies Consumers do not always respond as
expected
,
( , , ) arg maxs
s s c sq Q s S
q Q S p u q p
( , , ) *( , , )s s s sq Q S p q Q S p
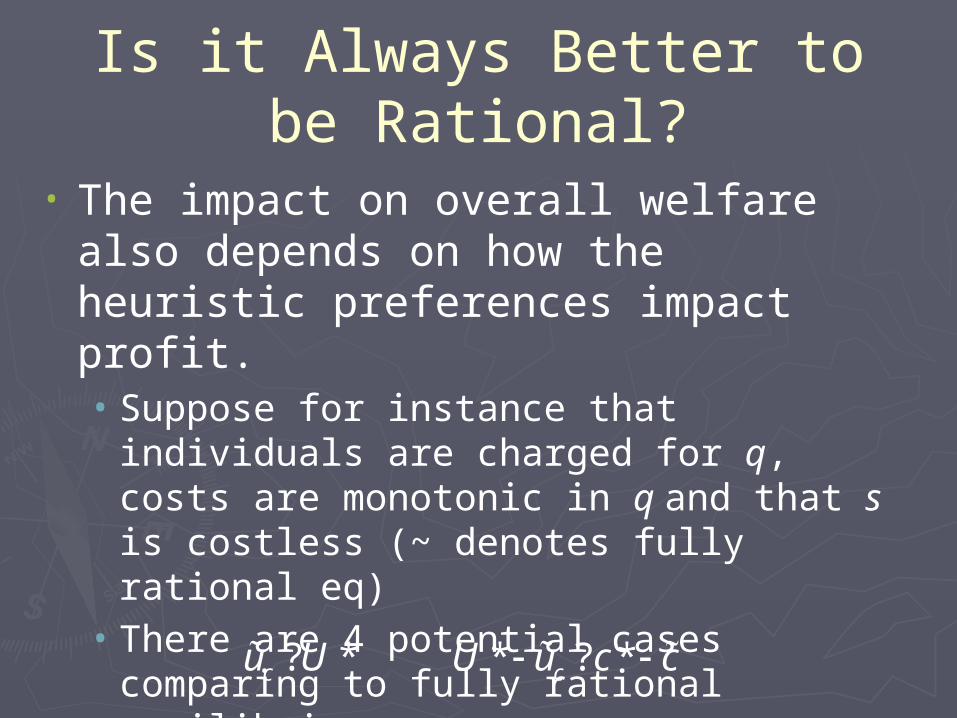
Is it Always Better to be Rational?
• The impact on overall welfare also depends on how the heuristic preferences impact profit. • Suppose for instance that individuals are
charged for q, costs are monotonic in q and that s is costless (~ denotes fully rational eq)
• There are 4 potential cases comparing to fully rational equilibrium
• Depends on the relationship of ? * * ? *c cu U U u c c
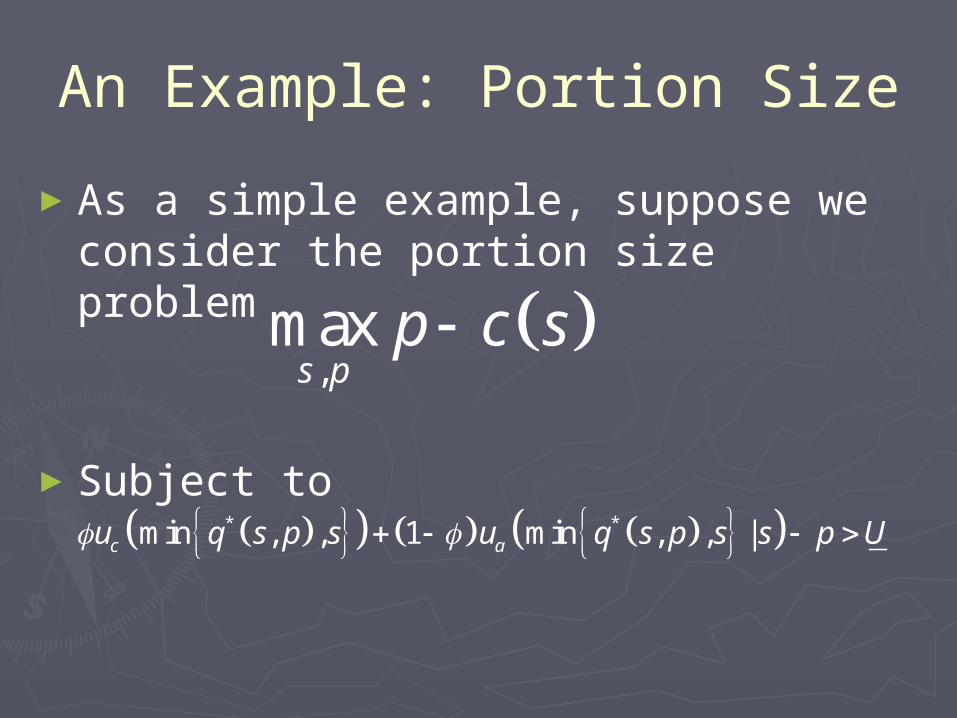
An Example: Portion Size
►As a simple example, suppose we consider the portion size problem
►Subject to
,
maxs p
p c s
* *min , , 1 min , , |c au q s p s u q s p s s p U
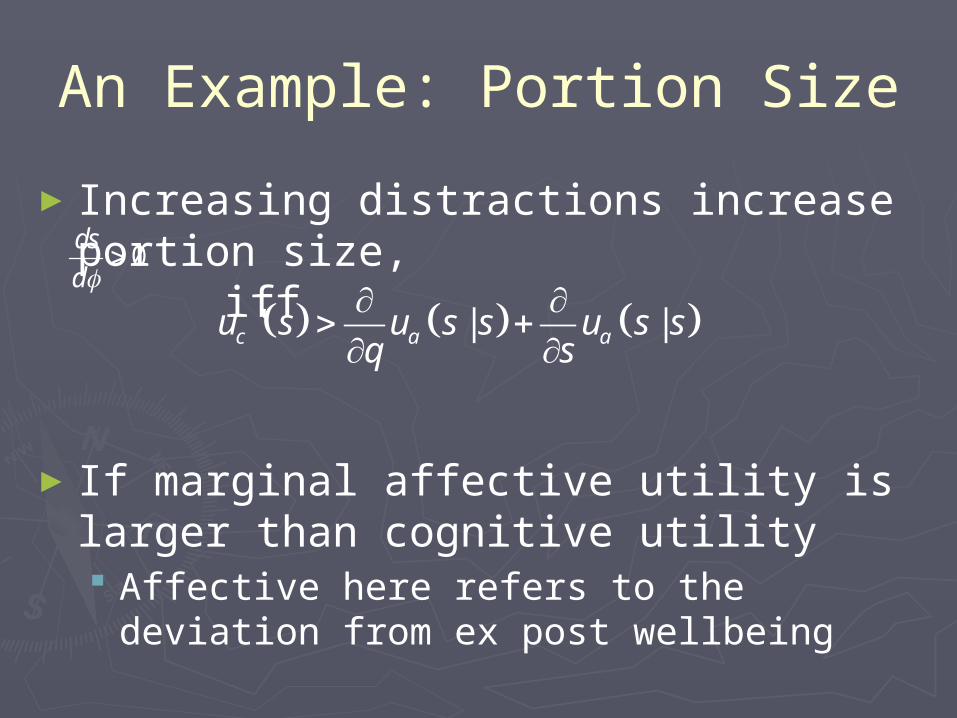
An Example: Portion Size
►Increasing distractions increase portion size, iff
►If marginal affective utility is larger than cognitive utility Affective here refers to the deviation from
ex post wellbeing
0ds
d
' | |c a au s u s s u s sq s
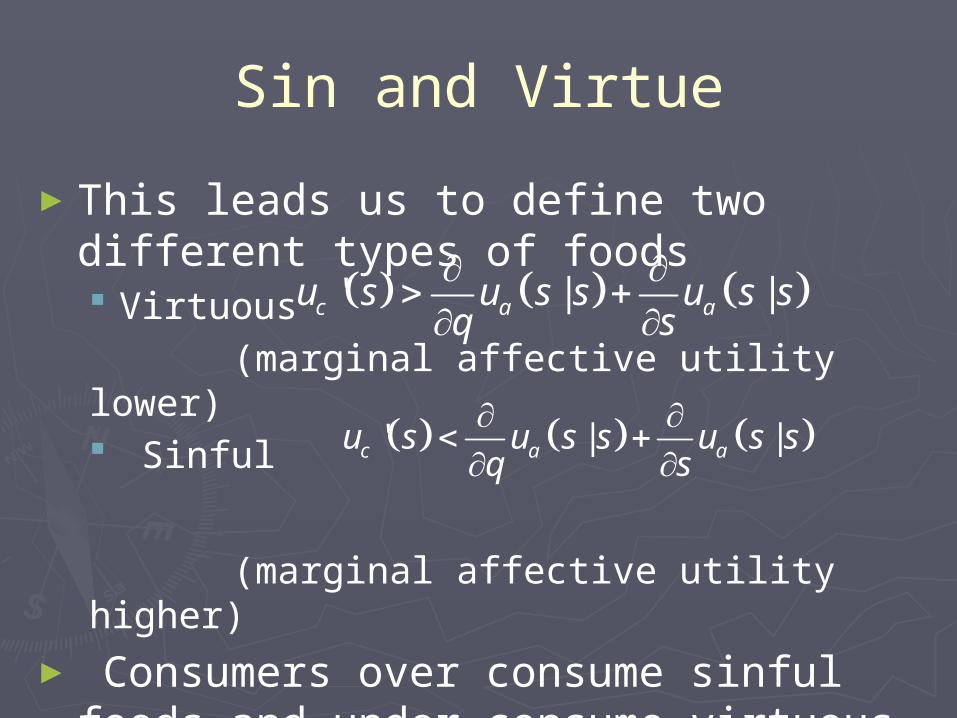
Sin and Virtue
►This leads us to define two different types of foods Virtuous
(marginal affective utility lower) Sinful
(marginal affective utility higher)
► Consumers over consume sinful foods and under consume virtuous foods
' | |c a au s u s s u s sq s
' | |c a au s u s s u s sq s
Sin and Virtue
►Result 1: As cognitive resources decrease, portion sizes will increase more for more sinful foods and could decrease for virtuous foods We should see some separation
►Result 2: As cognitive resources decrease, uniformly more sinful foods will be marketed Hard to market health as convenience
food If marketing sinful foods, you want to
encourage distraction
Sin and Virtue
► I will present some graphical examples using sinful foods Many things flip when we examine virtuous foods I will comment on how this changes things
without showing the graphs
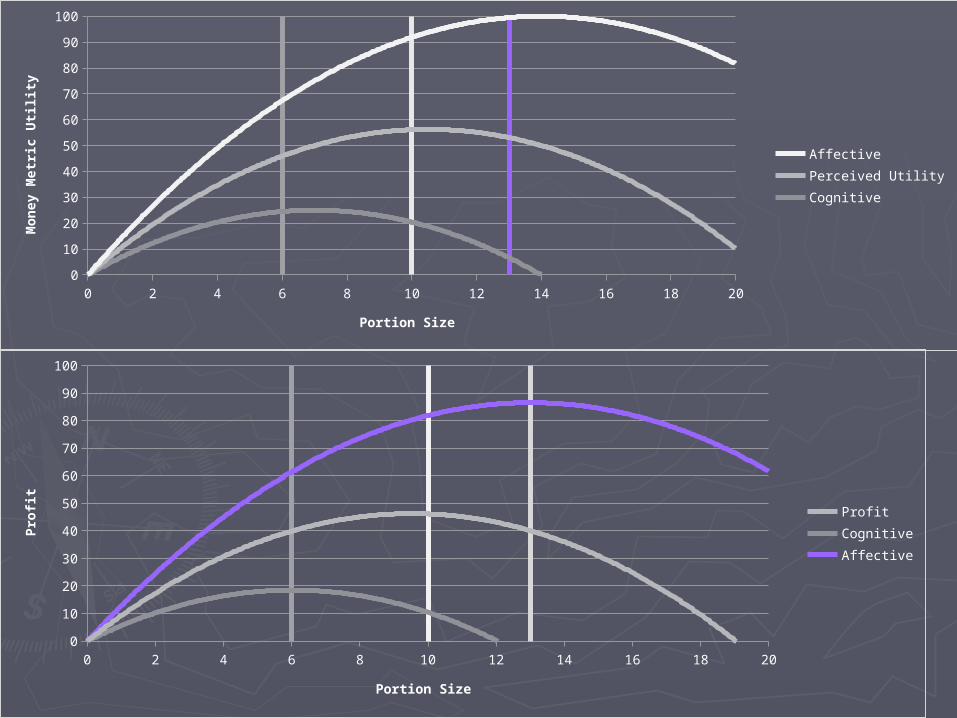
► Graphs assume linear costs, and a strong version of sinful Cognitive arg max is lower, and maximum is
lower Much more richness if this is not the case, but
the simple model demonstrates how unintended consequences can happen
0 2 4 6 8 10 12 14 16 18 200
10
20
30
40
50
60
70
80
90
100
AffectivePerceived UtilityCognitive
Portion Size
Money M
etr
ic U
tility
0 2 4 6 8 10 12 14 16 18 200
10
20
30
40
50
60
70
80
90
100
ProfitCognitiveAffective
Portion Size
Pro
fit
Taxing Size
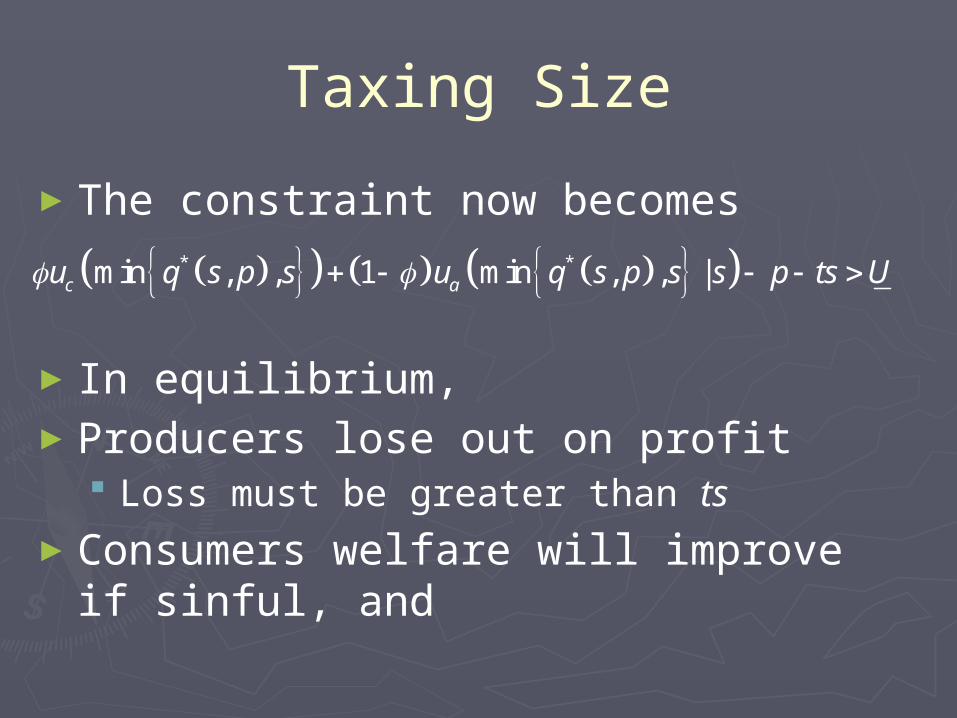
►The constraint now becomes
►In equilibrium, ►Producers lose out on profit
Loss must be greater than ts►Consumers welfare will improve if
sinful, and
* *min , , 1 min , , |c au q s p s u q s p s s p ts U

0 2 4 6 8 10 12 14 16 18 200
10
20
30
40
50
60
70
80
90
100
ProfitWith Tax
Portion Size
Pro
fit
0 2 4 6 8 10 12 14 16 18 200
10
20
30
40
50
60
70
80
90
100
AffectivePerceived UtilityCognitive
Portion Size
Money M
etr
ic U
tility

Welfare: Taxing Large Portions
► Producers will always perceive a loss of Profit
► Consumers will too if any surplus shared This will be unpopular with all involved in the
transaction
► May or may not increase consumer welfare Depends on how sinful the food is Reactance can also either increase or decrease
welfare
► Incentive to reduce cognitive resources persists If they can influence this at some cost, the
equilibrium will be lead closer to the non-regulation

Welfare: Subsidizing Large Virtuous Portions
►Profits to the firm increase►Consumers may also if surplus is
shared Thus this may be a very popular program
with all involved in the transaction►Will always increase consumer welfare►Incentive to increase cognitive
resources persists►Food may go to waste if subsidy
exceeds decline in perceived utility

Regulating Context
►Suppose instead we considered regulating context Naming of portion size? Requiring an important cognitive cue
►Suppose we could shift the perceived utility closer to the cognitive utility Could try to increase cognitive resources
(distractions) Could try to alter affective utility function
(names, atmospheric cues)

0 2 4 6 8 10 12 14 16 18 200
10
20
30
40
50
60
70
80
90
100
AffectivePerceived UtilityCognitive
Portion Size
Money M
etr
ic U
tility
0 2 4 6 8 10 12 14 16 18 200
10
20
30
40
50
60
70
80
90
100
ProfitCognitiveAffective
Portion Size
Pro
fit
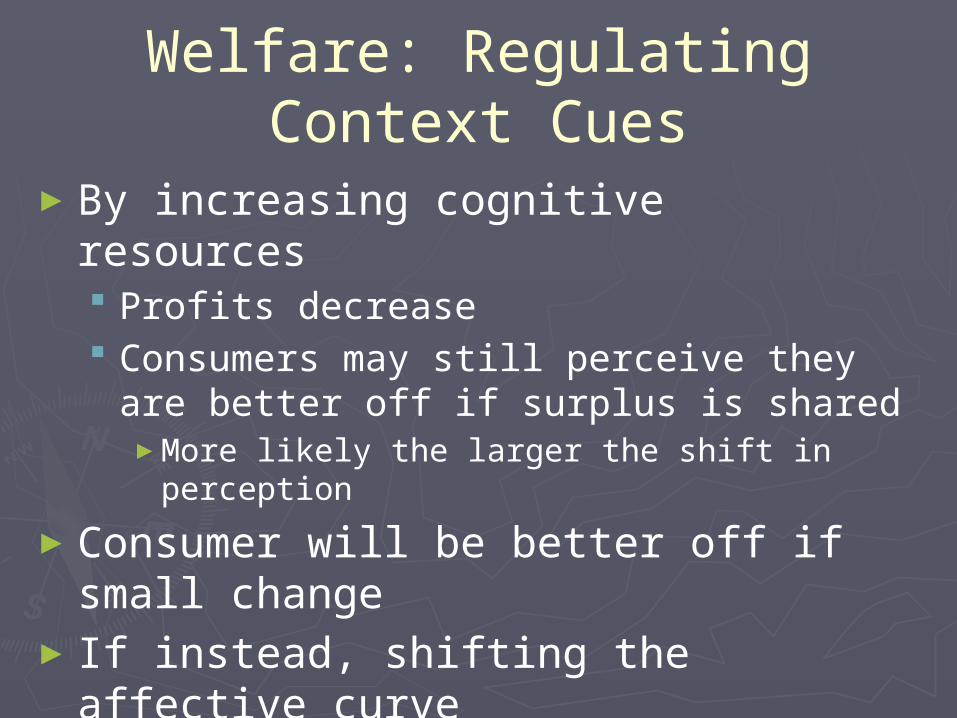
Welfare: Regulating Context Cues
►By increasing cognitive resources Profits decrease Consumers may still perceive they are
better off if surplus is shared ►More likely the larger the shift in perception
►Consumer will be better off if small change
►If instead, shifting the affective curve Profits may increase This may be more politically feasible

Regulating Context for Virtuous Foods
►Increasing cognitive resources and/or reshaping the affective curve will Increase profits Increased consumer perceived welfare if
surplus is shared Thus this would be popular with actors
►Consumer will be better off

Conclusion
► Ignoring behavioral economics won’t make it go away Even very traditional policies may interact with
behavioral cues ►Could make policies ineffective or even self defeating
► Regulators may be able to use behavioral cues to create much more promising policy options Policies that potentially improve profits and
welfare Such creative solutions have proven to be very
effective in some contexts Could also allow win/win solutions Need to know what we cannot observe