fomc 20080130 g bpt 220080123
TRANSCRIPT

Prefatory Note The attached document represents the most complete and accurate version available based on original files from the FOMC Secretariat at the Board of Governors of the Federal Reserve System. Please note that some material may have been redacted from this document if that material was received on a confidential basis. Redacted material is indicated by occasional gaps in the text or by gray boxes around non-text content. All redacted passages are exempt from disclosure under applicable provisions of the Freedom of Information Act.
Content last modified 03/07/2014.

Class III FOMC - Internal (FR)
CURRENT ECONOMICAND FINANCIAL CONDITIONS
Part 2
Recent Developments
Prepared for the Federal Open Market Committeeby the staff of the Board of Governors of the Federal Reserve System
January 23, 2008

Class III FOMC - Internal (FR)
January 23, 2008
Recent Developments
Prepared for the Federal Open Market Committeeby the staff of the Board of Governors of the Federal Reserve System

Domestic NonfinancialDevelopments

Domestic Nonfinancial Developments
II-1
1 The Bureau of Labor Statistics (BLS) will revise the March 2007 level of payroll employment in its January 2008 employment report. Based on its preliminary estimate, we expect the BLS to revise down the level of private nonfarm payrolls about 200,000.
Aggregate economic activity appears to have decelerated sharply. Notably, the contraction in homebuilding intensified in the fourth quarter and shows few signs of letting up. Retail sales were weak in December, perhaps reflecting the combined influence of rapidly rising energy prices, eroding housing and equity wealth, and depressed consumer sentiment. The very-limited available information about auto sales in January suggests some softening from the reasonably steady pace of the preceding several months. Sentiment appears to have soured on the business side as well, and industrial production contracted in the fourth quarter. Conditions in the labor market also deteriorated noticeably near year-end, with private payroll employment posting a small decline in December and the unemployment rate rising sharply. As for inflation, both headline and core measures have increased in recent months. The twelve-month change in overall consumer prices is up a good bit from its year-earlier levels because of higher price inflation for both food and energy; core price inflation is roughly unchanged, on net, over that period.
Labor Market Developments Hiring slowed to a trickle late last year. After an increase of 87,000 in November, private nonfarm payrolls decreased 13,000 last month, as employment declined sharply in manufacturing, construction, and retail trade—the last of which reversed much of November’s outsized increase. On average, private nonfarm employment rose 37,000 in November and December, only about half of the average pace seen from July to October, which had itself been a step-down from the gains in the first half of the year.1 Over the year as a whole, the deterioration in labor demand was most pronounced in the construction and financial activities industries, which have been hardest hit by the difficulties in the housing and mortgage markets. Nevertheless, the job cutbacks seen so far in the residential construction industry have been smaller than would be expected given the plunge in homebuilding.
The average workweek of production or nonsupervisory workers on private nonfarm payrolls held steady in December, at 33.8 hours; aggregate hours also were unchanged for the month. In the fourth quarter, aggregate hours of private production or nonsupervisory workers rose at an annual rate of 1.0 percent.

II-2
2000 2002 2004 2006-400
-300
-200
-100
0
100
200
300
400
-400
-300
-200
-100
0
100
200
300
400Thousands
1999 2001 2003 2005 2007
Dec.
3-month moving average
Changes in Private Payroll Employment
2000 2002 2004 200633.0
33.5
34.0
34.5
35.0 Hours
94
96
98
100
102
104
106
108
1102002 = 100
1999 2001 2003 2005 2007
Workweek(left scale)
Aggregate hours (right scale)
Dec.
Aggregate Hours and Workweek of Production or Nonsupervisory Workers
Changes in Employment(Thousands of employees; seasonally adjusted)
2007
Measure and sector 2006 H1 Q3 Q4 Oct. Nov. Dec.
Average monthly change Monthly change
Nonfarm payroll employment (establishment survey) 189 134 77 97 159 115 18 Private 169 114 61 61 110 87 -13 Natural resources and mining 5 3 2 3 0 5 5 Manufacturing -7 -14 -21 -22 -23 -13 -31 Construction 11 -3 -23 -35 -20 -37 -49 Wholesale trade 11 9 9 4 12 3 -1 Retail trade -3 10 -0 -4 -20 32 -24 Transportation and utilities 9 1 9 2 0 9 -3 Information 2 3 0 -8 -5 -5 -13 Financial activities 16 4 -7 -7 -2 -16 -4 Professional and business services 42 16 23 51 70 39 43 Temporary help services -1 -9 -9 12 23 12 0 Nonbusiness services1 83 86 70 77 98 70 64 Total government 20 20 15 36 49 28 31 Total employment (household survey) 264 23 58 -16 -244 631 -436 Memo:Aggregate hours of private production workers (percent change)2 2.5 1.6 1.2 1.0 .1 .1 .0 Average workweek (hours)3 33.8 33.8 33.8 33.8 33.8 33.8 33.8 Manufacturing (hours) 41.1 41.1 41.3 41.2 41.2 41.3 41.1
1. Nonbusiness services comprises education and health, leisure and hospitality, and "other." 2. Establishment survey. Annual data are percent changes from Q4 to Q4. Quarterly data are percent changes from precedingquarter at an annual rate. Monthly data are percent changes from preceding month. 3. Establishment survey.

II-3
2000 2001 2002 2003 2004 2005 2006 200765.6
65.8
66.0
66.2
66.4
66.6
66.8
67.0
67.2
67.4
67.6 Percent
3.0
3.5
4.0
4.5
5.0
5.5
6.0
6.5
7.0Percent
Unemployment rate (right scale)
Participation rate (left scale)
Dec.
Labor Force Participation Rateand Unemployment Rate
2000 2001 2002 2003 2004 2005 2006 20070.6
0.8
1.0
1.2
1.4
0.6
0.8
1.0
1.2
1.4Percent
2001 2003 2005 2007
3-month moving average (thick line)
Job Losers UnemployedLess Than 5 Weeks
(as a percent of household employment)
Dec.
2000 2001 2002 2003 2004 2005 2006 20071.0
1.5
2.0
2.5
3.0
3.5
4.0
1.0
1.5
2.0
2.5
3.0
3.5
4.0Percent
2001 2003 2005 2007
Dec.
Unemployed Due to Job Loss(as a percent of the labor force)
Selected Unemployment and Labor Force Participation Rates(Percent; seasonally adjusted)
2007
Rate and group 2007 Q2 Q3 Q4 Oct. Nov. Dec.
Civilian unemployment rateTotal 4.6 4.5 4.7 4.8 4.8 4.7 5.0 Teenagers 15.7 15.7 15.8 16.4 15.7 16.4 17.1 20-24 years old 8.2 7.8 8.6 8.6 8.6 8.0 9.4 Men, 25 years and older 3.6 3.5 3.6 3.7 3.7 3.6 3.8 Women, 25 years and older 3.6 3.6 3.7 3.8 3.7 3.8 3.9
Labor force participation rateTotal 66.0 66.0 66.0 66.0 65.9 66.0 66.0 Teenagers 41.3 41.5 40.7 41.0 41.2 40.9 41.0 20-24 years old 74.4 74.2 74.4 74.0 73.9 74.3 73.9 Men, 25 years and older 75.6 75.6 75.6 75.5 75.3 75.6 75.6 Women, 25 years and older 59.7 59.6 59.8 59.7 59.6 59.8 59.7

II-4
Labor Market Indicators
2000 2002 2004 2006 20081.0
1.5
2.0
2.5
3.0 Percent
250
300
350
400
450
500
550Thousands
2000 2002 2004 2006 2008
Initial claims*(right scale)
Jan. 12
Insured unemployment rate(left scale)
Jan. 5
*4-week moving average.
Unemployment Insurance
2000 2002 2004 2006 20080
50
100
150
200
250
300 Thousands
0.8
1.0
1.2
1.4
1.6
1.8Percent of private employment
1999 2001 2003 2005 2007
Nov.
Layoffs and discharges(monthly, right scale)
Dec.
Announced job cuts(left scale)
Note. Both series are seasonally adjusted by FRB staff. Source. For layoffs and discharges, Job Openings andLabor Turnover Survey; for job cuts, Challenger, Gray,and Christmas, Inc.
Layoffs and Job Cuts
2000 2002 2004 2006 20080
5
10
15
20
25
30
0
5
10
15
20
25
30Percent
2000 2002 2004 2006 2008
Manpower, Inc.
National Federation ofIndependent Business*(3-month moving average)
Q1
Dec.
Note. Percent planning an increase in employmentminus percent planning a reduction. *Seasonally adjusted by FRB staff.
Net Hiring Plans
2000 2002 2004 2006 20081.5
2.0
2.5
3.0
3.5
4.0
4.5
1.5
2.0
2.5
3.0
3.5
4.0
4.5Percent of private employment
1999 2001 2003 2005 2007
Nov.
Job openings
Hires (monthly)
Source. Job Openings and Labor Turnover Survey.
Job Openings and Hires
2000 2002 2004 2006 200880
100
120
140
160
80
100
120
140
160Index
2000 2002 2004 2006 2008
Reuters/Michigan Expected Unemployment Change (next 12 months)
Jan.(p)
Note. The fraction of households expecting unemploymentto rise, minus the fraction expecting unemployment to fall, plus 100. p Preliminary.
2000 2002 2004 2006 200810
15
20
25
30
35
40
45 Percent
10
30
50
70
90
110
130
150Index
1999 2001 2003 2005 2007
Job Availability and Hard-to-Fill Positions
*Proportion of households believing jobs are plentiful, minus the proportion believing jobs are hard to get, plus 100. **Percent of small businesses surveyed with at least one"hard-to-fill" job opening. Seasonally adjusted by FRB staff. Source. For job availability, Conference Board; for hard-to-fill, National Federation of Independent Business.
Job availability*(right scale)
Hard-to-fill**(left scale)
Dec.

II-5
Output per Hour(Percent change from preceding period at an annual rate;
seasonally adjusted)
2005:Q3 2006:Q3 2006 2007to to
Sector 2006:Q3 2007:Q3 Q4 Q1 Q2 Q3
Nonfarm business All persons .1 2.71 1.8 .6 2.2 6.21
All employees2 .1 2.41 1.5 .2 2.6 5.41
Nonfinancial corporations3 1.7 2.0 1.3 .7 2.1 4.2
1. Staff estimates. 2. Assumes that the growth rate of hours of non-employees equals the growth rate of hours of employees. 3. All corporations doing business in the United States except banks, stock and commodity brokers,and finance and insurance companies. The sector accounts for about two-thirds of business employment.Nonfinancial corporate output is calculated as an income-side measure.
In the household survey, the unemployment rate jumped to 5.0 percent in December, while the labor force participation rate held steady at 66.0 percent. The unemployment rate moved up ½ percentage point from May to December. In the past, increases of this magnitude have been associated with periods of substantial and prolonged labor market weakness.
Most other indicators of labor demand have also weakened. Initial and continuing claims for unemployment insurance moved higher in November and December, consistent with slowing employment growth.2 Layoffs and discharges in the Job Openings and Labor Turnover (JOLT) survey rose sharply between July and November, and higher unemployment among job losers accounted for about half of the increase in the overall jobless rate over the second half of the year. The most recent readings on net hiring plans from Manpower and the National Federation of Independent Business (NFIB) point to a further slowdown in hiring. In contrast to these downbeat readings, announcements of job cuts reported by Challenger, Gray, and Christmas continued to trend down through year-end.
Other indicators of labor market tightness have also pointed toward some softening of labor market conditions. Unemployment expectations in the Reuters/University of Michigan Survey jumped in December and remained elevated in early January. Moreover, respondents to the Conference Board survey reported that job availability eroded further in December, and fewer small businesses in the NFIB survey reported 2 Initial claims have dropped back down in the last two weeks. However, unemployment insurance claims are very difficult to adjust for seasonal variation at this time of year, and thus we are not taking much signal from the recent declines.

II-6
Selected Components of Industrial Production (Percent change from preceding comparable period)
Proportion 2007 20072007 20071
Component (percent) Q3 Q4 Oct. Nov. Dec.
Total 100.0 1.8 3.6 -1.0 -.5 .3 .0Previous 100.0 ... 3.9 ... -.7 .3 ...
Manufacturing 81.9 1.7 3.6 -1.9 -.6 .3 .0 Ex. motor veh. and parts 76.3 1.9 3.8 -1.1 -.5 .2 .0 Ex. high-tech industries 71.5 1.0 2.4 -2.1 -.6 .1 -.1
Mining 8.6 .9 4.1 4.7 .0 1.0 .1Utilities 9.6 3.2 3.1 2.1 .0 .0 -.2
Selected industriesEnergy 20.5 2.7 4.8 2.7 -.1 .5 -.2
High technology 4.8 16.4 26.4 14.3 1.4 1.6 .8 Computers 1.2 22.6 14.0 7.0 .0 1.7 1.1 Communications equipment 1.1 14.0 8.2 12.8 -.2 4.5 -1.0 Semiconductors2 2.6 14.9 43.7 19.1 2.9 .2 1.5
Motor vehicles and parts 5.5 -2.0 1.2 -13.1 -1.6 1.2 -.5
Total ex. selected industries 69.1 .8 2.0 -2.1 -.6 .1 .0Consumer goods 20.9 .2 .8 -2.9 -.4 -.6 .3 Durables 4.0 -1.7 .5 -7.4 -1.2 -.1 -.5 Nondurables 16.9 .6 .9 -1.8 -.2 -.7 .5
Business equipment 7.8 2.4 7.3 1.5 -.7 .2 1.1Defense and space equipment 1.7 -.8 2.8 -1.3 -.2 .2 .1
Construction supplies 4.5 -.5 1.3 -5.5 -.7 -.3 -.9Business supplies 7.9 -.3 .1 -2.5 -1.0 -.1 -.2
Materials 26.1 1.5 2.1 -1.8 -.7 .7 -.5 Durables 14.5 2.9 4.6 -.4 -.3 .7 -.6 Nondurables 11.6 -.3 -1.0 -3.7 -1.2 .7 -.4
1. From fourth quarter of preceding year to fourth quarter of year shown. 2. Includes related electronic components. ... Not applicable.
Annual rate Monthly rate
Capacity Utilization (Percent of capacity)
1972- 1994- 2001- 20072006 95 02
Sector average high low Q2 Q3 Q4 Nov. Dec.
Total industry 81.0 85.1 73.6 81.7 82.0 81.5 81.6 81.4
Manufacturing 79.8 84.6 71.6 80.3 80.6 79.8 79.8 79.7 Ex. motor veh. and parts 79.9 84.3 71.4 80.5 80.8 80.0 80.1 79.9Mining 87.4 88.9 84.8 89.9 90.8 91.8 92.1 92.1Utilities 86.7 93.7 83.8 85.8 86.2 86.4 86.5 86.2
Stage-of-process groupsCrude 86.5 89.5 82.0 89.2 89.7 90.1 90.6 90.3Primary and semifinished 82.2 88.2 74.6 82.2 82.7 81.9 82.1 81.7Finished 77.8 80.5 70.0 78.6 78.8 78.1 78.0 78.3

II-7
having hard-to-fill positions. In contrast, job vacancies as measured in the JOLT survey remained at a relatively high level in November, although they have moved down in recent months toward the low end of the narrow range that has prevailed since late 2005.
Industrial Production Activity in the industrial sector has been stagnant, on balance, in recent months. After posting widespread declines in October, industrial production (IP) firmed a bit in November and held steady in December. For the fourth quarter as a whole, IP declined at an annual rate of about 1 percent, as a drag from motor vehicles and construction-related industries more than offset a positive contribution from other industries.3 Manufacturing output declined at an annual rate of nearly 2 percent in the fourth quarter, and the factory operating rate fell back to its long-run average. In addition, several forward-looking indicators of manufacturing activity have deteriorated recently and suggest that the overall trajectory for IP will remain quite soft in the early part of this year. Outside of manufacturing, utilities output climbed for a second consecutive quarter, and mining output was bolstered by increases in natural gas extraction and in crude oil.
The production of motor vehicles and parts fell at an annual rate of 13 percent in the fourth quarter, subtracting about ¾ percentage point from the rate of change in total IP. Assemblies of light vehicles declined to an annual rate of 10¼ million units, down more than 400,000 units from the rate in the third quarter. The recent cuts to production, coupled with the steady pace of light vehicle sales through the end of last year, helped bring inventories of all domestic manufacturers down to comfortable levels; days’ supply for domestic light vehicles stood at 64 days at the end of December. Nevertheless, with automakers projecting slower sales in 2008, their assembly plans call for production to edge down further in the first quarter, to a pace of 10.1 million units. Elsewhere in transportation, commercial aircraft production climbed at an annual rate of about 15 percent in the fourth quarter. The ramping up of production of Boeing’s new 787 Dreamliner should boost IP significantly in the first half of this year.4
3 The previous two quarterly declines in total IP—in 2006:Q4 and 2003:Q2—were larger than last quarter's decrease but were relatively small compared with those in the past economic downturns. In recessions, IP generally falls in conjunction with real GDP but by a much larger amount. 4 Boeing recently announced another delay of the initial delivery of the 787, citing start-up issues at its assembly plant and ongoing complications with several suppliers. The announcement follows a November decision to push back delivery from mid- to late-2008. In spite of these problems, the company still plans to complete roughly four 787s per month by the middle of the year. However, these aircraft cannot be delivered until Boeing has received final approval from the Federal Aviation Administration, which now seems unlikely until early 2009.

II-8
Production of Domestic Light Vehicles(Millions of units at an annual rate except as noted)
2007 2008 2007
Item Q2 Q3 Q4 Q1 Sept. Oct. Nov. Dec.
U.S. production1 10.8 10.7 10.3 10.1 10.2 10.1 10.4 10.3 Autos 3.9 3.9 4.0 3.9 3.7 3.9 4.0 4.1 Light trucks 6.9 6.7 6.3 6.2 6.5 6.2 6.4 6.2
Days’ supply2 67 69 64 n.a. 68 69 68 64 Autos 56 59 51 n.a. 58 60 53 50 Light trucks 76 75 75 n.a. 74 76 81 75
Inventories3 2.67 2.75 2.59 n.a. 2.75 2.75 2.74 2.59 Autos .96 .99 .90 n.a. .99 1.00 .98 .90 Light trucks 1.72 1.76 1.69 n.a. 1.76 1.75 1.77 1.69
Memo: U.S. production, total motor vehicles4 11.1 10.9 10.5 10.4 10.4 10.3 10.6 10.6
Note. FRB seasonals. Components may not sum to totals because of rounding. 1. Production rates for the first quarter reflect the latest industry schedules. 2. Quarterly values are calculated with end-of-period stocks and average reported sales. 3. End-of-period stocks. 4. Includes medium and heavy trucks. n.a. Not available.
2.2
2.4
2.6
2.8
3.0
3.2
3.4
3.6Millions of units
1998 1999 2000 2001 2002 2003 2004 2005 2006 2007
Dec.
Inventories of Light Vehicles
30
40
50
60
70
80
90Days
1998 1999 2000 2001 2002 2003 2004 2005 2006 2007
Dec.
Days’ Supply of Light Vehicles

II-9
Indicators of High-Tech Manufacturing Activity
2000 2001 2002 2003 2004 2005 2006 2007 50
100
150
200
250300350400450
2000 = 100, ratio scale
Computers
Communications equipment
Semiconductors
Dec.
Industrial Production in the High-Tech Sector
2000 2001 2002 2003 2004 2005 2006 2007-6
-4
-2
0
2
4
6
8
10
12
14
-6
-4
-2
0
2
4
6
8
10
12
14Percent
3-month moving average
MPUs
Non-MPU chips
Dec.
Note. MPU is a microprocessor unit.
Rate of Change in SemiconductorIndustrial Production
2001 2002 2003 2004 2005 2006 20070.4
0.5
0.6
0.7
0.8
0.9
1.0
9
10
11
12
13
14
15
16
1718
Q4
PCs (right scale)
Servers (left scale)
Millions of units, ratio scale Millions of units, ratio scale
Note. FRB seasonals. PCs include desktops, notebooks,ultraportables, and x86 "PC"servers. Q4 value for servers isGartner’s forecast.
Source. IDC and Gartner.
U.S. Personal Computer and Server Sales
2000 2001 2002 2003 2004 2005 2006 2007 2008 5
6
7
8
9
10
11
Note. FRB seasonals. Q1 Intel revenue is the range of thecompany’s guidance as of January 15, 2008. Q4 worldwideMPU shipments is a staff estimate. Source. Intel and Semiconductor Industry Association.
Worldwide MPU shipments
Intel revenue
Billions of dollars, ratio scale
Q1
Q4
MPU Shipments and Intel Revenue
2002 2003 2004 2005 2006 2007
Billions of dollars
80
100
120
140
160
180
Nov.Shipments
Orders
Note. U.S. and Canadian bare and loaded circuit boardshipments. Source. IPC.
Circuit Board Orders and Shipments
2003 2004 2005 2006 200755
60
65
70
75
80 Diffusion index
Q4
Note. Indexes are based on responses to survey questionsabout whether firms plan to increase or decrease their spendingon various categories of high-tech goods in the next 12 months. Source. NABE Industry Survey.
High-Tech Spending Plans

II-10
Indicators of Industrial Activity
2002 2003 2004 2005 2006 2007 20080.1
0.2
0.3
0.4
0.5
0.6 Millions of units
8
9
10
11
12
13Millions of units
+Jan.
Medium and heavy trucks(left scale)
Note. January values are based on latest industryschedules.
+
Autos and light trucks (right scale)
Motor Vehicle Assemblies
2000 2001 2002 2003 2004 2005 2006 200715
16
17
18
19
20
21
22
20
22
24
26
28
30
Imports/domestic absorbtion (right scale)
Exports/shipments (left scale)
Note. Trade shares are 3-month moving averages. Source. Staff flow-of-goods system.
Percent
Nov.
Percent
Trade shares
2002 2003 2004 2005 2006 2007 95
100
105
110
115
Construction supplies
Durable materials
Dec.
Note. Data exclude motor vehicle parts, high-tech, and aircraft parts industries.
2002 = 100, ratio scale
IP: Construction Supplies and Durable Materials
2002 2003 2004 2005 2006 200795
100
105
110
115
120
1252002 = 100
Business equipment anddefense and spaceequipment
Consumer goods
Dec.
Dec.
Note. Data exclude energy, motor vehicles and parts, and high-tech industries.
IP: Equipment and Consumer Goods
2002 2003 2004 2005 2006 2007-4
-3
-2
-1
0
1
2
3
4 Percent
10
20
30
40
50
60
70
80
90Diffusion index
ISM (right scale)
RADGO (left scale)
Note. The diffusion index equals the percentage of respondents reporting greater levels of new orders plus one-half the percentage of respondents reporting that new orders were unchanged. RADGO is a 3-month moving average.
Dec.Nov.
New Orders: ISM Survey and Change in RealAdjusted Durable Goods Orders (RADGO)
2002 2003 2004 2005 2006 2007 200830
35
40
45
50
55
60
65
70
75
Philadelphia
New York
Note. The diffusion index equals the percentage of respondents reporting greater levels of new orders plus one-half the percentage of respondents reporting that new orders were unchanged.
Jan.
Jan.
Diffusion index
New Orders: FRB New York Surveyand FRB Philadelphia Survey

II-11
Production in high-tech industries increased at an annual rate of 14.3 percent in the fourth quarter, a step-down from the third-quarter rate and somewhat below the average pace since 2003. Although output of communications equipment picked up to a solid rate, production increases for both computers and semiconductors moderated in the fourth quarter. The deceleration in semiconductor output has been broadly based. For computers, preliminary data from the International Data Corporation indicate that PC sales only edged up in the fourth quarter.
Available indicators suggest moderate gains for high-tech output during the next few months. Intel’s guidance for the current quarter points to little change in nominal revenue from the fourth quarter and is consistent with a moderate rise in real MPU production. Domestic orders of printed circuit boards declined in November from a relatively high level, but the book-to-bill ratio remained slightly above one, indicating that shipments and orders are roughly balanced. In addition, according to the latest NABE Industry Survey, high-tech spending plans for the next twelve months picked up in the fourth quarter. The improvement in the diffusion index was widespread across industry groups; spending plans in the finance, insurance, and real estate sector recovered some after dropping noticeably in the third quarter.
Outside of energy, motor vehicles and parts, and high-technology, production declined at an annual rate of 2.1 percent in the fourth quarter. Among the major market groups, the index for construction supplies moved down in December for the sixth consecutive month. Materials output decreased at an annual rate of about 2 percent in the fourth quarter, with production likely curbed by weak demand from the construction and motor vehicles sectors. Elsewhere, the output of consumer goods increased in December but was down at an annual rate of nearly 3 percent for the quarter as a whole. In contrast, the index for business equipment climbed further, due in large part to the ongoing strength of commercial aircraft production and to apparent strength in export demand.
The indicators of near-term manufacturing activity have deteriorated, on balance, since the December Greenbook and point to small declines in production in coming months. The ISM’s diffusion index of new orders dropped nearly 7 index points, to 45.7, in December—its lowest level since the fourth quarter of 2001, when IP declined at an annual rate of about 5 percent. In addition, the three-month moving average of the staff’s series on real adjusted durable goods orders moved further into negative territory in November. And although the new orders indexes from the regional manufacturing surveys were, on balance, above 50 in December, the early readings for January from the Empire State, Philadelphia Business Outlook, and Richmond Federal Reserve surveys all

II-12
Sales of Light Vehicles(Millions of units at an annual rate; FRB seasonals)
2007
Category 2007 Q2 Q3 Q4 Oct. Nov. Dec.
Total 16.1 16.0 15.9 16.1 16.0 16.2 16.2
Autos 7.6 7.7 7.4 7.8 7.5 8.0 7.9 Light trucks 8.5 8.3 8.5 8.3 8.5 8.1 8.3
North American1 12.4 12.3 12.3 12.4 12.2 12.4 12.5 Autos 5.3 5.3 5.1 5.5 5.2 5.7 5.6 Light trucks 7.1 7.0 7.2 6.9 7.0 6.7 6.9
Foreign-produced 3.8 3.8 3.6 3.8 3.8 3.8 3.8 Autos 2.4 2.4 2.3 2.3 2.3 2.4 2.3 Light trucks 1.4 1.4 1.3 1.4 1.5 1.4 1.4
Memo:Detroit Three domestic market share (percent)2 51.2 51.8 50.4 50.4 50.8 50.4 49.9
Note. Components may not sum to totals because of rounding. 1. Excludes some vehicles produced in Canada that are classified as imports by the industry. 2. Domestic market share excludes sales of foreign brands affiliated with the Detroit Three.
3.0
3.5
4.0
4.5
5.0
5.5
6.0
6.5
Ten-day U.S. Light Vehicle Salesfor Toyota, Honda, Nissan, and Mazda
Million of units
Annual rate
2002 2003 2004 2005 2006 2007 2008
Jan. 20
Source. Nissan North America.
-8
0
8
16
24
32
40
48
56
64
72
80 Percent
40
60
80
100
120
140
160
180
200Index
2002 2003 2004 2005 2006 2007 2008
Jan.
Jan.
Bad time to buy:Gas prices and shortages
(left scale)
Appraisal of car-buying conditions (right scale)
Car-Buying Attitudes
Source. Reuters/University of Michigan Survey.

II-13
stood at or below 50. Finally, the weekly physical product data available for the first part of January have been about unchanged from their levels in December.
Motor Vehicles Sales of light vehicles averaged a moderate pace of 16.1 million units (annual rate) in the fourth quarter.
. Looking ahead, however, indicators of vehicle demand suggest a softer pace of sales in the near term. Through the first twenty days of January, the pace of sales at Toyota, Honda, Nissan, and Mazda was nearly unchanged from December’s rate, but the major domestic firms are forecasting weaker sales. More broadly, the gains in employment and real income have been weak recently, and the Reuters/Michigan index of car-buying attitudes remained near its historical low in early January.
Consumer Spending The rise in real consumer spending appears to have moderated in the fourth quarter. For the retail control category of goods, which excludes sales of auto dealers and building material and supply stores, monthly changes in nominal spending have been volatile, in part due to swings in sales at gasoline stations. Factoring in our estimate of PCE prices, real spending in the retail control category rose weakly, on net, over the last three months of the year, consistent with the low readings of consumer sentiment and industry reports of mediocre holiday sales. After no change, on balance, in September and October, real outlays on services rose solidly in November (the most recent month available), led by rebounds in energy services and commissions paid to stock brokers. However, warmer-than-usual temperatures in December likely damped expenditures for energy services.
The fundamental determinants of consumer spending have deteriorated recently. Real disposable income posted a second monthly decline in November, due mostly to higher consumer energy prices; with households adjusting only slowly to their reduced purchasing power, the personal saving rate fell to -0.5 percent in November. Also, the wealth-to-income ratio ticked down in the third quarter as house prices fell a touch, and available indicators point to continued declines in house prices in the fourth quarter. Furthermore, equity prices are down 14 percent since the end of the third quarter and 11 percent since the end of last year.
The few available spending indicators for January have been soft; recent readings of weekly chain store sales point to just small gains, and anecdotal reports generally characterize spending as remaining weak this month. Consumer sentiment, as measured

II-14
Retail and Food Services Sales(Percent change from preceding period; seasonally adjusted current dollars)
2007Category Q2 Q3 Q4 Oct. Nov. Dec.
Annual rate Monthly rate
Total sales 5.4 3.7 4.8 .0 1.0 -.4 Retail control1 8.0 4.0 6.9 .3 1.6 -.1 Ex. sales at gasoline stations 5.4 5.0 3.0 .0 .7 .1Memo: Real PCE control2 .3 4.1 2.3 .0 .5 -.3
1. Total sales less outlays at building material and supply stores and automobile and other motorvehicle dealers. 2. Total goods spending excluding autos and trucks. The values for October and November are staffestimates. The values for December and Q4 are staff forecasts.
2004 2005 2006 2007-2.0
-1.5
-1.0
-0.5
0.0
0.5
1.0
1.5
2.0
-2.0
-1.5
-1.0
-0.5
0.0
0.5
1.0
1.5
2.0Percent
Note. The values for October and November are staff estimates. The value for December is a staff forecast.
1-month
6-month
Dec.
Change in Real PCE Goods
2004 2005 2006 2007-1.0
-0.8
-0.6
-0.4
-0.2
-0.0
0.2
0.4
0.6
0.8
1.0
-1.0
-0.8
-0.6
-0.4
-0.2
-0.0
0.2
0.4
0.6
0.8
1.0Percent
1-month
6-month
Nov.
Change in Real PCE Services
1996 1997 1998 1999 2000 2001 2002 2003 2004 2005 2006 2007-6
-4
-2
0
2
4
6
-6
-4
-2
0
2
4
6Percent
Nov.
Personal Saving Rate

II-15
Fundamentals of Household Spending
2006
Changes in Nominal Wages and Salaries, Nominal DPI, and Real DPI
Nominal wage and salary disbursements (white) Nominal DPI (black) Real DPI (striped)
2007:H1 2007:Q3-4
0
4
8
12
16 Percent, annual rate
August September October November
1998 2000 2002 2004 2006 20080
1
2
3
4
5
6
7
0
1
2
3
4
5
6
74-quarter percent change
Q3
Note. Values for 2004:Q4 and 2005:Q4 exclude the effecton income of the one-time Microsoft dividend in December 2004.
1999 2001 2003 2005 2007
Change in Real DPI
1998 2000 2002 2004 2006 20084200
6200
8200
10200
12200
14200
16200 Index
4.5
5.0
5.5
6.0
6.5
7.0Ratio
Q3
Wilshire 5000(left scale)
Ratio of householdnet worth to DPI*
(right scale)
*The value for 2004:Q4 excludes the effect on income ofthe one-time Microsoft dividend in December 2004.
Jan.22
Household Net Worth and Wilshire 5000
1998 2000 2002 2004 2006 20080
1
2
3
4
5
6
7Percent
Jan. 22Federalfundsrate
Treasuryyield
Federal Funds Rate and 10-Year Treasury Yield
1998 2000 2002 2004 2006 200840
60
80
100
120
140
160
1801985 = 100
60
70
80
90
100
110
120
130
1401966 = 100
Jan.p
p Preliminary.
Dec.
Conference Board(left scale)
Reuters/Michigan
(right scale)
Consumer Confidence

II-16
Private Housing Activity(Millions of units, seasonally adjusted; annual rate except as noted)
2007
Sector 2007 Q2 Q3 Q4 Oct. Nov. Dec.
All units Starts 1.35 1.46 1.30 1.15 1.27 1.17 1.01 Permits 1.38 1.46 1.32 1.13 1.17 1.16 1.07
Single-family units Starts 1.05 1.17 .99 .83 .88 .82 .79 Permits .97 1.05 .94 .76 .81 .77 .69 Adjusted permits1 .99 1.07 .97 .78 .83 .78 .73 Permit backlog2 .106 .116 .113 .106 .112 .112 .106
New homes Sales n.a. .86 .73 n.a. .71 .65 n.a. Months’ supply3 n.a. 7.65 8.76 n.a. 8.68 9.37 n.a.
Existing homes Sales n.a. 5.15 4.72 n.a. 4.37 4.40 n.a. Months’ supply3 n.a. 8.32 9.26 n.a. 10.12 9.90 n.a.
Multifamily units Starts .308 .298 .310 .321 .395 .355 .212 Permits .403 .411 .384 .376 .361 .392 .376 Permit backlog2 .073 .081 .075 .073 .074 .072 .073
Mobile homes Shipments n.a. .099 .096 n.a. .094 .093 n.a.
Condos and co-ops Existing home sales n.a. .767 .700 n.a. .610 .600 n.a.
1. Adjusted permits equal permit issuance plus total starts outside of permit-issuing areas. 2. Number outstanding at end of period. Excludes permits that have expired or have been canceled,
abandoned, or revoked. Not at an annual rate. 3. At current sales rate; expressed as the ratio of seasonally adjusted inventories to seasonally adjusted
sales. Quarterly and annual figures are averages of monthly figures. n.a. Not available.
1999 2000 2001 2002 2003 2004 2005 2006 2007.0
.1
.2
.3
.4
.5
.6
.7
.8
.9
1.0 Millions of units
.0
.2
.4
.6
.8
1.0
1.2
1.4
1.6
1.8
2.0Millions of units
Private Housing Starts and Permits(Seasonally adjusted annual rate)
Single-family starts (right scale)
Single-family adjusted permits (right scale)
Dec.
Note. Adjusted permits equal permit issuance plus total starts outside of permit-issuing areas.
Multifamily starts (left scale)Dec.

II-17
by the Reuters/University of Michigan and the Conference Board surveys, held at low levels in December. The preliminary reading of the Reuters/Michigan index rose in early January but remains well below its level in midsummer. The decline in sentiment since July remains larger than we would have predicted given changes in inflation, stock prices, and employment conditions.
Housing The contraction in residential construction steepened in the second half of last year. Single-family housing starts moved down 3 percent in December to an annual rate of 794,000 units, bringing the cumulative decline in the second half of last year to 31 percent and the decline since its peak in the first quarter of 2006 to 53 percent. Adjusted single-family permit issuance—generally a useful indicator of current and future construction activity—also declined noticeably in December. Meanwhile, multifamily starts plunged in December, but this series is volatile, and permit issuance points to a rebound in multifamily starts in the near term.
The demand for new homes also seems to have weakened further in the last few months. The Census Bureau’s estimate of new home sales dropped 9 percent in November after having held relatively steady since August.
.5 In contrast, recent readings on the demand for existing homes have not been as bleak. In particular, sales of existing single-family homes edged up 0.7 percent in November after holding steady in October. In addition, the index of pending sales agreements—which tends to lead sales of existing single-family homes by one to two months—points to a December pace of sales that would leave existing home sales roughly flat in the fourth quarter.
Tight financing conditions for nonprime and jumbo mortgages continued to restrain housing demand through the end of last year. Available data suggest that issuance of securities backed by nonprime mortgages (which include the subprime and alt-A categories) slowed more than home sales in the fourth quarter, suggesting that the
5
.

II-18
Indicators of Single-Family Housing
Existing Single-Family Home Sales Millions of units
7_0
(annual rate) Index 140
Pending home sales index (right scale) 6.5 -- Existing home sales (left scale)
130
6.0
5.5
5.0
4.5
4.0
3.5
Source. National Association of Realtors.
New Home Sales Months' Supply
120
110
100
90
Months 10
Nov. 9
8
7
6
5
4
3
2
Note. . Months' s'§P~rc~. calculated using the 3-month moving average of sales.
for months' supply, Census Bureau.
Prices of Existing Homes
Percent change from year earlier 35
Repeat transactions, purchase-only index Average price of homes sold Case-Shiller price index
30
25
20
15
10
5
0
-5
-10
~~~~~~~~~~~~~~~~~~-15
Note. The Case-S hiller price index is the 1 0-city index. Source. For repeat transactions, OFHEO; for average
price, National Association of Realtors; for Case-Shiller, Chicago Mercantile Exchange.
New Single-Family Home Sales Millions of units
1_5
(annual rate) Millions of units
(annual rate) 0.45
1.3
1.1
0.9
0.7
Source. For NAHB new home sales, NAHB's survey of large homebuilders; for new home sales agreements, Census Bureau.
Mortgage Rates
0.40
0.35
0.30
0.25
0.20
Percent 9
30-year jumbo FRM 30-year conforming FRM 1-year conforming ARM
Note. The Jan. readings are for data through Jan. 16, 2008. Source. Conforming rates are from Freddie Mac. The
jumbo rate is the sum of the 30-year conforming FRM rate and the jumbo conforming spread from bankrate.com.
Prices of New Homes
8
7
6
5
4
Percent change from year earlier 25
Constant quality index Average price of homes sold 20
Note. Average price values have been adjusted by Board staff to take into account new sampling procedures adopted in 2005.
Source. Census Bureau.
15
10
5
0
-5

II-19
fraction of home sales financed with these types of mortgages has continued to trend down. At the same time, data from the Federal Housing Finance Board’s Monthly Interest Rate Survey suggest that the share of jumbo loans in prime mortgage originations was about 5½ percent from September to November, about two-thirds of its average share since early 2006. Spreads between rates for jumbo and conforming thirty-year fixed-rate mortgages also widened to 90 basis points in December—about 65 basis points wider than the average spread between 2001 and mid-2007. Although increased fees imposed by Fannie Mae and Freddie Mac may have tightened financing for borrowers at the margins of the prime category in the fourth quarter, interest rates faced by other prime borrowers moved down over the fourth quarter and fell further through the middle of January.
Because sales of new homes fell 19 percent over the six months ending in November, builders have made little progress at paring down their bloated inventories. Despite a small decline in the inventory of new homes for sale in November, the months’ supply of unsold new homes remained more than twice as high as the upper end of the fairly tight range that it had occupied between 1997 and the summer of 2005.
Home prices continued to decelerate in the second half of last year. The purchase-only version of the repeat-sales price index calculated by the Office of Federal Housing Enterprise Oversight (OFHEO) decreased at an annual rate of 1 percent in the third quarter, the first nominal decline since 1993; over the four quarters ending in the third quarter, this index increased 1.8 percent. The ten-city version of the Case-Shiller repeat-sales price index—which is more heavily concentrated in urban areas that had seen greater appreciation in earlier years—posted a decline of 6¾ percent over the twelve months ending in October. The average price of existing homes sold—which is available on a more-timely basis than the other measures but reflects shifts in the mix of homes sold—was 3.7 percent below its year-earlier reading in November. In the market for new homes, prices were about unchanged from a year earlier but have fallen on balance since spring, and in November the average price of homes sold declined 2.8 percent. Recent declines in new home prices are consistent with mounting anecdotal evidence that many large homebuilders are resorting to price discounts, in addition to nonprice incentives, to bolster sales and unload inventory.
Equipment and Software Spending on real equipment and software appears to have advanced at a sluggish rate in the fourth quarter after a solid increase in the third quarter. Although outlays in the

II-20
2000 2002 2004 2006 200870
90
110
130
150
170
190
220
7
9
11
13
15
17
19
222000 = 100 Billions of chained (2000) dollars
1999 2001 2003 2005 2007
Nov.Dec.
Note. Ratio scales. Shipments are deflated by the staffprice index for computers and peripheral equipment, which
is derived from the BEA’s quality-adjusted price indexes.
Industrial production (left scale)Real M3 shipments (right scale)
Computers and Peripherals
2000 2002 2004 2006 20082
5
8
11
14
1720
2
5
8
11
14
1720
Billions of chained (2000) dollars, ratio scale
1999 2001 2003 2005 2007
Nov.
Note. Shipments and orders are deflated by a price index that is derived from the BEA’s quality-adjusted price indexesand uses the PPI for communications equipment for monthly interpolation.
ShipmentsOrders
Communications Equipment
2000 2002 2004 2006 2008200
340
480
620
760
9001040
1240
200
340
480
620
760
9001040
1240Thousands of units, ratio scale
1999 2001 2003 2005 2007
Dec.
Note. Annual rate, FRB seasonals. Source. For sales, Ward’s Communications; for orders, ACT Research.
Sales of class 4-8 trucksNet new orders of class 5-8 trucks
Medium and Heavy Trucks
2000 2002 2004 2006 200832
37
42
47
52
58
32
37
42
47
52
58Billions of chained (2000) dollars, ratio scale
1999 2001 2003 2005 2007
Nov.
Note. Shipments and orders are deflated by the staff price indexes for the individual equipment types included in this category. Indexes are derived from the BEA’squality-adjusted price indexes.
ShipmentsOrders
Non-High-Tech, Nontransportation Equipment
Orders and Shipments of Nondefense Capital Goods(Percent change; seasonally adjusted current dollars)
2007
Category Q2 Q3 Sept. Oct. Nov.
Annual rate Monthly rate
Shipments 9.7 9.4 .9 -.6 -.3 Excluding aircraft 9.6 6.1 1.8 -1.2 .2 Computers and peripherals 11.9 -15.2 10.4 -3.8 1.2 Communications equipment 12.6 13.1 -1.0 -8.0 1.5 All other categories 9.0 8.0 1.2 -.2 .0
Orders 34.2 -1.5 4.9 -2.6 4.2 Excluding aircraft 13.0 3.4 1.4 -3.0 -.1 Computers and peripherals 7.5 .7 7.6 -14.9 13.9 Communications equipment 64.2 17.3 8.7 -21.0 -2.8 All other categories 9.6 2.4 -.1 .4 -1.2
Memo: Shipments of complete aircraft1 40.1 44.9 42.0 49.1 47.4
1. From Census Bureau, Current Industrial Reports; billions of dollars, annual rate.

II-21
volatile transportation equipment category moved up briskly, spending on other types of equipment appears to have slowed appreciably.
Business demand for motor vehicles appeared to firm in the fourth quarter. Sales to daily rental fleets moved up noticeably, but the increase was likely transitory. Sales of medium and heavy trucks (classes 4 through 8) edged up in the fourth quarter after falling to a four-year low in the third quarter. The recent strength in truck orders suggests that sales will continue to recover in the next few months from the payback that ensued after the January 2007 change in diesel engine regulations. With respect to aircraft, data on shipments and net exports through November suggest that domestic spending on aircraft may have recouped part of its third-quarter decline. However, high fuel prices could be acting as a drag on spending; Federal Express recently cited fuel prices when it postponed taking possession of new aircraft.
Real outlays on high-tech equipment and software appear to have increased at a subpar pace over the second half of last year. Data from the Quarterly Services Survey show a tepid increase in spending on software in the third quarter, which matched a tepid rise in real spending on computers and peripheral equipment. The subdued growth of computer spending likely continued into the fourth quarter: Shipments of computers and peripheral equipment declined, on balance, in October and November, and IP for computers decelerated further in the fourth quarter. Orders and shipments of communications equipment did not rebound significantly in November from their large declines in October, but imports increased briskly in those two months, an indication that real spending in this category may post a modest gain in the fourth quarter.
Business spending on equipment outside of high-tech and transportation appears to have fallen in the fourth quarter after posting sizable gains over the summer. Shipments in October and November were fairly flat while orders declined, and imports in the first two months of the quarter were below their average in the third quarter.
Available indicators of business conditions and sentiment have deteriorated. The manufacturing diffusion index from the monthly ISM survey declined further in December, and the Philadelphia Fed’s survey of business sentiment plunged in January. The ISM semiannual report (released in December) suggests that this deterioration of business sentiment is being reflected in capital spending plans. Compared with the same report one year ago, about 10 percent of survey respondents shifted from predicting increases in capital expenditures to predicting declines. However, other diffusion indexes of capital spending plans paint a less uniformly negative picture; as noted, the index from

II-22
Fundamentals of Equipment and Software Investment
1990 1991 1992 1993 1994 1995 1996 1997 1998 1999 2000 2001 2002 2003 2004 2005 2006 2007-4
-2
0
2
4
6
8
-4
-2
0
2
4
6
84-quarter percent change
Q3
Source. Bureau of Economic Analysis.
Real Business Output
1990 1995 2000 2005-15
-12
-9
-6
-3
0
3
6
9
12
15
-15
-12
-9
-6
-3
0
3
6
9
12
154-quarter percent change
1991 1995 1999 2003 2007
Q3
High-tech
Non-high-tech
Source. Staff calculation.
User Cost of Capital
2000 2001 2002 2003 2004 2005 2006 2007 20084.5
5.5
6.5
7.5
8.5
9.5
10.5
11.5
12.5
13.5
4.5
5.5
6.5
7.5
8.5
9.5
10.5
11.5
12.5
13.5Percent
2000 2001 2002 2003 2004 2005 2006 2007 2008
10-year BBB
10-year high-yield
Jan. 18
Note. Daily averages based on Merrill Lynch bond data.
Corporate Bond Yields
1990 1995 2000 2005300
500
700
900
1100
1300
1500
1700 Billions of chained (2000) dollars
0.7
0.8
0.9
1.0
1.1
1.2
1.3
1.4
1.5
Ratio
1991 1995 1999 2003 2007
Q3
Q3
Real cash flow (left scale)
Ratio of cash flowto fixed investment
(right scale)
Note. Cash flow and fixed investment for the corporate business sector.Source. Bureau of Economic Analysis; FRB flow of funds accounts.
Corporate Cash Flow
2000 2001 2002 2003 2004 2005 2006 2007 200830
40
50
60
70
20
30
40
50
60
70
80Diffusion index
2000 2001 2002 2003 2004 2005 2006 2007 2008
Dec.
Jan.
Source. Manufacturing ISM Report on Business;Philadelphia Fed Business Outlook Survey.
ISMPhiladelphia Fed
Surveys of Business Conditions

II-23
the National Association of Business Economists' industry survey rebounded in the fourth quarter from a third-quarter decline, with capital spending plans improving for both high-tech equipment and overall equipment.
In addition, the cost and availability of financing for business spending on equipment and software has become less favorable, on balance. Although interest rates on investment-grade corporate bonds have changed little, on net, since the time of the December Greenbook, rates on high-yield bonds have risen considerably. At banks, the latest Senior Loan Officer Opinion Survey reported widespread tightening of standards and terms on loans to business borrowers.
Nonresidential Construction Available data through November suggest that nonresidential building activity remained vigorous in the fourth quarter. Although increases in investment were widespread across major categories in the second half of 2007, gains were especially large in the office, power and communication, and “other” sectors.6 However, several indicators suggest that some deceleration of spending may be in the offing. The three-month moving average of the architectural billings diffusion index—which is reasonably well correlated with construction spending six months hence—moved down in the second half of 2007, and vacancy rates in the retail sector increased.7 In addition, there are some indications that financial turmoil may be affecting activity in this sector. Although commercial-mortgage-backed securities (CMBS) are not an important source of new-construction financing, the sharp contraction in CMBS issuance may signal a more general deterioration in financing conditions. Along these lines, nonresidential construction contractors have indicated that funding has become more difficult to obtain in some cases, especially for more speculative projects.8 In addition, signs of decelerating commercial property values may reduce the pace of new construction.
The Bureau of Economic Analysis (BEA) reported that real expenditures on drilling and mining structures jumped at an annual rate of 26 percent in the third quarter after an even larger increase in the second quarter. The magnitude of these reported increases is
6 The “other” sector includes religious, educational, lodging, amusement and recreation, transportation, and health-care facilities. 7 Despite a decline in transactions in the office sector since September, the available evidence does not suggest overbuilding in the office market. Completion of new office space in the third quarter was 30 percent less than its level of the mid-1980s, a period of substantial overbuilding. Moreover, the vacancy rate in this sector remains well below its cyclical peaks of 1991 and 2003. 8 These responses were reported in a survey conducted by Associated General Contractors of America.

II-24
Nonresidential Construction and Indicators(All spending series are seasonally adjusted at an annual rate; nominal CPIP deflated by
BEA prices through Q3 and by staff projection thereafter)
2000 2002 2004 2006 2008170
190
210
230
250
270
290
170
190
210
230
250
270
290Billions of chained (2000) dollars
1999 2001 2003 2005 2007
Nov.
Total Structures
2000 2002 2004 2006 200820
30
40
50
60
70
80
90
20
30
40
50
60
70
80
90Billions of chained (2000) dollars
1999 2001 2003 2005 2007
Office
Nov.
Commercial
Nov.
Other
Nov.
Note. Other includes religious, educational, lodging, amuse-ment and recreation, transportation, and health-care facilities.
Office, Commercial, and Other
2000 2002 2004 2006 200810
20
30
40
50
60
70
10
20
30
40
50
60
70Billions of chained (2000) dollars
1999 2001 2003 2005 2007
Manufacturing
Nov.
Manufacturing
Power & communication
and Power & Communication
2000 2002 2004 2006 2008-1.5
-1.0
-0.5
0.0
0.5
1.0
1.5
2.0
2.5
3.0 Percent
35
40
45
50
55
60Diffusion index
Dec.
1999 2001 2003 2005 2007
Architectural Billings andNonresidential Construction Employment
Dec.
Billings (right scale)
Change inemployment (left scale)
Note. Both series are 3-month moving averages. Employmentincludes industrial, commercial, and specialty trade construction. Source. For billings, American Institute of Architects;for employment, Bureau of Labor Statistics.
2000 2002 2004 2006 20080
3
6
9
12
15
18
0
3
6
9
12
15
18Percent
1999 2001 2003 2005 2007
Office
Q4(p)
Retail
Industrial
Note. Industrial space includes both manufacturingstructures and warehouses. p Preliminary. Source. Torto Wheaton Research.
Vacancy Rates
2000 2002 2004 2006 20080
200
400
600
800
1000
1200
1400
1600
0
200
400
600
800
1000
1200
1400
1600Number
2000 2002 2004 2006 2008
Natural gas
Petroleum
Jan.
Jan.
Note. The January readings are based on datathrough January 18, 2008. Source. DOE/Baker Hughes.
Drilling Rigs in Operation

II-25
2000 2002 2004 2006 20081.1
1.2
1.3
1.4
1.5
1.6
1.7
1.8
1.9
1.1
1.2
1.3
1.4
1.5
1.6
1.7
1.8
1.9 Months
1999 2001 2003 2005 2007
Nov.
Dec.
Census book-value data
Staff flow-of-goods system
Note. Flow-of-goods system covers total industry ex.motor vehicles and parts, and inventories are relativeto consumption. Census data cover manufacturing and trade ex. motor vehicles and parts, and inventories arerelative to sales.
Inventory Ratios ex. Motor Vehicles
2000 2002 2004 2006 200835
40
45
50
55
60
35
40
45
50
55
60 Index
1999 2001 2003 2005 2007
Dec.
Note. A number above 50 indicates inventories are "too high."
ISM Customer Inventories:Manufacturing
Nonfarm Inventory Investment (Billions of dollars; seasonally adjusted annual rate)
2007
Measure and sector Q1 Q2 Q3 Sept. Oct. Nov.
Real inventory investment(chained 2000 dollars)Total nonfarm business -5.8 1.3 26.0 n.a. n.a. n.a. Motor vehicles -14.7 -9.6 13.3 n.a. n.a. n.a. Nonfarm ex. motor vehicles 8.9 10.9 12.7 n.a. n.a. n.a.
Manufacturing and trade ex. wholesale and retail motor vehicles and parts 1.1 10.8 18.1 54.2 .9 n.a. Manufacturing -5.0 -4.2 3.1 25.2 -6.0 n.a. Wholesale trade ex. motor vehicles & parts e 4.3 6.5 13.9 23.3 -13.0 n.a. Retail trade ex. motor vehicles & parts 1.8 8.5 1.1 5.7 19.9 n.a.
Book-value inventory investment(current dollars) Manufacturing and trade ex. wholesale and retail motor vehicles and parts 33.9 60.7 38.3 73.3 40.4 47.8 Manufacturing 4.8 21.6 12.6 36.4 10.0 47.1 Wholesale trade ex. motor vehicles & parts 22.0 20.6 21.4 28.4 4.8 18.0 Retail trade ex. motor vehicles & parts 7.2 18.4 4.3 8.5 25.6 -17.3
n.a. Not available.e Staff estimate of real inventory investment based on revised book-value data.Source. For real inventory investment, BEA; for book-value data, Census Bureau.

II-26
CBO Budget Projections and Economic Assumptions
2008 2009 2010 2011 2012 2013 2014 2015 2016 2017 2018
Budget projections1 Billions of dollars(fiscal years)
Baseline deficit 219 198 241 117 -87 -61 -96 -117 -95 -151 -223
Adjustments2
War on terrorism 30 58 59 51 29 13 -4 -17 -21 -24 -25 Expiring tax provisions 12 92 104 267 395 443 475 508 544 583 626 Net interest 0 5 11 25 45 70 94 123 154 189 225
Adjusted deficit 261 353 415 460 382 465 469 497 582 597 603
Memo: Percent of GDP
Adjusted deficit 1.8 2.4 2.7 2.8 2.2 2.6 2.5 2.5 2.8 2.8 2.7
Economic assumptions(calendar years) Percent change, year over year
Nominal GDP 3.6 4.7 5.4 5.3 4.8 4.5 4.5 4.4 4.3 4.3 4.3Real GDP 1.7 2.8 3.5 3.4 2.9 2.6 2.6 2.5 2.4 2.4 2.4PCE prices 2.6 1.8 1.9 1.9 1.9 1.9 1.9 1.9 1.9 1.9 1.9Core PCE prices 1.9 1.9 1.8 1.9 1.9 1.9 1.9 1.9 1.9 1.9 1.9CPI-U 2.9 2.3 2.2 2.2 2.2 2.2 2.2 2.2 2.2 2.2 2.2Core CPI-U 2.2 2.2 2.2 2.2 2.2 2.2 2.2 2.2 2.2 2.2 2.2
Percent, annual average
Unemployment rate 5.1 5.4 5.1 4.8 4.8 4.8 4.8 4.8 4.8 4.8 4.8
Treasury yields Three-month 3.2 4.2 4.6 4.7 4.7 4.7 4.7 4.7 4.7 4.7 4.7 Ten-year 4.2 4.9 5.2 5.2 5.2 5.2 5.2 5.2 5.2 5.2 5.2
1. The baseline assumes that budget authority for discretionary programs grows with inflation after fiscal 2008 andthat no new mandatory spending or tax legislation is enacted. 2. Adjustments measure the effect of alternative policies on the deficit and move the baseline closer to policies ineffect in 2007. Real defense spending on the war in Iraq and Afghanistan is assumed to remain at 2007 levels over the nextseveral years and then to drift down. All expiring tax provisions are assumed to be extended, including relief from theAlternative Minimum Tax, which is assumed to be indexed for inflation after 2007. Higher net interest costs reflect largerdeficits in the adjusted baseline. Source. Congressional Budget Office (2008), The Budget and Economic Outlook: Fiscal Years 2008 to 2018 (January).

II-27
somewhat surprising given other indicators of activity in this sector, and the latest available information suggests a much more modest increase in the fourth quarter.9
Business Inventories Our translation of book-value inventory data through November suggests that the pace of stockbuilding in the business sector (excluding motor vehicles) was little changed from its average rate over the first three quarters of 2007. The ratio of manufacturing and trade book-value inventories (excluding motor vehicles) to sales ticked down in November. Information from the staff’s flow-of-goods system suggests that months’ supply of inventories excluding motor vehicles ticked down in November, although this measure edged up in December. The flow-of-goods estimates provide little indication of serious inventory imbalances in most of the manufacturing sector. However, stock-sales ratios do appear to be elevated in industries such as primary metals and, to a lesser extent, wood products, fabricated metal products, and plastic and rubber products, likely because of the ongoing weakness in construction and motor vehicle production.
Federal Government Sector The federal unified budget situation has deteriorated somewhat in recent months. Year-over-year increases in receipts have continued to slow, whereas the rise in outlays has picked up a bit. The Congressional Budget Office (CBO) expects the deficit to widen noticeably this year; its latest Budget and Economic Outlook, which was released on January 23, projects the deficit to widen from 1¼ percent of GDP in fiscal year 2007 to 1¾ percent of GDP in fiscal 2008 and nearly 2½ percent of GDP in 2009, assuming current budget policies are extended.10
Receipts rose 5¾ percent in the fourth quarter of 2007 relative to the same period a year earlier. Individual income and payroll taxes posted a 7 percent increase, similar to the third-quarter rise. But corporate income taxes decreased 6 percent in the fourth quarter relative to a year earlier, thereby continuing a decline that began during the summer.
9 The BEA’s estimates reflect proprietary information that is not available to the staff. In contrast, the number of drilling rigs in operation and measures of footage drilled from the Department of Energy (not shown) moved up little, on balance, during the second and third quarters and increased slightly in the fourth quarter. 10 The CBO’s Budget and Economic Outlook projects federal unified budget deficits for both fiscal 2008 and 2009 assuming the Alternative Minimum Tax and other expiring tax provisions are extended and current real levels of spending for military activities in Iraq and Afghanistan are maintained. The CBO projection does not include a stimulus package. The CBO’s budget projections are based on economic assumptions that show real GDP growth slowing to 1½ percent over the four quarters of this year and the unemployment rate rising to 5¼ percent in the fourth quarter of 2008.

II-28

II-29
Outlays, adjusted for payment-timing shifts and financial transactions, rose 6 percent in the fourth quarter relative to a year earlier. Interest outlays rose nearly 20 percent, as high readings on overall CPI inflation boosted the nominal interest costs of Treasury inflation-protected securities (TIPS). Defense outlays rose 8 percent in the fourth quarter relative to a year earlier; they were at a level consistent with a solid gain in NIPA real defense purchases last quarter relative to the third quarter.
In December, the Congress passed a one-year extension of the Alternative Minimum Tax (AMT) and completed action on the regular appropriations bills.11 An economic stimulus package around 1 percentage point of nominal GDP has been widely discussed, although the Administration and congressional leadership have yet to settle on a plan.
State and Local Government Sector Real state and local government expenditures appear to have risen sharply in the fourth quarter. State and local hiring was quite vigorous; employment increased an average of about 35,000 jobs per month in the fourth quarter, well above the solid monthly pace of approximately 20,000 in the first three quarters of 2007. Real construction expenditures increased at a brisk annual rate of about 11 percent, on average, in October and November.
Most states’ budgets remain relatively healthy, but fiscal conditions are tightening because revenue gains are slowing. The Census Bureau’s Quarterly Summary of State and Local Government Tax Revenue indicates that the year-over-year change in state tax revenues slowed to 4½ percent in the third quarter of 2007, down from the 7¾ percent gain over the preceding year. The National Conference of State Legislatures (NCSL) reports that aggregate state revenues have been coming in about as projected in fiscal 2008 budgets but that receipts in individual states have been mixed.12 Some midwestern and western states have experienced larger-than-anticipated gains in revenues, whereas several large coastal states—including California, Florida, and New York—have experienced slower-than-expected increases in receipts. Half of states reported that their revenues have been adversely affected by the housing market slump; the categories most
11 The Internal Revenue Service announced that the processing of a small number of the early income-tax returns may be delayed by a few weeks because of the last-minute reprogramming of its computers as a result of the late enactment of the AMT bill. This delay should have only a minor effect on the timing of individual refunds. 12 Fiscal 2008 began in the third quarter of 2007 for forty-six states.

II-30
State and Local Indicators
-4
-2
0
2
4
6
8
10
12
-4
-2
0
2
4
6
8
10
12
Percent change, annual rate
1999 2001 2003 2005 2007
Q3
Spending4-quarter moving average
Real Spending on Consumption & Investment
-10
0
10
20
30
40
50
-10
0
10
20
30
40
50
Thousands of jobs, monthly average
1999 2001 2003 2005 2007
Q4
Net Change in Employment
140
150
160
170
180
190
200
140
150
160
170
180
190
200
Annual rate Billions of chained (2000) dollars
1999 2001 2003 2005 2007
Q4
Note. Nominal CPIP deflated by BEA prices throughQ3 and by a staff projection thereafter. Observation for Q4 is the average for October and November.
Real Construction
-1.0
-0.5
0.0
0.5
1.0
-1.0
-0.5
0.0
0.5
1.0
Percent of nominal GDP
1987 1992 1997 2002 2007
Q3
Net Saving
-15
-10
-5
0
5
10
15
20
-15
-10
-5
0
5
10
15
20
Percent change from year earlier
1999 2001 2003 2005 2007
4-quarter moving average
Totalrevenues
Individual and corporate income taxes
Q3
Source. Census Bureau.
State Revenues
0
2
4
6
8
10
12
14
0
2
4
6
8
10
12
14
Percent change from year earlier
1999 2001 2003 2005 2007
4-quarter moving average
Property taxes
Total revenues
Q3
Source. Census Bureau.
Local Revenues

II-31
Price Measures(Percent change)
12-month change 3-month change 1-month change
Annual rate Monthly rate
Dec. Dec. Sept. Dec. Nov. Dec.Measures 2006 2007 2007 2007 2007 2007
CPITotal 2.5 4.1 1.0 5.6 .8 .3 Food 2.1 4.9 4.9 2.4 .3 .1 Energy 2.9 17.4 -14.8 37.1 5.7 .9 Ex. food and energy 2.6 2.4 2.5 2.7 .3 .2 Core goods -.1 .1 .3 .8 .2 .0 Core services 3.7 3.3 3.3 3.5 .3 .3 Shelter 4.3 3.1 2.9 2.9 .3 .3 Other services 2.9 3.6 3.7 4.3 .3 .4 Chained CPI (n.s.a.) 1 2.4 3.4 ... ... ... ... Ex. food and energy 1 2.3 2.1 ... ... ... ...
PCE prices 2
Total 2.3 3.5 1.5 4.7 .6 .3 Food and beverages 2.1 4.6 4.5 2.3 .2 .0 Energy 3.5 18.5 -15.0 39.4 6.0 .9 Ex. food and energy 2.3 2.3 2.4 2.8 .2 .2 Core goods -.4 -.3 -.7 .9 .1 .0 Core services 3.3 3.3 3.6 3.5 .3 .3 Shelter 4.3 3.1 2.9 3.3 .3 .3 Other services 3.0 3.3 3.9 3.6 .3 .3 Core market-based 2.0 2.0 1.7 2.7 .2 .2 Core non-market-based 3.5 3.3 5.2 3.3 .2 .3
PPITotal finished goods 1.1 6.3 1.0 13.3 3.2 -.1 Food 1.7 7.4 4.2 9.4 .0 1.3 Energy -2.0 18.4 -3.0 51.9 14.1 -1.9 Ex. food and energy 2.0 2.0 1.7 2.2 .4 .2 Core consumer goods 1.8 2.5 2.1 2.8 .4 .2 Capital equipment 2.3 1.3 1.1 1.3 .3 .1 Intermediate materials 2.8 6.8 -.5 15.0 3.7 -.2 Ex. food and energy 4.5 3.3 .0 4.6 1.0 .0 Crude materials -4.7 20.6 -8.5 59.6 8.7 1.0 Ex. food and energy 17.0 16.8 12.4 3.6 -.5 .0
1. Higher-frequency figures are not applicable for data that are not seasonally adjusted. 2. PCE prices in December 2007 are staff estimates. ... Not applicable.

II-32
Consumer Prices(12-month change except as noted)
2000 2001 2002 2003 2004 2005 2006 2007 20080
1
2
3
4
0
1
2
3
4 Percent
2001 2003 2005 2007
Dec.*
Total PCE
Core PCE
* Staff estimate.
PCE Prices
2000 2001 2002 2003 2004 2005 2006 2007 20080
1
2
3
4
0
1
2
3
4 Percent
2001 2003 2005 2007
Dec.*
chainedCPI
PCE
CPI
* PCE for December is a staff estimate.
CPI and PCE ex. Food and Energy
2000 2001 2002 2003 2004 2005 2006 2007 20080
1
2
3
0
1
2
3 Percent
2001 2003 2005 2007
Dec.*
Market-based components
* Staff estimate.
PCE excluding Food and Energy
2000 2001 2002 2003 2004 2005 2006 2007 2008-1
0
1
2
3
4
5
-1
0
1
2
3
4
5 Percent
2001 2003 2005 2007
Dec.*
3-month change, annual rate
* Staff estimate.
PCE excluding Food and Energy
2000 2001 2002 2003 2004 2005 2006 2007 2008-3
-2
-1
0
1
2
3
4
-3
-2
-1
0
1
2
3
4 Percent
2001 2003 2005 2007
Dec.*
Dec.*
Services ex. energy
Goods ex. food and energy
* Staff estimate.
PCE Goods and Services
2000 2001 2002 2003 2004 2005 2006 2007 2008-1
0
1
2
3
4
5
-1
0
1
2
3
4
5 Percent
2001 2003 2005 2007
Dec.
3-month change, annual rate
CPI excluding Food and Energy

II-33
affected are sales taxes, real estate transaction fees, and capital gains taxes.13 The NCSL also reports that recent trends in revenues are generating concern among the states about the budget outlook for the remainder of fiscal 2008. The National Association of State Budget Officers reports that states expect year-end budget balances to decline for the second consecutive year as a result of the deceleration in revenues. On average, states expect to end fiscal 2008 with reserves equal to approximately 6¾ percent of general fund expenditures, well below the 11½ percent recorded at the end of fiscal 2006 but still above the 5 percent threshold generally considered to constitute an adequate cushion.
Prices Overall consumer price inflation has stepped up noticeably from the low rates posted last summer. Total PCE prices moved up 0.6 percent in November and are estimated to have increased 0.3 percent in December, thereby bringing the estimated twelve-month change in PCE prices through December to 3.5 percent. Excluding food and energy, PCE prices have continued to rise at a faster rate than they did during the first half of the year; for the year as a whole, core PCE price inflation is estimated to have been the same as in 2006. Long-term inflation expectations have moved up toward the top of the range seen in recent years.
Core PCE prices rose 0.2 percent in both October and November and are estimated to have risen 0.2 percent again in December. The estimated increase in core PCE prices over the past six months—at an annual rate of 2.6 percent—is up noticeably from the rate of 1.9 percent posted over the first half of last year. The pickup in core PCE price inflation over the second half of last year reflects an acceleration in prices that were unusually soft earlier in the year, such as prices for apparel, prescription drugs, and nonmarket services. Smoothing through the variation in monthly changes last year, the twelve-month change in core PCE prices through December—estimated at 2.3 percent—is unchanged from a year earlier.
Consumer energy prices jumped 6 percent in November after having risen 1½ percent in October, and they are estimated to have risen about 1 percent in December. These increases mainly reflect the ongoing pass-through of the higher cost of crude oil into the retail prices of gasoline and heating oil, although prices also moved up, on balance, for electricity and natural gas. At the turn of the year, the price of crude oil surged to about $100 per barrel. However, prices have retreated recently as forecasts of demand have 13 To date, property taxes—which are mostly collected by local governments—do not appear to have been adversely affected by decreases in house values. Many states limit the annual increases allowed for property tax payments, and thus property tax revenues adjust to changes in house prices only gradually.

II-34
Energy and Food Price Indicators(Data from Energy Information Administration except as noted)
2005 2006 2007 200860
80
100
120
140
160
180
60
80
100
120
140
160
180Cents per gallon
Retail price less average spot crude price*
* Regular grade seasonally adjusted by FRB staff,less average spot crude price: 60% WTI, 40% Mayaheavy crude.
Jan. 21
Total Gasoline Margin
2005 2006 2007 200850
100
150
200
250
300
350
50
100
150
200
250
300
350Cents per gallon
* Regular grade seasonally adjusted by FRB staff.** 60% WTI, 40% Maya heavy crude.
Retail price*Rack price
Average spot crude price**
Jan. 21
Gasoline Price Decomposition
2005 2006 2007 2008185
195
205
215
225
235
245
185
195
205
215
225
235
245Millions of barrels
Note. Shaded region is average historical range ascalculated by DOE. Monthly data through October 2007,weekly data thereafter, as indicated by line weights. * Adjustment for approximate amount of fuel ethanol to beblended with RBOB component of inventories; estimated byFRB staff.
Jan. 11
Excluding ethanolAdjusted for ethanol use*
Gasoline Inventories
2005 2006 2007 2008100
150
200
250
300
350
400
450
500
100
150
200
250
300
350
400
450
500Cents per gallon
Source. Chicago Board of Trade.
Near-futures price, dailyMonthly futures, Jan. 22
Ethanol Prices
2005 2006 2007 20080
1
2
3
4
5
6
0123456789101112131415
Dollars per bushel
Jan. 22
Source. Commodity Research Bureau.
Soybeans (right scale)Corn (left scale)
Spot Agricultural Commodity Prices
2005 2006 2007 20080.0
0.5
1.0
1.5
2.0
2.5
3.0
3.5
4.0
4.5
5.0
0.0
0.5
1.0
1.5
2.0
2.5
3.0
3.5
4.0
4.5
5.012-month percent change
Dec.*
Source. Bureau of Economic Analysis. *Staff estimate.
Food and beveragesEx. food and energy
PCE Food Prices

II-35
Broad Measures of Inflation(Percent change, Q3 to Q3)
Measure 2004 2005 2006 2007
Product pricesGDP price index 3.0 3.3 3.2 2.4 Less food and energy 2.9 3.2 3.2 2.3
Nonfarm business chain price index 2.5 3.5 3.0 1.5
Expenditure pricesGross domestic purchases price index 3.3 3.8 3.3 2.3 Less food and energy 2.9 3.0 3.0 2.2
PCE price index 2.7 3.2 2.9 2.1 Less food and energy 2.1 2.1 2.4 1.9
PCE price index, market-based components 2.3 3.1 2.7 2.0 Less food and energy 1.4 1.7 2.1 1.7
CPI 2.7 3.8 3.4 2.4 Less food and energy 1.8 2.1 2.8 2.1
Chained CPI 2.5 3.4 2.8 2.1 Less food and energy 1.7 1.8 2.6 1.8
Median CPI 2.3 2.4 3.2 2.8 Trimmed mean CPI 2.1 2.3 2.9 2.4
Trimmed mean PCE 2.4 2.4 2.8 2.2
Actual CPI inflation 1
Professional forecasters (10 years) 4
Surveys of Inflation Expectations(Percent)
Reuters/Michigan Survey
1 year 2 5 to 10 years 3
Period Mean Median Mean Median CPI PCE
2006:Q1 3.6 3.7 3.0 3.3 2.9 2.5 ... Q2 4.0 4.5 3.5 3.6 3.1 2.5 ... Q3 3.3 4.0 3.4 3.3 3.0 2.5 ... Q4 1.9 3.5 3.0 3.5 3.0 2.5 ...
2007:Q1 2.4 3.6 3.0 3.4 2.9 2.4 2.0 Q2 2.7 4.2 3.3 3.5 3.0 2.4 2.0 Q3 2.4 4.1 3.2 3.5 3.0 2.4 2.1 Q4 4.0 4.1 3.3 3.3 2.9 2.4 2.1
2007:Sept. 2.8 4.0 3.1 3.4 2.9 ... ... Oct. 3.5 3.7 3.1 3.1 2.8 ... ... Nov. 4.3 4.3 3.4 3.4 2.9 2.4 2.1 Dec. 4.1 4.4 3.4 3.5 3.1 ... ... 2008:Jan. n.a. 4.1 3.4 3.4 3.0 ... ...
1. Percent change from the same period in the preceding year. 2. Responses to the question, By about what percent do you expect prices to go up, onaverage, during the next 12 months? 3. Responses to the question, By about what percent per year do you expect prices to go up,on average, during the next 5 to 10 years? 4. Median CPI and PCE price projections compiled by the Federal Reserve Bank of Philadelphia. ... Not applicable. n.a. Not available.

II-36
Measures of Expected Inflation
1975 1980 1985 1990 1995 2000 20050
2
4
6
8
10
12
0
2
4
6
8
10
12Percent
1972 1977 1982 1987 1992 1997 2002 2007
Survey Measures (Reuters/Michigan)
Q4
Median, next 12 months
Median, next 5 to 10 years
Quarterly
2005 2006 2007 20080
1
2
3
4
5
6
0
1
2
3
4
5
6Percent
Monthly
Jan.
1975 1980 1985 1990 1995 2000 20050
2
4
6
8
10
12
0
2
4
6
8
10
12Percent
1972 1977 1982 1987 1992 1997 2002 2007
Inputs to Models of Inflation
*For 2007 forward, the median projection for PCE inflation over the next 10 years from the Survey of Professional Forecasters (SPF);for 1991 to 2006, the equivalent SPF projection for the CPI; for 1981 to 1991, a related survey for the CPI conducted by Richard Hoey;and for the period preceding 1981, a model-based estimate constructed by Board staff. The survey data before 2007 are adjusted down0.5 percentage point to put the CPI projections approximately on a PCE basis.
**Derived from one of the reduced-form Phillips curves used by Board staff.
Q4
FRB/US long-run expectations measurefor PCE inflation*
Distributed lag ofcore PCE inflation**
Quarterly
2005 2006 2007 20080
1
2
3
4
5
0
1
2
3
4
5Percent
Quarterly
Q4
2001 2002 2003 2004 2005 2006 20070
1
2
3
4
5
0
1
2
3
4
5Percent
Inflation Compensation from TIPS
Note. Based on a comparison of an estimated TIPS yield curve with an estimated nominal off-the-run Treasury yield curve, with anadjustment for the indexation-lag effect.
5 to 10 years ahead
Next 5 years
Quarterly
Q4
2005 2006 2007 20080
1
2
3
4
0
1
2
3
4Percent
Weekly
Jan. 22

II-37
been marked down. Currently, crude oil prices stand at levels close to those seen at the time of the December Greenbook. Survey data through mid-January point to a small increase in retail gasoline prices this month.
After a series of large increases over much of 2007, consumer food inflation has recently come in at or below core PCE inflation rates. Although the PCE price index for food and beverages is estimated to have risen 4½ percent over the twelve months ending in December, consumer food prices rose 0.2 percent in November and are estimated to have been about flat in December. The upward pressure on retail food prices emanating from meats and poultry appears to have eased somewhat late last year as increased supplies have begun to come on line. Elsewhere, a continued run-up in the prices of bakery products and a rebound in egg prices in December were offset by price declines in other categories of food at home. In commodity markets, grain prices have moved up sharply since the December Greenbook, as strong global demand has outpaced current world supplies, whereas prices for livestock have declined.
The high readings on overall consumer price inflation late last year appear to have contributed to a pickup in inflation expectations. As measured by the Reuters/University of Michigan Survey, median expectations for year-ahead inflation moved up to 3.4 percent in November and remained at that level in December and early January. The survey’s measure of median inflation expectations over the next five to ten years increased to 3.1 percent in December but ticked down to 3.0 percent in the preliminary January release. Since the December Greenbook, inflation compensation derived from TIPs has been mixed: five-year inflation compensation has declined about 0.2 percentage point, and the five-year-ahead measure has risen nearly 0.2 percentage point.
Outside the energy sector, price pressures at earlier stages of processing have also increased somewhat of late. The producer price index (PPI) for core intermediate materials rose 1 percent in November and remained flat in December. The prices of a number of energy-intensive intermediate materials—such as industrial and agricultural chemicals and plastics—moved up briskly late last year, but the prices of construction materials moved sideways, and the prices of metal products declined. On balance last year, the index for core intermediate materials increased 3¼ percent, compared with the 4½ percent rise over 2006.
Commodity prices have risen significantly over the past year, and this trend has continued since the December Greenbook. The Journal of Commerce (JOC) index of industrial materials has increased 1.5 percent since early December, and the Commodity

II-38
Commodity Price Indexes
1991 1992 1993 1994 1995 1996 1997 1998 1999 2000 2001 2002 2003 2004 2005 2006 2007 200820
40
60
80
100
120
140
160
180
20
40
60
80
100
120
140
160
1802006 = 100
Note. The Journal of Commerce (JOC) industrial price index is based almost entirely on industrial commodities, with a small weight given to energy commodities. Copyright for Journal of Commerce data is held by CIBCR, 1994.
Metals
Industrials
Jan. 22
1992 1994 1996 1998 2000 2002 2004 2006 2008
Journal of Commerce
1991 1992 1993 1994 1995 1996 1997 1998 1999 2000 2001 2002 2003 2004 2005 2006 2007 2008150
200
250
300
350
400
450
500
550
150
200
250
300
350
400
450
500
5501967 = 100
Note. The Commodity Research Bureau (CRB) spot industrials index consists entirely of industrial commodities, excludingenergy. The CRB futures index gives about a 60 percent weight to food commodities and splits the remaining weight roughlyequally among energy commodities, industrial commodities, and precious metals.
Spot industrials
Futures
Jan. 22
1992 1994 1996 1998 2000 2002 2004 2006 2008
Commodity Research Bureau
2
Selected Commodity Price Indexes(Percent change)
12/19/06 12/4/07 52-weekto to change to
Index 2006 1 12/4/07 2 1/22/08 1/22/08
JOC industrials 10.4 10.5 1.5 11.7 JOC metals 43.5 8.0 2.1 12.1 CRB spot industrials 26.9 11.9 .2 13.0 CRB spot foodstuffs 13.0 23.2 4.4 24.1 CRB futures 15.0 15.2 6.5 23.5
1. From the last week of the preceding year to the last week of the year indicated. 2. December 4, 2007, is the Tuesday preceding publication of the December Greenbook.

II-39
Research Bureau (CRB) spot index of industrial materials has edged up 0.2 percent. The faster increase in the JOC index reflects its inclusion of energy products and a different mix of metals than in the CRB index.
Labor Costs After a soft reading in October, average hourly earnings (AHE) rose 0.4 percent in both November and December; the twelve-month change in AHE was 3.7 percent in December, down about ½ percentage point from the elevated pace posted in 2006.

II-40
1996 1998 2000 2002 2004 2006 20080
1
2
3
4
5
6
7
8
0
1
2
3
4
5
6
7
8Percent
1997 1999 2001 2003 2005 2007
Productivity and costs*
ECI
Q3
Q3
* Value for 2007:Q3 is a staff estimate.
Compensation per Hour (Percent change from year-earlier period)
1996 1998 2000 2002 2004 2006 2008-2
-1
0
1
2
3
4
5
6
-2
-1
0
1
2
3
4
5
6Percent
1997 1999 2001 2003 2005 2007
Q3
Note. Value for 2007:Q3 is a staff estimate.
Unit Labor Costs (Percent change from year-earlier period)
1996 1998 2000 2002 2004 2006 20081.52
1.54
1.56
1.58
1.60
1.62
1.64
1.66
1.52
1.54
1.56
1.58
1.60
1.62
1.64
1.66Ratio
1997 1999 2001 2003 2005 2007
Average,1968-present
Q3
Note. The markup is the ratio of output price to unitlabor costs. Value for 2007:Q3 is a staff estimate.
Markup, Nonfarm Business
1996 1998 2000 2002 2004 2006 20081.0
1.5
2.0
2.5
3.0
3.5
4.0
4.5
1.0
1.5
2.0
2.5
3.0
3.5
4.0
4.5Percent
1997 1999 2001 2003 2005 2007
Dec.
Average Hourly Earnings (Percent change from year-earlier period)
Hourly Compensation and Unit Labor Costs(Percent change from preceding period at compound annual rate; based on seasonally adjusted data)
2005:Q3 2006:Q3 2006 2007to to
Category 2006:Q3 2007:Q3e Q4 Q1 Q2 Q3 e
Compensation per hourNonfarm business 2.7 5.8 12.2 5.9 1.0 4.3
Unit labor costsNonfarm business 2.6 3.0 10.3 5.2 -1.1 -1.8
e Staff estimate.
Last Page of Domestic Nonfinancial Developments

Domestic FinancialDevelopments

III-T-1Selected Financial Market Quotations(One-day quotes in percent except as noted)
Change to Jan. 22 from2006 2007 2008 selected dates (percentage points)
Instrument 2006 2007 2007 June 29 Sept. 17 Dec. 10 Jan. 22 June 29 Sept. 17 Dec. 10
Short-termFOMC intended federal funds rate 5.25 5.25 4.50 3.50 -1.75 -1.75 -1.00
Treasury bills1
3-month 4.88 4.05 2.98 2.30 -2.58 -1.75 -.68 6-month 5.06 4.15 3.20 2.34 -2.72 -1.81 -.86
Commercial paper (A1/P1 rates)2
1-month 5.27 5.23 4.36 3.51 -1.76 -1.72 -.85 3-month 5.37 5.25 4.94 3.37 -2.00 -1.88 -1.57
Large negotiable CDs1
3-month 5.47 5.52 5.18 3.38 -2.09 -2.14 -1.80 6-month 5.59 5.36 4.98 3.23 -2.36 -2.13 -1.75
Eurodollar deposits3
1-month 5.33 5.55 5.40 3.80 -1.53 -1.75 -1.60 3-month 5.49 5.60 5.25 3.70 -1.79 -1.90 -1.55
Bank prime rate 8.25 8.25 7.50 6.50 -1.75 -1.75 -1.00
Intermediate- and long-termU.S. Treasury4
2-year 5.26 4.12 3.17 2.04 -3.22 -2.08 -1.13 5-year 5.15 4.18 3.55 2.69 -2.46 -1.49 -.86 10-year 5.28 4.58 4.33 3.71 -1.57 -.87 -.62
U.S. Treasury indexed notes5
5-year 2.51 2.04 1.42 .71 -1.80 -1.33 -.71 10-year 2.61 2.15 1.94 1.34 -1.27 -.81 -.60
Municipal general obligations (Bond Buyer)6 4.71 4.46 4.38 4.15 -.56 -.31 -.23
Private instruments 10-year swap 5.81 5.17 4.89 4.17 -1.64 -1.00 -.72 10-year FNMA7 5.59 5.01 4.83 4.12 -1.47 -.89 -.71 10-year AA8 6.20 6.05 6.08 5.64 -.56 -.41 -.44 10-year BBB8 6.74 6.46 6.55 6.23 -.51 -.23 -.32 10-year high yield8 8.74 8.95 9.23 1.05 1.31 1.10 .82
Home mortgages (FHLMC survey rate)9
30-year fixed 6.78 6.34 6.11 5.69 -1.09 -.65 -.42 1-year adjustable 5.82 5.65 5.50 5.26 -.56 -.39 -.24
Change to Jan. 22 Record high 2007 2008 from selected dates (percent)
Stock exchange index Record 2007 2007 Level Date Sept. 17 Dec. 10 Jan. 22 high Sept. 17 Dec. 10
Dow Jones Industrial 14,165 10-9-07 13,403 13,727 11,971 -15.48 -1.69 -12.79S&P 500 Composite 1,565 10-9-07 1,477 1,516 1,311 -16.27 -11.25 -13.55Nasdaq 5,049 3-10-00 2,582 2,719 2,292 -54.60 -11.21 -15.69Russell 2000 856 7-13-07 776 791 672 -21.52 -13.44 -15.12Wilshire 5000 15,807 10-9-07 14,839 15,311 13,190 -16.56 -11.12 -13.86
1. Secondary market. 2. Financial commercial paper. 3. Bid rates for Eurodollar deposits collected around 9:30 a.m. eastern time. 4. Derived from a smoothed Treasury yield curve estimated using off-the-run securities. 5. Derived from a smoothed Treasury yield curve estimated using all outstanding securities and adjusted for the carry effect. 6. Most recent Thursday quote. 7. Constant-maturity yields estimated from Fannie Mae domestic noncallable coupon securities. 8. Derived from smoothed corporate yield curves estimated using Merrill Lynch bond data. 9. Home mortgage rates for January 22, 2008, are for the week ending January 17, 2008. _______________________________________________________________________
NOTES:
June 29, 2006, is the day the most recent policy tightening ended. September 17, 2007, is the day before the most recent policy easing began. December 10, 2007, is the day before the most recent FOMC announcement.
_______________________________________________________________________

Short-Term Funding and Interbank MarketsIII-C-1
July Sept. Nov. Jan.2007
20
40
60
80
100
120Basis points
2008
Spreads between 30-Day Liborand OIS Rates
Daily Dec. FOMC
Jan. 22
July Sept. Nov. Jan.2007
0
50
100
150
200Basis points
2008
Daily
Spreads on 30-DayCommercial Paper
Dec. FOMC
Jan. 22
ABCP
A2/P2
Note. The ABCP spread is the AA ABCP rate minus the AAfinancial rate. The A2/P2 spread is the A2/P2 nonfinancialrate minus the AA nonfinancial rate.
800
900
1000
1100
1200
1300Billions of dollars
Dec. FOMCWeekly
Commercial Paper Outstandings
Note. Seasonally adjusted; weeks ending on Wednesdays.
ABCP
Unsecured CPJan. 16
Jan. Mar. May July Sept. Nov. Jan. 2007 2008
July Aug. Oct. Nov. Dec. Jan.2007
3.0
3.5
4.0
4.5
5.0
5.5
6.0Percent
Sept.2008
Dec. FOMC
Federal Funds Rates
Daily
Target
Effective
July Sept. Nov. Jan.2007
2.0
2.5
3.0
3.5
4.0
4.5
5.0
5.5
6.0Percent
2008
Daily
3-Month Treasury Bill Rate
Dec. FOMC
Jan. 22
July Sept. Nov. Jan.2007
1
2
3
4
5
6Percent
Daily
Treasury Repo Ratesfor General Collateral
Dec. FOMC
Jan. 22
Overnight
Onemonth
2008

Domestic Financial Developments
III-1
Overview While pressures in short-term funding markets have eased somewhat since the December FOMC meeting, perceptions of a deteriorating economic outlook have weighed heavily on broader financial markets. Equity price indexes have plunged, and corporate bond spreads have shot up to their highest levels since 2003. The FOMC lowered the target federal funds rate 75 basis points on January 22, and market participants place high odds on at least 50 basis points of additional easing at the upcoming FOMC meeting. Further ahead, the expected policy path bottoms out at about 2 percent in early 2009, about 120 basis points lower than at the time of the December meeting. Nominal Treasury yields have dropped sharply. Near-term inflation compensation has moved somewhat lower, on net, but inflation compensation at more-distant horizons has risen modestly.
Delinquency rates on subprime mortgages increased markedly, and those on prime mortgages and on nonmortgage consumer loans edged up. Issuance of securities backed by nonconforming residential mortgages fell to its slowest pace since 2002. Commercial bank credit continued to expand briskly, spurred by strong growth in business loans and in nonmortgage consumer loans. In the January 2008 Senior Loan Officer Opinion Survey on Bank Lending Practices, banks reported further net tightening of terms and standards on business and household loans over the past three months.
Money Market Functioning Conditions in short-term funding markets have improved since the December FOMC meeting, but strains remain. Spreads of term federal funds rates and libor over rates on comparable-maturity overnight index swaps have narrowed substantially, on net, since the December FOMC but are still elevated by historical standards. Spreads on asset-backed commercial paper, as well as those on lower-rated nonfinancial unsecured paper, also fell significantly on net. Asset-backed commercial paper outstanding increased in each of the first two weeks of January, after having contracted in every week since August.
Yields on three-month Treasury bills rose after the turn of the year, as market participants reported significantly improved trading conditions; more recently, however, renewed safe-haven flows along with the lower policy path pushed yields markedly lower, on net, and liquidity in the bill market deteriorated. In addition, rates on general collateral Treasury repurchase agreements have generally traded substantially below the overnight federal funds rate since the December FOMC.

III-2
Dec. 10 Dec. 13 Dec. 18 Dec. 21 Dec. 27 Jan. 2 Jan. 7 Jan. 10 Jan. 15 Jan. 18
2.2
2.4
2.6
2.8
3.0
3.2
3.4
3.6
3.8
4.0
4.2
4.4
Percent
FOMCstatement
TAFannouncement
Durablegoods
ISM Nonfarmpayrolls
Chairman’sspeech
Intermeetingmove
February 2008 federal funds
December 2008 Eurodollar
Money Market Futures Rates
Note. 5-minute intervals. 8:00 a.m. to 4:00 p.m. No adjustments for term premiums.
2.00
2.25
2.50
2.75
3.00
3.25
3.50
3.75
4.00
4.25
Percent
Feb. June Oct. Feb. June Oct. Feb. 2008 2009 2010
Expected Federal Funds Rates
Note. Estimates from federal funds and Eurodollar futures.
January 22, 2008
December 10, 2007
50
100
150
200
250
300
Oct. Feb. June Oct. Feb. June Oct.2005 2006 2007
200
300
400
500
600
700
800
900Basis points Basis points
6-month Eurodollar (left scale)*10-year Treasury (right scale)
Implied Volatility of Interest Rates
Daily
Jan. 22
Dec. FOMC
*Width of a 90 percent confidence interval computed from theterm structures for the expected federal funds rate and impliedvolatility.
Jan.
2008
1 3 5 7 10 20
2.0
2.5
3.0
3.5
4.0
4.5
5.0Percent
Treasury Yield Curve
Years ahead Note. Smoothed yield curve estimated from off-the-run Treasurycoupon securities. Yields shown are those on notional par Treasurysecurities with semiannual coupons.
December 10, 2007
January 22, 2008
Jan. Mar. May July Sept. Nov. Jan.2007
2.0
2.2
2.4
2.6
2.8
3.0Percent
Five-to-ten years ahead
Next five years*
Inflation Compensation
Daily
Note. Estimates based on smoothed nominal and inflation-indexed Treasury yields. *Adjusted for lagged indexation of TIPS.
Dec. FOMC
2008
Policy Expectations and Treasury Yields

III-3
Policy Expectations and Treasury Yields The expected path of monetary policy over the next year has tilted down steeply since the December FOMC meeting, largely in response to concerns about a deteriorating economic outlook. Economic data, particularly the ISM and employment reports released just after the turn of the year, came in weaker than expected, prompting strong reactions from market participants. Reports of heavy losses at large financial institutions on mortgage-related securities also appeared to have pushed down policy expectations, even as some large financial institutions were successful in raising capital.
Investors largely anticipated the Committee’s decision to lower the target federal funds rate 25 basis points at the December meeting, though they were reportedly disappointed by the absence of any accompanying measures to address strains in term funding markets. Some of that surprise was reversed the next day, following the announcement of the Term Auction Facility (TAF) and the associated swap lines with the European and Swiss central banks. The release of the minutes of the December FOMC meeting elicited little market reaction. The expected policy path moved down a few basis points with the Chairman’s speech on January 10, as market participants reportedly interpreted the remarks as suggesting that the FOMC would likely ease policy aggressively in response to a deterioration in the economic outlook.
The 75 basis point reduction in the target federal funds rate on January 22 largely surprised market participants, and implied rates on short-dated futures contracts declined sharply on the announcement. On net, market participants now expect the federal funds rate to decline to about 2 percent by early 2009, about 120 basis points lower than they had priced in at the time of the December meeting. Options on federal funds futures contracts indicate that investors place high odds on at least 50 basis points of policy easing at next week’s FOMC meeting. On balance, uncertainty about the course of monetary policy over the next six months has changed little on net since early December; option-implied distributions of the federal funds rate over that horizon remained negatively skewed around a significantly lower modal outcome.
Consistent with the revision in policy expectations and the reduction in the target federal funds rate, yields on nominal Treasury coupon securities have declined substantially since the December FOMC, and the yield curve has steepened somewhat further; the two-year yield has dropped 110 basis points, while the ten-year yield has declined about 60 basis points. Near-term inflation compensation increased in early January amid rising oil prices, but it subsequently retreated and is now about 15 basis points lower, on net,

III-4
Corporate Yields, Risk Spreads, and Stock Prices
80
85
90
95
100
105
110
115
120
125
130Dec. 10, 2007 = 100
Jan. Mar. May July Sept. Nov. Jan.2007
Selected Stock Price Indexes
Daily
Wilshire 5000
DJ Financial
Dec. FOMC
Jan. 22
2008
5
15
25
35
Percent
Jan. Mar. May July Sept. Nov. Jan.2007
Implied Volatility on S&P 500 (VIX)
Daily
Avg.since 1991
Dec. FOMC
Jan. 22
2008
1984 1988 1992 1996 2000 2004 2008
2
4
6
8
10
12Percent
Ratio of Trend Earnings to Price for S&P 500 andLong-Run Treasury Yield
Monthly
(Trend earnings) / P *
Long-run real Treasury yield
+
+
Jan. 22
* Trend earnings are estimated using analysts’ forecasts ofyear-ahead earnings from I/B/E/S. + Denotes the latest observation using daily interest rates andstock prices and latest earnings data from I/B/E/S.
4.5
6.0
7.5
9.0
10.5
12.0
Percent
2002 2003 2004 2005 2006 2007 2008
Corporate Bond Yields
Daily
10-year high-yield
10-year BBB
Dec. FOMC
Jan. 22
Note. Yields from smoothed yield curves based on Merrill Lynchbond data.
0
200
400
600
800
90
165
240
315
390Basis points Basis points
2002 2003 2004 2005 2006 2007 2008
Corporate Bond Spreads
DailyDec.
FOMC
Jan. 22
Note. Measured relative to comparable-maturity Treasuries.
10-year high-yield(left scale)
10-year BBB(right scale)
0
200
400
600
800
1000
Basis points
2002 2003 2004 2005 2006 2007 2008
Far-Term and Near-Term Forward High-YieldCorporate Bond Spreads
DailyDec.
FOMC
Jan. 22
* Forward spread between years 2 and 3. ** Forward spread between years 9 and 10. Source. Staff estimates.
Near-term*
Far-term**

III-5
than in early December. Five-year-forward inflation compensation five years ahead has risen about 15 basis points, on net, since the December FOMC, including about a 10 basis point increase on the day of the intermeeting move.
Stock Prices and Corporate Interest Rates Broad stock price indexes have fallen 14 percent over the intermeeting period, on perceptions of a deteriorating economic outlook and additional write-downs by financial institutions. Declines were widespread across sectors, but bank stocks were again among the hardest hit. Stock prices of financial guarantors continued their precipitous declines with the news of possible and actual downgrades of their insurer ratings, which also fueled already elevated concerns in the broader markets about further losses on CDOs and municipal securities. Option-implied volatility on the S&P 500 index remained high by historical standards and increased markedly in the past few days. The spread between the twelve-month-forward trend earnings-to-price ratio for S&P 500 firms and a real long-run Treasury yield—a rough gauge of the equity risk premium—widened further and is now at the upper end of its range over the past two decades.
Yields on investment-grade corporate bonds have fallen less than those on comparable-maturity Treasury securities since the December FOMC meeting, while yields on speculative-grade bonds have risen about 80 basis points. As a result, corporate bond spreads climbed to their highest levels since early 2003. The run-up in speculative-grade spreads was particularly sharp and primarily reflected higher near-term forward spreads, suggesting increased concern among investors about the outlook for corporate credit quality over the next few years. Far-term forward spreads on speculative-grade bonds rose a bit above recent peaks, suggesting that corporate bond investors now require somewhat greater compensation for credit risk.
Corporate Earnings and Credit Quality With about 100 earnings reports in hand and analysts’ forecasts for the remainder, operating earnings per share for the S&P 500 firms in the fourth quarter are projected to have been about 20 percent below year-ago levels, depressed by huge losses at financial firms. In contrast, for nonfinancial firms in the S&P 500, four-quarter growth in earnings per share is projected to have been about 12 percent. Revisions to year-ahead earnings for the S&P 500 as a whole were substantially negative in the month ending in mid-December, but revisions were modestly positive for nonfinancial firms.

III-6
Corporate Earnings and Credit Quality
-30
-20
-10
0
10
20
30
40Percent
All firmsNonfinancials
1998 2001 2004 2007
S&P 500 Earnings Per Share
Change from 4 quarters earlier
Q4
Q4
Source. I/B/E/S for S&P 500 earnings per share.
p
p
p Preliminary.
-4
-3
-2
-1
0
1
2
3Percent
All firmsNonfinancials
2002 2003 2004 2005 2006 2007
Revisions to Expected S&P 500 Earnings
Monthly
Mid- Dec.
Note. Index is a weighted average of the percent change in theconsensus forecasts of current-year and following-year EPS for afixed sample.
0.03
0.06
0.09
0.12
0.25
0.30
0.35Ratio Ratio
1989 1992 1995 1998 2001 2004 2007
Financial Ratios for Nonfinancial Corporations
Annual*
Debt overtotal assets(right scale)
Liquid assets overtotal assets(left scale)
Q3
Q3
* Data are quarterly starting in 2000:Q1. Source. Calculated with Compustat data.
1991 1993 1995 1997 1999 2001 2003 2005 200750
40
30
20
10
0
10
20
30
40
Upgrades
Downgrades
Bond Ratings Changes of Nonfinancial CompaniesPercent of outstandings
Annual rate
Source. Calculated with data from Moody’s Investors Service.
H1
Q3
Q4
0
1
2
3
4
5
6
7Percent of outstandings
1991 1995 1999 2003 2007
Selected Default and Delinquency Rates
C&I loan delinquency rate (Call Report)
Bond default rate*
* 6-month moving average, from Moody’s Investors Service.
Q3
Dec. 0.0
0.5
1.0
1.5
2.0Percent of liabilities
1993 1995 1997 1999 2001 2003 2005 2007
Expected Year-Ahead Defaults
Monthly
Dec.
Note. Firm-level estimates of default weighted by firm liabilities asa percent of total liabilities, excluding defaulted firms. Source. Moody’s KMV.

III-7
Overall, the credit quality of nonfinancial firms continued to be solid. Data on corporate balance sheets for the third quarter of 2007 indicate that the aggregate ratio of liquid assets to total assets stayed high by historical standards, while aggregate leverage ticked up but remained low. In December, rating downgrades on corporate bonds were again modest. In addition, the realized six-month trailing default rate on corporate bonds stayed near zero in December, and the delinquency rate on C&I loans was close to historical lows in the third quarter. The forecast of the aggregate year-ahead default rate based on the KMV model moved up further in December, but remained moderately low by historical standards.
Business Finance Gross bond issuance by nonfinancial firms was strong in December but appears to have stepped down in January. The moderation in bond issuance likely reflects typical seasonal patterns and rising yields on speculative-grade bonds. Outstanding nonfinancial commercial paper declined somewhat in December but rebounded in January. C&I loans expanded briskly in December and in the first half of January, though at a considerably slower pace than over the second half of 2007. Aggregating across bonds, commercial paper, and C&I loans, net debt financing in the fourth quarter about matched its robust third-quarter pace.
Gross public equity issuance by nonfinancial firms, including both seasoned and initial public offerings, slowed in December and has been very light in January, likely due to typical seasonal patterns and the drop in equity prices. In the third quarter, the combined level of public and private equity issuance was dwarfed again by the extraordinary pace of equity retirements. This pattern likely continued in the fourth quarter, judging from the partial data in hand on equity retirements. Retirements from cash-financed mergers and acquisitions set a new record in the fourth quarter, boosted by a few blockbuster leveraged buyouts from the pipeline of pending deals. However, relatively few new deals were announced. Meanwhile, announcements of new share repurchase programs by nonfinancial firms have continued apace.
Commercial Real Estate The growth of commercial mortgage debt slowed a bit in the third quarter (latest complete data), perhaps restrained by an upward drift in commercial mortgage rates. Even so, the pace of debt growth in this sector stayed in the upper end of its range over the past decade. The sharp decline in commercial-mortgage-backed securities (CMBS) issuance in the fourth quarter (not shown) suggests that the growth of commercial

III-8
Business FinanceGross Issuance of Securities by U.S. Corporations
(Billions of dollars; monthly rates, not seasonally adjusted)
2007 2008
Type of security 2003 2004 2005 2006 H1 Q3 Q4 Dec. Jan. p
Nonfinancial corporationsStocks1 3.7 5.4 4.6 4.7 5.5 4.3 6.5 2.7 2.0 Initial public offerings .4 1.6 1.7 1.8 1.7 1.2 2.0 .9 1.0 Seasoned offerings 3.3 3.8 2.8 2.9 3.9 3.1 4.4 1.8 1.0
Bonds2 31.6 22.7 19.1 29.8 37.9 26.6 37.0 32.8 20.0 Investment grade 15.9 8.2 8.4 13.0 14.2 19.8 20.3 25.3 17.0 Speculative grade 11.3 9.7 6.4 8.0 15.4 3.4 6.8 5.0 3.0 Other (sold abroad/unrated) 4.3 4.9 4.3 8.8 8.3 3.3 9.9 2.5 .0
MemoNet issuance of commercial paper3 -3.4 1.5 -.4 3.9 1.2 -4.1 -.2 -3.5 5.0Change in C&I loans at commercial banks3,4 -7.7 3.1 9.9 13.0 12.2 36.7 21.5 12.2 16.0
Financial corporationsStocks1 6.6 6.9 5.0 5.3 9.3 3.5 12.1 18.1 n.a.Bonds2 111.1 139.3 176.3 187.7 207.0 126.9 79.0 51.1 50.0
Note. Components may not sum to totals because of rounding. 1. Excludes private placements and equity-for-equity swaps that occur in restructurings. 2. Data include regular and 144a private placements. Bond totals reflect gross proceeds rather than par value oforiginal discount bonds. Bonds are categorized according to Moody’s bond ratings or to Standard & Poor’s ifunrated by Moody’s. 3. End-of-period basis, seasonally adjusted. 4. Adjusted commercial bank credit data. 5. n.a. Not Available. p Preliminary. n.a. Not available.
2003 2004 2005 2006 2007
-40
-30
-20
-10
0
10
20
30
40
50
60
Commercial paper*C&I loans*Bonds
Total
Selected Components of Net Debt Financing
Billions of dollars
Monthly rate, nonfinancial firms
H1
Q3Q4
* Seasonally adjusted, period-end basis.
2003 2004 2005 2006 2007
-100
-90
-80
-70
-60
-50
-40
-30
-20
-10
0
10
20
30
40
Public issuancePrivate issuanceRepurchasesCash mergers
Total
Components of Net Equity Issuance
Billions of dollars
Monthly rate, nonfinancial firms
H1 Q3

III-9
1996 1998 2000 2002 2004 2006 0
2
4
6
8
10
12
14
16
18Percent change from year earlier
Q3
Commercial Mortgage Debt
Quarterly
Source. Flow of funds.2001 2002 2003 2004 2005 2006 2007
0
20
40
60
80Billions of dollars
3-month moving average
Dec.p
Sales of Commercial Real Estate
Preliminary Source. Real Capital Analytics. p
2000 2002 2004 2006 2008 0
100
200
300
400
500
600
700
800
900Basis points
AAA
BBB
Jan. 16
Jan. 16
Investment-Grade CMBS Spreads
Note. Measured relative to the 10-year Treasury yield. Source. Morgan Stanley.
Weekly
2001 2003 2005 20075
6
7
8Percent
Dec.p
Interest Rate on Mortgages Originated for Securitization
p Preliminary. Source. Real Capital Analytics.
6
8
10
12
14
16
1992 1995 1998 2001 2004 2007-8
-6
-4
-2
0
2
4
6
8
10Percent Percent change from year earlier
Vacancy rates(left scale)
Rents(right scale)
Q3
Q4
Quarterly
Rents and Vacancy Rates on CommercialProperties
Note. Average of series for office, industrial, and retailproperties. Source. Torto Wheaton.
1997 1999 2001 2003 2005 2007
0
1
2
3
4Percent
Q3
Q3
Nov.
At lifeinsurancecompanies
CMBS
At commercial banks*
Delinquency Rates on Commercial Mortgages
* Excluding construction, land development, and multifamily loans. Source. Citigroup, Call Report, ACLI.
Commercial Real Estate

III-10
1997 1999 2001 2003 2005 2007 0
2
4
6
8
10
12
14
16Percent change from year earlier
Mortgage
Consumer
Q3
Nov.
Mortgage Debt and Consumer Credit
Source. Flow of funds.2006 2007
5.0
5.5
6.0
6.5
7.0
7.5Percent
30-year fixed-rate conforming
1-year adjustable-rate
conforming
30-year fixed-rate
jumbo
Jan.16
Jan.16
Jan.16
2008
Mortgage Rates for Prime Borrowers
Weekly
Source. Freddie Mac and Inside Mortgage Finance.
2001 2002 2003 2004 2005 2006 2007 0
2
4
6
8
10
12
14
16
18
20
22Percent of loans
Subprime
Prime
Fixed rateVariable rate
Nov.
Nov.
Nov.
Delinquencies on Mortgages
Monthly
Note. Percent of loans 90 or more days past due or inforeclosure. Prime includes near-prime mortgages. Source. First American LoanPerformance.
1997 1999 2001 2003 2005 20071
2
3
4
5
6Percent
Auto loans at captive finance companies
Credit card loans
Nonrevolvingconsumer loans atcommercial banks
Nov.
Q3
Q3
Delinquencies on Consumer Loans
Source. For credit cards and nonrevolving, Call Report; for auto loans, Federal Reserve.
0
20
40
60
80
100Billions of dollars
2002 2003 2004 2005 2006 2007
Prime jumboSubprimeAlt-A
Monthly rate
Gross Issuance of Non-Agency MBS by Type
H1H2 H1
Q3
Q4
Source. Inside Mortgage Finance MBS database.
0
5
10
15
20
25
30Billions of dollars
2002 2003 2004 2005 2006 2007
Credit CardAuto
Monthly rate
Gross Issuance of ABS by Type
H1H2 H1
Q3Q4
Note. Auto includes car loans and leases and financing for buyers of motorcycles, trucks, and other vehicles. Source. Inside MBS & ABS and Merrill Lynch.
Household Liabilities

III-11
mortgage debt may have slowed further. Sales of commercial real estate decreased again in December, but remained high by historical standards.
Since the December FOMC meeting, spreads of yields on AAA-rated CMBS over those on comparable-maturity Treasuries have remained at historically high levels, while spreads on BBB-rated CMBS continued to soar. These elevated spreads reportedly reflect continued concerns about high levels of leverage on recently securitized mortgages and about credit risks in structured financial products in general. Interest rates on commercial mortgages originated for securitization increased but remained below their highs early on in this decade.
Fundamentals in the commercial real estate sector continued to be solid on the whole. In the fourth quarter, the vacancy rate on commercial properties remained near its average level, and commercial rents continued to grow moderately. Delinquency rates on CMBS stayed low through November; and in the third quarter, the delinquency rate on commercial real estate loans held at life insurance companies remained near zero. At the same time, commercial banks experienced a further uptick in commercial mortgage delinquencies, although the rate remained low by historical standards.
Household Finance The growth of residential mortgage debt declined further in the third quarter. Nonmortgage consumer credit continued to grow at a moderate pace in November. Since the December FOMC, interest rates on thirty-year fixed-rate conforming mortgages have fallen roughly in line with those on comparable-maturity Treasuries, and indicative quotes on thirty-year fixed-rate jumbo mortgage rates have fallen as well. Interest rates on credit card and auto loans have been about unchanged (not shown), although their spreads over Treasury rates have widened.
Household loan performance has deteriorated further on balance, though problems remained concentrated among subprime mortgage borrowers. In November, delinquency rates on variable-rate and fixed-rate subprime mortgages continued to rise notably, reaching 21 percent and 7.5 percent, respectively. Meanwhile, delinquency rates on variable-rate prime mortgages edged up to 2 percent, while those on fixed-rate prime mortgages stayed near 1 percent. The delinquency rate on auto loans held at captive finance companies ticked up further in November and now stands at its highest level since 1998. In general, delinquency rates on nonmortgage consumer credit have trended up over the past year but remained at or below their average levels over the past decade.

III-12
1997 1999 2001 2003 2005 2007-4
-2
0
2
4
6
8
10
12
14Percent change, annual rate
Quarterly, s.a.
House Prices
Source. Office of Federal Housing Enterprise Oversight.
Q3
OFHEO purchase-only index
Jan. Jan. Jan. Jan.2005 2006 2007 2008
80
90
100
110
120Oct. 2007 = 100
Jan. 22, 2008Dec. 10, 2007 Oct.
2007
S&P/Case-Shiller House Price Futures
Source. S&P/Case-Shiller; Chicago Mercantile Exchange.
1997 1999 2001 2003 2005 2007-100
-50
0
50
100
150Percent change, annual rate
Quarterly, end of period
Stock Prices
Wilshire 5000
Q4
1996 1998 2000 2002 2004 2006 20084.5
5.0
5.5
6.0
6.5Ratio to disposable income
e Staff estimate.
Quarterly, end of period, s.a.
Net Worth
Q4e
Household Assets
Net Flows into Mutual Funds(Billions of dollars, monthly rate)
Fund type 2006 2007 2007 Assets Q1 Q2 Q3 Q4e Dec.e Nov.
Total long-term funds 18.9 39.5 24.2 4.6 8.3 8.4 9,002 Equity funds 13.3 21.2 8.1 1.2 1.5 4.0 6,604 Domestic 0.9 6.5 -3.9 -8.3 -8.1 -5.2 4,919 International 12.4 14.7 12.0 9.5 9.6 9.2 1,685
Hybrid funds 0.6 3.3 1.9 1.0 1.5 2.0 719 Bond funds 5.0 15.0 14.1 2.5 5.4 2.3 1,679 High-yield -0.2 0.7 -0.2 -0.8 -0.4 0.2 157 Other taxable 4.0 11.4 12.5 3.1 6.7 4.6 1,143 Municipals 1.3 2.9 1.8 0.2 -0.9 -2.5 378Money market funds 27.8 18.1 34.5 108.0 83.4 27.1 3,099
Note. Excludes reinvested dividends.
e Staff estimate based on confidential weekly data.
Source. Investment Company Institute.

III-13
While issuance of nonconforming residential-mortgage-backed securities (RMBS) was extremely weak in the fourth quarter, issuance of MBS guaranteed by Fannie Mae and Freddie Mac (not shown) was robust. Issuance of consumer auto and credit card asset-backed securities also remained solid last quarter, although the deals were placed at notably higher spreads than in early autumn.
OFHEO’s purchase-only index of national home prices posted a small nominal decrease in the third quarter. S&P/Case-Shiller’s ten-city composite house price index fell sharply in October, leading financial market participants to mark down the expected path for house prices slightly. S&P/Case-Shiller futures quotes now indicate that investors expect house prices to fall at least through the middle of 2008 in each of the ten large cities that they cover. With stock prices having declined last quarter and house prices likely to have done so as well, the ratio of household net worth to disposable personal income is estimated to have fallen in the fourth quarter. Long-term mutual funds received net inflows in December despite continued net redemptions of domestic equity funds. On balance, money market funds attracted new cash in December, but much less than in the previous few months.
Treasury and Agency Finance Treasury auctions of two-, five-, and ten-year nominal notes and of ten- and twenty-year TIPS notes over the intermeeting period were all well received. The Treasury raised the size of its bill auctions to offset the bills redeemed by the Federal Reserve to accommodate credit extended through the TAF. Foreign custody holdings at the Federal Reserve Bank of New York were generally about flat, and foreign participation in Treasury auctions continued to decline modestly. Spreads between on-the-run and off-the-run ten-year yields widened further to their highest levels since 2003. However, bid-asked spreads on both on-the-run and off-the-run Treasury notes have retreated somewhat since the end of the year and trading volume of on-the-run Treasury securities has picked up.
Yield spreads on GSE debt have declined on net since the December FOMC, but remained a bit elevated by historical standards. In January, Moody’s placed Freddie Mac on watch for a possible downgrade of its financial strength rating. Moody’s decision followed Freddie Mac’s announcement on the day of the December FOMC meeting that it expected substantial portfolio losses in the fourth quarter. GSE equity prices have fallen notably since the December FOMC meeting. In early January, Fannie Mae raised capital by issuing $7 billion of preferred stock, roughly matching Freddie Mac’s

III-14
Treasury and Agency Finance
2003 2004 2005 2006 2007 2008
200
400
600
800
1000
1200
1400Billions of dollars
Foreign Custody Holdings
Weekly average
Note. Securities held in custody at the Federal Reserve Bankof New York on behalf of foreign official institutions.
Treasury
Agency
Jan. 16
Jan. 16
0
10
20
30
40
50
60Percent of total issue
Indirect bids
Actual foreign allotment
2001 2003 2005 2007
Foreign Participation in Treasury Auctions
6-month moving average
Dec. 31
Dec. 17
Note. Indirect bids and actual allotment are a percentage ofthe total amount accepted, including the amount tendered tothe Federal Reserve. Moving averages include 2-, 5-, and 10-year original auctions and reopenings.
Jan. May Sept. Jan. May Sept. Jan.2006 2007
0
100
200
300
400Billions of dollars
2008
Dec.FOMC
Average Trading Volume
Note. 5-day moving average of daily trading volume in 2-, 5-, and 10-year on-the-run coupon securities in interdealer market. Source. BrokerTec Interdealer Market Data.
5-day moving average
Jan. 22
Jan. May Sept. Jan. May Sept. Jan.2006 2007
0.80
0.85
0.90
0.95
1.00
1.05
1.10
Cents per $100 face value
2-year on-the-run Treasury notes
2008
Bid-Ask Spread
Source. BrokerTec Interdealer Market Data.
5-day moving average
Jan. 22
Dec.FOMC
July Oct. Jan. Apr. July Oct. Jan.2006 2007
20
30
40
50
60
70
80Basis points
Fannie MaeFreddie Mac
2008
10-Year GSE Yield Spreads
Daily
Note. GSE yields based on senior unsecured debt relative to the off-the-run Treasury yield.
Dec.FOMC
Jan. 22
May Aug. Nov. Feb. May Aug. Nov.2006 2007
25 35 45 55 65 75 85 95105115125135145
May 1, 2006 = 100
Fannie MaeFreddie Mac
Jan.
2008
GSE Stock Prices
Daily Dec.FOMC
Jan. 22
Jan. 22

III-15
State and Local Government FinanceGross Offerings of Municipal Securities
(Billions of dollars; monthly rate, not seasonally adjusted)
2007 2008
Type of security 2003 2004 2005 2006 H1 Q3 Q4 Dec. Jan. p
Total 37.9 34.7 38.4 36.1 41.9 36.4 41.3 33.8 23.0 Long-term 1 32.0 29.8 34.1 32.5 38.5 30.7 34.3 29.2 20.0 Refundings 2 10.0 10.8 15.6 10.6 16.3 7.6 9.3 6.9 3.0 New capital 22.1 19.0 18.6 21.9 22.1 23.1 25.0 22.3 17.0 Short-term 5.8 4.9 4.2 3.7 3.4 5.7 7.0 4.6 3.0
Memo: Long-term taxable 3.5 2.0 2.1 2.5 2.2 3.0 2.2 1.3 1.0
1. Includes issues for public and private purposes. 2. All issues that include any refunding bonds. p Based on preliminary data through January 17, 2008.
1990 1992 1994 1996 1998 2000 2002 2004 2006 20082800
2100
1400
700
0
700
1400
2100
2800
Upgrades
Downgrades
Ratings ChangesNumber of ratings changes
Annual rateH1
Q3
Q4
Jan. *
Source. S&P’s Credit Week Municipal and Ratings Direct. * Staff estimate based on data through January 16, 2008.
0
1
2
3
4
5
6
7
8General Obligation Percent
1994 1996 1998 2000 2002 2004 2006 2008
Municipal Bond Yields
Weekly
20-year
1-year
Jan. 17
Jan. 22
Source. Municipal Market Advisors and Bond Buyer.
0.7
0.8
0.9
1.0
General Obligation over Treasury Ratio
1994 1996 1998 2000 2002 2004 2006 2008
Municipal Bond Yield Ratio
Weekly
20-year Jan. 17
Source. Bond Buyer.

III-16
M2 Monetary Aggregate(Based on seasonally adjusted data)
Percent change (annual rate)1 Level(billions
2007 of dollars),
Aggregate and components 2006 2007 H1 Q3 Q4 Nov. Dec. Dec.
M2 4.9 5.9 6.7 4.7 5.3 5.4 5.9 7,447
Components2
Currency 3.5 2.0 2.6 1.6 1.2 -.6 -3.5 759Liquid deposits3 .8 4.5 6.5 2.7 2.0 2.5 1.9 4,489Small time deposits 18.5 4.1 4.1 2.1 6.1 4.8 3.7 1,217Retail money market funds 12.9 20.5 15.5 21.5 24.6 24.6 36.0 976
Memo:Institutional money market funds 15.6 38.3 22.7 38.1 53.4 41.7 23.8 1,861Monetary base 3.1 2.0 2.5 1.9 1.0 1.4 -3.2 823
1. For years, Q4 to Q4; for quarters and months, calculated from corresponding average levels.2. Nonbank traveler’s checks are not listed.3. Sum of demand deposits, other checkable deposits, and savings deposits.

III-17
$6 billion offering in early December.
1 Historically, financial guarantors insure about half of municipal bonds.
State and Local Government Finance Gross issuance of long-term municipal bonds was solid in December but has slowed in January. While broadly consistent with typical seasonal patterns, this recent slowdown may also reflect heightened concerns over the credit quality of financial guarantors.1 Issuance of short-term municipal bonds was moderate in both months, suggesting state and local governments are not experiencing substantial near-term funding pressures.
The credit quality of municipal bonds has deteriorated somewhat in recent months. After having spiked in the fourth quarter, the number of municipal bond downgrades by Standard & Poor’s was negligible in early January. Yields on municipal bonds have fallen roughly in line with those on comparable-maturity Treasuries since the December FOMC meeting. As a result, the ratio of municipal bond yields to Treasuries has remained near its recent peak. Fitch downgraded a major financial guarantor in January from AAA to AA, intensifying concerns that credit ratings on a substantial portion of municipal bonds outstanding might also be downgraded. Nonetheless, state and local government balance sheets have generally remained solid.
Money and Bank Credit M2 expanded moderately in December. Retail money funds advanced briskly, likely reflecting safe-haven flows, and growth in small time deposits was supported by some large thrifts that continued to offer unusually high rates on these deposits. In contrast, growth of liquid deposits remained slack, and currency contracted notably in December, reflecting the ongoing trend in overseas demand away from U.S. dollar banknotes toward those in euro and other currencies.
Commercial bank credit expanded strongly in December, supported by robust growth in business loans and in nonmortgage loans to households. C&I loans surged in December, with strength evident across different size categories of domestic banks and foreign institutions. Lending to businesses through commercial real estate loans stayed solid in December. In contrast, residential real estate loans were only up a little in December, even as revolving home equity loans expanded briskly. Consumer loans grew rapidly, possibly because of lower short-term interest rates. The strength in bank lending in December occurred despite the reported tightening of credit conditions: According to the January 2008 Senior Loan Officer Opinion Survey, domestic and foreign banks indicated

III-18
Commercial Bank Credit(Percent change, annual rate, except as noted; seasonally adjusted)
Type of credit 2006 H1 Q3 Q4 Nov. Dec. Level1
2007 2007 2007 2007 2007 Dec. 2007
Total 9.8 9.3 12.4 9.2 1.8 8.5 8,740
Loans2
Total 10.9 10.2 12.5 11.6 6.2 12.3 6,646 To businesses Commercial and industrial 16.5 10.1 24.2 29.8 13.4 21.2 1,414 Commercial real estate 13.7 13.8 3.9 7.6 7.9 7.2 1,576
To households Residential real estate 7.0 7.0 9.6 1.0 -7.6 2.9 1,875 Revolving home equity 1.4 1.9 6.5 12.2 11.7 13.1 482 Other 9.1 8.7 10.6 -2.7 -14.1 -.5 1,393 Consumer 5.9 6.5 10.5 7.1 16.0 17.8 802 Originated3 6.9 5.2 10.3 7.2 11.3 13.2 1,200 Other4 11.8 14.3 19.3 18.1 12.5 21.5 979
SecuritiesTotal 6.5 6.6 12.0 1.8 -11.8 -3.3 2,094 Treasury and agency 2.6 -4.9 6.5 -23.9 -22.3 -11.9 1,096 Other5 13.2 24.1 19.2 35.0 .1 6.3 998
Note. Yearly annual rates are Q4 to Q4; quarterly and monthly annual rates use corresponding average levels. Datahave been adjusted to remove the effects of mark-to-market accounting rules (FIN 39 and FAS 115), the consolidation ofcertain variable interest entities (FIN 46), the adoption of fair value accounting (FAS 159), and the effects of sizablethrift-to-bank and bank-to-thrift structure activity in October 2006, March 2007, and October 2007. Data also account forbreaks caused by reclassifications. 1. Billions of dollars. Pro rata averages of weekly (Wednesday) levels. 2. Excludes interbank loans. 3. Includes an estimate of outstanding loans securitized by commercial banks. 4. Includes security loans and loans to farmers, state and local governments, and all others not elsewhere classified.Also includes lease financing receivables. 5. Includes private mortgage-backed securities, securities of corporations, state and local governments, foreigngovernments, and any trading account assets that are not Treasury or agency securities, including revaluation gainson derivative contracts.

III-19
that they had tightened their standards and terms across a broad range of business and household loan categories over the past three months.


Appendix
III-A-1
1 Banks received the survey in early January, and their responses were due on January 17.
Senior Loan Officer Opinion Survey on Bank Lending Practices
The January 2008 Senior Loan Officer Opinion Survey on Bank Lending Practices addressed changes in the supply of, and demand for, bank loans to businesses and households over the past three months.1 Special questions in the survey queried banks about changes in terms on commercial real estate loans during 2007, expected changes in asset quality in 2008, and loss-mitigation strategies on residential mortgage loans. In addition, the survey included a new set of recurring questions regarding revolving home equity lines of credit. This appendix is based on responses from fifty-four domestic banks and twenty-three foreign banking institutions.
In the January survey, domestic and foreign institutions reported having tightened their lending standards and terms for a broad range of loan types over the past three months. Demand for bank loans reportedly had weakened, on net, for both businesses and households over the same period.
Business Lending
Questions on commercial and industrial (C&I) lending. In the January survey, one-third of domestic institutions—a larger net fraction than in the October survey—reported having tightened their lending standards on C&I loans both to small and to large and middle-market firms over the past three months. Significant net fractions of respondents also noted that they had tightened pricing terms on C&I loans to all types of firms, including raising the cost of credit lines and the premiums charged on riskier loans over the survey period. About 40 percent of domestic banks—a higher net fraction than in the October survey—reported increasing spreads of loan rates over their cost of funds over the previous three months. Smaller net fractions of domestic banks also indicated that they had tightened nonpricing terms on C&I loans to all types of firms.
Compared with domestic institutions, larger net fractions of U.S. branches and agencies of foreign banks reported having tightened lending standards and terms on C&I loans. About two-thirds of foreign banks—up from one-third in the October survey—noted that they had tightened their lending standards on C&I loans over the past three months, and large majorities also reported that they had tightened selected pricing terms for such loans. Indeed, about 85 percent of foreign banks—a higher net fraction than in the October survey—indicated that they had increased spreads of loan rates over their cost of funds over the past three months.
Large majorities of domestic and foreign institutions that reported tightening lending standards and terms on C&I loans over the past three months pointed to a less favorable or more uncertain economic outlook, a worsening of industry-specific problems, and a reduced tolerance for risk as

III-A-2
1990 1992 1994 1996 1998 2000 2002 2004 2006 2008-40
-20
0
20
40
60
80
Percent
Loans to large and medium-sized firmsLoans to small firms
Oct.survey
Net Percentage of Domestic Respondents Tightening Standards for C&I Loans
Measures of Supply and Demand for C&I Loans,by Size of Firm Seeking Loan
1990 1992 1994 1996 1998 2000 2002 2004 2006 2008-80
-60
-40
-20
0
20
40
60
80
Percent
Oct.survey
Net Percentage of Domestic Respondents Increasing Spreads of Loan Rates over Banks’ Costs of Funds
1990 1992 1994 1996 1998 2000 2002 2004 2006 2008-80
-60
-40
-20
0
20
40
60
Percent
Oct.survey
Net Percentage of Domestic Respondents Reporting Stronger Demand for C&I Loans

III-A-3
reasons for their more-restrictive lending policies. Smaller but significant fractions of domestic and foreign banks noted that a deterioration of their current or expected capital or liquidity positions had contributed to the tightening of lending standards and terms over the past three months.
On net, large domestic banks reported that demand for C&I loans from large and middle-market firms was about unchanged over the past three months, whereas about 40 percent of small domestic banks, on net, reportedly experienced weaker demand for C&I loans from these firms. About one-fifth of both large and small domestic banks, on net, also saw weaker demand for C&I loans from small firms. Finally about 40 percent of foreign institutions reported weaker demand, on net, for C&I loans over the past three months.
Nearly all domestic institutions that indicated a weakening of loan demand pointed to a decrease in customers’ needs to finance inventories and investment in plant and equipment. In addition, about three-fourths of domestic banks and all foreign respondents cited a decrease in customers’ needs for merger and acquisition financing as a reason for lower demand for C&I loans. Regarding future business, about 15 percent of domestic and 50 percent of foreign respondents, on net, reported that the number of inquiries from potential business borrowers had decreased over the previous three months.
Questions on commercial real estate lending. About 80 percent of domestic banks reported tightening their lending standards on commercial real estate loans over the past three months, a notable increase from the October survey. The net fraction of domestic banks reporting tighter lending standards on these loans was the highest since this question was introduced in 1990. About 55 percent of foreign banks—up from about 40 percent in the October survey—indicated that they had tightened their lending standards on such loans. Concerning loan demand, about 40 percent of domestic respondents and 50 percent of foreign respondents reported weaker demand for commercial real estate loans over the past three months.
As in past years, the January survey queried banks about changes in their lending terms on commercial real estate loans over the previous twelve months. The responses to these special questions indicated that considerable net fractions of banks had tightened terms on commercial real estate loans in 2007; by contrast, in last year’s survey banks reported that they had eased lending terms, on net, in 2006. In the latest survey, about half of domestic and foreign respondents noted that they had required higher debt service coverage ratios and lower loan-to-value ratios on commercial real estate loans in 2007. In addition, about 40 percent of domestic banks and 50 percent of foreign banks indicated that they had reduced the maximum loan sizes that they were willing to grant over the past twelve months. About 45 percent of domestic banks and 75 percent of foreign banks reported raising loan rate spreads over their cost of funds in 2007.

III-A-4
1990 1992 1994 1996 1998 2000 2002 2004 2006 2008 -40
-20
0
20
40
60
80
100
Percent
Net Percentage of Domestic Respondents Tightening Standards for Commercial Real Estate Loans
Oct.survey
Measures of Supply and Demand for Commercial Real Estate Loans
1990 1992 1994 1996 1998 2000 2002 2004 2006 2008-60
-40
-20
0
20
40
60
Percent
Oct.survey
Net Percentage of Domestic Respondents Reporting Stronger Demand for Commercial Real Estate Loans

III-A-5
A large number of domestic and foreign respondents pointed to a less favorable economic outlook and to a worsening of the conditions of, or the outlook for, commercial real estate in the markets where their banks operate as reasons for tightening terms on commercial real estate loans in 2007. In addition, a large fraction of domestic banks noted a reduced tolerance for risk, whereas foreign banks indicated that reduced liquidity of the securities collateralized by these types of loans was an important factor.
2 Fifty-one institutions reported that they originated prime residential mortgages. According to Call
Reports, these fifty-one banks accounted for about 80 percent of residential real estate loans on the books of all commercial banks as of September 30, 2007.
3 According to Call Reports, these thirty-nine institutions accounted for about 70 percent of residential real estate loans on the books of all commercial banks as of September 30, 2007.
4 According to Call Reports, these eight institutions accounted for about 45 percent of residential real estate loans on the books of all commercial banks as of September 30, 2007.
Lending to Households
Questions on residential real estate lending. In the January survey, significant numbers of domestic respondents reported that they had tightened their lending standards on prime, nontraditional, and subprime residential mortgages over the past three months; the remaining respondents noted that their lending standards had remained basically unchanged. About 55 percent of domestic respondents indicated that they had tightened their lending standards on prime mortgages, up from about 40 percent in the October survey.2 Of the thirty-nine banks that originated nontraditional residential mortgage loans, about 85 percent reported a tightening of their lending standards on such loans over the past three months, compared with 60 percent in the October survey.3 Finally, five of the eight banks that originated subprime mortgage loans noted that they had tightened their lending standards on such loans, a proportion similar to that in the October survey.4
About 60 percent of domestic respondents, on net, indicated that demand for prime and subprime residential mortgages had weakened over the past three months, and 70 percent of respondents, on net, noted weaker demand for nontraditional mortgage loans over the same period. The net fractions reporting weaker demand for each of the three types of mortgage loans increased relative to the October survey.
About 60 percent of domestic respondents indicated that they had tightened their lending standards for approving applications for revolving home equity lines of credit over the past three months. Regarding demand, about 40 percent of domestic banks, on net, reported that demand for revolving home equity lines of credit had weakened over the past three months.
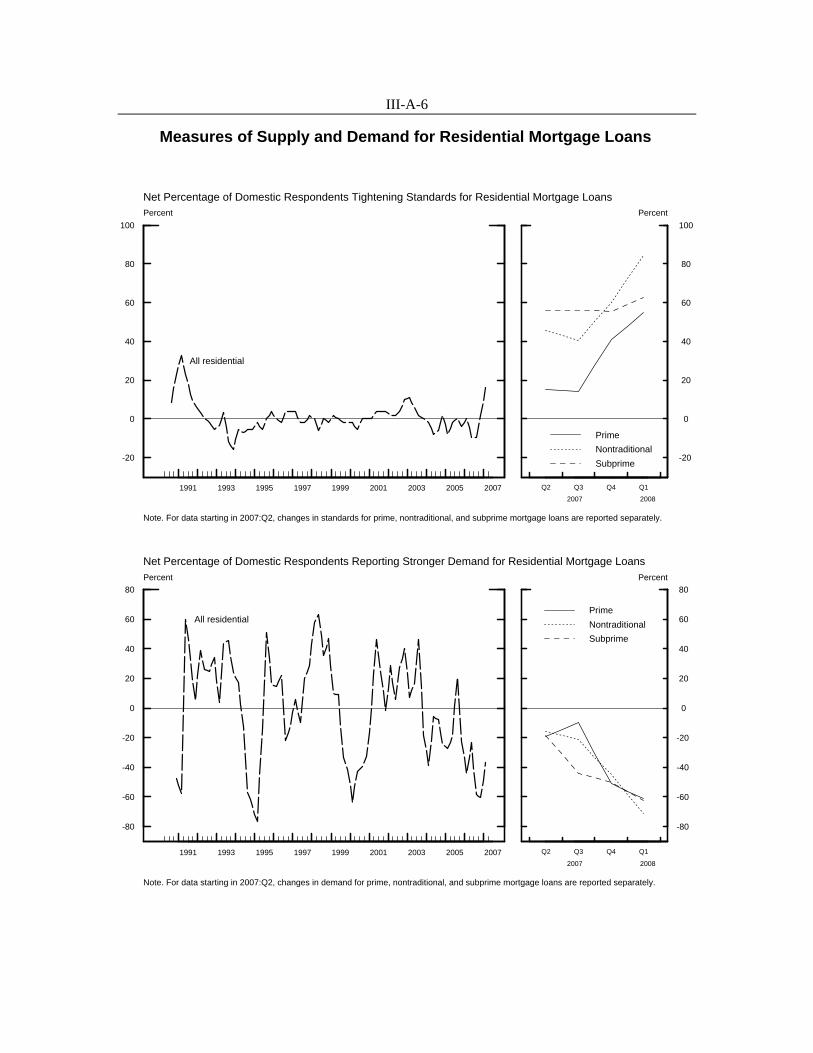
III-A-6
-20
0
20
40
60
80
100
1991 1993 1995 1997 1999 2001 2003 2005 2007
Percent
All residential
Net Percentage of Domestic Respondents Tightening Standards for Residential Mortgage Loans
Note. For data starting in 2007:Q2, changes in standards for prime, nontraditional, and subprime mortgage loans are reported separately.
Q2 Q3 Q4 Q1
2007 2008
-20
0
20
40
60
80
100
Percent
Prime
Nontraditional
Subprime
-80
-60
-40
-20
0
20
40
60
80
1991 1993 1995 1997 1999 2001 2003 2005 2007
Percent
All residential
Net Percentage of Domestic Respondents Reporting Stronger Demand for Residential Mortgage Loans
Note. For data starting in 2007:Q2, changes in demand for prime, nontraditional, and subprime mortgage loans are reported separately.
Q2 Q3 Q4 Q1
2007 2008
-80
-60
-40
-20
0
20
40
60
80Percent
Prime
Nontraditional
Subprime
Measures of Supply and Demand for Residential Mortgage Loans

III-A-7
1992 1994 1996 1998 2000 2002 2004 2006 2008-20
0
20
40
60
Percent
Credit card loansOther consumer loans
Net Percentage of Domestic Respondents Tightening Standards for Consumer Loans
Oct.survey
Measures of Supply and Demand for Consumer Loans
1992 1994 1996 1998 2000 2002 2004 2006 2008-30
-20
-10
0
10
20
30
40
Percent
Oct.survey
Net Percentage of Domestic Respondents Reporting Increased Willingness to Make Consumer Installment Loans
1992 1994 1996 1998 2000 2002 2004 2006 2008-60
-40
-20
0
20
40
60
Percent
Oct.survey
Net Percentage of Domestic Respondents Reporting Stronger Demand for Consumer Loans

III-A-8
Questions on consumer lending. About 10 percent of respondents—up from about 5 percent in the October survey—reported that they had tightened their lending standards on credit card loans over the past three months. About one-quarter of respondents noted that they had reduced the extent to which such loans were granted to customers who did not meet credit-scoring thresholds; smaller net fractions also indicated an increase in minimum required credit scores and a reduction of credit limits on credit card loans. About 15 percent of domestic banks—up from about 5 percent in the October survey—indicated a diminished willingness to make consumer installment loans relative to three months earlier. One-third of domestic banks—up from one-fourth in the October survey—reported that they had tightened their lending standards on consumer loans other than credit card loans. Significant net fractions of banks also noted that they had tightened lending terms and conditions on such loans. In particular, domestic banks increased minimum credit scores, reduced the extent to which such loans were granted to customers who did not meet credit-scoring thresholds, and widened spreads of loan rates over their cost of funds. Regarding loan demand, one-third of domestic institutions, on net, indicated that they had experienced weaker demand for consumer loans of all types.
Special Questions on the Outlook for Loan Quality in 2008
A set of special questions asked banks about their expectations for delinquencies and charge-offs on loans to businesses and households in 2008 under the assumption that economic activity progresses in line with consensus forecasts. On balance, the responses indicate that large majorities of domestic and foreign banks expect a deterioration in loan quality in 2008. Regarding loans to businesses, between about 75 percent and 85 percent of domestic and foreign banks expect a deterioration in the quality of their C&I and commercial real estate loan portfolios. In particular, about 15 percent of domestic and 20 percent of foreign respondents expect a substantial deterioration in the quality of their commercial real estate portfolio. Concerning residential real estate loans, between about 75 percent and 80 percent of domestic respondents expect the quality of their prime, nontraditional, and subprime residential mortgage loans, as well as of their revolving home equity loans, to deteriorate in 2008. Finally, about 70 percent of domestic respondents expect a deterioration of the quality of both credit card and other consumer loans.
Special Questions on Loss-Mitigation Strategies on Residential Mortgage Loans
A final set of special questions queried domestic respondents about strategies that they expect their banks to employ in order to mitigate a potential deterioration in the credit quality of their banks’ residential mortgage loan portfolio or of the mortgage loans that their banks service for others. More than 85 percent of respondents indicated that they expect loan-by-loan modifications based on individual borrowers’ circumstances to be at least a somewhat significant loss-mitigation strategy at their banks. More than 65 percent of respondents also anticipate steps—such as short sales or deed-in-lieu of foreclosures—in which borrowers lose possession of
III-A-9
the house to be at least somewhat significant loss-mitigation strategies at their banks. A large number of respondents also indicated that their loss-mitigation strategies will include refinancing of loans into other mortgage products at their banks or into Federal Housing Administration (FHA) products. Finally, about one-third of respondents expect streamlined loan modifications of the sort proposed by the Hope Now Alliance to be a significant loss-mitigating strategy for their banks.
Domestic respondents expect their banks to face several potential obstacles in undertaking these loss-mitigation strategies: Respondents anticipate difficulties in contacting borrowers, and they are concerned with borrowers’ reduced motivation to retain possession of their properties. To a lesser extent, respondents also anticipate difficulties arising from a shortage of qualified loss-mitigation specialists at their banks.
Last Page of Domestic Financial Developments

International Developments
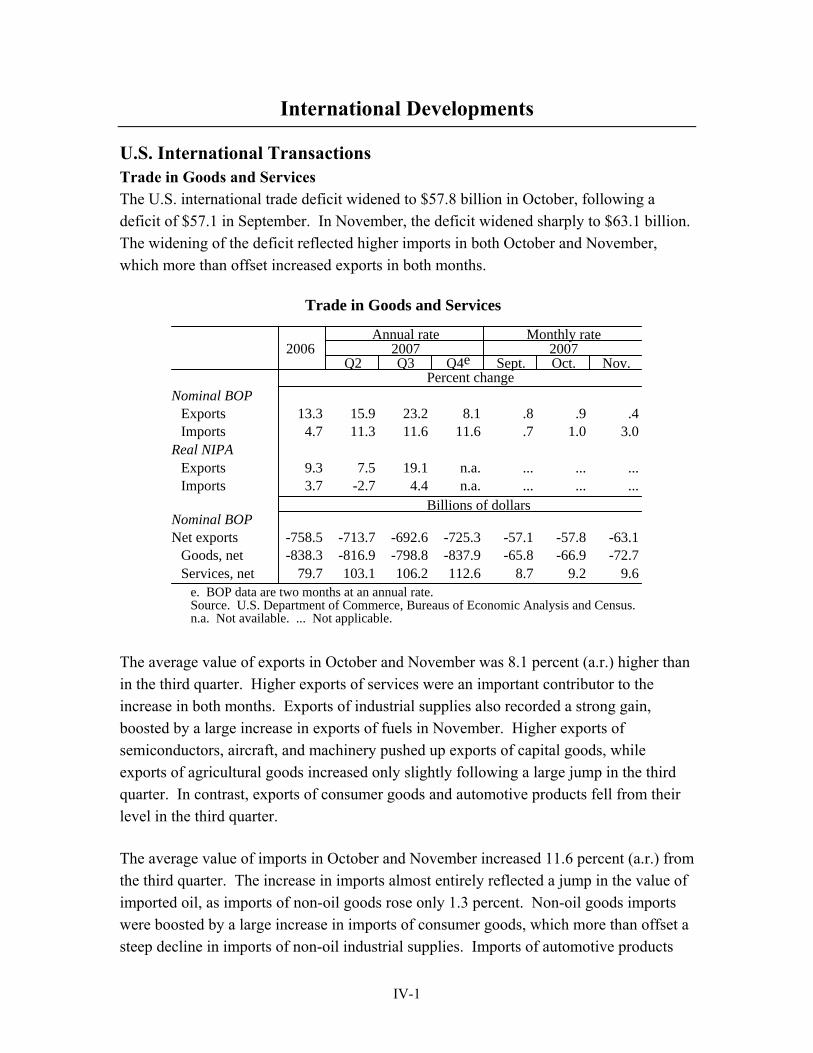
International Developments
IV-1
U.S. International Transactions Trade in Goods and Services The U.S. international trade deficit widened to $57.8 billion in October, following a deficit of $57.1 in September. In November, the deficit widened sharply to $63.1 billion. The widening of the deficit reflected higher imports in both October and November, which more than offset increased exports in both months.
Trade in Goods and Services
Annual rate Monthly rate2006 2007 2007
Q2 Q3 Q4e Sept. Oct. Nov.Percent change
Nominal BOPExports 13.3 15.9 23.2 8.1 .8 .9 .4Imports 4.7 11.3 11.6 11.6 .7 1.0 3.0
Real NIPAExports 9.3 7.5 19.1 n.a. ... ... ...Imports 3.7 -2.7 4.4 n.a. ... ... ...
Billions of dollarsNominal BOPNet exports -758.5 -713.7 -692.6 -725.3 -57.1 -57.8 -63.1
Goods, net -838.3 -816.9 -798.8 -837.9 -65.8 -66.9 -72.7Services, net 79.7 103.1 106.2 112.6 8.7 9.2 9.6
e. BOP data are two months at an annual rate.Source. U.S. Department of Commerce, Bureaus of Economic Analysis and Census.n.a. Not available. ... Not applicable.
The average value of exports in October and November was 8.1 percent (a.r.) higher than in the third quarter. Higher exports of services were an important contributor to the increase in both months. Exports of industrial supplies also recorded a strong gain, boosted by a large increase in exports of fuels in November. Higher exports of semiconductors, aircraft, and machinery pushed up exports of capital goods, while exports of agricultural goods increased only slightly following a large jump in the third quarter. In contrast, exports of consumer goods and automotive products fell from their level in the third quarter.
The average value of imports in October and November increased 11.6 percent (a.r.) from the third quarter. The increase in imports almost entirely reflected a jump in the value of imported oil, as imports of non-oil goods rose only 1.3 percent. Non-oil goods imports were boosted by a large increase in imports of consumer goods, which more than offset a steep decline in imports of non-oil industrial supplies. Imports of automotive products

IV-2
U.S. International Trade in Goods and Services
2000 2002 2004 2006 2008-900
-800
-700
-600
-500
-400
-300
-200
-100
0
Nov
(Quarterly)
Trade BalanceBillions of dollars, a.r.
2000 2002 2004 2006 2008-2.0
-1.5
-1.0
-0.5
0.0
0.5
1.0
1.5
2.0
Contribution of Net Exports to Real GDP GrowthPercentage points, a.r.
2000 2002 2004 2006 20080
50
100
150
200
250
300
350
400
450
Industrialsupplies
Consumergoods
Aircraft
Capital goodsex. aircraft
Selected ExportsBillions of dollars, a.r.
2000 2002 2004 2006 20080
50
100
150
200
250
300
350
400
450
500
Consumergoods
Industrialsupplies
Oil
Capital goods
Selected ImportsBillions of dollars, a.r.

IV-3
U.S. Exports and Imports of Goods and Services(Billions of dollars, a.r., BOP basis)
Levels Change1
2007 2007 2007 2007Q3 Q4e Oct. Nov. Q3 Q4e Oct. Nov.
Exports of G&S 1670.9 1703.9 1700.1 1707.7 84.8 33.0 15.1 7.6
Goods exports 1191.8 1210.8 1210.2 1211.4 74.4 19.0 5.9 1.2Gold 14.3 11.8 13.0 10.6 -2.2 -2.5 -.6 -2.4Other goods 1177.5 1199.0 1197.2 1200.9 76.6 21.5 6.5 3.6
Capital goods 458.9 464.8 470.2 459.3 27.7 5.9 15.4 -10.8Aircraft & parts 93.0 95.5 100.6 90.5 13.5 2.5 12.0 -10.1Computers & accessories 43.4 41.8 41.3 42.4 1.5 -1.5 -1.8 1.1Semiconductors 48.5 51.1 51.3 50.9 -1.3 2.6 .8 -.4Other capital goods 274.0 276.3 277.0 275.6 14.0 2.3 4.4 -1.4
Automotive 128.7 128.3 125.5 131.1 10.7 -.4 .0 5.6Ind. supplies (ex. ag., gold) 294.2 307.6 304.6 310.6 13.5 13.4 5.8 6.0Consumer goods 151.1 148.9 149.6 148.2 7.6 -2.2 -4.8 -1.4Agricultural 103.0 104.0 102.3 105.8 15.9 1.0 -14.8 3.5All other goods 41.6 45.5 45.1 45.9 1.3 4.0 3.2 .7
Services exports 479.2 493.1 489.9 496.3 10.4 14.0 9.2 6.4
Imports of G&S 2363.6 2429.2 2393.3 2465.1 63.7 65.7 22.9 71.8
Goods imports 1990.6 2048.7 2013.5 2083.9 56.4 58.1 19.0 70.4Oil 327.5 384.4 355.5 413.3 15.0 56.9 27.5 57.8Gold 10.7 6.7 8.3 5.1 .9 -4.0 -2.4 -3.2Other goods 1652.4 1657.6 1649.7 1665.5 40.5 5.2 -6.0 15.8
Capital goods 451.2 453.2 452.2 454.2 13.3 2.1 -6.2 1.9Aircraft & parts 35.1 36.5 37.8 35.1 .7 1.4 1.6 -2.7Computers & accessories 101.7 101.4 101.7 101.1 -1.1 -.2 -4.7 -.6Semiconductors 26.6 27.1 27.1 27.2 .5 .6 .4 .0Other capital goods 287.9 288.2 285.5 290.8 13.1 .3 -3.5 5.3
Automotive 268.2 270.6 269.8 271.4 15.9 2.4 1.8 1.6Ind. supplies (ex. oil, gold) 305.3 292.5 293.4 291.7 -.1 -12.8 -6.2 -1.7Consumer goods 472.7 484.4 479.6 489.1 3.9 11.6 5.6 9.6Foods, feeds, bev. 83.7 83.3 82.3 84.4 3.4 -.4 -1.6 2.1All other goods 71.3 73.6 72.5 74.7 4.2 2.3 .5 2.3
Services imports 373.0 380.6 379.8 381.3 7.4 7.6 3.9 1.4
Memo:Oil quantity (mb/d) 12.75 13.40 12.99 13.80 -.66 .64 .33 .81Oil import price ($/bbl) 70.31 78.46 74.93 81.99 6.50 8.14 4.01 7.06
1. Change from previous quarter or month. e. Average of two months.Source. U.S. Department of Commerce, Bureaus of Economic Analysis and Census.

IV-4
and capital goods recorded modest increases, with the increase in capital goods primarily reflecting a jump in imports of telecommunications equipment. Imports of services grew strongly.
Prices of Internationally Traded Goods Non-oil imports. The average level of core import prices in the fourth quarter was 4 percent (a.r.) above the third-quarter average, as prices increased in all major sub-categories. Prices for material-intensive goods were up nearly 8 percent in the fourth quarter. After rising sharply in October and November, prices for imported nonfuel industrial supplies rose at a slower pace in December as metal prices fell. In the fourth quarter, prices for finished goods increased 2¼ percent. Within finished goods, prices for capital goods excluding computers and semiconductors and automotive products both increased at a rate of 3 percent, whereas prices for consumer goods rose only 1¾ percent. Outside of core goods, prices for imported computers fell 2½ percent (a.r.), whereas semiconductors prices rose 1 percent in the fourth quarter.
Oil. The BLS price index of imported oil fell 0.6 percent in December, after a 13 percent increase in November. In contrast, the spot price of West Texas Intermediate (WTI) crude oil surged in December and broke the $100 per barrel mark in early January. Since then, the spot price of WTI has fallen back amid growing concerns about the strength of economic activity. As of the close of trading on January 22, the spot price of WTI stood at $89.86 per barrel. In contrast to the volatility in near-term prices, the futures price for delivery at the end of 2016 has been much steadier and stands near $88 per barrel, little changed from the time of the December Greenbook.
Exports. The average level of core export prices in the fourth quarter was 9¼ percent (a.r.) above the third-quarter average, as prices of material-intensive goods soared 18 percent and prices of finished goods were up 2½ percent. The large increase in material-intensive goods reflected a 40 percent increase in prices for agricultural exports combined with a 12 percent increase in prices for nonagricultural industrial supplies. Prices for agricultural exports rose briskly in all three months of the quarter. In contrast, prices for nonagricultural industrial supplies rose at a much slower pace in December than in November. Within finished goods, the category with the largest fourth-quarter increase was capital goods excluding computers and semiconductors, which rose almost 3 percent. Outside of core goods, prices for exported computers declined 4¼ percent (a.r.) in the fourth quarter, whereas prices for exported semiconductors rose 1½ percent.

IV-5
Prices of U.S. Imports and Exports
2000 2002 2004 2006 2008-6
-4
-2
0
2
4
6
8
Non-oil goods
Core goods
Merchandise Imports12-month percent change
2000 2002 2004 2006 2008-15
-10
-5
0
5
10
15
20
Material-intensivegoods
Finished goods
Categories of Core Imports12-month percent change
2000 2002 2004 2006 20085
15
25
35
45
55
65
75
85
95
105
Spot WTI
Import unit value
OilDollars per barrel
2000 2002 2004 2006 20080
50
100
150
200
250
300
0
5
10
15
20
25
30
Spot Henry Hub(right scale)
Import priceindex
(left scale)
Natural Gas 2000=100 Dollars per million BTU
2000 2002 2004 2006 2008-6
-4
-2
0
2
4
6
8
Total goods
Core goods
Merchandise Exports12-month percent change
2000 2002 2004 2006 2008-15
-10
-5
0
5
10
15
20
Material-intensivegoods
Finished goods
Categories of Core Exports12-month percent change

IV-6
----------------------- BLS prices ---------------------
--------------------- NIPA prices ---------------------
Prices of U.S. Imports and Exports(Percentage change from previous period)
Annual rate Monthly rate2007 2007
Q2 Q3 Q4 Oct. Nov. Dec.
Merchandise imports 15.2 9.7 16.6 1.4 3.3 .0Oil 89.0 48.1 77.4 5.0 12.7 -.6Non-oil 3.8 1.8 4.4 .6 .7 .3
Core goods1 4.6 3.1 3.9 .5 .5 .3
Finished goods 1.4 2.2 2.2 .2 .3 .2Cap. goods ex. comp. & semi. 3.1 3.9 2.8 .3 .3 .3Automotive products .9 1.5 3.0 .3 .3 .2Consumer goods .4 2.4 1.7 .0 .3 .2
Material-intensive goods 12.3 5.3 7.7 1.2 .9 .5Foods, feeds, beverages 8.4 10.7 9.7 1.1 -.1 .6Industrial supplies ex. fuels 13.3 4.6 7.3 1.2 1.2 .5
Computers -7.7 -.2 -2.4 -.5 -.2 -.3Semiconductors -16.2 4.9 1.1 -.5 1.0 -.8Natural gas 13.0 -51.0 81.8 11.1 16.0 2.8
Merchandise exports 6.1 2.8 7.5 .8 .9 .4
Core goods2 7.3 3.1 9.2 1.0 1.1 .5
Finished goods 2.4 2.0 2.4 .3 .2 .2Cap. goods ex. comp. & semi. 2.7 2.4 2.9 .4 .3 .2Automotive products .9 .8 1.3 .2 .0 .2Consumer goods 3.2 2.2 2.3 .3 .4 .1
Material-intensive goods 13.7 4.5 17.9 1.8 2.0 .9Agricultural products 7.0 24.0 41.1 3.8 1.4 2.7Industrial supples ex. ag. 16.4 -.3 11.7 1.1 2.4 .3
Computers -11.1 -5.3 -4.3 -.1 -.7 -.4Semiconductors 4.2 .6 1.4 -.4 .9 .4
Chain price indexImports of goods & services 11.9 7.5 n.a. ... ... ...
Non-oil merchandise 2.7 1.4 n.a. ... ... ...Core goods1 3.6 3.1 n.a. ... ... ...
Exports of goods & services 5.3 3.8 n.a. ... ... ...Total merchandise 5.1 3.2 n.a. ... ... ...
Core goods2 7.4 4.5 n.a. ... ... ...
1. Excludes computers, semiconductors, and natural gas.2. Excludes computers and semiconductors.n.a. Not available. ... Not applicable.

IV-7
U.S. Current Account In December, the U.S. current account deficit was reported at $714 billion (a.r.) for the third quarter of 2007, $42 billion narrower than in the second quarter (revised). Most of this narrowing was the result of an increase in net investment income which remains large and positive in spite of the substantial negative net international investment position of the United States; direct investment and “other” private income receipts (portfolio interest and dividend payments) both moved higher. In addition, the deficit on goods and services narrowed by $21 billion as widespread increases in goods exports outpaced increases in imports. There was only a slight increase in the net surplus on services. Partially offsetting these improvements was an increase in net unilateral transfers to foreigners, primarily increases in U.S. Government grants and private remittances and other transfers.
U.S. Current Account (Billions of dollars, seasonally adjusted annual rate)
Period Goods and services,
net
Investment income,
net
Other income and
transfers, net
Current account balance
Annual 2005 -714.4 54.5 -94.9 -754.8 2006 -758.5 43.2 -96.1 -811.5 Quarterly
2006:Q4 -707.7 45.3 -89.4 -751.8 2007:Q1 -710.3 36.2 -114.3 -788.4
Q2 -713.7 57.4 -99.4 -755.7 Q3 -692.6 88.6 -109.8 -713.8
Change Q4-Q3 89.5 15.3 12.7 117.6 Q1-Q4 -2.6 -9.1 -24.9 -36.6 Q2-Q1 -3.4 21.2 15.0 32.7 Q3-Q2 21.1 31.2 -10.5 41.9 Source: U.S. Department of Commerce, Bureau of Economic Analysis.
IV-8
U.S. International Financial Transactions The financial flows associated with the current account are presented in the Summary of U.S. International Transactions table. The impact of the recent financial market turmoil on U.S. financial flows is apparent in the recently-released balance of payments data for the third quarter of 2007. Recorded net private financial inflows moved down to $56 billion. There was also an apparent ‘flight-to-quality’ in private foreign demand for U.S. securities, as net purchases of U.S. Treasuries picked up, while on net private foreigners sold corporate and agency debt and stocks. Measured official inflows plummeted to $37 billion, the smallest recorded quarterly inflow since early 2005.
In sum, third-quarter recorded net financial inflows were significantly smaller than the recorded current account. The resulting statistical discrepancy totalled $86 billion for the quarter and $138 billion for the first three quarters of 2007. This positive statistical discrepancy indicates some combination of under-recorded net financial inflows or over-recorded net imports of goods and services and other transactions measured in the current account balance.
U.S. direct investment abroad in the third quarter (line 6) weakened as the pace of new investment by U.S. corporations in their foreign affiliates fell sharply. In contrast, foreign direct investment flows into the United States (line 7) surged to a record level on increased investment of new capital and continued strength in reinvested earnings.
One notable impact of the recent financial turmoil was the sharp contraction in global demand for, and hence issuance of, asset-backed commercial paper. As a result, U.S. nonbank entities that had issued commercial paper in the United States to fund their foreign parents’ operations were forced to sharply reduce lending to foreign affiliates. This reduction in U.S. claims on foreigners implied sizable net nonbank financial inflows in the third quarter (included in line 10).
Turning to recent monthly data, in November net flows into U.S. securities by foreign private investors (line 4) were at the pace seen prior to the turmoil (top-left panel of the chart on Private Security Flows). There was continued strength in foreign demand for relatively safe assets. Net foreign purchases of U.S. Treasuries (line 4a) fell slightly but remained strong, totaling $25 billion, and purchases of agency debt (line 4b) picked up slightly to $5 billion. In contrast, foreign demand for corporate and municipal debt (line 4c) remained extremely weak at $8 billion. This weak demand coincided with unusually low issuance of U.S. corporate bonds in recent months, as the rate of new debt issuance

IV-9
fell to 2002 levels. Net foreign purchases of U.S. stock (line 4d) fell to $7 billion from October’s elevated pace. Net inflows from foreign official investors rose to $67 billion in November (line 1), a record monthly pace (top-left panel of the chart on Foreign Official Financial Flows).
. Partial and confidential data on custody accounts at FRBNY point to
continued strong inflows in December and January. Note that recent high profile investments by sovereign wealth funds into U.S. financial firms are not yet apparent in these data and will be captured with other December securities transactions and reported in the upcoming months. Following on weak readings in October, there was a further sharp decline in U.S. demand for foreign securities (line 5) in November, with the balance shifting to net sales of $19 billion. Demand was particularly weak for European and Japanese stocks and Asian debt. Net sales have been fairly rare in recent years (bottom-left panel of the chart on Private Security Flows) and in part reflect lower issuance of dollar-denominated foreign debt. Flows through the banking sector (line 3) remained volatile, turning from a modest inflow in October to a modest outflow in November.

IV-10
Summary of U.S. International Transactions(Billions of dollars, not seasonally adjusted except as noted)
2005 2006 2006 2007Q4 Q1 Q2 Q3 Oct. Nov.
Official financial flows 272.0 443.5 85.7 149.5 71.8 37.1 41.0 66.7 1. Change in foreign official assets in the U.S. (increase, +) 257.9 441.2 84.3 149.6 71.7 37.1 41.1 66.8 a. G-10 countries + ECB 12.8 21.4 10.0 9.1 6.2 10.1 11.2 3.7 b. OPEC 14.0 45.2 -6.8 11.2 0.4 2.8 9.1 -3.7 c. All other countries 231.1 374.5 81.1 125.3 69.1 24.3 20.8 66.8
2. Change in U.S. official reserve assets (decrease, +) 14.1 2.4 1.4 -0.1 0.0 -0.1 -0.0 -0.1
Private financial flows 505.3 389.7 139.5 32.4 81.0 56.3 ... ...Banks 3. Change in net foreign positions of banking offices in the U.S. 1 15.4 142.3 39.2 -12.8 9.0 -37.6 -37.3 24.4
Securities 2
4. Foreign net purchases (+) of U.S. securities 573.9 541.6 149.0 175.8 247.7 8.2 89.4 44.2 a. Treasury securities 133.7 -35.0 22.5 46.3 0.5 50.8 46.7 24.9 b. Agency bonds 37.0 14.9 -13.8 -32.0 29.0 -16.2 0.0 4.8 c. Corporate and municipal bonds 311.2 412.9 111.4 117.2 111.6 -8.2 9.7 7.8 d. Corporate stocks 3 92.0 148.9 28.9 44.2 106.6 -18.2 33.0 6.5
5. U.S. net acquisitions (-) of foreign securities -197.0 -290.4 -118.4 -83.7 -68.7 -99.2 -5.8 18.9 a. Bonds -53.1 -152.5 -53.8 -39.4 -41.5 -42.6 -9.7 10.3 b. Stock purchases -139.9 -119.1 -52.2 -40.1 -27.2 -52.2 4.0 8.6 c. Stock swaps 3 -4.0 -18.8 -12.4 -4.2 0.0 -4.5 0.0 0.0
Other flows (quarterly data, s.a.) 6. U.S. direct investment (-) abroad 7.7 -235.4 -66.1 -81.4 -78.0 -56.3 ... ... 7. Foreign direct investment in the U.S. 109.0 180.6 45.6 11.9 46.6 81.2 ... ... 8. Net derivatives (inflow, +) n.a. 28.8 -1.1 15.4 0.2 8.6 ... ... 9. Foreign acquisitions of U.S. currency 19.0 12.6 8.4 -1.6 3.3 4.7 ... ... 10. Other (inflow, +) 4 -22.6 9.5 83.0 8.9 -79.1 146.7 ... ...
U.S. current account balance (s.a.) -754.8 -811.5 -187.9 -197.1 -188.9 -178.5 ... ...Capital account balance (s.a.) 5 -4.1 -3.9 -0.6 -0.6 -0.6 -0.6 ... ...Statistical discrepancy (s.a.) -18.5 -17.8 -36.6 15.7 36.7 85.6 ... ...
Note. Data in lines 1 through 5 differ in timing and coverage from the balance of payments data published by theDepartment of Commerce. Details may not sum to totals because of rounding. 1. Changes in dollar-denominated positions of all depository institutions and bank holding companies plus certaintransactions between broker-dealers and unaffiliated foreigners (particularly borrowing and lending under repurchaseagreements). Includes changes in custody liabilities other than U.S. Treasury bills. 2. Includes commissions on securities transactions and therefore does not match exactly the data on U.S. internationaltransactions published by the Department of Commerce. 3. Includes (4d) or represents (5c) stocks acquired through non-market means such as mergers and reincorporations. 4. Transactions by nonbanking concerns and other banking and official transactions not shown elsewhere plus amountsresulting from adjustments made by the Department of Commerce and revisions in lines 1 through 5 since publication of thequarterly data in the Survey of Current Business. 5. Consists of transactions in nonproduced nonfinancial assets and capital transfers. ... Not applicable.

IV-11
2004 2006-20
0
20
40
60
80
100
120
140
160Total
6-month moving average
2004 2006-60
-40
-20
0
20
40
60
80
Foreign Net Purchases (+) of U.S. SecuritiesTreasury Securities
($ Billions, monthly, not seasonally adjusted)Private Securities Flows Through November 2007
2004 2006-60
-40
-20
0
20
40
60
80Agency Bonds
2004 2006-60
-40
-20
0
20
40
60
80Corporate and Municipal Bonds
2004 2006-60
-40
-20
0
20
40
60
80Corporate Stocks
2004 2006-60
-40
-20
0
20
40Total
2004 2006-60
-40
-20
0
20
40Bonds
U.S. Net Acquisitions (-) of Foreign Securities
2004 2006-60
-40
-20
0
20
40Stock Purchases & Swaps

IV-12
2003 2004 2005 2006 2007-30
-20
-10
0
10
20
30
40
50
60
70
($ Billions, monthly, not seasonally adjusted)Foreign Official Financial Flows Through November 2007 (increase, +)
6-month moving average
Total
2003 2004 2005 2006 2007-30
-20
-10
0
10
20
30
40
50
60
70
G-10 + ECB
2003 2004 2005 2006 2007-30
-20
-10
0
10
20
30
40
50
60
70
OPEC
2003 2004 2005 2006 2007-30
-20
-10
0
10
20
30
40
50
60
70
All other countries

IV-13
Foreign Financial Markets Conditions in European interbank money markets improved substantially over the period, although concerns about slower U.S. growth and potential spillovers to foreign economies weighed on equity markets. Spreads between 3-month interbank offer rates and overnight index swaps (OIS), an indicator of credit concerns in the term-money market, declined 47 and 77 basis points in euro and sterling, respectively, down to their November levels. The announcement of coordinated central bank measures on December 12, including the Federal Reserve’s Term Auction Facility and swap lines with the European Central Bank (ECB) and the Swiss National Bank (SNB), appeared to contribute to these declines. The ECB and the SNB auctioned off the dollars obtained in swap arrangements with the Federal Reserve. The ECB auctioned a total of $20 billion at the marginal rates and maturities of the first two TAF auctions on December 17 and December 20, and re-auctioned $10 billion on January 15 at the marginal rate and maturity of the third TAF auctions. The SNB auctioned $4 billion of 28-day funds on December 17 at a weighted average rate of 4.79 percent, and again on January 14 at a rate of 3.91 percent. The bid-to-cover ratios were 2.2, 1.4, and 1.48 for the ECB auctions, lower than the 4.2 and 2.73 recorded for the SNB’s auctions. The volume of bids in the ECB’s auction was likely dampened by the 17 percent haircut on collateral. In the FX swap market, bid-ask spreads have fallen and trading volumes have increased. The amount of outstanding European asset-backed commercial paper (ABCP) declined in December, but rose sharply in early January. Despite these improvements, global equity prices have fallen sharply since mid- December, amid increasing concerns about further financial distress and spillovers from slower U.S growth. Major indexes in Europe and Japan dropped on balance 15 to 20 percent. Banking sector share prices often led the declines amid concerns about the balance-sheet impact of the sub-prime crisis. Lower-than-expected earning reports by JP Morgan and Citigroup, among others, contributed to the sharp declines in recent days. Several sovereign wealth funds announced that they would inject capital into U.S. and foreign banks over the period: Abu Dhabi Investment Authority: $7.5 billion to Citigroup, Singapore Government Investment Corporation: $9.7 billion to UBS, China Investment Corporation: $5 billion to Morgan Stanley, Temasek Holdings (Singapore): $4.4 billion to Merrill Lynch. Implied volatilities on the major equity indexes, after decreasing toward year end, rose in January. Ten-year European, Canadian, and Japanese nominal sovereign bond yields fell 23 to 38 basis points on net, as prospects for monetary easing increased and investors scaled back riskier positions.

IV-14
The broad trade-weighted index of the dollar is little changed on balance since mid-December, as the dollar appreciated 4.6 and 1.8 percent against sterling and the Canadian dollar, respectively, but depreciated 5.9 percent vis-à-vis the yen. Concerns about slower economic growth in Canada and the United Kingdom contributed to the weakness of the Canadian dollar and sterling, whereas the strengthening of the yen appeared to be driven in part by the unwinding of carry-trade positions. On January 22, the Bank of Canada cut the target for its policy rate 25 basis points, citing lower Canadian inflation and a weaker outlook for the U.S. economy.
The dollar appreciated 1.5 and 3.7 percent against the Mexican peso and Brazilian real, respectively. Most Latin American equity indexes dropped 6 to 17 percent. EMBI+ spreads increased 50 and 67 basis points for Mexico and Brazil. Asian equity indexes also declined substantially. The dollar depreciated about 1.9 percent against the Chinese renminbi, but appreciated 2.5 percent vis-à-vis the Thai baht. The Bank of Thailand announced on December 17 that it would further relax capital controls imposed in December 2006 to allow greater foreign currency holdings and to encourage capital outflows. The People's Bank of China raised the required reserve ratio for banks and its benchmark interest rate, together with the one-year lending and deposit rates, in a series of tightening steps to contain inflation and prevent the economy from overheating.
We received no reports of intervention purchases or sales of dollars from the central banks of industrial countries over the intermeeting period. The Desk did not intervene during the period for the accounts of the System or the Treasury.

IV-15
Exchange Value of the Dollar and Stock Market Indexes
2004 2005 2006 200780
90
100
110
120Major Currencies IndexEuroYen
Exchange Value of the Dollar Weekly January 5, 2004 = 100
92
96
100
104
108
Sep. Oct. Nov. Dec. Jan.
FOMC Daily Dec. 11, 2007 = 100
2004 2005 2006 200780
100
120
140
160
180DJ Euro StoxxTOPIXS&P 500
Stock Market Indexes Weekly January 5, 2004 = 100
75
80
85
90
95
100
105
110
Sep. Oct. Nov. Dec. Jan.
FOMC Daily Dec. 11, 2007 = 100
* Positive percent change denotes appreciation of U.S. dollar.
Percent change sinceLatest December FOMC
Exchange rates*Euro ($/euro) 1.4535 1.1Yen (¥/$) 105.2 -5.9Sterling ($/£) 1.9485 4.6Canadian dollar (C$/$) 1.0284 1.8
Nominal dollar indexes*Broad index 99.1 0.1Major currencies index 73.6 0.2OITP index 126.7 0.0
Stock market indexesDJ Euro Stoxx 339.5 -19.5TOPIX 1249.9 -20.2FTSE 100 5558.6 -15.0S&P 500 1310.4 -13.6
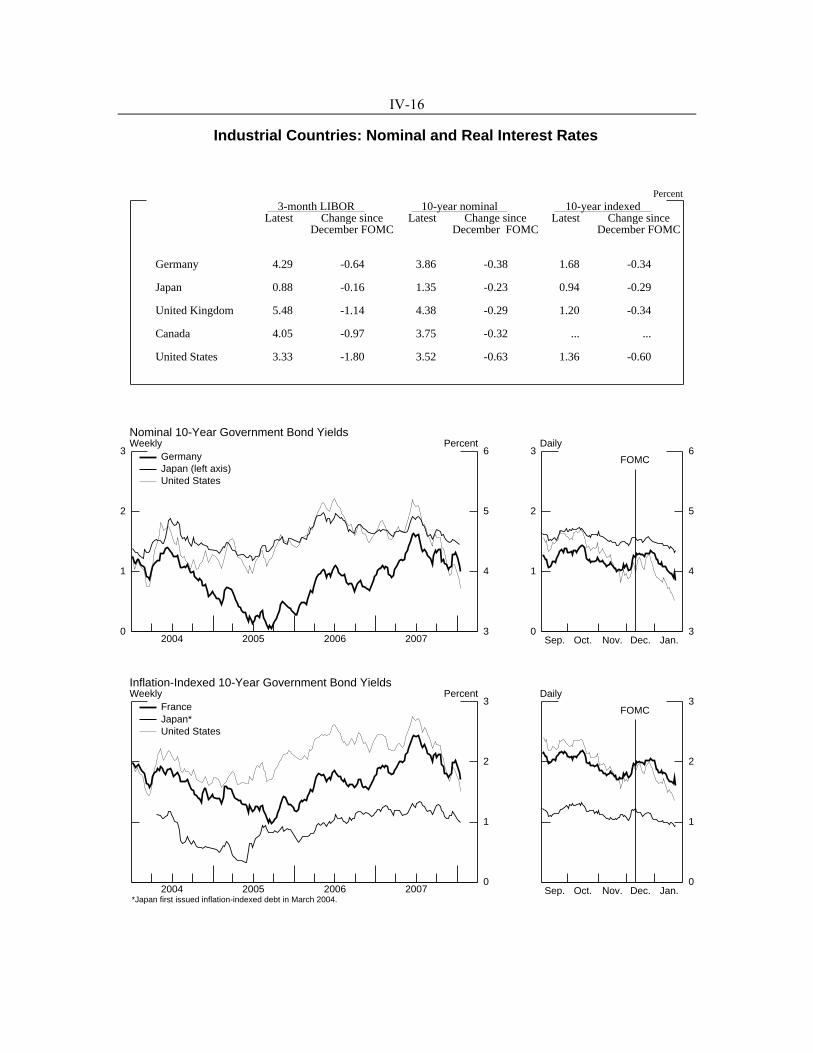
IV-16
Industrial Countries: Nominal and Real Interest Rates
2004 2005 2006 20070
1
2
3
3
4
5
6GermanyJapan (left axis)United States
Nominal 10-Year Government Bond Yields Weekly Percent
0
1
2
3
3
4
5
6
Sep. Oct. Nov. Dec. Jan.
FOMC
Daily
2004 2005 2006 20070
1
2
3
*Japan first issued inflation-indexed debt in March 2004.
FranceJapan*United States
Inflation-Indexed 10-Year Government Bond Yields Weekly Percent
0
1
2
3
Sep. Oct. Nov. Dec. Jan.
FOMC
Daily
Percent3-month LIBOR 10-year nominal 10-year indexed
Latest Change since Latest Change since Latest Change sinceDecember FOMC December FOMC December FOMC
Germany 4.29 -0.64 3.86 -0.38 1.68 -0.34
Japan 0.88 -0.16 1.35 -0.23 0.94 -0.29
United Kingdom 5.48 -1.14 4.38 -0.29 1.20 -0.34
Canada 4.05 -0.97 3.75 -0.32 ... ...
United States 3.33 -1.80 3.52 -0.63 1.36 -0.60

IV-17
Measures of Market Volatility
2004 2005 2006 20074
6
8
10
12
14
*Derived from at-the-money options.
1-month3-month
Dollar-Euro Options-Implied Volatility* Weekly Percent
4
5
6
7
8
9
10
11
Sep. Oct. Nov. Dec. Jan.
FOMC Daily
2004 2005 2006 20075
7
9
11
13
15
*Derived from at-the-money options.
1-month3-month
Yen-Dollar Options-Implied Volatility* Weekly Percent
4
8
12
16
20
Sep. Oct. Nov. Dec. Jan.
FOMC Daily
2004 2005 2006 20070
10
20
30
40
*Annualized standard deviation of 60-day window of daily returns.
DJ Euro StoxxTOPIXS&P 500
Realized Stock Market Volatility* Weekly Percent
5
10
15
20
25
30
Sep. Oct. Nov. Dec. Jan.
FOMC Daily
2004 2005 2006 20070
5
10
15
*Annualized standard deviation of 60-day window of daily returns.
GermanyJapanU.S.
Realized 10-Year Bond Volatility* Weekly Percent
234567891011
Aug. Sep. Oct. Nov. Dec. Jan.
FOMC Daily
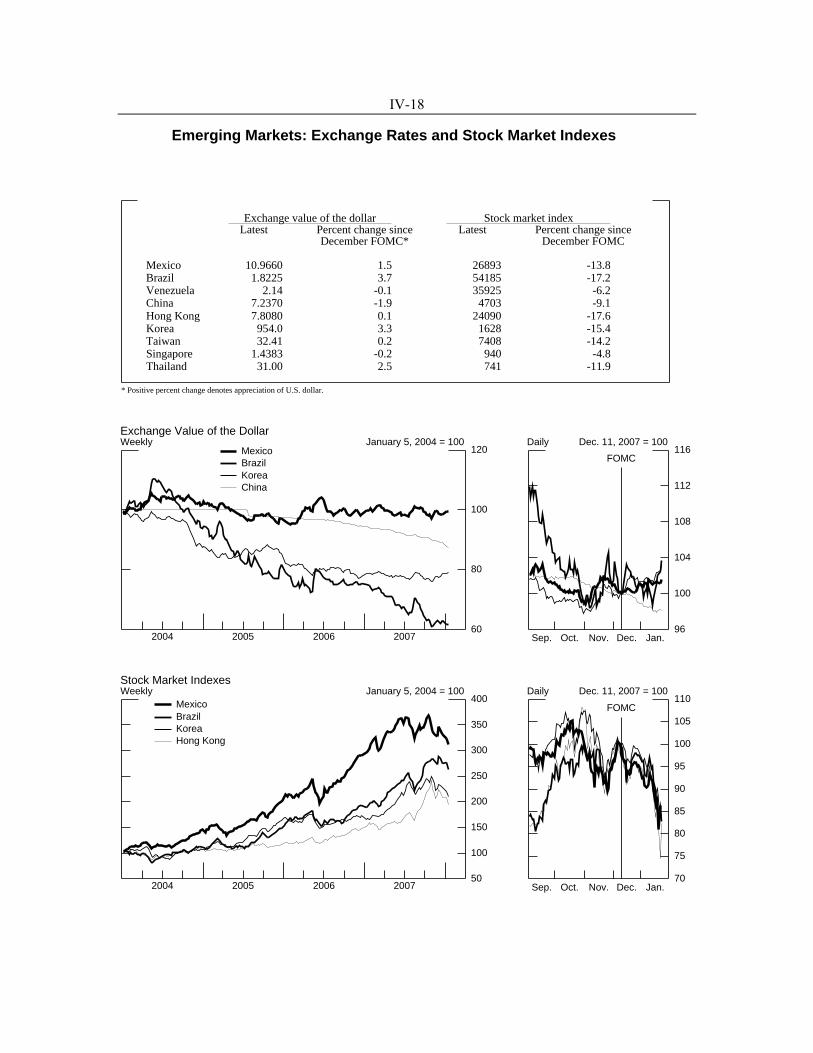
IV-18
Emerging Markets: Exchange Rates and Stock Market Indexes
2004 2005 2006 200760
80
100
120MexicoBrazilKoreaChina
Exchange Value of the Dollar Weekly January 5, 2004 = 100
96
100
104
108
112
116
Sep. Oct. Nov. Dec. Jan.
FOMC
Daily Dec. 11, 2007 = 100
2004 2005 2006 200750
100
150
200
250
300
350
400MexicoBrazilKoreaHong Kong
Stock Market Indexes Weekly January 5, 2004 = 100
70
75
80
85
90
95
100
105
110
Sep. Oct. Nov. Dec. Jan.
FOMC
Daily Dec. 11, 2007 = 100
* Positive percent change denotes appreciation of U.S. dollar.
Exchange value of the dollar Stock market indexLatest Percent change since Latest Percent change since
December FOMC* December FOMC
Mexico 10.9660 1.5 26893 -13.8Brazil 1.8225 3.7 54185 -17.2Venezuela 2.14 -0.1 35925 -6.2China 7.2370 -1.9 4703 -9.1Hong Kong 7.8080 0.1 24090 -17.6Korea 954.0 3.3 1628 -15.4Taiwan 32.41 0.2 7408 -14.2Singapore 1.4383 -0.2 940 -4.8Thailand 31.00 2.5 741 -11.9

IV-19
Emerging Markets: Short-Term Interest Rates and Dollar-Denominated Bond Spreads
2004 2005 2006 20070
2
4
6
8OverallMexicoBrazil
EMBI+ Spreads Weekly Percent
0
1
2
3
4
Sep. Oct. Nov. Dec. Jan.
FOMC
Daily
2004 2005 2006 20070
1
2
3
4
5
*Begins May 2004.
ChinaMalaysiaIndonesia*
EMBI Global Spreads Weekly Percent
0
1
2
3
4
Sep. Oct. Nov. Dec. Jan.
FOMC
Daily
Percent
*One month interest rate except 1-week rate for Korea. No reliable short-term interest rate exists for China. **EMBI+ or EMBI Global Spreads over similar-maturity U.S. Treasuries. ... Korea, Taiwan, Singapore, and Hong Kong have no outstanding dollar-denominated sovereign bonds.
Short-term Dollar-denominatedinterest rates* bond spreads**
Latest Change since Latest Change sinceDecember FOMC December FOMC
Mexico 7.37 -0.07 1.99 0.65Brazil 11.10 -0.27 2.87 0.83Argentina 11.94 -1.75 5.00 1.44China ... ... 1.57 0.48Korea 5.15 0.00 ... ...Taiwan 2.56 0.07 ... ...Singapore 3.50 0.00 ... ...Hong Kong 2.35 -1.44 ... ...

IV-20
Developments in Advanced Foreign Economies Fourth-quarter indicators of economic activity for the advanced foreign economies suggest that growth is decelerating, and real GDP estimates for the third quarter were also revised down in Japan and the United Kingdom. Recent data on household expenditures and retail sales have weakened on balance and there are signs that the Japanese and Canadian labor markets are deteriorating.
Consumers and businesses are considerably less upbeat about growth prospects, possibly as a result of the ongoing financial turmoil and tighter credit conditions. In Japan, concerns about the elevated level of oil prices led to a decline in the business sentiment of large manufacturers, the first drop in three years. Business confidence fell to its lowest level in two years in the United Kingdom and economic sentiment continued to decline in the euro area.
Consumer price inflation has been increasing, pushed up by higher oil prices and, in some cases, food prices. However, excluding energy prices, inflation remained subdued at around 2 percent, except in Japan where prices continue to fall. The Bank of Canada cut its policy rate 25 basis points to 4 percent on January 22. Other central bank officials held their policy rate constant in the intermeeting period, but markets now expect a lower path of interest rates than they did at the time of the last Greenbook.
In Japan, real GDP growth was revised down to 1.5 percent (a.r.) in the third quarter, a reduction of more than 1 percentage point. Growth was mostly driven by external demand for Japanese products. Domestic demand, however, remained weak. Private investment continued to decline in the third quarter, although less sharply than in the second quarter. Residential investment in particular exerted a significant drag on growth due to a revision to the Building Standards Law introduced in late June that increased inspections of buildings to ensure that they meet earthquake resistance requirements. Moreover, consumption growth appears relatively fragile as wages continue to decline.
The December Tankan survey indicated that business confidence of large manufacturers fell for the first time in three years amidst concerns regarding the level of crude oil prices. Confidence also fell among major nonmanufacturers in December, the second straight quarter of decline, as firms find it increasingly difficult to pass on cost increases from higher oil prices to consumers.

IV-21
Advanced Foreign Economies
1998 1999 2000 2001 2002 2003 2004 2005 2006 2007-1
0
1
2
3
4
5
6
*Chain weighted by moving bilateral shares in U.S. merchandise exports.
Average Real GDP* Quarterly Annualized percent change, s.a.
1998 1999 2000 2001 2002 2003 2004 2005 2006 2007-2
-1
0
1
2
3
4
5
6JapanEuro AreaCanadaUnited Kingdom
Consumer Prices Monthly 12-month percent change, s.a.
1998 1999 2000 2001 2002 2003 2004 2005 2006 2007-2
0
2
4
6
8
JapanEuro AreaCanadaUnited Kingdom
Official or Targeted Interest RatesPercent

IV-22
Japan
1998 2000 2002 2004 200685
90
95
100
105
110
115
120Industrial productionTertiary services
Economic Activity2000 = 100
1998 2000 2002 2004 200660
80
100
120
140
160
180Real exportsReal imports
Real Trade2000 = 100
1998 2000 2002 2004 20060.4
0.5
0.6
0.7
0.8
0.9
1.0
1.1
1.2
3.5
4.0
4.5
5.0
5.5
6.0Unemployment rate (right scale)Job openings to applications (left scale)
Labor Market Ratio Percent
1998 2000 2002 2004 2006-2.0
-1.5
-1.0
-0.5
0.0
0.5
1.0
1.5
*Excludes fresh food.
CPICore*
Consumer Price InflationPercent, 12-month basis, n.s.a.
2007 2007
Q2 Q3 Q4 Sept. Oct. Nov. Dec.
Housing starts 1.2 -36.9 n.a. -1.2 18.1 14.1 n.a.
Machinery orders1 -2.3 2.5 n.a. -7.6 12.7 -2.8 n.a.
Household expenditures -0.1 -0.9 n.a. 0.7 0.1 -1.0 n.a.
New car registrations -2.0 1.4 4.9 -4.4 8.0 0.5 -10.9
Business sentiment2 7.0 4.0 2.0 ... ... ... ...
Wholesale prices3 1.7 1.5 2.3 1.3 2.0 2.3 2.6
Economic Indicators(Percent change from previous period except as noted, s.a.)
Indicator
1. Private sector, excluding ships and electric power.2. Tankan survey, diffusion index. Level.3. Percent change from year earlier, n.s.a.n.a. Not available. ... Not applicable.

IV-23
Some signs point to a weakening in employment. Although the unemployment rate inched down to 3.8 percent in November, the job offers-to-applicants ratio (the number of officially posted job openings relative to the number of officially registered job seekers) fell to 0.99, its lowest level in two years. The slide in earnings growth steepened, as total cash earnings (which include bonuses) fell 1.2 percent in November from a year earlier.
The nationwide headline consumer price index (excluding fresh food only) rose 0.4 percent in November from a year earlier, the first increase in eleven months. However, the rise in the index was due to an increase in oil prices, as consumer prices excluding fresh food and energy fell 0.1 percent.
In the euro area, recent indicators are consistent with slower growth in the fourth quarter. Growth in the volume of retail sales declined in October and November, putting the average level of sales for those two months was down nearly one percent from that of the third quarter. Industrial production rebounded somewhat in October, but fell 0.4 percent in November.
Recent survey indicators unambiguously point to economic weakness. The European Commission survey of euro-area economic sentiment fell in December for the seventh consecutive month, with declines in confidence widespread across the industrial, consumer, and construction sectors. Germany’s IFO business climate index fell in December, after a brief rise in November, as firms took a bleaker view of current business conditions; the index has fallen in seven of the past eight months. Also in December, the euro-area services PMI continued to decline, while the manufacturing PMI edged down after an unexpected rebound in the previous month. Both series are near their lowest levels in more than two years. In contrast, the euro-area unemployment rate remained at 7.2 percent in December, the same rate as in November and the lowest since records began 15 years ago.
The ECB’s survey of euro-area bank lending indicated a further tightening of credit standards in the fourth quarter. The percent balance of euro-area banks reporting a net tightening of credit standards for loans to enterprises was 41 percent in the fourth quarter, up significantly from 31 percent in the third, reflecting the deterioration of financial market conditions since the start of the financial turmoil last summer. The percent balance of euro-area banks reporting a net tightening of credit standards for housing loans to households increased from 12 percent in the third quarter to 21 percent in the fourth.

IV-24
Euro Area
1998 2000 2002 2004 200660
80
100
120
140
160
180
200ExportsImports
Nominal Exports and ImportsBillions of U.S. $
1998 2000 2002 2004 2006-25
-20
-15
-10
-5
0
5
10
15Consumer confidenceIndustrial confidence
Economic SentimentPercent balance
1998 2000 2002 2004 20067.0
7.5
8.0
8.5
9.0
9.5
10.0
10.5
Unemployment RatePercent
1998 2000 2002 2004 20060.5
1.0
1.5
2.0
2.5
3.0
3.5
*Excludes energy and unprocessed food.
CPICore*
Consumer Price InflationPercent, 12-month basis, n.s.a.
2007 2007
Q1 Q2 Q3 Aug. Sept. Oct. Nov.
Industrial production1 1.0 0.4 1.5 1.2 -0.9 0.5 -0.4
Retail sales volume2 -0.2 0.1 0.6 -0.1 0.1 -0.7 -0.5
New car registrations -1.9 0.4 0.7 -0.0 0.5 0.2 -0.7
Employment 0.6 0.6 0.3 ... ... ... ...
Producer prices3 3.0 2.4 2.1 1.8 2.7 3.3 4.2
M33 11.0 11.0 11.3 11.6 11.3 12.3 12.3
Economic Indicators(Percent change from previous period except as noted, s.a.)
Indicator
1. Excludes construction.2. Excludes motor vehicles.3. Eurostat harmonized definition. Percent change from year earlier, s.a.n.a. Not available. ... Not applicable.

IV-25
Banks reported that the recent turmoil in credit markets continued to hamper their access to wholesale funding over the past three months.
Driven by higher energy and food prices, the twelve-month rate of euro-area consumer price inflation rose almost one percentage point over the course of the fourth quarter, reaching 3.1 percent in December, its highest level in six and a half years. However, excluding energy and unprocessed food prices, inflation was a more modest 2.3 percent.
In the United Kingdom, real GDP grew 2.5 percent (a.r.) in the fourth quarter according to the preliminary estimate. The expansion was supported by strong wholesaling activities, which partially offset slower retail sales, as well as faster growth among transport, storage and communication industries. The business services and finance sector, the largest contributor to the current economic expansion, grew a modest 1.7 percent, well below its 5.1 percent average over the previous year.
The Bank of England’s Credit Conditions Survey showed that lenders reduced corporate credit availability significantly in the fourth quarter, and that the availability of credit to households was reduced by more than lenders had expected a quarter earlier. The tightening of credit likely contributed to a further moderation of activity in the housing sector. Gross mortgage lending fell 21 percent in the twelve months to December. Indicators of house prices were either flat or posted mild declines in the fourth quarter.
Consumer confidence slid in December as households were increasingly worried about the general economic situation. The PMI for services firmed slightly in December, but firms reported a contraction in outstanding business activities for the third consecutive month. Business confidence rose in January after reaching a two-year low a month earlier.
By contrast, the labor market continued to display much resilience. The number of people employed was 175 thousand higher in the three months to November than in the previous quarter. The number of people claiming unemployment benefits fell for the fifteenth consecutive month in December. Average earnings growth including bonuses remained moderate at about 4 percent.

IV-26
United Kingdom
1998 2000 2002 2004 20060.0
0.5
1.0
1.5
2.0
2.5
3.0
3.5
*Excludes energy and unprocessed food.
CPICore*
Consumer Price InflationPercent, 12-month basis, n.s.a.
1998 2000 2002 2004 20062
3
4
5
6
7Labor force surveyClaimant count
Unemployment RatesPercent
1998 2000 2002 2004 200640
45
50
55
60
65ServicesManufacturing
Purchasing Managers Survey50+ = expansion
1998 2000 2002 2004 2006-8
-6
-4
-2
0
2
4
6
8
10
*Manufacturing industries.**Whole economy, including bonuses.
Unit wage costs*Average earnings**
Labor CostsPercent, 12-month basis
2007 2007 2008
Q2 Q3 Q4 Oct. Nov. Dec. Jan.
Real GDP 3.4 2.7 2.5 ... ... ... ...
PMI Services1 57.4 57.1 52.5 53.1 52.0 52.4 n.a.
Industrial production 0.7 0.0 n.a. 0.5 -0.1 n.a. n.a.
Business confidence2 20.3 13.3 7.3 10.0 9.0 3.0 9.0
Consumer confidence2 -4.2 -2.5 -3.8 -2.3 -4.1 -5.0 n.a.
Trade balance3 -20.8 -26.9 n.a. -8.7 -9.0 n.a. n.a.
Economic Indicators(Percent change from previous period except as noted, s.a.)
Indicator
1. 50+ indicates expansion.2. Percent balance. 3. Level in billions of US Dollars.n.a. Not available. ... Not applicable.

IV-27
Overall price pressure has risen further since last Greenbook. The twelve-month rate of headline inflation remained near target at 2.1 percent in December. However, the quarterly increase at an annual rate registered 3.8 percent in the fourth quarter, its fastest pace since 1995 pushed up by rising energy and food prices. Moreover, producers prices increased 5.0 percent in the year to December, their fastest pace since 1991, as manufacturers passed on higher material and fuel inputs costs.
In Canada, indicators for the fourth quarter suggest that growth is moderating from the 2.9 percent rate posted in the third quarter. Monthly GDP in October rose 2.9 percent (s.a.a.r.), which would lead to 2.3 percent growth for the fourth quarter if November and December grow at the average rate of the first ten months of the year. However, limited post-October data indicated some additional slowing at the end of the quarter. Imports of machinery and equipment, a good indicator of fixed investment, fell 2.5 percent in November. New motor vehicle sales, a timely indicator of consumer spending, fell 2.9 percent in November; new motor vehicle sales have fallen six out of the last seven months.
Following very strong growth in November, private employment fell sharply in December, leaving private employment up a paltry 0.2 percent in the fourth quarter. Public sector employment continued its outsized gains throughout the fourth quarter, leading the overall employment to rise 0.8 percent. The unemployment rate remained unchanged at 5.9 percent in December, a thirty-year low.
The housing market appears to have weakened slightly over the past couple of months. Single-unit housing starts declined a modest 2.4 percent in the fourth quarter. Twelve-month house price appreciation has slowed from a peak of 12 percent in 2006 to 6.1 percent in November. Although movements in multi-unit housing starts have been volatile, they have remained roughly flat, on average, over the past two years.
In November, the twelve-month rate of consumer price inflation increased slightly to 2.7 percent. The increase in inflation owed primarily to increasing energy prices. Core inflation, which excludes the eight most volatile components and the effects of changes in indirect taxes, increased 1.7 percent in October and November. The twelve-month growth rate of average hourly wages jumped sharply in December, reaching 4.9 percent.

IV-28
Canada
1998 2000 2002 2004 20060
1
2
3
4
5
6
7
*Constructed from various Statistics Canada surveys and supplementsthe quarterly income and expenditure-based estimates.
Real GDP by Industry*Percent change from year earlier
1998 2000 2002 2004 200680
100
120
140
160
180
200Real exportsReal imports
Real Trade1997 = 100
1998 2000 2002 2004 20065.5
6.0
6.5
7.0
7.5
8.0
8.5
Unemployment RatePercent
1998 2000 2002 2004 20060
1
2
3
4
5
6
*Excludes 8 most volatile components and the effects of changesin indirect taxes.
CPICore*
Consumer Price InflationPercent, 12-month basis, n.s.a.
2007 2007
Q2 Q3 Q4 Sept. Oct. Nov. Dec.
Industrial production 0.3 -0.3 n.a. -0.5 0.1 n.a. n.a.
New manufacturing orders -0.8 -1.3 n.a. -1.8 2.4 5.0 n.a.
Retail sales 2.5 0.2 n.a. -0.5 0.4 0.2 n.a.
Employment 0.3 0.4 0.8 0.3 0.4 0.3 -0.1
Consumer attitudes1 97.4 100.8 97.9 ... ... ... ...
Business confidence1 106.7 101.6 n.a. ... ... ... ...
Economic Indicators(Percent change from previous period except as noted, s.a.)
Indicator
1. 2002=100.n.a. Not available. ... Not applicable.

IV-29
Economic Situation in Other Countries Incoming data for the emerging market economies in Asia suggest that the pace of expansion moderated in the fourth quarter. Trade balances have declined in several countries as exports slowed. Indicators have been a bit more mixed in Latin America but, on balance, also point to a slowing of growth, notably in Mexico. Headline inflation remained elevated in the developing world. Although food price inflation has retreated some from earlier peaks in a number of countries, energy prices have accelerated of late.
In China, incoming data continue to point to a more moderate rate of growth than was seen in the first half of last year. Exports fell about 7 percent (s.a.a.r.) in the fourth quarter and, with imports roughly unchanged, the trade surplus narrowed to less than $250 billion at an annual rate. Over the October-November period, the average level of industrial production rose 2½ percent (s.a.) from its third-quarter level, representing a slight deceleration. Monthly fixed asset investment has been erratic, with its year-over-year growth rate spiking in October and then falling back in November to about 26 percent. The value of outstanding loans in December was just ½ percent higher than at the end of October, reflecting guidance issued by the government in November to cap bank lending. Twelve-month growth of M2 also slowed in December from its pace in the past several months. In contrast, retail sales continued to accelerate, rising 19 percent in November from a year earlier.
Twelve-month inflation rose further to nearly 7 percent in November due mainly to soaring vegetable prices. In addition, non-food price inflation also registered a significant increase; the recent hike in government-controlled retail fuel prices helped push non-food inflation to 1.4 percent, higher than its average pace of 1 percent in previous months. Amid concerns over inflation, the government announced that it would temporarily control the prices of some basic necessities such as grain, meat, and cooking oil, whose prices had been market determined. Additionally, the central bank raised the bank reserve requirement ratio in December and January by a cumulative 1½ percentage points to a record 15 percent for large banks. In December, benchmark interest rates were also raised 27 basis points to 4.14 percent for the one-year deposit rate and 18 basis points to 7.47 percent for the one-year lending rate.

IV-30
Chinese Economic Indicators(Percent change from previous period, s.a., except as noted)
20072006 2007 Q3 Q4 Oct. Nov. Dec.
Real GDP1 10.4 n.a. 8.2 n.a. . . . . . . . . . Industrial production 14.6 n.a. 3.2 n.a. -.3 2.8 n.a. Consumer prices2 2.7 n.a. 6.1 n.a. 6.7 6.9 n.a. Merch. trade balance3 177.5 262.2 265.7 246.4 285.3 244.4 209.5
1. Annual rate. Quarterly data estimated by staff from reported four-quarter growth rates.Annual data are Q4/Q4. 2. Percent change from year-earlier period, except annual data, which are Dec./Dec. 3. Billions of U.S. dollars, annual rate. Imports are c.i.f. n.a. Not available. . . . Not applicable.
Indicator
Indian Economic Indicators
(Percent change from previous period, s.a., except as noted)
20072006 2007 Q3 Q4 Oct. Nov. Dec.
Real GDP1 8.7 n.a. 8.0 n.a. . . . . . . . . . Industrial production 10.5 n.a. -.1 n.a. 1.8 .5 n.a. Consumer prices2 6.5 n.a. 6.4 n.a. 4.6 4.6 n.a. Wholesale prices2 5.7 3.6 4.1 3.3 3.1 3.2 3.6 Merch. trade balance3 -54.4 n.a. -69.8 n.a. -81.6 -85.9 n.a. Current account4 -9.5 n.a. -22.1 n.a. . . . . . . . . .
1. Annual rate. Annual data are Q4/Q4. 2. Percent change from year-earlier period, except annual data, which are Dec./Dec. 3. Billions of U.S. dollars, annual rate. 4. Billions of U.S. dollars, n.s.a., annual rate. n.a. Not available. . . . Not applicable.
Indicator
Recent indicators for India have been mixed but, on balance, point to a continued moderation of activity in the fourth quarter. Industrial production rebounded in the October-November period from a contraction in the third quarter. However, exports declined, contributing to a widening of the trade deficit. Data from December suggest that consumer price inflation has stopped decelerating and wholesale price inflation has begun increasing after reaching a trough in October, rising from 3.2 percent in November to 3.6 percent in December.
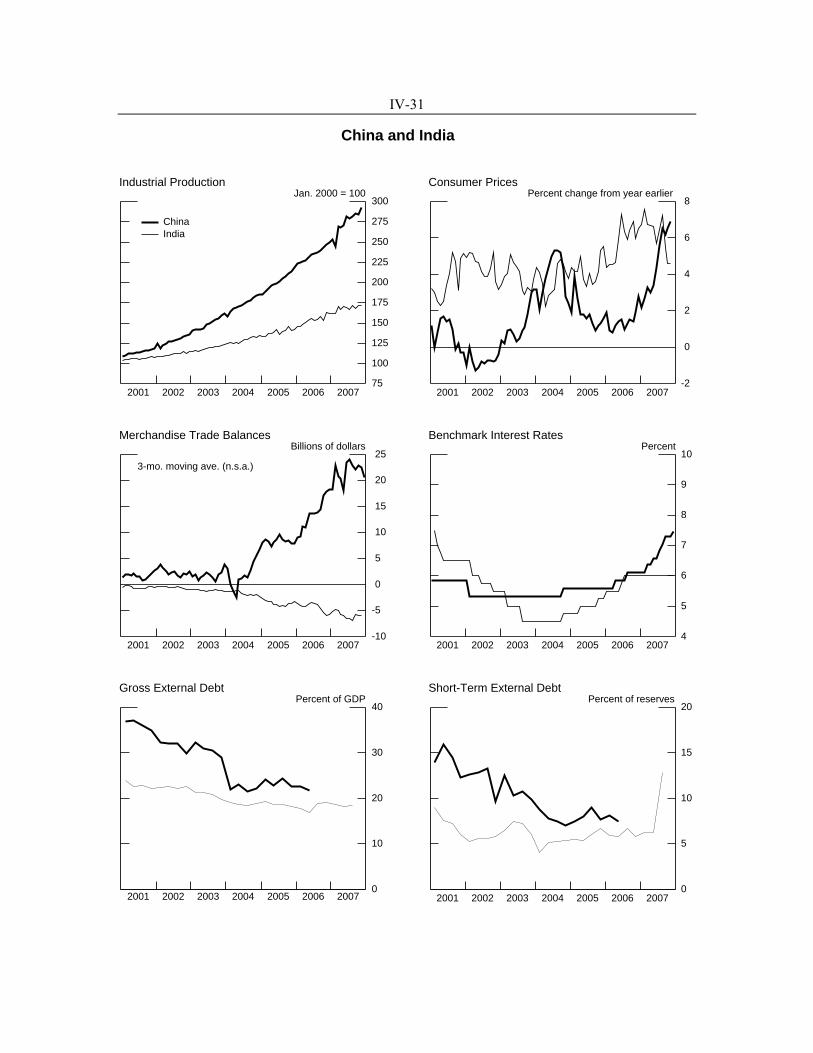
IV-31
China and India
75
100
125
150
175
200
225
250
275
300
2001 2002 2003 2004 2005 2006 2007
ChinaIndia
Industrial ProductionJan. 2000 = 100
-2
0
2
4
6
8
2001 2002 2003 2004 2005 2006 2007
Consumer PricesPercent change from year earlier
-10
-5
0
5
10
15
20
25
2001 2002 2003 2004 2005 2006 2007
3-mo. moving ave. (n.s.a.)
Merchandise Trade BalancesBillions of dollars
4
5
6
7
8
9
10
2001 2002 2003 2004 2005 2006 2007
Benchmark Interest RatesPercent
2001 2002 2003 2004 2005 2006 20070
10
20
30
40
Gross External DebtPercent of GDP
0
5
10
15
20
2001 2002 2003 2004 2005 2006 2007
Short-Term External DebtPercent of reserves

IV-32
NIEs Economic Indicators: Growth
(Percent change from previous period, s.a., except as noted)
20072005 2006 Q2 Q3 Sep. Oct. Nov.
Real GDP1
Hong Kong 7.8 7.2 8.2 5.8 . . . . . . . . . Korea 5.7 4.0 7.4 5.4 . . . . . . . . . Singapore 8.2 6.5 14.5 4.3 . . . . . . . . . Taiwan 6.8 4.0 11.6 12.9 . . . . . . . . .
IndustrialproductionHong Kong 2.3 2.4 -1.9 -1.6 . . . . . . . . . Korea 5.8 10.8 4.4 4.1 .0 3.2 -.2 Singapore 9.5 11.9 4.9 6.5 -6.3 -1.6 5.8 Taiwan 4.6 5.0 6.5 3.1 4.2 1.8 -2.5
1. Annual rate. Annual data are Q4/Q4. ... Not applicable.
Indicator
1 Newly-industrialized economies: Hong Kong, South Korea, Singapore, and Taiwan
In the NIEs1, indicators suggest that overall economic activity moderated in the fourth quarter of last year from strong growth in the previous two quarters. In Singapore, the advance unofficial estimate (not shown) indicates that fourth-quarter real GDP fell 3¼ percent as activity in the volatile biomedical sector contracted and production of electronics slowed. Elsewhere, growth of industrial production also slowed in South Korea and Taiwan. Across the region, trade balances generally decreased as exports slowed and, in some cases, imports rose.
Twelve-month consumer price inflation remained elevated in the fourth quarter owing mostly to higher food and energy prices. However, food price inflation has retreated in the most recent months from previous peaks as the earlier effect of adverse weather has faded in Hong Kong, Taiwan, and Korea. Citing inflationary pressures, the central bank of Taiwan raised its discount rate .125 percentage points to 3.375 percent on December 20, while the Bank of Korea left its benchmark rate unchanged at the most recent monetary policy meeting on January 10.

IV-33

IV-34
NIEs
65
85
105
125
145
165
185
2001 2002 2003 2004 2005 2006 2007
KoreaSingaporeHong KongTaiwan
Industrial ProductionJan. 2000 = 100
-6
-4
-2
0
2
4
6
8
2001 2002 2003 2004 2005 2006 2007
Consumer PricesPercent change from year earlier
-3.0-2.5-2.0-1.5-1.0-0.50.00.51.01.52.02.53.03.54.0
2001 2002 2003 2004 2005 2006 2007
3-mo. moving ave. (n.s.a.)
Merchandise Trade BalancesBillions of dollars
0
2
4
6
8
2001 2002 2003 2004 2005 2006 2007
Benchmark Interest RatesPercent
0
5
10
15
20
25
30
35
2001 2002 2003 2004 2005 2006 2007
Gross External DebtPercent of GDP
0
10
20
30
40
50
60
2001 2002 2003 2004 2005 2006 2007
Short-Term External DebtPercent of reserves

IV-35
ASEAN-4 Economic Indicators: Growth
(Percent change from previous period, s.a., except as noted)
20072005 2006 Q2 Q3 Sept. Oct. Nov.
Real GDP1
Indonesia 4.9 6.0 6.6 9.5 . . . . . . . . . Malaysia 5.7 5.8 6.6 9.2 . . . . . . . . . Philippines 5.6 5.5 7.4 1.1 . . . . . . . . . Thailand 4.3 4.3 5.2 6.3 . . . . . . . . .
Industrialproduction2
Indonesia3 1.3 -1.6 2.4 -2.3 1.7 -4.7 n.a. Malaysia 4.0 4.8 2.2 .8 1.2 -2.4 4.1 Philippines 2.2 -9.9 3.5 1.6 -4.5 .7 n.a. Thailand 9.1 7.4 1.3 4.7 -1.0 2.6 .5
1. Annual rate. Annual data are Q4/Q4. 2. Annual data are annual averages. 3. Staff estimate. n.a. Not available. ... Not applicable.
Indicator
Data from the ASEAN-4 region indicate that growth generally slowed in the fourth quarter. Growth of industrial production softened, and with the exception of Thailand, trade balances decreased. Across the region, higher food and energy prices pushed twelve-month consumer price inflation higher. Despite the inflationary pressures, central banks in Indonesia and the Philippines lowered interest rates by 25 basis points to 8 percent and to 5¼ percent respectively, in order to support growth.
Separately, the Philippines central bank announced measures to liberalize capital outflows to stem local currency appreciation, raising the amount residents can invest overseas without prior approval and the amount of foreign exchange individuals can buy without documentation. The Bank of Thailand announced measures to further relax the capital controls it had instituted in December 2006, scrapping the $100 million limit on overseas investment by Thai companies and doubling to $100 million the limit parent companies can invest in and lend to overseas subsidiaries.
Results of Thailand’s December parliamentary elections indicate that the People Power Party (PPP), the party close to ousted Thai Prime Minister Thaksin Shinawatra, won a landslide victory. It remained, however, uncertain whether the military regime and the royal palace would cease their involvement in Thai politics.

IV-36

IV-37
ASEAN-4
65
85
105
125
145
165
185
205
225
2001 2002 2003 2004 2005 2006 2007
IndonesiaMalaysiaPhilippinesThailand
Industrial ProductionJan. 2000 = 100
-5
0
5
10
15
20
2001 2002 2003 2004 2005 2006 2007
Consumer PricesPercent change from year earlier
-1.5
-1.0
-0.5
0.0
0.5
1.0
1.5
2.0
2.5
3.0
3.5
4.0
2001 2002 2003 2004 2005 2006 2007
3-mo. moving ave. (n.s.a.)
Merchandise Trade BalancesBillions of dollars
0
5
10
15
20
2001 2002 2003 2004 2005 2006 2007
Benchmark Interest RatesPercent
0
15
30
45
60
75
90
2001 2002 2003 2004 2005 2006 2007
Gross External DebtPercent of GDP
0
10
20
30
40
50
60
70
80
90
2001 2002 2003 2004 2005 2006 2007
Short-Term External DebtPercent of reserves

IV-38
Mexican Economic Indicators
(Percent change from previous period, s.a., except as noted)
20072006 2007 Q3 Q4 Oct. Nov. Dec.
Real GDP1 4.3 n.a. 5.9 n.a. . . . . . . . . . Overall economicactivity 4.9 n.a. 1.5 n.a. .1 n.a. n.a. Industrial production 5.0 n.a. 1.1 n.a. .0 .1 n.a. Unemployment rate2 3.6 3.7 3.6 3.8 3.7 3.7 3.8 Consumer prices3 4.1 3.8 4.0 3.8 3.7 3.9 3.7 Merch. trade balance4 -6.1 n.a. -10.5 n.a. -11.5 3.6 n.a. Merchandise imports4 256.1 n.a. 291.3 n.a. 292.7 288.4 n.a. Merchandise exports4 250.0 n.a. 280.8 n.a. 281.2 291.9 n.a. Current account5 -1.9 n.a. -5.4 n.a. . . . . . . . . .
1. Annual rate. Annual data are Q4/Q4. 2. Percent; counts as unemployed those working one hour a week or less. 3. Percent change from year-earlier period, except annual data, which are Dec./Dec. 4. Billions of U.S. dollars, annual rate. 5. Billions of U.S. dollars, n.s.a., annual rate. n.a. Not available. . . . Not applicable.
Indicator
Data from Mexico suggest that growth slowed in the fourth quarter. In October, the index of overall economic activity was little changed. Industrial production for the October through November period weakened. Same-store sales (not shown) were also down recently, but the trade balance moved into surplus in November, following a string of deficits. The recently approved budget for 2008 calls for a 10 percent increase in real expenditures (1.2 percent of GDP), which will provide some support to activity going forward. Headline inflation fell back to 3.8 percent in the fourth quarter from 4 percent, the upper limit of the central bank’s target range, in the previous quarter. Twelve-month core inflation readings continued to be elevated at 4 percent in December.
In Brazil, real GDP growth jumped to 6.9 percent in the third quarter, boosted by domestic demand, notably investment, as external demand slowed. Investment continued to soar, rising nearly 20 percent for the second consecutive quarter, and private consumption expanded at a solid 6 percent pace. Recent indicators for the fourth quarter have been mixed. Industrial production was down in November, and the trade surplus narrowed in the fourth quarter, but capacity utilization rates have remained very high. Consumer price inflation remained elevated at 4.3 percent in the fourth quarter as higher food prices continued to exert pressure on headline inflation.

IV-39
Brazilian Economic Indicators
(Percent change from previous period, s.a., except as noted)
20072006 2007 Q3 Q4 Oct. Nov. Dec.
Real GDP1 5.0 n.a. 6.9 n.a. . . . . . . . . . Industrial production 2.8 n.a. 1.7 n.a. 3.2 -1.8 n.a. Unemployment rate2 10.0 n.a. 9.2 n.a. 8.8 8.4 n.a. Consumer prices3 3.3 4.5 4.2 4.3 4.2 4.3 4.5 Merch. trade balance4 46.4 40.3 33.0 35.6 39.5 34.9 32.5 Current account5 13.6 n.a. 4.1 n.a. -.5 -16.1 n.a.
1. Annual rate. Annual data are Q4/Q4. 2. Percent. 3. Percent change from year-earlier period, except annual data, which are Dec./Dec.Price index is IPCA. 4. Billions of U.S. dollars, annual rate. 5. Billions of U.S. dollars, n.s.a., annual rate. n.a. Not available. . . . Not applicable.
Indicator
In December, the Brazilian congress rejected a measure introduced by the Lula government to extend the financials transaction tax (CPMF), which expired at the end of the year. The loss of revenues from the removal of the tax is estimated at $40 billion (about 2½ percent of GDP). In response, the government proposed in early January a controversial plan to cut spending and to raise the tax rates on capital gains and banks’ profit.
Economic activity continued to be very strong in Argentina. Third-quarter real GDP soared by nearly 12 percent, led by strong gains in agricultural production and construction activity. Data for the fourth quarter indicate that activity continued to expand solidly. In October and November, industrial production was up, and the trade surplus widened significantly. Consumer price inflation, though elevated, moderated a bit to 8.4 percent in the fourth quarter from 8.7 percent in the previous quarter. There are allegations that Argentine authorities have continued to tamper with the consumer price data to understate the rate of inflation.

IV-40
Argentine Economic Indicators(Percent change from previous period, s.a., except as noted)
20072006 2007 Q3 Q4 Oct. Nov. Dec.
Real GDP1 8.5 n.a. 11.8 n.a. . . . . . . . . . Industrial production 8.3 n.a. 2.2 n.a. 1.2 1.2 n.a. Unemployment rate2 10.2 n.a. 8.1 n.a. . . . . . . . . . Consumer prices3 9.7 8.4 8.7 8.4 8.4 8.5 8.4 Merch. trade balance4 12.3 n.a. 7.1 n.a. 16.0 17.3 n.a. Current account5 8.1 n.a. 3.2 n.a. . . . . . . . . .
1. Annual rate. Annual data are Q4/Q4. 2. Percent; n.s.a. 3. Percent change from year-earlier period, except annual data, which are Dec./Dec. 4. Billions of U.S. dollars, annual rate. 5. Billions of U.S. dollars, n.s.a., annual rate. n.a. Not available. . . . Not applicable.
Indicator
In Venezuela, new finance minister Rafael Isea announced goals of 6 percent real GDP growth and 11 percent inflation by the end of 2008. There are no hints that the government will tighten monetary and fiscal policies, which have been expansionary and fueled growth. Both headline and core inflation continued to rise significantly, reaching 22.4 percent and 28 percent, respectively, in December. On January 1, as had been announced early last year as an anti-inflation measure, the government introduced a new currency, the bolivar fuerte (“strong” bolivar, which is equal to 1,000 bolivares). In the parallel market, the bolivar fuerte stood at 5.45 per dollar in mid-January, well below the official value of 2.14 per dollar. In his mid-January state-of-the-nation address, President Chavez stated that the unlimited term provision which was rejected by voters last December might be re-introduced in 2010, three years before the end of his term.

IV-41
Venezuelan Economic Indicators(Percent change from previous period, s.a., except as noted)
20072006 2007 Q3 Q4 Oct. Nov. Dec.
Real GDP1 11.4 n.a. 11.6 n.a. . . . . . . . . . Unemployment rate2 10.0 n.a. 8.5 n.a. 7.5 7.1 n.a. Consumer prices3 17.0 22.5 16.1 20.2 17.2 20.7 22.4 Non-oil trade balance4 -22.9 n.a. -35.7 n.a. . . . . . . . . . Merch. trade balance4 32.7 n.a. 25.0 n.a. . . . . . . . . . Current account5 27.1 n.a. 27.5 n.a. . . . . . . . . .
1. Annual rate. Annual data are Q4/Q4. 2. Percent. 3. Percent change from year-earlier period, except annual data, which are Dec./Dec. 4. Billions of U.S. dollars, annual rate. 5. Billions of U.S. dollars, n.s.a., annual rate. n.a. Not available. . . . Not applicable.
Indicator

IV-42
Latin America
70
80
90
100
110
120
130
140
2001 2002 2003 2004 2005 2006 2007
ArgentinaBrazilMexico
Industrial ProductionJan. 2000 = 100
-5
5
15
25
35
45
2001 2002 2003 2004 2005 2006 2007
Consumer PricesPercent change from year earlier
-2
-1
0
1
2
3
4
5
2001 2002 2003 2004 2005 2006 2007
3-mo. moving ave. (n.s.a.)
Merchandise Trade BalancesBillions of dollars
0
5
10
15
20
25
30
2001 2002 2003 2004 2005 2006 2007
Benchmark Interest RatesPercent
0
25
50
75
100
125
150
175
200
225
2001 2002 2003 2004 2005 2006 2007
Gross External DebtPercent of GDP
0
50
100
150
200
250
300
350
400
450
0
30
60
90
120
150
180
210
2001 2002 2003 2004 2005 2006 2007
Argentina (left scale)
Short-Term External DebtPercent of reserves

IV-43
Turkish Economic Indicators
(Percent change from previous period, s.a., except as noted)
20072006 2007 Q3 Q4 Oct. Nov. Dec.
Real GDP1 5.2 n.a. -10.0 n.a. . . . . . . . . . Industrial production 5.9 n.a. .2 n.a. 4.7 8.8 n.a. Consumer prices2 9.7 8.4 7.1 8.2 7.7 8.4 8.4 Merch. trade balance3 -53.8 n.a. -65.4 n.a. -81.6 -65.3 n.a. Current account4 -32.3 n.a. -27.5 n.a. -38.2 -39.2 n.a. Unemployment rate5 9.8 n.a. 10.0 n.a. . . . . . . . . .
1. Annual rate. Annual data are Q4/Q4. 2. Percent change from year-earlier period, except annual data, which are Dec./Dec. 3. Billions of U.S. dollars, annual rate. Imports are c.i.f. 4. Billions of U.S. dollars, n.s.a., annual rate. 5. Percent n.a. Not available. . . . Not applicable.
Indicator
In Turkey, third-quarter real GDP contracted due to significant cuts in government spending and drop in exports. Incoming data suggest that growth rebounded in the fourth quarter. Average industrial production for October and November was up significantly over the third quarter level as manufacturing activity strengthened. Twelve-month consumer price inflation continued to rise in recent months, reaching 8.4 percent in December, significantly higher than the upper limit of the central bank’s year-end target of 4 percent. Nonetheless, the central bank cut twice its overnight borrowing rate by a total of 75 basis points to 15½ and its lending rate by a total of 125 basis points to 19½ percent. The Monetary Policy Committee indicated that the lagged effects of previous monetary tightening coupled with weak aggregate demand will continue to exert downward pressures on inflation going forward.
Last Page of Part 2