fomc 19790206 g bpt 219790131
TRANSCRIPT

Prefatory Note
The attached document represents the most complete and accurate version available based on original copies culled from the files of the FOMC Secretariat at the Board of Governors of the Federal Reserve System. This electronic document was created through a comprehensive digitization process which included identifying the best-preserved paper copies, scanning those copies,1 and then making the scanned versions text-searchable.2 Though a stringent quality assurance process was employed, some imperfections may remain.
Please note that this document may contain occasional gaps in the text. These gaps are the result of a redaction process that removed information obtained on a confidential basis. All redacted passages are exempt from disclosure under applicable provisions of the Freedom of Information Act.
1 In some cases, original copies needed to be photocopied before being scanned into electronic format. All scanned images were deskewed (to remove the effects of printer- and scanner-introduced tilting) and lightly cleaned (to remove dark spots caused by staple holes, hole punches, and other blemishes caused after initial printing). 2 A two-step process was used. An advanced optimal character recognition computer program (OCR) first created electronic text from the document image. Where the OCR results were inconclusive, staff checked and corrected the text as necessary. Please note that the numbers and text in charts and tables were not reliably recognized by the OCR process and were not checked or corrected by staff.

Confidential (FR) Class II FOMC
Part 2January 31, 1979
CURRENT ECONOMIC ANDFINANCIAL CONDITIONS
Prepared for the Federal Open Market Committee
By the staff of the Board of Governors of the Federal Reserve System

TABLE OF CONTENTS
Section Page
DOMESTIC NONFINANCIAL DEVELOPMENTS II
Employment and production ................. .................. 1Personal income and consumer spending......................... 4Business investment..................... ..... ....... .. 6Residential construction................... ................. 11Government sector activity......... ....... ............ 16Prices............... ............................... ........ . 18Wages, productivity and costs.............................. 20
TABLES:
Changes in employment ....................... ............... 2Selected unemployment rates................................... 2Industrial production... ............. ............... ..... 3Selected capacity utilization rates......................... 3Personal income............................................. 5Retail sales ................. .... . .. ......... .... ... ...... 7Auto sales................... .. ..... ........................ 7
Contracts and orders for plant and equipment..................Survey of plant and equipment expenditures.................... 10Business inventories...................................... 12Inventory to sales ratios........................ ........... 12New private housing activity........................ ...... 14Recent changes in producer prices........................... 19Recent changes in consumer prices.............................. 19Hourly earnings index.......................................... 22Major collective bargaining settlements....................... 22Productivity and costs........................................ 23
CHARTS:
Inventory to sales ratio.................................. 13New private housing starts............. ..... w..... ... .... 15
DOMESTIC FINANCIAL DEVELOPMENTS III
Monetary aggregates.......................................... 2Bank credit..................................................... 8Business finance................. ......................... 13Mortgage market and consumer credit ........................... 16Government securities markets................................. 23

TABLE OF CONTENTS (cont.)
Section Page
DOMESTIC FINANCIAL DEVELOPMENTS (cont.) III
TABLES:
Selected financial market quotations.......................... 3Monetary aggregates.......................................... 4Commercial bank credit......................................... 9Change in commercial paper outstanding ......................... 14Change in business credit at finance companies................. 14Gross offerings of corporate and foreign securities............ 15Financing pattern of nonfinancial corporations................ 17Interest rates and supply of mortgage fundsat selected S&Ls... ....... ............................. .. 20
Secondary home mortgage market activity......................... 20Consumer instalment credit ..... ............ ........ .......... 21Government security offerings .......... ....................... 24
CHARTS:
Money market mutual funds............ * .................... 7Ratio of liquid assets to total liabilities
at large banks inside and outsideNew York City ............................................. . 11
Ratio of loans to deposits................................... 12Commercial and industrial mortgage activityat life insurance companies .............................. . 18
Proportion of low-downpayment automobilecredit contracts at finance companies ........................ 22
Average maturity on new-auto contracts atcommercial banks and finance companies...............,.... 22
INTERNATIONAL DEVELOPMENTS IV
Borrowing in international capital markets ..................... 5U.S. international transactions.............................. 9Foreign international transactions........................... 14Individual country notes....................................... 19
TABLES:
Borrowing in international capital markets..................... 6U.S. merchandise trade........................... ............ 10U.S. international transactions summary........................ 12

TABLE OF CONTENTS (cont.)
Section Page
INTERNATIONAL DEVELOPMENTS (cont.) IV
TABLES:Consumer and wholesale prices in major
industrial countries...................... ................ 16Real GNP and industrial production inmajor industrial countries.................................. 17
Trade and current account balances ofmajor industrial countries............................ ..... 18
CHARTS:
Weighted average exchange value of the dollar................. 2Real GNP in major industrial countries ........................... 15
APPENDIX A: The Federal Budget for Fiscal Year 1980
APPENDIX B: New Estimates of the High Employment Budget Surplus Deficit

January 31, 1979
SELECTED DOMESTIC NONFINANCIAL DATAAVAILABLE SINCE PRECEDING GREENBOOK
(Seasonally adjusted)
Latest Data Per Cent Change fromThree
Release Preceding Periods YearPeriod Date Data Period Earlier earlier
(At annual rate)
Civilian labor forceUnemployment rate (%) 1/Insured unemployment rate (%) 1/
Nonfarm employment, payroll (mil.)ManufacturingNonmanufacturing
Private nonfarm:Average weekly hours (hr.) 1/Hourly earnings ($) 1/
Manufacturing:Average weekly hours (hr.) 1/Unit labor cost (1967=100)
Industrial production (1967-100)Consumer goodsBusiness equipmentDefense & space equipmentMaterials
Dec. 1-12-79Dec. 1-12-79Dec. 1-12-79Dec. 1-12-79Dec. 1-12-79Dec. 1-12-79
Dec. 1-12-79Dec. 1-12-79
101.95.93.1
87.320.766.5
35.85.90
2.85.83.03.47.22.3
35.85.86
Dec. 1-12-79 40.6 40.7Dec. 1-31-79 169.9 5.0
Dec.Dec.Dec.Dec.Dec.
Consumer prices all items (1967=100) Dec.All items, excluding food & energy Dec.Food Dec.
Producer prices: (1967=100)Finished goodsIntermediate materials, nonfoodCrude foodstuffs & feedstuffs
Personal income ($ bil.) 2/
Mfrs. new orders dur. goods ($ bil.)Capital goods industriesNondefenseDefense
Inventories to sales ratio: 1/Manufacturing and trade, totalManufacturingTrade
Dec.Dec.Dec.
Dec.
Dec.Dec.Dec.Dec.
Nov.Nov.Nov.
1-17-791-17-791-17-791-17-791-17-79
1-24-791-24-791-24-79
1-11-791-11-791-11-79
150.4150.5169.3
87.6152.9
202.9195.6219.7
202.1224.4226.1
7.25.6
10.06.95.5
7.15.59.4
10.26.5
-2.1
1-18-79 1804.8 12.7
35.8 35.95.77 5.41
40.4 40.511.4 5.7
7.73.29.9
10.210.2
7.6 9.17.5 8.57.6 11.7
9.910.118.9
13.8 12.2
(Not at annual rates)
1-23-791-23-791-23-791-23-79
1-23-791-23-791-23-79
76.624.320.3
4.0
-. 1-3.7-1.4
-13.9
1.39 1.381.48 1.491.29 1.28
5.42.7
.714.1
1.401.511.30
15.713.719.5-8.7
1.441.571.31
Ratio: Mfrs.' durable goods inven-tories to unfilled orders 1/ Nov.
Retail sales, total ($ bil.)GAF 3/
Auto sales, totalDomestic modelsForeign models
Plant & EquipmentAll IndustriesManufacturingNonmanufacturing
(mil. units.) 2/
expen. ($ bil.) 4/
Dec.Dec.
Dec.Dec.Dec.
1-23-79 .570 .575
1-10-79 68.9 1.01-10-79 15.1 .8
1-8-791-8-79'1-8-79
1979 1-11-791979 1-11-791979 1-11-79
11.1 2.19.2 4.21.9 -7.0
.596 .637
3.8 11.43.1 6.7
4.7 1.15.5 3.4
.9 -8.5
170.2076.9993.20
11.213.8
9.1
Housing starts, private (thous.) 2/ Dec.Leading indicators (1967=100) Dec.
1-17-79 2,125 -1.41-31-79 137.3 -.5
2.4 -3.6-. 6 1.4
1/ Actual data used in lieu of per cent changes for earlier periods.2/ At annual rate.3/ Excludes mail order houses.4/ Planned-Commerce January 1979 Survey.
II - T - 1

II - 1
DOMESTIC NONFINANCIAL DEVELOPMENTS
Economic activity advanced at a brisk pace late in 1978.
Employment rose appreciably further in December, industrial production
continued upward, and retail sales closed out the year with three conse-
cutive months of strong gains. Housing starts held at the high level
that had been sustained since the spring. Capital spending continued
strong, but evidence of caution was apparent in longer-term spending
plans. Inflationary pressures remain intense despite two months of some
relief at retail due to temporary factors.
Employment and Production
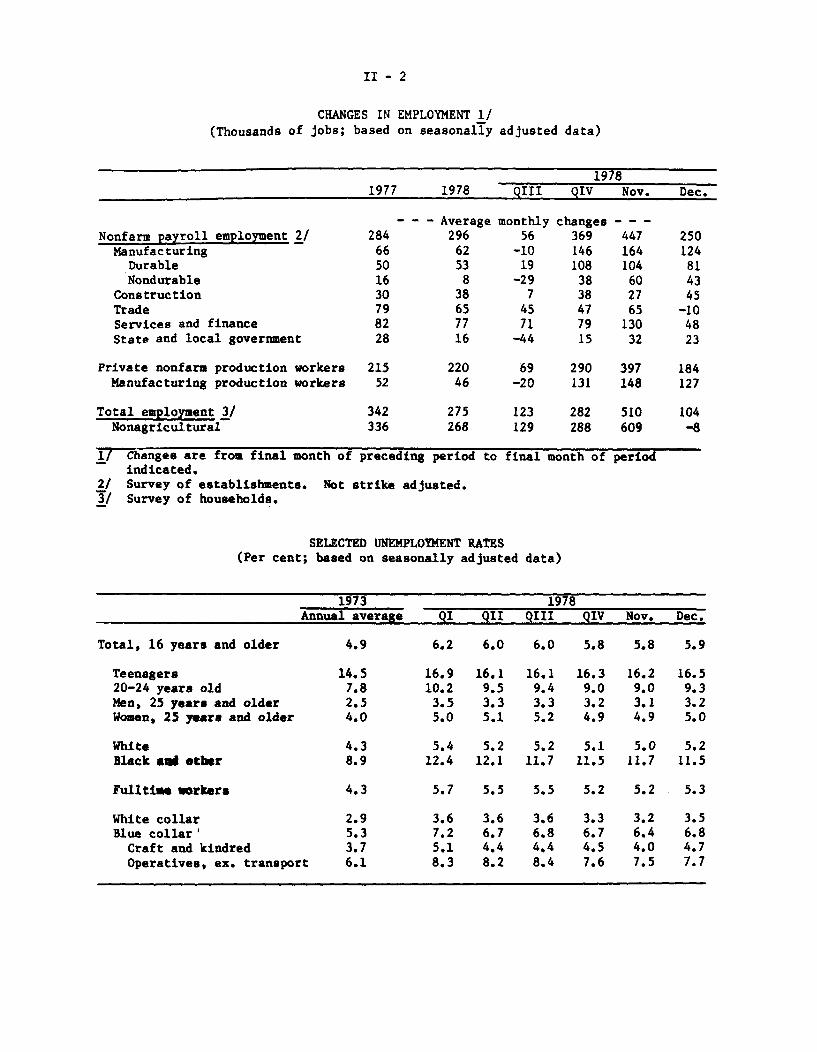
Employment continued upward in December following several months
of exceptionally strong hiring gains. The labor force also expanded
rapidly, however, and the umemployment rate edged up to 5.9 per cent--
remaining in the range that has prevailed since the spring. Jobless
rates for most groups of workers were little changed from November. Over
the year, adult full-time workers generally experienced sizable declines
in unemployment, while the rates for youth fell only slightly.
Nonfarm payroll employment increased 250,000 in December, the
third consecutive month of large rise. Labor demand remained especially
strong in the goods-producing sector; manufacturers added 125,000 workers
to their payrolls with increases again concentrated among producers of
durable goods. Outside of manufacturing, a sizable gain occurred in
construction.
II - 2
CHANGES IN EMPLOYMENT 1/(Thousands of jobs; based on seasonally adjusted data)
19781977 1978 QIII QIV Nov. Dec.
- - - Average monthly changes - - -Nonfarm payroll employment 2/ 284 296 56 369 447 250
Manufacturing 66 62 -10 146 164 124Durable 50 53 19 108 104 81Nondurable 16 8 -29 38 60 43
Construction 30 38 7 38 27 45Trade 79 65 45 47 65 -10Services and finance 82 77 71 79 130 48State and local government 28 16 -44 15 32 23
Private nonfarm production workers 215 220 69 290 397 184Manufacturing production workers 52 46 -20 131 148 127
Total employment 3/ 342 275 123 282 510 104Nonagricultural 336 268 129 288 609 -8
1/ Changes are from final month of preceding period to final month of periodindicated.
2/ Survey of establishments. Not strike adjusted.3/ Survey of households.
SELECTED UNEMPLOYMENT RATES(Per cent; based on seasonally adjusted data)
1973 1978Annual average QI QII QIII QIV Nov. Dec.
Total, 16 years and older 4.9 6.2 6.0 6.0 5.8 5.8 5.9
Teenagers 14.5 16.9 16.1 16.1 16.3 16.2 16.520-24 years old 7.8 10.2 9.5 9.4 9.0 9.0 9.3Men, 25 years and older 2.5 3.5 3.3 3.3 3.2 3.1 3.2Women, 25 years and older 4.0 5.0 5.1 5.2 4.9 4.9 5.0
White 4.3 5.4 5.2 5.2 5.1 5.0 5.2Black and oher 8.9 12.4 12.1 11.7 11.5 11.7 11.5
Fulltime workers 4.3 5.7 5.5 5.5 5.2 5.2 5.3
White collar 2.9 3.6 3.6 3.6 3.3 3.2 3.5Blue collar' 5.3 7.2 6.7 6.8 6.7 6.4 6.8
Craft and kindred 3.7 5.1 4.4 4.4 4.5 4.0 4.7Operatives, ex. transport 6.1 8.3 8.2 8.4 7.6 7.5 7.7

II - 3
INDUSTRIAL PRODUCTION(Percentage change from preceding period, seasonally adjusted)
1967 Pro- 1978portion I II III IV Nov. Dec.
Total 100.0 0.2 3.2 2.1 1.7 .6 .6Products 60.7 0.2 2.5 1.7 1.3 .7 .7
Final Products 47.8 -0.2 2.9 1.7 1.2 .6 .6Consumer Goods 27.7 -1.0 2.4 0.8 0.9 .5 .5
Durable 7.9 -2.7 6.1 - 1.0 .4 .1Automotive Prod. 2.8 -5.5 9.7 -0.3 3.6 1.8 -1.7Home Goods 5.1 -0.9 3.7 0.3 -0.7 -0.6 1.4
Nondurable 19.8 -0.2 0.7 1.1 1.0 0.6 0.5Equipment 20.1 1.0 3.9 3.0 1.5 0.6 0.8
Business Equipment 12.6 0.8 3.7 2.9 1.8 0.6 0.8
Intermediate Products 12.9 1.7 1.1 2.1 1.9 0.7 0.8Construction Supplies 6.4 1.4 1.1 2.9 2.1 0.7 0.9Business Supplies 6.5 2.1 1.0 1.4 1.6 0.7 0.7
Materials 39.3 0.2 4.2 2.5 2.3 0.6 0.5Durable 20.4 0.1 4.4 4.4 2.9 0.6 0.8Nondurable 10.5 1.9 3.3 - 1.8 0.7 0.2Energy 8.5 -2.3 5.4 1.2 1.3 0.4 0.5
SELECTED CAPACITY UTILIZATION RATES(Per cent, seasonally adjusted)
1973- 1948- Dec. 781974 1977 1977 1978 less
High High Dec. Nov.1/ Dec.2/ Dec. 77
Manufacturing 88.0 91.7 83.0 85.7 85.9 2.9Primary Processing 93.6 94.4 84.5 88.5 88.6 4.1Advanced Processing 85.4 91.8 82.2 84.2 84.5 2.3
Materials 93.1 93.1 81.9 87.4 87.6 5.7Durable Goods Materials 92.5 93.1 80.1 87.1 87.6 7.5.,
Basic Iron & Steel 105.2 105.2 77.4 92.8 n.a. 15.4
Nondurable Goods Materials 94.6 94.6 85.8 88.3 88.2 2.4Energy Materials 94.6 96.1 81.4 86.4 86.6 5.2
Major Materials 95.9 95.9 84.0 89.1 89.1 5.1
1/ Preliminary2/ Estimated3/ November 1978 less December 1977.
II - 4
Industrial production rose 0.6 per cent in December, about in
line with the average monthly increase for 1978 as a whole. Large
advances occurred in output of both materials and final products. Produc-
tion of business equipment continued to rise throughout the fourth
quarter, although at a rate of increase less than the unusually strong
pace recorded during the spring and summer. Consumer goods production
rose at a moderate 3-3/4 per cent annual rate in the fourth quarter--
slightly above the third quarter pace.
Capacity utilization in the manufacturing sector reached 85.9
per cent in December, up almost 3 percentage points from a year earlier
and only 2 percentage points below the 1973 high. The December rate for
materials industries showed somewhat more slack, although rates for
some materials, especially in the durable sector, moved up sharply
over the last year.
Personal Income and Consumer Spending
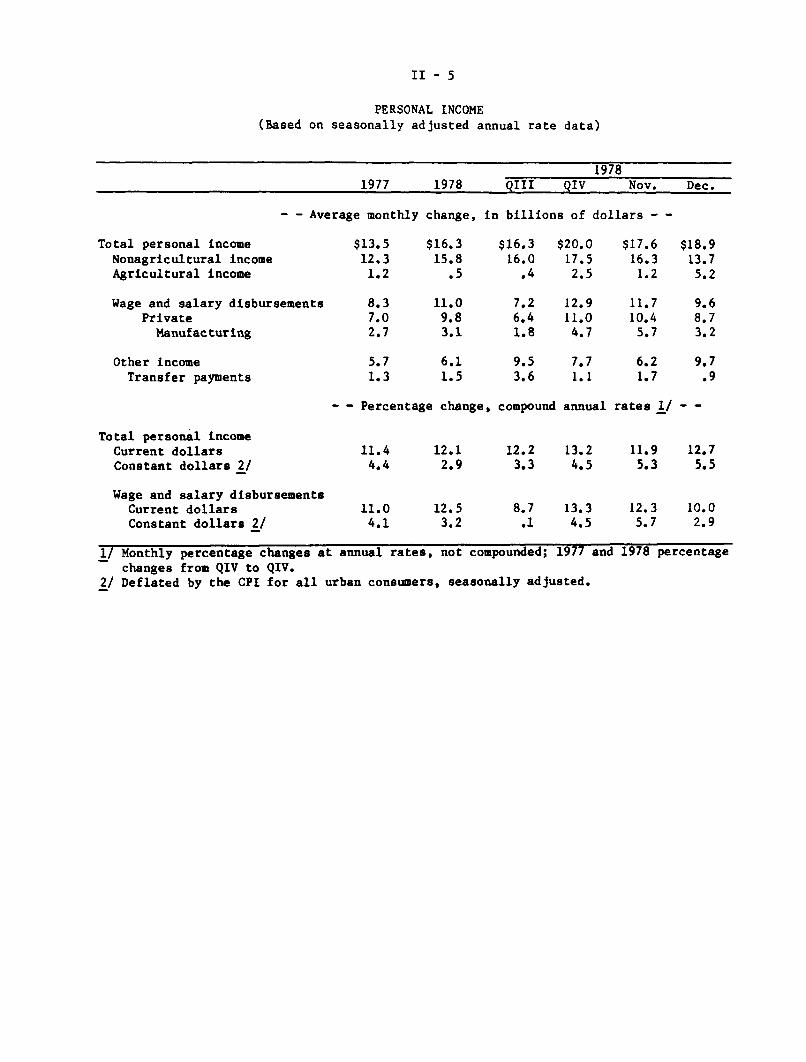
Total personal income increased appreciably in November and
December. Reflecting the large recent employment gains, advances in pri-
vate wage and salary disbursements continued to be substantial. Additionally,
farm income rose rapidly in December because of Federal price-target
deficiency payments to grain farmers. Real personal income rose at a
4-1/2 per cent annual rate in the final quarter of 1978--the largest
increase in a year.
II - 5
PERSONAL INCOME(Based on seasonally adjusted annual rate data)
19781977 1978 QIII QIV Nov. Dec.
- - Average monthly change, in billions of dollars -
Total personal incomeNonagricultural incomeAgricultural income
Wage and salary disbursementsPrivateManufacturing
Other incomeTransfer payments
Total personal incomeCurrent dollarsConstant dollars 2/
Wage and salary disbursementsCurrent dollarsConstant dollars 2/
$13.5 $16.3 $16.3 $20.0 $17.6 $18.912.3 15.81.2 .5
8.3 11.07.0 9.82.7 3.1
5.7 6.11.3 1.5
- - Percentage change,
11.44.4
11.04.1
12.12.9
12.5
16.0 17.5.4 2.5
7.26.41.8
9.53.6
compound
12.911.0
4.7
7.71.1
annual
12.2 13.23.3 4.5
16.3 13.71.2 5.2
11.7 9.610.4 8.75.7 3.2
6.2 9.71.7 .9
rates 1/ - -
11.9 12.75.3 5.5
8.7 13.3 12.3 10.0.1 4.5 5.7 2.9
1/ Monthly percentage changes at annual rates, not compounded; 1977 and 1978 percentagechanges from QIV to QIV.
2/ Deflated by the CPI for all urban consumers, seasonally adjusted.

II - 6
Consumer spending also increased strongly throughout the final
quarter of 1978. Retail sales excluding autos and mainly nonconsumer
items rose 0.8 per cent in December following a 1,9 per cent increase in
November; for the fourth quarter as a whole, sales in this grouping
advanced at a 3-1/2 per cent rate. Purchases at general merchandise stores
increased about 1-1/2 per cent in December, as did sales at furniture and
appliance stores. However, apparel and food sales declined following
large increases earlier in the quarter,
Sales of domestic autos were at a 9.2 million annual rate in
both December and the first twenty days of January, up 350,000, annual
rate, from November and at about the same rate as over the July-October
period. By size class, only sales of intermediate-sized cars were
somewhat reduced from their pace over most of 1978. Imported units sold
at a 1.9 million unit rate in December, slightly lower than in November
but about the same as over the last two years. During the fourth quarter,
foreign units accounted for 18 per cent of total sales, slightly lower
than a year earlier.
Business Investment
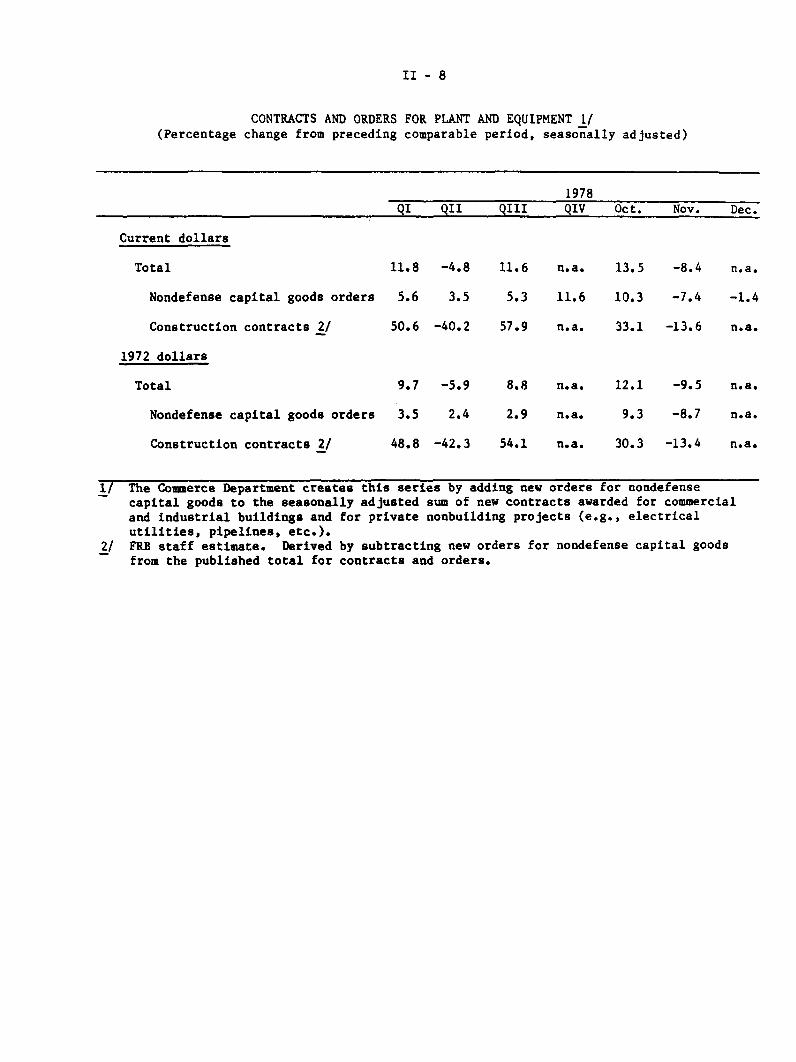
Near-term business investment spending commitments remained at
a high level in the fourth quarter, although there was some weakness in
recent orders and contracts following strong increases this past fall.
New orders for nondefense capital goods fell about 9 per cent over the
final two months of the year; even so, these bookings in the fourth
quarter as a whole were 11.4 per cent above the third quarter level.

II - 7
RETAIL SALESPercentage change from previous period;based onseasonally adjusted data)
1978QIII QIV Oct. Nov. Dec.
Total sales 2.0 4.0 1.6 1.2 1.0
(Real) 1/ .2 1.9 .9 .5 .2
Total, less auto andnonconsumption items 2.1 3.6 .7 1.9 .8
GAF 2/ 2.1 3.1 -.4 2.7 .8
Durable 2.8 6.2 3.4 .5 2.9Auto .8 5.8 4.2 -.9 3.4Furniture & appliances 2.8 2.7 -.2 .2 1.4
Nondurable 1.5 2.9 .6 1.5 .1Apparel 4.6 3.4 -.8 4.2 -2.0Food 1.1 2.6 1.6 .8 -.4General merchandise .9 3.2 -.3 3.1 1.6Gasoline -.1 4.7 .7 1.8 1.1
1/ Deflated by all commodities SA consumer price index.2/ General merchandise, apparel, and furniture and appliance stores.
AUTO SALES(Seasonally adjusted annual rates; millions of units)
1978QIII QIV Oct. Nov. Dec.
Total 11.2 11.1 11.2 10.9 11.1
Imports 2.0 2.0 2.0 2.1 1.9
Domestic 9.2 9.1 9.2 8.8 9.2
II - 8
CONTRACTS AND ORDERS FOR PLANT AND EQUIPMENT 1/(Percentage change from preceding comparable period, seasonally adjusted)
1978
QI QII QIII QIV Oct. Nov. Dec.
Current dollars
Total 11.8 -4.8 11.6 n.a. 13.5 -8.4 n.a.
Nondefense capital goods orders 5.6 3.5 5.3 11.6 10.3 -7.4 -1.4
Construction contracts 2/ 50.6 -40.2 57.9 n.a. 33.1 -13.6 n.a.
1972 dollars
Total 9.7 -5.9 8.8 n.a. 12.1 -9.5 n.a.
Nondefense capital goods orders 3.5 2.4 2.9 n.a. 9.3 -8.7 n.a.
Construction contracts 2/ 48.8 -42.3 54.1 n.a. 30.3 -13.4 n.a.
1/ The Commerce Department creates this series by adding new orders for nondefensecapital goods to the seasonally adjusted sum of new contracts awarded for commercialand industrial buildings and for private nonbuilding projects (e.g., electricalutilities, pipelines, etc.).
2/ FRB staff estimate. Derived by subtracting new orders for nondefense capital goods
from the published total for contracts and orders.

II - 9
Bookings for machinery, which are indicative of the general trend in the
demand for equipment, rose 6.4 per cent in the fourth quarter and stood
16 per cent above the year-earlier level. As has been the case throughout
the year, gains in the fourth quarter were particularly strong in the
nonmachinery category of nondefense capital goods orders, which consists
largely of aircraft and ships.
Nonresidential construction contract awards, a series that is
quite volatile from month to month, were about the same in the fourth
quarter as in the third, largely because of the extremely high level in
October. The total value of contracts awarded in 1978 were about 20
per cent above the value awarded in the preceding year.
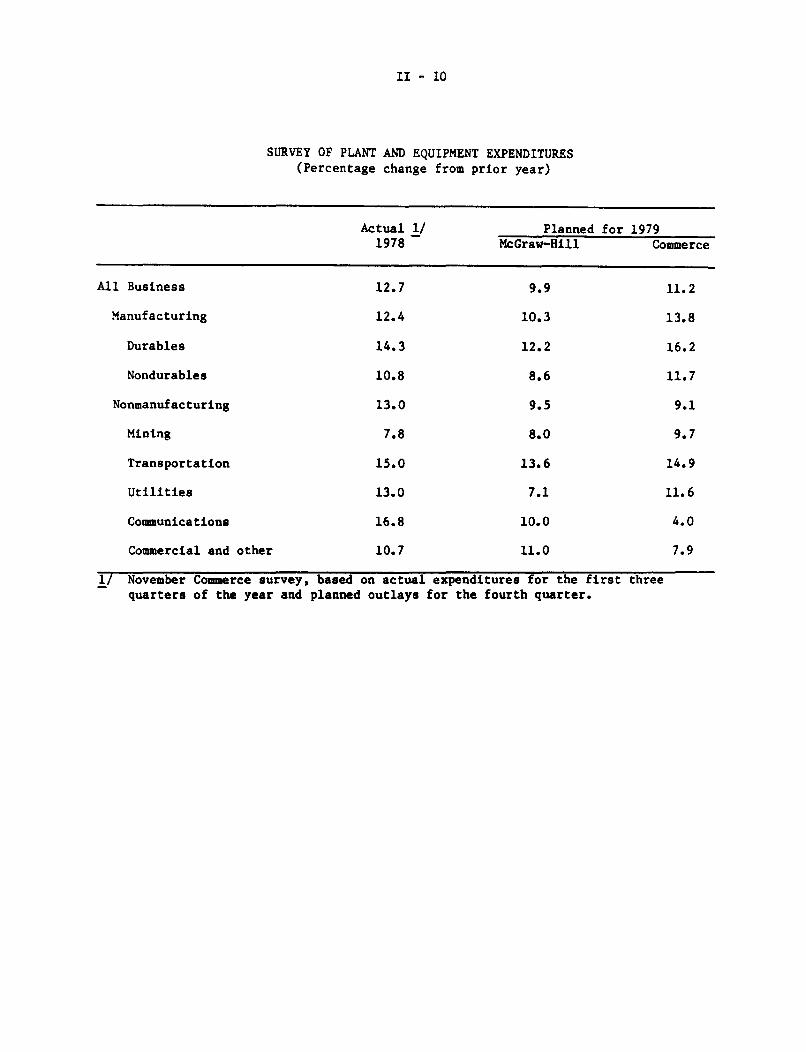
Surveys of business spending intentions suggest a slowing of
outlays later this year. The Commerce Department's annual survey con-
ducted in November and December indicated that business is anticipating
only moderate growth in capital spending in 1979. These survey results,
which are generally in line with earlier private readings, show business
planning to increase capital outlays by 11.2 per cent in 1979, with con-
siderable strength evident in the plans of the manufacturing sector.
Respondents expect capital goods prices to rise about 8 per cent in 1979,
thus implying only 3 per cent growth in real terms for the year. This
survey has been a fairly reliable indicator of future capital spending
over its nine year history; in each of the last three years it has under-
estimated the eventual nominal increase by about 1 to 1-1/2 percentage
points.
II - 10
SURVEY OF PLANT AND EQUIPMENT EXPENDITURES(Percentage change from prior year)
Actual 1/ Planned for 19791978 McGraw-Hill Commerce
All Business 12.7 9.9 11.2
Manufacturing 12.4 10.3 13.8
Durables 14.3 12.2 16.2
Nondurables 10.8 8.6 11.7
Nonmanufacturing 13.0 9.5 9.1
Mining 7.8 8.0 9.7
Transportation 15.0 13.6 14.9
Utilities 13.0 7.1 11.6
Communications 16.8 10.0 4.0
Commercial and other 10.7 11.0 7.9
1/ November Commerce survey, based on actual expenditures for the first threequarters of the year and planned outlays for the fourth quarter.

II - 11
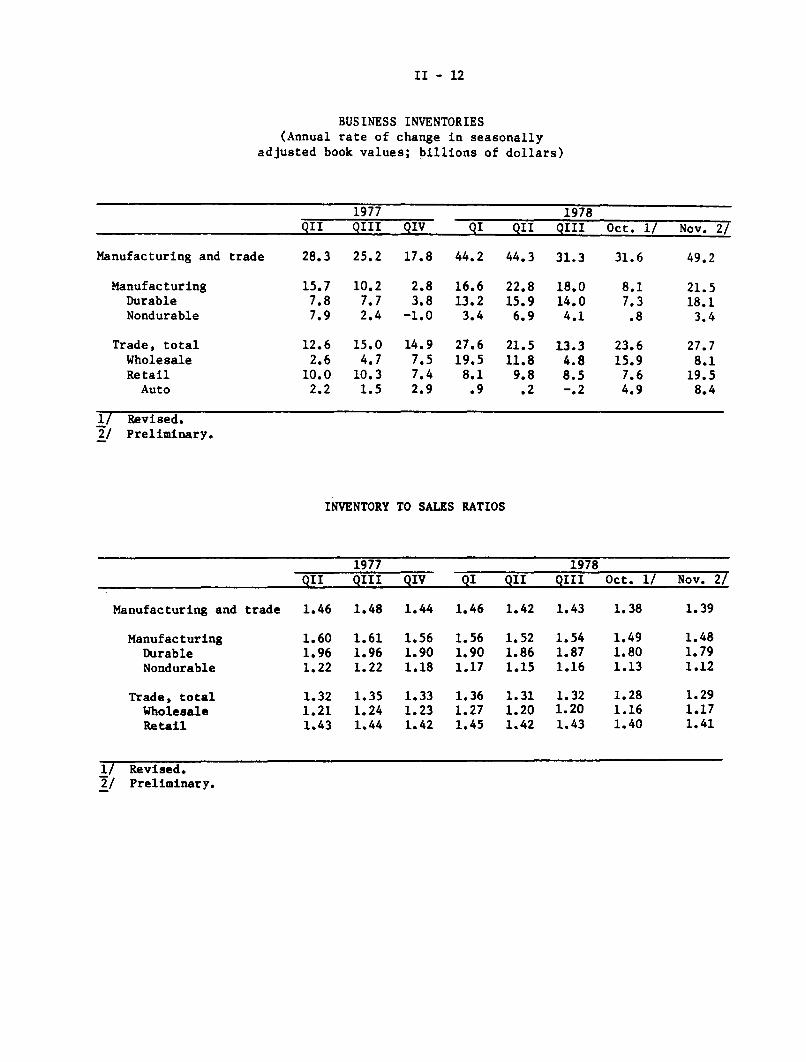
Inventory investment in book value terms was sizable in November
as manufacturing and trade stocks increased at an annual rate of $49.2
billion. This compares with a $31-1/2 billion rise in October and was
the largest gain since April. The November rise in stocks was accompanied
by only a moderate increase in sales, and the ratio of inventory book
values to sales for total manufacturing and trade edged up. Nonetheless,
the overall stock-sales ratio in book value terms remained low on an
historical basis.
Accumulation at manufacturers--$21.5 billion, annual rate--
accounted for almost half of the total November increase and was the
largest rise since June. The increase in trade inventories was of the
same order of magnitude as in October. Most of this rise was at
retailers, particularly at motor vehicle dealers where unit stocks
were also up in November but leveled off in December.
Inventory data had indicated the emergence during the fall
of excess stocks relative to sales at retailers of general merchandise.
However, strong pre-Christmas sales and some adjustments in production
have worked toward correcting this imbalance; as a result, the inventory
to sales ratio for general merchandisers declined in November for the
first time since February.
Residential Construction
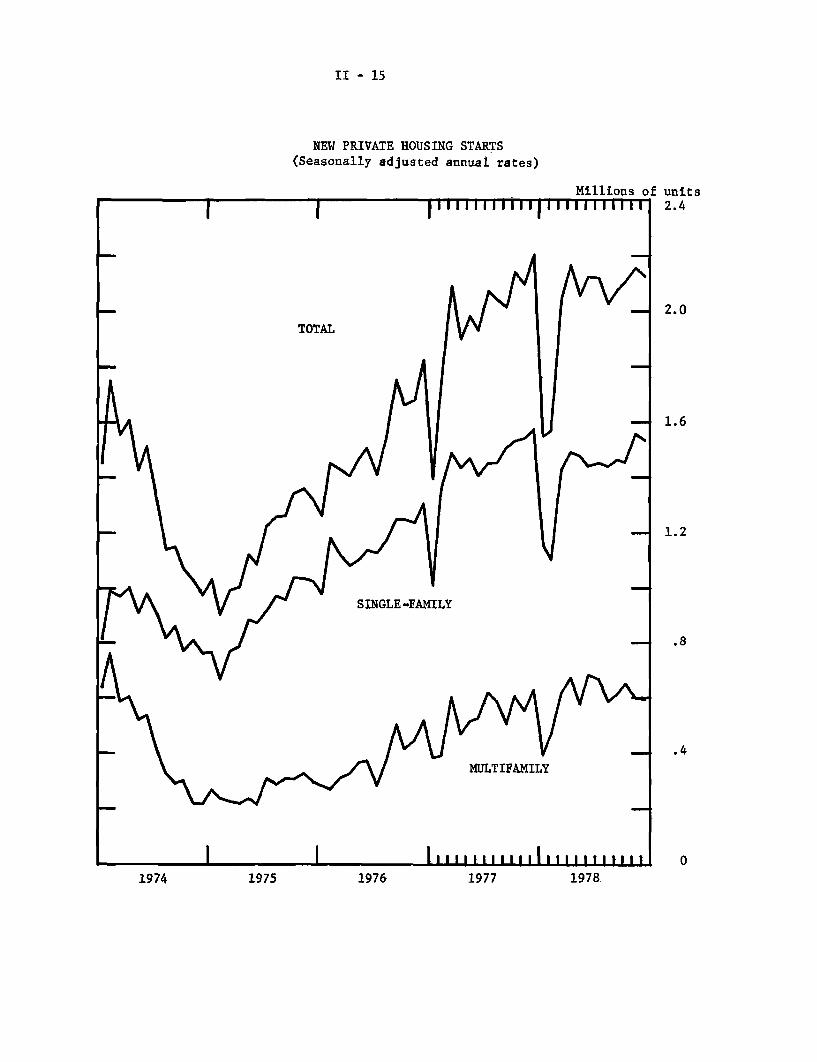
Overall housing activity remained surprisingly strong late in
1978. Total private housing starts were at a 2.13 million unit annual
rate in December, down only marginally from the November pace. Starts
II - 12
BUSINESS INVENTORIES(Annual rate of change in seasonally
adjusted book values; billions of dollars)
1977 1978QII QIII QIV QI QII QIII Oct. 1/ Nov. 2/
Manufacturing and trade 28.3 25.2 17.8 44.2 44.3 31.3 31.6 49.2
Manufacturing 15.7 10.2 2.8 16.6 22.8 18.0 8.1 21.5Durable 7.8 7.7 3.8 13.2 15.9 14.0 7.3 18.1Nondurable 7.9 2.4 -1.0 3.4 6.9 4.1 .8 3.4
Trade, total 12.6 15.0 14.9 27.6 21.5 13.3 23.6 27.7Wholesale 2.6 4.7 7.5 19.5 11.8 4.8 15.9 8.1Retail 10.0 10.3 7.4 8.1 9.8 8.5 7.6 19.5
Auto 2.2 1.5 2.9 .9 .2 -. 2 4.9 8.4
1/ Revised.2/ Preliminary.
INVENTORY TO SALES RATIOS
1977 1978
QII QIII QIV QI QII QIII Oct. 1/ Nov. 2/
Manufacturing and trade 1.46 1.48 1.44 1.46 1.42 1.43 1.38 1.39
Manufacturing 1.60 1.61 1.56 1.56 1.52 1.54 1.49 1.48Durable 1.96 1.96 1.90 1.90 1.86 1.87 1.80 1.79Nondurable 1.22 1.22 1.18 1.17 1.15 1.16 1.13 1.12
Trade, total 1.32 1.35 1.33 1.36 1.31 1.32 1.28 1.29Wholesale 1.21 1.24 1.23 1.27 1.20 1.20 1.16 1.17Retail 1.43 1.44 1.42 1.45 1.42 1.43 1.40 1.41
1/ Revised.2/ Preliminary.
II - 13
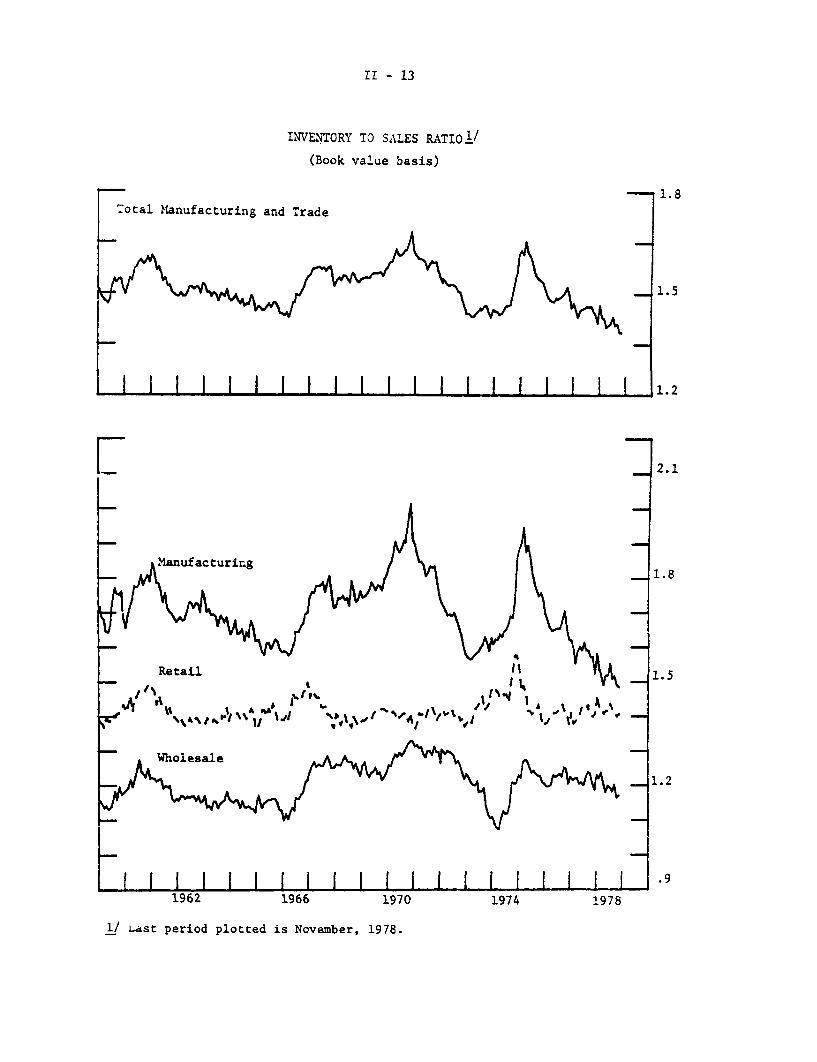
INVENTORY TO SALES RATIOI/
(Book value basis)
1.8Total Manufacturing and Trade
1.5
I I I I 1 1.2
1/ Last period plotted is November, 1978.
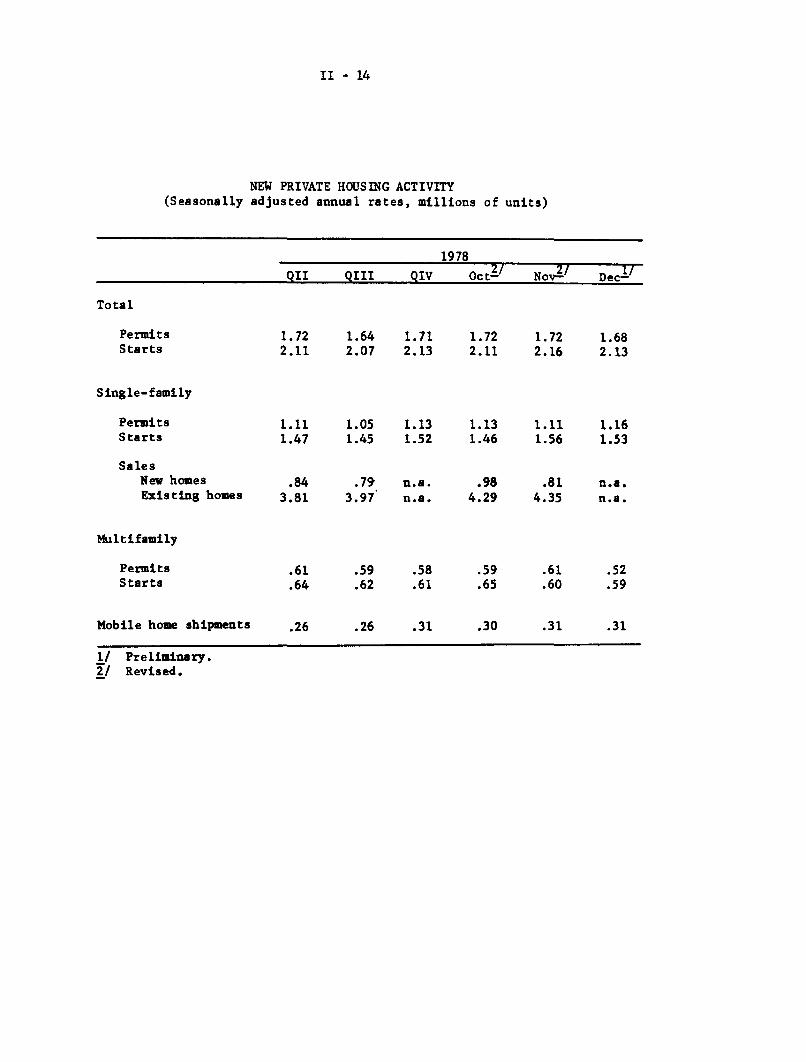
II - 14
NEW PRIVATE HOUSING ACTIVITY(Seasonally adjusted annual rates, millions of units)
1978
QII QIII QIV Oct2/ Nov2/ Dec 1 /
Total
Permits 1.72 1.64 1.71 1.72 1.72 1.68Starts 2.11 2.07 2.13 2.11 2.16 2.13
Single-family
Permits 1.11 1.05 1.13 1.13 1.11 1.16Starts 1.47 1.45 1.52 1.46 1.56 1.53
SalesNew homes .84 .79 n.a. .98 .81 n.a.Existing homes 3.81 3.97' n.a. 4.29 4.35 n.a.
Multifamily
Permits .61 .59 .58 .59 .61 .52Starts .64 .62 .61 .65 .60 .59
Mobile home shipments .26 .26 .31 .30 .31 .31
1/ Preliminary.2/ Revised.
II - 15
NEW PRIVATE HOUSING STARTS(Seasonally adjusted annual rates)
Millions of unitsI l llil l llll l l il 2.4
S 2.0
TOTAL
- 1.6
1.2
SINGLE -FAMILY
.8
.4
SMULTIFAMILY
111 01976 19771974 1975 1978.

II - 16 -
have now fluctuated in a narrow band slightly above 2 million units for
10 months.
Much of the strength in the housing sector over the last few
months has been in the single-family market where--despite a fractional
decline in December--the average rate of starts in November and December
was close to the recent series record set in 1977 Q4. Moreover, single-
family home sales also remained strong in late 1978. Sales of new homes
in November were down from the advanced October rate but about equal to
the strong selling pace earlier in 1978. Moreover, sales of existing
homes continued their record-setting pace by rising more than 1 per cent
in November. However, while sales have remained generally brisk, the
median number of months on the market for new homes sold rose to an
average of about 4-1/2 months in October and November--up 1/2 month from
the rate experienced during most of the first nine months of 1978.
In the multifamily sector, starts declined for the second
successive month in December. This recent weakness followed a surge in
September and October that was apparently related to the large number of
units started around the end of the fiscal year under HUD's Section 8
rental assistance program.
Government Sector Activity
The Federal deficit, on a National Income and Product Accounts
basis, is estimated to have been at a $20 billion annual rate in the
fourth quarter of 1978, down from a $23 billion deficit in the third
quarter of the year. In the fourth quarter, a sizable increase in

II - 17
receipts more than offset a sharp rise in outlays. Purchases of goods
and services rose sharply, mainly because of an increase in Commodity
Credit Corporation nonrecourse loans and the 5.5 per cent Federal pay
raise in October. Outlays for interest also rose sharply in the final
quarter of 1978. The gain in receipts--20 per cent at an annual rate--
reflected the strong growth in income.
The Administration now estimates spending and receipts in
fiscal year 1979 at $493 billion and $456 billion (on a Unified Budget
basis), respectively. For fiscal year 1980, beginning October 1, 1979,
the Administration has proposed a budget with outlays of $532 billion,
receipts of $503 billion, and a deficit of $29 billion. (A detailed
description of the President's budget is presented in Appendix A.)
Recent data continue to indicate a moderation in growth of total
State and local government spending. State and local government employ-
ment increased by about 25,000 in December, following a larger gain in
November. Nevertheless, these recent gains did not make up for the
earlier declines in employment that occurred in the July through October
period. The net employment loss is evidently attributable to cutbacks
in CETA hirings, which appear to reflect uncertainty among local public
sponsors about future federal funding of the program. The value of new
construction put-in-place declined by $1.5 billion in November, but
remains at a high level following very strong increases last spring
and summer; in real terms, these expenditures were 11 per cent above year-
earlier levels.

II - 18
Prices
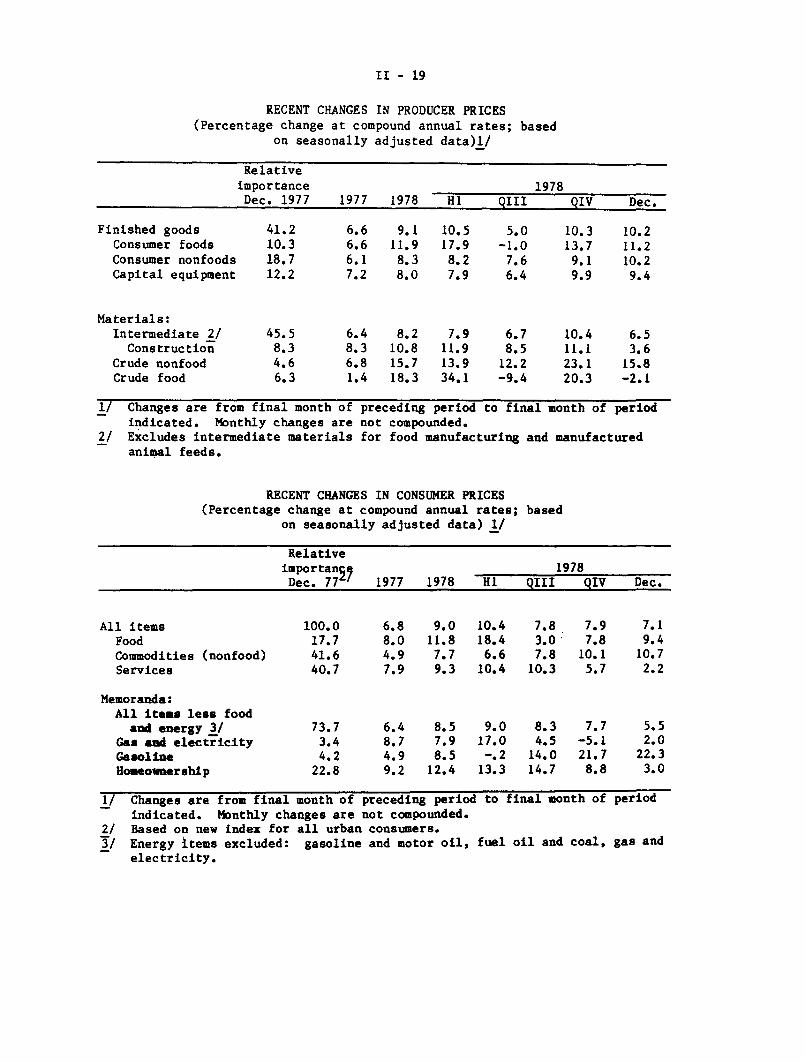
Inflation continued at a rapid pace in the final months of
1978. The gross business product fixed-weight price index--a broad
measure of prices--rose at an 8-1/4 per cent annual rate in the fourth
quarter, and producer prices rose at a 10-1/4 per cent rate. Increases
in the consumer price index did slow a bit during the last two months of
1978, but this was mainly a result of factors that appear to be temporary--
the November moderation in the advance of food prices and the December
decline in California property taxes resulting from Proposition 13.
Increases in retail food prices accelerated again in December.
Meat prices rose considerably in both months, but in November the rise
was offset partially by declines in prices of fruits and vegetables,
Recent developments in agricultural commodity markets indicate a sharp
increase in farm prices in January associated in part with adverse weather
conditions in the Midwest, Texas, and California.
Energy prices accelerated in the fourth quarter; electricity
rates declined on average, but this was more than offset by a faster rise
in prices of gasoline and other petroleum-based fuels. Increases in
retail gasoline prices averaged about 1-3/4 per cent per month in
November and December; since last June gasoline prices have risen at a
17-1/2 per cent annual rate,
Outside the food and energy areas, the December consumer price
rise was at about the same rate as earlier in the year, if an adjustment
is made for the exceptional cut in property taxes in California resulting
II - 19
RECENT CHANGES IN PRODUCER PRICES(Percentage change at compound annual rates; based
on seasonally adjusted data)1/
Relativeimportance 1978Dec. 1977 1977 1978 HI QIII QIV Dec.
Finished goods 41.2 6.6 9.1 10.5 5.0 10.3 10.2Consumer foods 10.3 6.6 11.9 17.9 -1.0 13.7 11.2Consumer nonfoods 18.7 6.1 8.3 8.2 7.6 9.1 10.2Capital equipment 12.2 7.2 8.0 7.9 6.4 9.9 9.4
Materials:Intermediate 2/ 45.5 6.4 8.2 7.9 6.7 10.4 6.5
Construction 8.3 8.3 10.8 11.9 8.5 11.1 3.6Crude nonfood 4.6 6.8 15.7 13.9 12.2 23.1 15.8Crude food 6.3 1.4 18.3 34.1 -9.4 20.3 -2.1
1/ Changes are from final month of preceding period to final month of periodindicated. Monthly changes are not compounded.
2/ Excludes intermediate materials for food manufacturing and manufacturedanimal feeds.
RECENT CHANGES IN CONSUMER PRICES(Percentage change at compound annual rates; based
on seasonally adjusted data) 1/
Relativeimportan q 1978Dec. 77' 1977 1978 HI QIII QIV Dec.
All items 100.0 6.8 9.0 10.4 7.8 7.9 7.1Food 17.7 8.0 11.8 18.4 3.0 7.8 9.4Commodities (nonfood) 41.6 4.9 7.7 6.6 7.8 10.1 10.7Services 40.7 7.9 9.3 10.4 10.3 5.7 2.2
Memoranda:All items less food
and energy 3/ 73.7 6.4 8.5 9.0 8.3 7.7 5.5Gas and electricity 3.4 8.7 7.9 17.0 4.5 -5.1 2.0Gasoline 4.2 4.9 8.5 -. 2 14.0 21.7 22.3Homeownership 22.8 9.2 12.4 13.3 14.7 8.8 3.0
1/ Changes are from final month of preceding period to final month of periodindicated. Monthly changes are not compounded.
2/ Based on new index for all urban consumers.3/ Energy items excluded: gasoline and motor oil, fuel oil and coal, gas and
electricity.

II - 20
from Proposition 13. This special factor--which reduced the rise in
the total CPI for December from 0.8 per cent to 0.6 per cent--contributed
to a marked slowing in the increases in the cost of homeownership.
The price relief due to this factor is a one-time occurrence, and the
resumption of substantial increases in homeownership costs seem
likely as recent increases in mortgage rates show up in the CPI. Move-
ments in the mortgage interest rate component of the CPI generally
reflect changes in mortgage commitment rates with about a three to
four month lag.
From December 1977 to December 1978 consumer prices rose 9 per
cent, about 2-1/4 percentage points more than during 1977. Homeownership
prices rose about 12-1/2 per cent--over 3 percentage points more than in
1977--and contributed about 3/4 percentage point to the acceleration in
the overall CPI increase. The other major contributors to the CPI
acceleration in 1978 were food and used cars, which were responsible for
nearly 3/4 and 1/2 percentage points of the 1978 acceleration, respectively.
Excluding these 3 components, the acceleration in the CPI increase was
still about 1/2 percentage point.
Wages, Productivity and Costs
Wages, as measured by the average hourly earnings index, rose
almost 8 per cent in the fourth quarter--slightly slower than the rate
over the year as whole. Manufacturing wages continued to increase at
about the 8-1/4 per cent rate recorded in the first nine months of this
year. Major collective bargaining settlements in the fourth quarter

II - 21
resulted in first year wage-rate adjustments averaging 7-3/4 per cent,
similar to those negotiated earlier in the year. In January, the Oil,
Atomic and Chemical Workers Union reached a tentative settlement in
their wage negotiations with Gulf Oil which appears to comply with the
Administration's pay standard. The two-year contract calls for increases
in total wages and benefits of 8 per cent in the first year and 5 per
cent in the second year; the contract also includes a wage reopening in
the second year but stipulates that further adjustments must be consistent
with the pay standard.
Labor costs continued to rise at a rapid rate in the fourth
quarter. Hourly compensation, which includes both wages and benefits,
increased about 9 per cent in the final quarter of 1978 and about 9-3/4
per cent over the four quarters of the year. The rapid growth of output
in the fourth quarter was accompanied by a productivity gain of 2-1/4 per
cent in the nonfarm business sector; this was the same pace as in the
third quarter and a marked improvement from the productivity decline
recorded in the first half of the year. Reflecting these movements in
compensation and productivity, unit labor costs growth in the fourth
quarter slowed somewhat; nevertheless, the increase over the four
quarters of 1978 was 9 per cent--the largest four quarters advance in
these costs since early 1975.

II - 22
HOURLY EARNINGS INDEX(Percentage change at compound annual rates; based on seasonally adjusted data) l/
19781977 2/ 1978 QI QII QIII QIV
Total private nonfarm 7.5 8.2 9.2 8.4 7.3 7.9
Manufacturing 8.3 8.2 8.6 7.7 8.1 8.3Contract construction 4.0 7.6 8.1 10.5 6.6 5.5Transportation and publicutilities 9.1 6.8 8.2 7.9 4.5 6.5Total trade 7.4 9.3 12.3 7.9 8.8 8.3Services 7.1 7.5 9.6 6.5 5.5 8.5
1/ Excludes the effect of interindustry shifts in employment and fluctuations inovertime pay in manufacturing.
2/ Changes are from final quarter of preceding period to final quarter of periodindicated.
MAJOR COLLECTIVE BARGAINING SETTLEMENTS(Percentage change at annual rates)
Average adjustment1975 1976 1977 1978
Wage-rate settlements (1,000 or more workers)First year adjustments 10.2 8.4 7.8 7.7Average over life of contracts 1/ 7.8 6.4 5.8 6.5
Wage and benefit settlements (5,000 or moreworkers)First year adjustments 11.4 8.5 9.6 8.4Average over life of contracts 1/ 8.1 6.6 6.2 6.5
Effective wage-rate adjustments (1,000 ormore workers) 8.7 8.1 8.0 8.0Current settlements 2.8 3.2 3.0 2.0Prior settlements 3.7 3.2 3.2 3.7Escalator provisions 2.2 1.6 1.7 2.3
1/ Excluding cost-of-living adjustments.

II - 23
PRODUCTIVITY AND COSTS(Percentage change from preceding period at compound annual rates;
based on seasonally adjusted data) 1/
19781977 1978 QI QII QIII QIV
Output per hour
Total private business 1.5 .5 -4.5 1.2 3.5 2.1Nonfarm business 1.3 .8 -3.1 1.7 2.3 2.3Manufacturing 2.9 3.5 -5.1 8.3 10.8 .8
Durable 2.6 3.1 -6.8 11.3 10.2 -1.2Nondurable 3.5 4.2 -2.6 3.9 11.8 4.2
Compensation per hour
Total private business 7.5 9.8 12.1 8.1 10.4 8.7Nonfarm business 7.6 9.8 12.2 8.2 9.6 9.1Manufacturing 9.0 9.6 11.6 7.4 10.6 9.0
Durable 9.8 9.4 10.4 7.5 10.4 9.2Nondurable 7.2 9.5 13.6 7.2 9.7 7.6
Unit labor costs
Total private business 5.8 9.2 17.4 6.8 6.7 6.5Nonfarm business 6.3 8.9 15.7 6.4 7.1 6.7Manufacturing 5.9 5.9 17.7 -.8 -.2 8.1
Durable 7.0 6.1 18.5 -3.4 .2 10.5Nondurable 3.6 5.1 16.6 3.2 -1.9 3.3
1/ Changes are from final quarter of preceding period to final quarter of periodindicated.
III-T-1SELECTED DOMESTIC FINANCIAL DATA
Latest data Net Change from:
Indicator Month Three YearPeriod Level ago months ago ago
$ billions Per cent at annual ratesMonetary and credit aggregates1/
Total reserves January 41.4pe -4.7 -0.8 4.9Nonborrowed reserves January 40.5pe -4.3 3.5 4.0Money supply
M1 January 361.3pe 0.7 -0.8 5.7Ml+ January 582.6pe -3.3 -4.2 4.0M2 January 872 .6 pe 0.8 2.4 6.9M3 January 1503.9pe 4.2 5.4 8.5
Time and savings deposits (less CDs) January 511.4pe 1.2 4.7 7.8CDsa / January 100.7pe 3.7 12.5 24.4Thrift deposits (S&Ls + MSBs+ Credit Unions) January 631.5pe 9.4 9.7 10.7Bank credit (end of month) December 971.1 1.1 5.9 10.9
Net Change from:Latest data Three
Indicator Per cent Month months YearPeriod or index ago ago ago
Market yields and stock pricesFederal funds wk. endg. 1/24/79 10.05 .80 1.27 3.28Treasury bill (90 day) " 1/24/79 9.38 .08 1.71 2.92Commercial paper (90-119 day) " 1/24/79 10.19 -. 33 1.10 3.40New utility issue Aaa " 1/19/79 9.54 - -- .86Municipal bonds (Bond Buyer) 1 day 1/25/79 6.30 -. 31 .09 .60FNMA auction yield (FHA/VA) 1/23/79 10.73 -.20 -.03 1.51Dividend price ratio (common
stocks) wk endg. 1/24/79 5.30 -.20 -.03 -.12NYSE index (12/31/65=50) end of day 1/29/79 56.85 3.23 4.20 7.40
Net Change or Gross OfferingsLatest Year Year to Date
Period Data ago 1978 1977
Credit demands /Business loans at commercial banks-Consumer instalment credit outstanding- //Mortgage debt outstanding (major holders)--Corporate bonds (public offerings)Municipal long-term bonds (gross offerings)Federally sponsored agcy. (net borrowing)U.S. Treasury (net cash borrowing)
2/3/e -pe-
Seasonally adjusted.$ billions, not at annual ratesIncludes comm'l banks, S&Ls, MSBs, life ins.EstimatedPartially estimated.
DecemberDecemberNovemberDecemberDecemberDecemberJanuary
-0.13.7e10.21.2e3.6e2.1e3.7
1.43.69.41.53.60.86.0
26.543.989.420.1e47.9e23.4 6.83.7 6.0
cos, FNMA, and GNMA.
21.735.0e80.024.246.7
III - 1
DOMESTIC FINANCIAL DEVELOPMENTS
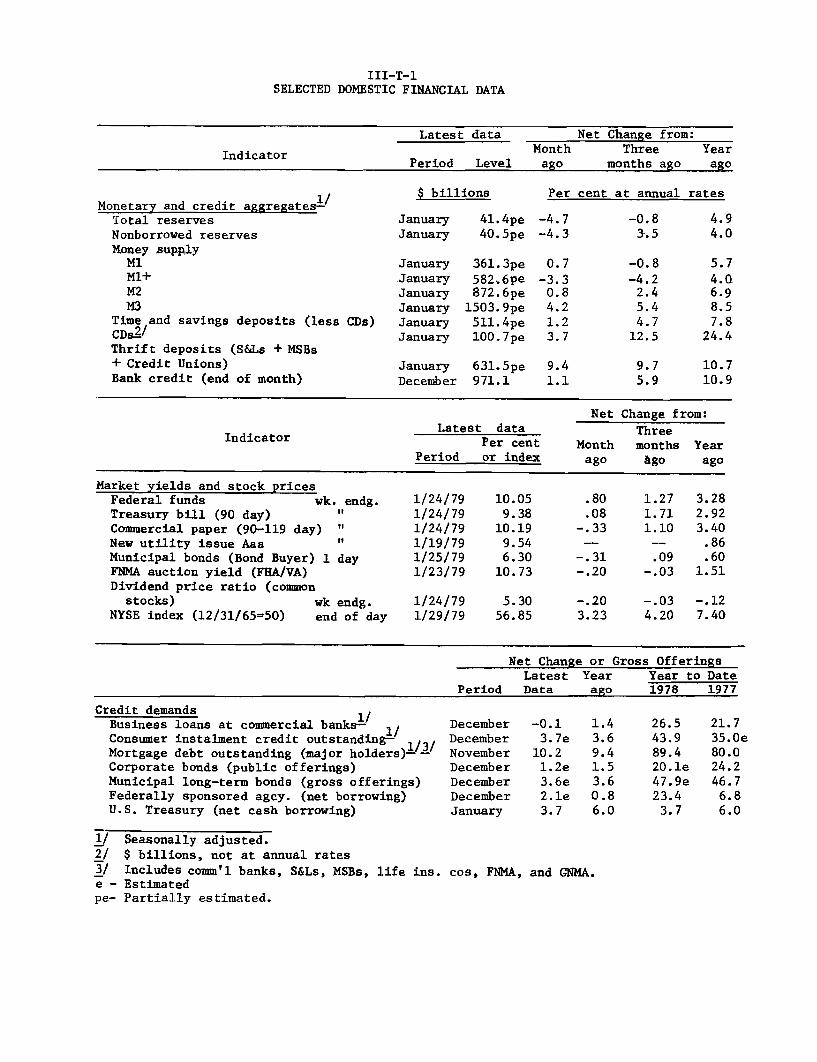
Credit flows to the private nonfinancial sectors of the economy
appear to have been smaller in December and January than during the
previous two-month period. During December, more moderate growth in
short- and intermediate-term business credit reflected flatness in business
loans at commercial banks combined with continued sizable increases in
nonfinancial commercial paper and finance company loans. In January, bank
business loans seem to have resumed growing, but the issuance of nonfinan-
cial commercial paper has slowed. Longer-term business borrowing diminished
in December and January, although the relatively light volume of gross
bond and stock financing was supplemented by apparently heavy takedowns
of mortgage loans from insurance companies and commercial banks. Among
households, consumer instalment credit and mortgage borrowing appear to
have weakened somewhat in December. In the public sector, gross borrowing
by State and local governments increased in the final month of 1978 but
declined in January. In contrast, net offerings of Treasury and sponsored
agency securities were lower in December than in the previous month,
before expanding early in 1979.
Both M-1 and M-2 grew slowly in December and January. The modest
expansion in the broader aggregate reflected further substantial declines
in savings deposits together with a moderate expansion in time deposits.
Although sales of money market certificates (MMCs) have remained quite
brisk, total deposits subject to interest rate ceilings declined in December
for the second month in a row. Deposit growth at thrift institutions in
December and January is estimated to have been somewhat less than in the
preceding several months.
III - 2
Most money market interest rates have declined 25 to 75 basis
points since the last FOMC meeting. Interest rates moved higher following
the December meeting as a further rise in the System's Federal funds rate
objective into the 10 per cent area became apparent; these increases sub-
sequently were more than reversed for most instruments, due in part to
the persistent weakness in the major monetary aggregates and the relative
stability in the foreign exchange value of the dollar. Yields on shorter-term
Treasury bills are slightly above their levels at the December meeting, how-
ever, reflecting sales of bills by the System, an increase in Treasury issu-
ance of 3-month bills, and smaller purchases of bills in January by foreign
central banks. Longer-term Treasury and municipal bond yields meanwhile
have declined about 10 to 25 basis points, but primary mortgage rates
have edged higher. Stock prices fell slightly in late December, and the
climbed 7 to 10 per cent in January.
Monetary Aggregates
M-l expanded at a 1-3/4 per cent pace in December, and it has
remained about unchanged on average since year end. Given moderate growth
in October and sharp contraction during November, the average level of M-1
was about the same in January as four months earlier. On a quarterly
average basis, M-1 grew at only a 4-1/2 per cent annual rate in the final
three months of 1978, down from 7-1/2 per cent in the third quarter and
its slowest pace in more than two years. The cumulative impact of recent
increases in market interest rates probably is responsible for much of
the reduction in M-1 growth. In addition, a shift of consumer deposits
at commercial banks from demand accounts to savings accounts eligible

III - 3
SELECTED FINANCIAL MARKET QUOTATIONS(per cent)
1978 1/ 1978-1979 2/ Change from:FOMC FOMC
Oct. FOMC FOMC Jan. Oct. Dec.High Low 31 Nov. Dec. 30 31 FOMC31 21 19 30 31 FOMC21 19
Short-term ratesFederal funds 1/ 10.25 6.58 9.29 9.68 9.75 10.05 3 +.76 +.30
Treasury bills3-month 9.30 6.16 8.75 8.83 9.21 9.27 +.52 +.066-month 9.51 6.45 9.23 9.08 9.61 9.35 +.12 -.261-year 9.62 6.55 9.13 9.09 9.61 9.34 +.21 -.27
Commercial paper1-month 10.56 6.70 9.13 9.79 10.22 9.75 +.62 -.473-month 10.52 6.68 9.40 10.15 10.42 10.02 +.62 -.40
Large negotiable CDs 4/3-month 10.96 6.77 10.38 10.54 10.90 10.18 -.20 -.726-month 11.52 6 .97p 11.25 11.01 11.50 10.61 -.64 -.89
Bank prime rate 11.57 7.75 10.25 11.00 11.50 11.75 +1.50 +.25
Intermediate- and long-term ratesCorporate
New AAA 5/ 9.30 8.61 9.23 9.25 9.29Recently offered 6/ 9.54 8.48 9.24 9.24 9.35 9.46p +.22 +.11
Municipal(Bond Buyer) 7/ 6.67 5.58 6.21 6.11 6.45 6.30 +.09 -.15
U.S. Treasury(constant maturity)3-year 9.59 7.40 9.32 8.89 9.49 9.18 -.14 -.317-year 9.22 7.72 9.00 8.76 9.15 8.96 -.04 -.19
20-year 9.00 8.01 8.90 8.70 8.99 8.90 0 -.09
FOMC FOMCLow High Oct. FOMC FOMC Jan. Oct. Dec.8/ 8/ 31 Nov. Dec. 30 31 FOMC
21 19
Stock pricesDow-Jones Industrial 742.12 907.74 792.45 804.05 789.85 851.78 +59.33 +61.93N.Y.S.E. Composite 48.43 60.38 51.67 52.96 52.58 56.60 +4.93 +4.02AMEX 119.73 176.87 136.75 145.69 146.38 161.26 +24.51 +14.88Keefe Bank Stock 6/ 558 694 694 596 600 629 -65 +29
Daily averages for statement week, except where noted.One-day quotes except as noted.Average for first 6 trading days of statement week endingSecondary market.Averages for preceding week.One-day quotes for preceding Friday.One-day quotes for preceding Thursday.Calendar week averages.
January 31.

III - 4
MONETARY AGGREGATES 1/(Seasonally adjusted)-
Dec. '771978 to 1979
H1 QIII QIVP Oct. Nov. Dec.P Dec. '78 Jan.eMajor monetary aggregates1. M-1 (currency plus demand
deposits) 8.1 7.6 4.4 3.7 -4.6 1.7 6.7 0.72. M-l+ (M-l plus savings
deposits at CBs andcheckable deposits atthrift institutions) 5.9 5.3 2.4 1.8 -7.1 -2.3 4.3 -3.3
3. M-2 (M-1 plus time & savingsdeposits at CBs, otherthan large CDs) 7.4 8.9 7.5 7.0 4.3 2.1 7.7 0.8
4. M-3 (M-2 plus all depositsat thrift institutions) 7.8 10.1 9.7 9.6 6.6 5.2 8.9 4.4
Bank time and savings deposits5. Total 11.7 9.5 12.5 7.9 23.7 5.0 11.5 8.56. Other than large negotiable
CDs at weekly reporting banks(interest bearing componentof M-2) 6.9 10.0 9.6 9.1 10.7 2.4 8.5 1.2
7. Savings deposits 2.1 1.3 -0.9 -1.6 -11.3 -8.7 0.3 -9.38. Individuals 2/ 2.1 2.5 -0.8 -2.9 -8.6 -8.7 0.7 n.a.9. Other 3/ 1.3 -15.5 -2.7 16.0 -39.5 -16.3 -5.2 n.a.10. Time deposits 11.1 17.3 18.1 17.7 27.7 10.8 15.5 9.511. Small time 4/ 5.2 8.5 13.0 23.5 4.7 8.8 8.6 n.a.12. Large time 4/ 22.7 32.7 26.7 8.1 67.8 13.0 28.9 n.a.13. Time and savings deposits sub-
ject to rate ceilings (7+11) 3.4 4.4 5.2 9.4 -4.2 -0.9 3.8 n.a.Deposits at nonbank thrift institutions 5/14. Total 8.3 11.6 13.0 13.6 10.1 9.5 10.6 9.415. Savings and loan associations 8.5 12.8 14.5 14.9 12.2 11.5 11.5 11.416. Mutual savings banks 4.8 7.1 9.3 11.2 6.9 4.3 6.6 4.217. Credit unions 17.4 13.6 n.a. 6.8 2.3 n.a. n.a. n.a.
MEMORANDA: Average monthly changes, billions of dollars
18. Total U.S. Govt. deposits 6/ 0.0 1.5 -0.1 3.8 0.5 -4.6 0.3 -2.819. Total large time deposits 7/ 4.2 3.1 4.4 0.8 13.1 2.8 4.0 3.520. Nondeposit sources of funds 8/ 0.7 1.1 2.3 5.1 -1.9 3.8 1.2 n.a.n--nreliminarv. n.a.--not available. e--estimated
2/
3/
Quarterly growth rates are computed on a quarterly average basis.Savings deposits held by individuals and nonprofit organizations.Savings deposits of business, government, and others, not seasonally adjusted.Small time deposits are time deposits in denominations less than $100,000. Largetime deposits are time deposits in denominations of $100,000 and above excludingnegotiable CDs at weekly reporting banks.Growth rates computed from monthly levels based on average of current and preceding
end-of-month data.Includes Treasury demand deposits at commercial banks and Federal Reserve Banks and
Treasury note balances.All large time certificates, negotiable and nonnegotiable, at all CBs.Nondeposit borrowings of commercial banks from nonbank sources include Federal fundspurchased and security RPs plus other liabilities for borrowed money (including bor-rowings from the Federal Reserve), gross Eurodollar borrowings, and loans sold, lessinterbank borrowings.
III - 5
for automatic transfer services (ATS) is estimated to have reduced M-1
growth by 3 percentage points in both November and December (and the
fourth quarter average by 1 per cent), and additional transfers limited
M-1 growth in January. Moreover, inflows to newly authorized NOW accounts
in New York State grew sharply in January, further reducing M-1 growth.
Data from the most recent Demand Deposit Ownership Survey
indicate weakness in both business and consumer demand deposits during
the fourth quarter. At large banks, demand deposits held by financial
businesses declined and net inflows to accounts of nonfinancial businesses
slowed sharply. In the consumer category, strong growth in October was
followed by net outflows after the introduction of ATS on November 1.
Despite the shifting of funds to ATS accounts, net outflows
from savings accounts continued in both December and January as the
spread between Treasury bill rates and Regulation Q ceilings widened to a
record amount. On average for the fourth quarter, total savings accounts
at commercial banks contracted by 1 per cent at an annual rate, the first
quarterly decline since 1970. Savings deposit outflows were concentrated
in accounts held by individuals and nonprofit institutions.
M-2 growth decelerated in both December and January, continuing
a trend that began last October. The fourth quarter slowdown in the rate
of expansion of M-2 was, however, less pronounced than the deceleration
of the narrower monetary aggregates, as inflows of large time deposits
included in this aggregate remained strong and the growth of total small-
denomination time deposits accelerated. Helping to buoy growth of smaller
time deposits was a $13.3 billion net inflow of MMCs, almost twice the

III - 6
previous quarter's amount. Other small time deposits maturing in less
than 4 years continued to contract, while accounts maturing in 4 years
or more were essentially unchanged after growing moderately in the pre-
vious quarter.
Deposit growth at S&Ls and MSBs declined to 9.5 per cent in
December, its lowest rate since the MMCs were introduced. The combined
deposit growth for these institutions in January appears to be about the
same as in December, and remains well below the pace recorded in the third
quarter. Like commercial banks, S&Ls and MSBs have experienced sharp out-
flows from savings accounts. But given the further sharp increase in interest
rates since early fall, nonbank thrift deposit growth would have been sub-
stantially lower without MMCs. Over the fourth quarter, net sales of these
certificates totaled $21.5 billion at S&Ls and $6.7 billion at MSBs. At
year end, outstanding MMC balances at S&Ls and MSBs were $40.8 and $12.8
billion, respectively, accounting for more than 9 per cent of total deposits
at the institutions compared to 5-1/4 per cent of small-denomination time
and savings deposits at commercial banks.
The advance in interest rates during the fourth quarter
apparently encouraged the public to economize further on noninterest-
earning assets and to seek out more actively assets offering market yields.
The combined assets of money market mutual funds, for example, increased
by more than $1 billion to $10.7 billion in December, and posted further
increases of $2.2 billion in the first three weeks of January (see Chart
on page 7). Offerings of short-term unit investment trusts also reappeared
in the final quarter of 1978. Sales of these investment companies--

III - 7
MONEY MARKET MUTUAL FUNDS(monthly)
Total Net Assets (end of month)Billions of $
14
-12
- 10
8
6
4
2
LIIL 0
Average Annual Yield (end of month)
1974L
1975 1976 1977 1978
Latest data shown: December 1978.
Per Cent
12
10
8
6.
1979I I ~ ~ ~ -~-~~~~1
III - 8
representing interests in fixed CD pools--have totaled more than
$1.1 billion since early November.1 In addition, noncompetitive tenders
have increased somewhat at recent Treasury bill and note auctions.
Bank Credit
Commercial bank credit expanded at an annual rate of only 1.1
per cent in December, the smallest monthly growth recorded last year. Fol-
lowing brisk expansion in the preceding two months, total loan growth
decelerated sharply in the final month of 1978 as business loans were about
unchanged, securities loans declined, and real estate loans expanded less
rapidly. Data for large banks provide some evidence of renewed business
loan expansion in January, with most of the strength attributable to non-
New York City (NYC) banks. This reverses the pattern that characterized
business loans in December: NYC banks recorded strong loan growth, but
this was more than offset by loan declines at large non-NYC and small
banks.
Banks reduced their portfolios of Treasury securities in December
for the fifth consecutive month, while net acquisitions of other securities--
mainly State and local issues--remained at about November's reduced pace.
The recent decline in holdings of U.S. Government securities at large banks
has been concentrated in those maturing in over 1 year. As a result, a
downward movement in the ratio of liquid assets to liabilities at these
1/ Several major brokerage houses sponsored 11 unit trust offerings in1974, with units ($1,000 minimum purchase) representing fractionalundivided interests in fixed pools of CDs of domestic commercial banks.The more recent unit trust offerings, on the other hand, have representedinterests in fixed pools of CDs of foreign branches of domestic banks,foreign banks, and U.S. branches of foreign banks.

III - 9
COMMERCIAL BANK CREDIT(Per cent changes at annual rates, based on seasonally adjusted data)1/
12months
1978 ending
QII QIII QIV Oct. Nov. Dec. Dec.
1. Total loans and invest-ments 2/
2. Investments
3. Treasury securities
4. Other securities
5. Total loans2 /
6. Business loans
7. Security loans
8. Real estate loans
9. Consumer loans
MEMORANDA:
10. Commercial paperissued by non-financial firms3/
11. Business loans atbanks net of bankholdings of bankersacceptances
12. Sum of items 10 & 11
13. Memo item 12 plusbusiness loans fromfinance companies
17.0
11.7
17.1
8.5
19.1
17.4
88.9
19.3
23.7
8.7
1.1
-6.1
9.0
11.7
10.3
-26.8
17.6
15.6
5.9
-10.3
-36.2
4.8
12.1
6.7
-43.1
17.5
n.a.
9.8
-4.5
-24.7
7.1
15.3
10.6
-67.7
16.7
17.3
6.7
-20.0
-61.8
3.6
16.8
10.0
-52.2
21.1
20.8
1.1
-6.5
-25.2
3.5
3.9
-0.5
-13.6
13.8
n.a.
10.9
1.9
-7.5
7.5
14.6
13.0
-7.0
19.1
n.a.
30.6 18.9 49.7 33.9 52.7 56.8 25.9
17.9
18.8
10.3
10.9
8.6
11.8
12.4
13.9
12.8
15.8
0.5 14.1
5.3 14.9
17.4 9.1 14.9e 18.8 17.7 7.8e 14.8e
n.a.--not available. e-estimated1/ Last-Wednesday-of-month series except for June and December, which are adjusted
to the last business day of the month.2/ Loans include outstanding amounts of loans reported as sold outright to a bank's
own foreign branches, nonconsolidated nonbank affiliates of the bank, the bank'sholding company (if not a bank), and nonconsolidated nonbank subsidiaries of theholding company.
3/ Measured from end of month.
III - 10
banks has slowed and the ratio remains above its low recorded in late
1974 (see Chart on page 11).
Banks also issued large CDs and increased their reliance on nonde-
posit sources of funds to meet loan demand in December. The greater use
of nondeposit sources more than offset the previous month's decline and
boosted the fourth quarter net increase to $7 billion; security RPs and
Fed fund purchases from nonbank sources accounted for much of this increase.
Gross Eurodollar borrowings from foreign branches also rose over the quarter,
but claims on such branches increased by a like amount, resulting in only
a small net amount of funds acquired from this source. In addition to
these nondeposit sources of funds, banks began acquiring Treasury balances
under the new tax and loan account program in early November. These accounts
averaged over $6 billion in the final two months of the year.
With the further loan growth over the fourth quarter--financed
in part by security sales and enlarged use of nondeposit sources of funds--
the ratio of loans to deposits for most classes of commercial banks had
increased by year end to near or above the 1974 peaks (see Chart on page 12).
Only large banks in New York City still maintained ratios substantially
below the 1974 levels. The possibility of additional liquidity pressures
at large banks is suggested by the most recent data on the growth of loan
commitments, which indicate a further sharp rise in unused business loan
commitments in November, extending the trend evident for more than three
years. This jump apparently reflected efforts by corporate treasurers to
augment their credit lines as a hedge against possible reductions in the
availability of funds if credit conditions tighten further.

III - 11
1/RATIO OF LIQUID ASSETS TO TOTAL LIABILITIES 1/AT LARGE BANKS INSIDE AND OUTSIDE NEW YORK CITY
(not seasonally adjusted)
Per Cent
1973 1974 1975 1976 1977 1978
l/ The liquidity ratio is calculated as the sum of Treasury and othersecurities maturing in one year or less, loans to brokers and dealersand domestic commercial banks, holdings of bankers' acceptances andgross sales of Federal funds, all divided by liabilities less capitalaccounts, valuation reserves, and demand deposits due to banks.

III - 12
Ratio of Loans to Deposits
(end of quarter, not seasonally adjusted)
Small banks
Ratio scale
- 1.2
Ratio scale
1970 1972 1974 1976 1978 1970 1972 1974 1976 1978
excludnegoti
CD(
Rati
Other Large Banks
Ling ,able/ I
S I /.
1970 1972 1974 1976 1978
' I I I I I I I I I
.o scale
-1.2
1.0
.8
1970 1972 1974 1976 1978
III - 13
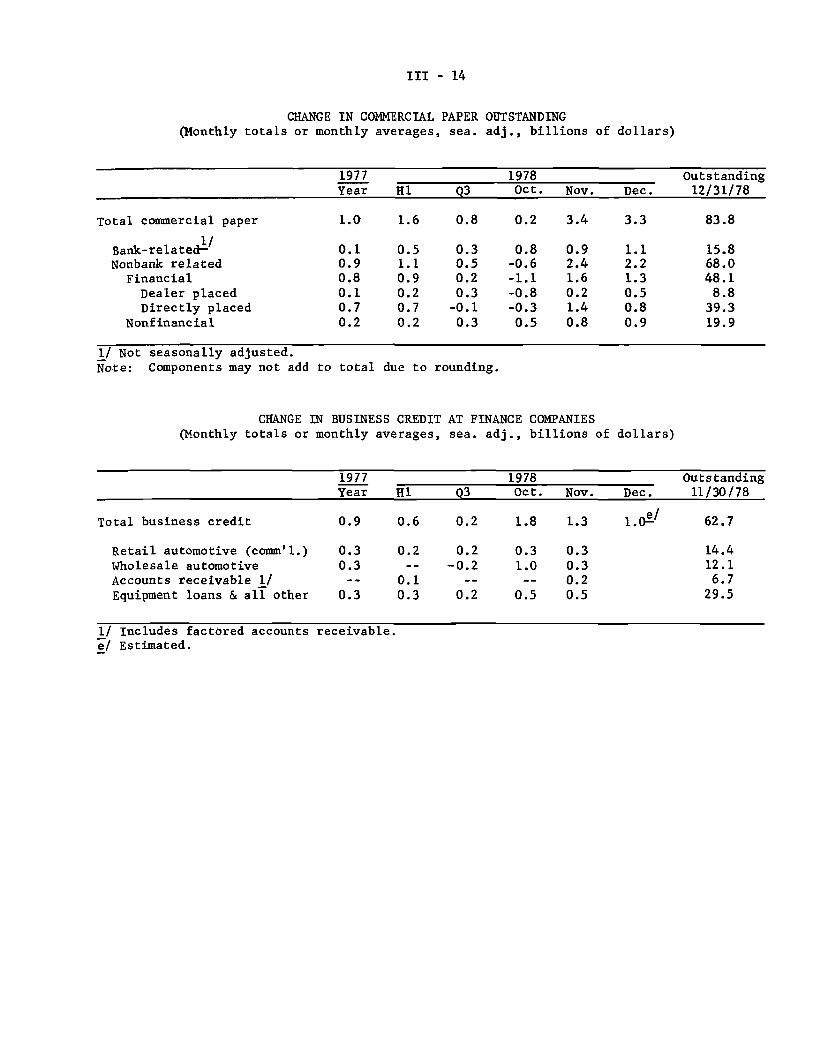
Business Finance
Despite the December weakness in business loans at commercial
banks, total short- and intermediate-term business credit continued to
expand in the month. Commercial paper issued by nonfinancial firms
grew $900 million in December--due in part to a less-than-seasonal runoff
at year end by public utilities--and business loans at finance companies
are estimated to have increased further. Nonfinancial commercial paper
also expanded strongly in the previous two months, increasing a near-record
$2.2 billion for the quarter as a whole.1 The $4.1 billion increase in
business loans at finance companies in the fourth quarter reflected
primarily expansion in automobile-related lending--both retail loans
on commercial vehicles and wholesale (or "floorplanning") loans--as well
as continued strength in equipment financing.
In longer-term markets, gross public offerings of corporate
bonds contracted to $1.1 billion in January, after totaling only $1.5 bil-
lion in December. The relatively light slate of offerings in December
and January was due to reduced public utility financing and a continuing
paucity of higher-rated industrial issues.2 Major manufacturing and
1/ In addition, nonbank-related financial firms boosted their commercialpaper outstandings by $1.8 billion over the quarter. Bank holdingcompany paper grew by a record $2.8 billion, but sales of loans bybanks to their bank holding company affiliates decreased over recentmonths, so these funds apparently are being passed through to nonbanksubsidiaries.
2/ Underwriters generally expect the refunding of a large volume ofmaturing issues of financial corporations to boost bond offerings
in 1979. Moody's reported recently that 12 banks or bank holdingcompany issues totaling $715 million and 14 finance company issuestotaling $900 million will mature and likely be refunded during1979. Indeed, part of the proceeds from Citicorp's $500 million,floating-rate note issue offered in late January will be used to
redeem $225 million of notes falling due in 1979 and 1980.
III - 14
CHANGE IN COMMERCIAL PAPER OUTSTANDING(Monthly totals or monthly averages, sea. adj., billions of dollars)
1977 1978 OutstandingYear H1 Q3 Oct. Nov. Dec. 12/31/78
Total commercial paper 1.0 1.6 0.8 0.2 3.4 3.3 83.8
Bank-related1/ 0.1 0.5 0.3 0.8 0.9 1.1 15.8Nonbank related 0.9 1.1 0.5 -0.6 2.4 2.2 68.0
Financial 0.8 0.9 0.2 -1.1 1.6 1.3 48.1Dealer placed 0.1 0.2 0.3 -0.8 0.2 0.5 8.8Directly placed 0.7 0.7 -0.1 -0.3 1.4 0.8 39.3
Nonfinancial 0.2 0.2 0.3 0.5 0.8 0.9 19.9
1/ Not seasonally adjusted.Note: Components may not add to total due to rounding.
CHANGE IN BUSINESS CREDIT AT FINANCE COMPANIES(Monthly totals or monthly averages, sea. adj., billions of dollars)
1977 1978 OutstandingYear H1 Q3 Oct. Nov. Dec. 11/30/78
Total business credit 0.9 0.6 0.2 1.8 1.3 1.0e/ 62.7
Retail automotive (comm'l.) 0.3 0.2 0.2 0.3 0.3 14.4Wholesale automotive 0.3 -- -0.2 1.0 0.3 12.1Accounts receivable 1/ -- 0.1 -- -- 0.2 6.7
Equipment loans & all other 0.3 0.3 0.2 0.5 0.5 29.5
1/ Includes factored accounts receivable.e/ Estimated.

III - 15
GROSS OFFERINGS OF CORPORATE AND FOREIGN SECURITIES(Monthly totals or monthly averages, in millions of dollars)
1977 1978 1979
Year H1 QIII QIVe / Dec.e / Jan.f/ Feb.f/
Seasonally adjusted
Corporate securities--total 4,518 3,587 4,822 3,586 3,250 2,925 3,100
Publicly offered bonds 2,016 1,489 2,365 1,606 1,500 1,050 1,425
Privately placed bonds 1,501 1,366 1,428 1,333 1,250 1,200 1,200
Stocks 1,001 732 1,029 647 500 675 475
Not seasonally adjusted
Publicly offered bonds 2,016 1,695 1,761 1,533 1,200 1,275 1,400By quality 1/
Aaa and Aa 1,089 820 885 908 675 1,025Less than Aa 2/ 927 875 876 625 525 250
By type of borrowerUtility 3/ 692 525 770 640 300 400Industrial3/ 700 578 560 418 375 375Financial 624 592 431 475 525 500
Foreign securities--total 621 640 328 423 10 821
Publicly offered4/ 437 466 183 336 10 625 300Privately placed 184 174 145 87 0 196
1/ Bonds categorized according to Moody's bond ratings.2/ Includes issues not rated by Moody's.3/ Includes equipment trust certificates.4/ Classified by original offering date.e/ Estimated.f/ Forecast.

III - 16
industrial corporations generally remain reluctant to issue long-term,
call-protected bonds at the relatively high level of current interest
rates, relying instead on alternative sources of funds to finance their
activities.1 For example, still substantial takedowns of privately
placed bonds by nonfinancial corporations in recent months have been
supplemented with a record volume of commercial mortgage financing from
insurance companies and commercial banks (see Chart on page 18). Also,
the unexpected strength in recent economic activity resulted in relatively
strong fourth quarter profits for many corporations; even allowing for
dividend increases, gross internal sources of funds probably were sig-
nificantly augmented at many major corporations.
Mortgage Market and Consumer Credit
Net residential mortgage lending apparently declined somewhat
in December, due mainly to a reduced volume of financing at S&Ls. Slower
deposit growth at nonbank thrift institutions during the fourth quarter
was accompanied by a fall off in S&L commitment activity.2 In addition,
the cost of mortgage and construction loans increased further and there
have been reports of tightening in nonrate lending terms. S&L borrowing
from FHLBs was sizable during the quarter--with an especially large
increase recorded in December--and advances have remained strong (after
1/ Public bond offerings by higher-rated industrial corporations wouldhave been even smaller in recent quarters if some companies had notelected to raise longer-term funds to repay bank loans incurred forthe financing of acquisitions. This was the case for the $300 million,
Aa-rated industrial issue in January.2/ The year-end backlog of mortgage commitments outstanding at S&Ls was
slightly below its year-earlier level (measured in current dollars).

III - 17
FINANCING PATTERN OF NONFINANCIAL CORPORATIONS(Billions of dollars, seasonally adjusted annual rates)
1977 1978Year Q1 Q2 Q3 Q4
Capital expenditures 164.6 180.3 200.6 193.7 200.9Gross internal funds 135.3 127.2 144.1 145.4 152.0Financing gap 29.3 53.1 56.5 48.3 48.9
Net funds raised in markets 78.7 102.6 82.8 77.4 91.1
Com'l. paper & accept. 2.2 2.6 4.3 3.5 8.2Finance Co. loans 10.3 8.4 6.3 0.1 12.5Bank loans n.e.c.1/ 20.0 50.8 18.5 19.3 20.2Corporate bonds 24.5 17.5 26.5 25.8 21.5Mortgages 19.0 22.2 26.5 27.9 27.6Net new equity issues 2.7 1.0 0.7 0.8 1.0
Financial uses of funds, net 49.4 49.5 26.3 31.1 42.2Liquid assets 0.8 15.0 -8.9 7.2 13.8Other 2/ 48.6 34.5 35.2 23.9 28.4
1/ Includes a small amount of loans from U.S. Government.2/ Includes consumer credit, net trade credit, and miscellaneous assets less
profit taxes payable and miscellaneous liabilities.
Source: Flow of Funds, January 26, 1979. Data for 1978-Q4 are preliminary.

III - 18
COMMERCIAL AND INDUSTRIAL MORTGAGE ACTIVITY AT LIFE INSURANCE COMPANIES. /
(Quarterly data, seasonally adjusted)
$ Billions
16
- 14
-- 12
Outstanding Commitments- N10
8
- 6
New Commitments
4
1/ Reporting companies account for nearly 80 per cent of U.S. life insurancecompany assets. Fourth quarter 1978 data include estimate for December.
Source: American Council of Life Insurance.
III - 19
seasonal adjustment) in early January.1 However, the liquidity ratio
at insured S&Ls was a relatively high 9.0 per cent at year end, unchanged
from its year-earlier level. In the secondary market for home mortgages,
yields have risen further in recent FNMA biweekly forward commitment
auctions on an unusually low volume of offerings and acceptances. Mortgage
yields have remained about unchanged in the FHLMC weekly auctions, while
GNMA security yields--which typically move with bond yields--have edged
lower.
Consumer instalment credit is estimated also to have grown some-
what less in December than during the previous month, although its rate of
expansion for the fourth quarter as a whole was about in line with growth
in the previous quarter. Despite fairly brisk loan growth associated with
robust durable goods sales in the fourth quarter, several measures of non-
price terms on consumer loans in November (latest available data) suggest
that consumer instalment lenders are becoming somewhat more selective.
At large finance companies, for example, the proportion of automobile
loans made with only minimal downpayment has declined (see Chart on page 22).
In addition, the average maturity of new-automobile instalment credit con-
tracts at commercial banks has not lengthened much further in recent quarters,
although this is not the case for automobile loan maturities at finance
companies. The November Survey of Senior Bank Loan Officer Opinion also
suggests a slight decrease in the willingness of commercial banks to make
1/ The FHLB Board recently approved applications by two S&Ls to issueunsecured and mortgage-secured commercial paper. Until January, only
holding companies of state-regulated, stock-chartered associations couldissue these securities.

III - 20
INTEREST RATES AND SUPPLY OF MORTGAGE FUNDSAT SELECTED S&Ls
Period1978--High
Low
1978--Aug.Sep.Oct.Nov.
Dec. 18152229
1979--Jan.
Conventional home mortgagesAverage rate on Basis pointnew commitments change from Spread1/for 80% loans month or (basis
(Per cent) week earlier points)10.38 -- +108.98 -- +30
9.809.789.8810.11
10.3010.3510.3510.3510.38
10.3810.3810.4010.40
+5-2+10+23
+2+5
00
+3
00
+20
Per cent of S&Ls/with mortgage funds
in short supply6917
+100+ 72+ 65+ 84
+103+107+106
+85----
1/ Average mortgage rate minus average yield on new issues of Aaa utility bonds.2/ Per cent reporting supply of funds slightly or substantially below normal
seasonal patterns.
SECONDARY HOME MORTGAGE MARKET ACTIVITYFNMA auctions of forward purchase commitments
Conventional Govt.-underwritten
Amount($ millions)
Offered Accepted717 36375 48
Yieldto
FNMAj110.929.28
Amount($ millions)
Offered Accepted1249 605130 80
Yieldto
FNMAll10.60
9.13
Yields on GNMAguaranteed
mortgage backedsecurities for
immediatedelivery 1/
9.688.43
Dec 4111827
10.77
79 10.92
10.40
10.60
9.399.439.659.68
Jan 2 9.728 71 36 11.02 211 101 10.67 9.71
15 9.70
22 41 22 11.13 94 54 10.73 9.6729 9.55
1/ Average gross yield before deducting fee of 38 basis points for mortgage servicing.Data, based on 4-month FNMA purchase commitments, reflect the average accepted bid
yield for home mortgages, assuming a prepyment period of 12 years for 30-year loan
without special adjustment for FNMA commitment fees and related stock requirements.Mortgage amounts offered by bidders relate to total eligible bids required.
2/ Average net yields to investors assuming prepayment in 12 years on pools of 30-yearFHA-VA mortgages carrying the prevailing ceiling rate on such loans.
1978--HighLow

III - 21
CONSUMER INSTALMENT CREDIT1/
19781976 1977 1978e QIII QIVe Nov. Dec.e
TotalChange in outstandings
Billions of dollars 21.1 35.0 44.0 43.1 44.8 49.2 44.8Per Cent 12.4 18.3 19.2 17.3 17.2 18.7 16.7Bank share (per cent) 50.2 52.7 53.1 51.9 47.3 47.0 47.0
ExtensionsBillions of dollars 210.0 254.1 298.7 304.9 312.3 314.6 313.3Bank share (per cent) 46.2 46.4 47.8 48.0 47.5 47.6 47.6
LiquidationsBillions of dollars 188.9 219.2 254.3 261.8 267.5 265.4 268.5Ratio to disposable income 15.9 16.8 16.8 17.8 17.7 17.6 17.6
Automobile CreditChange in outstandings
Billions of dollars 10.4 15.3 19.2 19.4 18.9 21.1 19.2Per cent 18.2 22.6 23.2 20.9 19.4 21.3 19.0
ExtensionsBillions of dollars 63.6 75.8 88.9 91.8 92.0 93.4 92.7
1/ Quarterly and monthly dollar figures and related per cent changes are seasonallyadjusted annual rates.
e - Based on early estimate for December.

III - 22PROPORTION OF LOW-DOWNPAYMENT AUTOMOBILE
CREDIT CONTRACTS AT FINANCE COMPANIES
Used auto
.. 1 % e-(
New auto .
*--~^*~ .- ^ - ^
1974 1975 1976I I II I 11111111111
1977 1978
Note: Low-downpayment contracts are those for which credit extended equals100 per cent or more of dealer cost (new) or wholesale value (used).
AVERAGE MATURITY ON NEW-AUTO CONTRACTSAT COMMERCIAL BANKS AND FINANCE COMPANIES
Months-- 46
-- 42
Finance companies
-
- - - - - - - -
Commercial banks
I I I I I I1 9 1 1 1 1
cent
JI
I I I (
1977 19781974 1975 1976
III - 23
consumer instalment loans, which may be due in part to the squeeze between
statutory ceilings on finance rates in some states and higher costs of
funds to the banks.
Government Securities Markets
Gross offerings of tax-exempt bonds declined in January from
the large volume in the final two months of 1978. The heavy year-end
volume of tax-exempt securities was almost entirely for non-refunding
purposes. The upward movement in municipal bond yields throughout
most of 1978 and the September 1 IRS revised regulation amending tax-exempt
arbitrage restrictions have greatly reduced the attractiveness of issuing
new securities for refunding or advance refunding purposes. The Bond
Buyer index of tax-exempt bond yields climbed to 6.67 per cent in mid-
December--its highest level since July 1976--but it is currently about
35 basis points lower.
Net offerings of marketable Treasury issues totaled about $2.2
billion in January (not seasonally adjusted). This represents a rebound
from the pace of Treasury marketable borrowing in December, when sales
of nonmarketable securities to foreign official institutions and foreign
private investors were substantial. Since mid-December, sales of nonmar-
ketable issues to foreign official institutions have slowed appreciably,
although the Treasury auctioned about $1.2 billion equivalent of 2-1/2-
and 4-year, Swiss franc-denominated notes to private Swiss investors
in mid-January. With December's German mark-denominated issue, the total
of foreign currency-denominated issues sold by the Treasury in the last
two months amounts to $2.8 billion. The large sales of marketable and
nonmarketable securities kept the Treasury's cash balance at a high level.

III - 24
GOVERNMENT SECURITY OFFERINGS(Monthly totals or monthly averages, in millions of dollars)
1978 1979H1 QIII QIVe/ Nov. Dec.e/ Jan.f/ Feb.f/
Seasonally adjusted
State and local governmentsecurities, gross offerings
Total 5,714 6,421 5,723 5,197 7,283 4,650 4,600
Long-termShort-term
3,919 4,403 3,924 4,143 4,5831,795 2,018 1,799 1,054 2,700
3,000 2,6001,650 2,000
U.S. Government securities,net offerings
U.S. Treasury1/Sponsored agencies
State and local governmentsecurities, gross offerings
Total
Long-termShort-term
3,654 3,080 -945 -255 1,256 3,0562,320 1,641 1,788 3,053 2,003 1,650
2,2272,466
Not seasonally adjusted
6,109 5,963 5,050 5,348 5,700 4,400 4,400
4,094 4,195 3,600 4,075 3,600 3,000 2,7002,015 1,768 1,450 1,273 2,100 1,400 1,700
U.S. Government securities,net offerings
U.S. Treasury-ySponsored agencies
2,382 3,560 1,1522,012 2,130 1,635
1,700 932 2,151 5,7002,667 1,542 1,327 1,476
I Marketable issues only./ Estimated.
Tf/ Forecasted.

III - 25
At the end of 1978, it totaled over $16 billion, and had declined only to
$15.5 billion at the end of January.l
Sponsored credit agencies borrowed about $2 billion, seasonally
adjusted, in December, maintaining the record high pace of borrowing estab-
lished earlier in the year. Nearly all of the December borrowing was by
the FHLB and FNMA, in association with a continuation of their strong
direct and indirect support of the residential mortgage markets. Housing
agency borrowing slowed in January, although this decline was about offset
by increased borrowing by the farm credit agencies.
1/ The new Treasury tax and loan system has been able to handle theselarge balances, with the Treasury maintaining its FR balances between$2.5 and $3.5 billion. However, some banks in the system occasionallyhave remitted funds back to the FR Banks when their Treasury balancesreached self-imposed ceilings.

U.S. International Transactions(in millions of dollars; receipts, or increase in liabilities, +) January 31, 1979
1. Trade balance 1/2. Merchandise exports3. Merchandise imports
4. Change in net foreign positions of bankingoffices in U.S. (excl. liab. to foreignn official inst.)
Through interbank transactions with5. a) Own offices in foreign countries6. b) Unaffiliated banking offices in foreign coumtries
Through nonbank transactions7. a) Claim on nonbanks in foreign countries (increase, -)8. b) Liabilities to private nonbanks in foreign
countries (inc. custody liab.)
9. Private securities transactions net (excl. U.S. Treas. Oblig.)10. Foreign net purchases of U.S. corp. bonds11. Foreign net purchases of U.S. corp. stocks12. U.S. net purchases (-) of foreign securities13. Foreign net purchases of U.S. Treasury obligations
14. Change in foreign official reserve assets in U.S. (increase +)
By Area15. G-10 countries and Switzerland16. OPEC17. All other countries
By Type18. U.S. Treasury securities19. Other 2/
20. Change in U.S. reserve assets (increase -)
21. All other transactions and statistical discrepancy
1977 19 7R
.ear Year Q4 01 Q2 - Q3 S.et. Oct. nWo.
-,.353 -31.059 -10.170 -11.201 -7.802 -8.045 .2.612 2L486 .2436114,694 120,585 29,457 30,664 35,067 36,930 12,924 13,026 13,097
-124,047 -151,644 -39,627 -41,865 -42,869 -44,975 -15,536 -15,512 -15,533
-9..33 -3.907 -5.142 -6.211 2.700 488 1.92 -696 -4.596
-,28 -1,717 -,s -,526 / 3,478 6,627 -2,392 151-3,220 -2,203 -147 -2,369 / -976 -3,329 2,012 -2,928
-3,142 -423 -487 -180 / -2,649 -986 -990 -1,969
2,709 1,436 1,037 -136 I/ 635 .420 674 150
-7.82 . -3.050 38 -14 I ,1 53 317 -553 -217415 1,130 206 123 18 9407 99 199 50853 1,325 580 341 1,027 108 254 -56 1
-9,097 -5,505 -748 -978 -1,104 -462 -36 -696 -2682.641 543 -297 881 805 -1.034 621 291 -155
13.062 35.456 1U.15 1A.964 -5. 4.639 -874 7.250 4,399
3,922 29,414 14,476 12,327 -3,099 5,259 -477 6,164 5,3946,802 5,989 757 1,354 -2,389 -1,645 -335 1,250 -7132,338 53 -81 1,283 5 1,025 -62 -164 -282
9,313 30,218 12,900 12,979 -5,728 3,167 1,328 4,661 4,6123,747 5,238 2,252 1,985 24S 1,472 -2,202 2,589 -213
-2.332 -237 -2 2 ( 38 14 467 -85 968
13.946 2.254 41 1J33 9.371 3,85 723 -3,721 2,037
Current ccount 26 6 ,9 59 6,54 . .Current account 3/ 4,339 -15,265 -6,959 -6,854 -3,261 . ,a. n.ae. n.a. n.e.
International accounts basis, seasonally adjusted.Includes deposits in banks, commercial paper, bankers' acceptances,Seasonally adjusted.Data not shown separately because of break in series.
and borrowing under repurchase agremnts.
Note: Capital Account data for December are not yet available. Trade data for December, the fourth quarter, and the year 1978 are shown in the text table on page IV-10.
RISTUICTED
RESTRICTED

INTERNATIONAL DEVELOPMENTS
Forein exchange markets. Since the last green book, the
behavior of the dollar's weighted-average exchange value has exhibited
two distinct trends, as shown in the Chart.
From mid-December until the end of the month, the dollar's
value fell more or less steadily. There was a sharp break around the time
of the December 16 OPEC announcement that graduated 1979 price increases
would total 14.5 per cent: the dollar's average value fell about 2-1/2
per cent in four days. Additional selling pressure developed toward the
end of the month.
Since the turn of the year, however, the dollar's value has been
on a generally upward path. The rising trend was broken briefly around mid-
month when statements and actions by German officials intimated that
authorities there were beginning to re-emphasize the inflationary dangers
of large-scale intervention in exchange markets.
U.S. authorities were net purchasers of a small amount of foreign currencies.
Over the seven weeks as a whole, the dollar's average exchange
value has fallen about one per cent, and it is now about eight per cent
higher than its low point at the end of last October.

CHART 1
WEEKLY SERIES
IV - 2
WEIGHTED AVERAGE EXCHANGE VALUE OF U.S. DOLLAR
Daily:FOMC 19 Dec 1978 87
29 Dec 1978 8630 Jan 1979 88
Strictly Confidential (FR)
Class FOMC1/31/79
MARCH 1973=100
toe
- 104
.2 100.2.5.4
r /

IV - 3
The largest net changes in the dollar's value vis-a-vis individual
currencies since mid-December were against the mark and other snake currencies
and the French franc. The dollar's value declined by about 2-1/2 per cent
in terms of each of those currencies. In contrast, the dollar's value rose
(by 1-to-2-1/2 per cent) in terms of the yen and the Canadian dollar.
During the period of downward pressure on the dollar's value
in the last half of December, the New York Trading Desk sold over $1-1/2
billion equivalent of marks in about 50-50 proportions for the System and
the Treasury. The System financed its share by swap drawings, and the
Treasury drew on its mark balances. During late December, the Desk also
made small purchases of Swiss francs and yen,
and
sold Swiss francs when necessary to relieve downward pressure on the dollar.
As the dollar's value rose during January, the Desk became chiefly a net
buyer of marks, Swiss francs, and yen,
. The System's share in those transactions has
been used to reduce outstanding System swap drawings by about $600 million
from their peak value of $5.5 billion (computed using exchange rates
prevailing when drawings were made) reached at the end of 1978.
On January 17 the U.S. Treasury marketed the second issue in its
planned series of foreign-currency-denominated notes. Swiss franc-denominated
notes worth $1.2 billion were sold in a heavily oversubscribed offering.
Maturities of 2-1/2 and 4 years were offered at interest rates of 2.35 and
2.65 per cent respectively.

IV - 4
In January both the Swiss and Japanese governments announced
that restrictions on capital inflows to their financial markets from abroad
were to be relaxed. Neither action appeared to generate significant upward
pressure on the currency involved.
IV - 5
Borrowing in international capital markets. Total borrowing in
international capital markets in the second half of 1978 was close to the
very high first-half level, raising the total of borrowings for the year
to over $100 billion, an increase of 45 per cent over 1977. Revisions to
the Euro-credit data will undoubtedly raise this total further, perhaps
by $2-3 billion. Almost all the increase in total borrowing was in
extensions of new medium-term Euro-credits. The increase in outstanding
Euro-credits was much less dramatic than the rise in new credit exten-
sions because much of the increase was used to refinance older drawings
or maturing debt. Euro-bond issues declined in 1978 but foreign bond
issues picked up.
In the market for medium-term Euro-credits, presently available
data show $64 billion of credits completed in the full year 1978, up
almost 90 per cent from the 1977 total compared with a 19 per cent rise
in 1977 over 1976. Because of the absence of data on repayments it is
not possible to estimate precisely the extension of net new credit.
However, data on external claims of banks in the G-10 countries suggest
that outstanding medium-term credits may not have risen significantly
faster in 1978 than in 1977. About $10 billion of the credits arranged
in 1978 (one-third of the increase over 1977) appear to have been refi-
nancings of outstanding debts repaid ahead of schedule to take advantage
of better terms available in the market; such refinancings had been
negligible in 1977. In addition, repayments of maturing loans that
borrowers wished to refinance also increased in 1978.

IV - 6
Borrowing in International Capital Markets(in billions of dollars)
I. Medium-term Euro-credits:total1/
Developed countriesCanadaFranceItalySpainUnited KingdomOther
Oil-exporting countriesAlgeriaIndonesiaIranNigeriaVenezuelaOther
Non-oil LDCsArgentinaBrazilMexicoPhilippinesOther
Communist countries
Int'l. org's. and others
II. Euro-bonds: totalBy borrower: LDCs
all otherBy currency: U.S. dollar
German markother
III. Foreign bonds: totalBy borrower: Canada
othersBy market: U.S.2/
SwitzerlandJapanother
IV. Total borrowing
1976Year
1977Year 2nd H
1978Year 1st H 2nd H
28.7 34.2 18.8 64.4 34.1 30.3
10.9.9.7
1/.2.02.05.1
3.7.7.5.90
1.1.5
11.0.9
3.32.1
.93.8
2.5
13.4.5
1.9.8
1.92.55.8
6.0.4.11.8
01.72.0
11.3.82.32.9.7
4.6
6.3.2.4.7
1.2.5
3.3
3.0.4.1.90
.41.2
7.2.51.62.3
.42.4
3.1 2.1
30.;16.82.52.72;04.6
10.3
9.91.61.61.21.81.91.8
19.41.43.95.01.97.2
4.5
.2 .5
15.41.0
14.410.0
2.81.6
18.96.1
12.810.6
5.4.3
2.6
19.32.3
17.012.35.11.9
15.63.3
12.37.54.71.42.0
8.91.27.75.42.8
.7
8.51.76.83.82.61.3
.8
16.22.9
13.37.76.81.7
19.93.4
16.56.16.64.52.7
15.65.61.31. 11.01.84.8
6.3.7
1.1.8
1.01.71.0
9.5;51.82.51. 13.6
14.51.21.21.61.02.95.4
3.6.9.5.4.8.3.7
10.01.02.12.5.8
3.6
2.5 2.0
.3 .2
9.21.67.64.83.51.0
10.31.88.53.72.82.41.4
7.01.35.73.03.3
.7
9.61.68,02.43.72.11.3
63.0 69.0 36.2 100.5 53.6 46.9
.l Completed credits of over one-year maturity.2/ Figures may differ from statistics
are on n drawdowns bsis."/ Less thn $50 million.Source: World Bank.
of U.S. international transactions, which

IV - 7
Credits completed in the second half of 1978 were somewhat
less than in the first half, mostly because of reduced borrowing by
Canada, Venezuela, and several other oil-exporting countries. The
United Kingdom and Italy stepped up their borrowing, but in the case of
the United Kingdom this was due to the advance refinancing of loans to
the Government ($1.5 billion) and the Electricity Council ($500 million).
Other large refinancings of loans repaid ahead of schedule in the second
half were by Denmark ($1.2 billion) and Sweden ($1.0 billion). For 1978
as a whole the largest increase in borrowing by country category was in
loans to developed countries, notably Canada, Italy and the U.K., but the
bulk of the advance refinancings also concerned loans to developed coun-
tries. In contrast, advance refinancing was relatively unimportant for
the other country categories, where almost every one of the countries
individually listed in the table borrowed much more last year than in
1977.
During the second half of 1978, spreads and maturities on
Euro-credits generally continued to become more favorable to borrowers,
but by the fourth quarter there were signs that the trends were moder-
ating or reversing. While spreads continued to fall on average, by the
fourth quarter some borrowers were obtaining terms no finer than those
obtained several months earlier. Prime borrowers continued to arrange
credits with spreads of 1/2-3/4 per cent over LIBOR. The Bank of
England maturity series shows the average maturity of new Euro-credits
rising from 8-1/2 years in the second quarter to almost 9 years in the
third, then falling back to 8-1/2 years in the fourth quarter.

IV - 8
Fewer bonds were issued in the international bond markets in
the second half of last year than in the first. New Euro-bond issues
declined about 25 per cent, to $7.0 billion, primarily because of a drop
of almost 40 per cent in U.S. dollar issues. The volume of dollar issues
held up fairly well through the third quarter, when they accounted for a
little over one-half of total issues, about the same share as in the
previous three quarters. But in the wake of the long decline in the
exchange rate of the dollar prior to November 1, and with the renewed
rise in long-term interest rates in the United States, dollar issues
shrank by more than one-half in the fourth quatter; their share-of total
issues in the market declined to 30 per cent. There was some recovery
between October and December but in December dollar issues were still
depressed. DM-denominated Euro-bonds rose sharply in volume in the
fourth quarter, when their share rose to 60 per cent from 35-40 per cent
in the preceding three quarters. For the full year 1978 Euro-bond issues
were about 15 per cent below the 1977 volume.
New issues of foreign bonds experienced only a small decrease
in the second half. Issues in the U.S. market were down sharply, and a
tightening of the Japanese bond market led to some falling off there, but
Swiss issues boomed as bond yields in Switzerland continued their decline
to record low levels (reached in January 1979). Total foreign bond
issues rose 28 per cent in 1978 with much higher volume in Japan (up
three-fold) and Switzerland.

IV-9
U,S. International Transactions. The merchandise trade deficit
in December was $24.5 billion at an annual rate (Census basis), with both
exports and imports continuing at about the same levels as during the past
several months. The deficit for the fourth quarter, also $24.5 billion at
an annual rate, was only slightly smaller than the deficits in either the
second or third quarters. For the year 1978 the deficit was $28.5 billion.
The trade deficit on a Census basis has been running about
$5-6 billion (annual rate) smaller than the trade deficit on an international
accounts basis. About one-fourth of the difference is attributable to
incomplete coverage of merchandise transactions in the Census data,
particularly on the import side. The rest of the difference occurs
because of the exclusion of military sales and purchases from the merchandise
lines in the international accounts. These military transactions are
included with all other military sales and purchases of goods and services,
and are shown separately in the international accounts under "goods and
services" transactions. The international accounts basis merchandise trade
data are scheduled to be released on Thursday, February 1. The table below
shows the trade data on both bases.
Exports increased by about 5 per cent in the fourth quarter with
about half of the increase from higher prices. A strong increase in the
volume of nonagricultural exports (largely industrial materials and machinery)
was partly offset by a drop in the volume of agricultural exports from very
high mid-year rates.

IV-10
U.S. Merchandise Trade(in billions of dollars, seasonally adjusted annual rates)
Census Basis International Accounts BasisExports Imports Balance Exports Imports Balance
1977 121.2 147.7 -26.5 120.6 151.7 -31.11978 143.6 172.0 -28.5 n.a. n.a. n.a.
1978:
Qtr. 1 123.4 162.1 -38.7 122.7 167.5 -44.8Qtr. 2 142.1 168.8 -26.8 140.3 171.5 -31.2Qtr. 3 150.8 176.0 -25.2 147.7 179.9 -32.2
Qtr. 4 157.7 182.1 -24.5 n.a. n.a. n.a.e
October 156.1 181.7 -25.5 156.3 186.1 e -29.8eNovember 159.1 182.5 -23.3 15 7 .2e 18 6 .4e -29.2 e
December 157.8 182.3 -24.5 n.a. n.a. n.a.
e/ Monthly international accounts data are unpublished estimates and aresubject to considerable revision.
Imports rose by about 3 per cent in the fourth quarter. Most of
the increase was in non-oil imports, spread over most major commodity
categories; about half the increase in non-oil imports was from higher prices.
The value of oil imports was about the same in the fourth quarter as in the
second and third quarters (including imports into the U.S. Virgin Islands).
hile the fourth quarter oil import volume was slightly lower (8.85 million
barrels per day) than in the previous two quarters, the average import price
was slightly higher ($13.35 per barrel). In December the average import
price jumped to nearly $13.50 per barrel after averaging between $13.20
and $13.30 since March.

IV-11
In the financial sector of the international accounts, there
was large-scale U.S. and foreign central bank intervention in the exchange
markets in the fourth quarter of 1978. The foreign intervention and the
use by the United States of swap drawings for intervention are reflected
in the estimated $16 billion net increase in G-10 countries' reserve
assets in the United States. In addition, the U.S. used nearly $2 billion
equivalent of the foreign currency proceeds of market borrowings. Most
of the $16 billion increase in G-10 reserve holdings was invested in U.S.
Treasury securities, including nonmarketable issues issued in connection
with U.S. - initiated swap drawings.
In January, as intervention activity moderated, the rate of net
foreign central bank purchases of Treasury securities also slowed, helping
to restore a more normal (narrower) interest-rate differential between
short-term Treasury bill rates and other private money-market instruments.
Private capital outflows as reported by banks and securities
dealers (including an estimate for December) appear to be about $7 billion
in the fourth quarter, compared to less than $1/2 billion in the third quarter.
For October-November combined, the most recent period for which
data are available, banks reported a net capital outflow of $5.3 billion,
with indications of further substantial outflows in December. A sizeable
increase in U.S. bank claims on nonbank foreigners, about $3 billion in
October-November, may have reflected credit demands related to financial
positioning in anticipation of a further depreciation of the dollar.
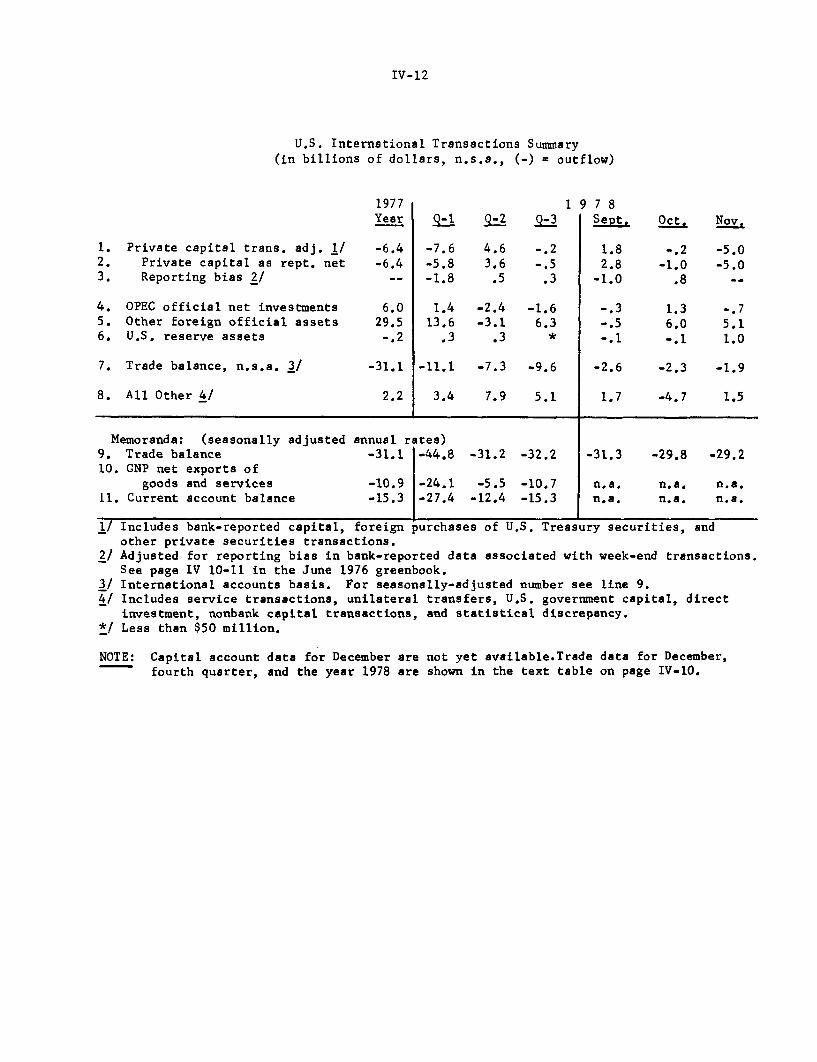
IV-12
U.S. International Transactions Summary(in billions of dollars, n.s.a., (-) = outflow)
1977 1 9 7 8Year Q-1 Q-2 Q-3 Sept. Oct. Nov.
1. Private capital trans. adj. 1/ -6.4 -7.6 4.6 -.2 1.8 -.2 -5.02. Private capital as rept. net -6.4 -5.8 3.6 -.5 2.8 -1.0 -5.03. Reporting bias 2/ -- -1.8 .5 .3 -1.0 .8
4. OPEC official net investments 6.0 1.4 -2.4 -1.6 -.3 1.3 -.75. Other foreign official assets 29.5 13.6 -3.1 6.3 -.5 6.0 5.16. U.S. reserve assets -.2 .3 .3 * -.1 -.1 1.0
7. Trade balance, n.s.a. 3/ -31.1 -11.1 -7.3 -9.6 -2.6 -2.3 -1.9
8. All Other 4/ 2.2 3.4 7.9 5.1 1.7 -4.7 1.5
Memoranda: (seasonally adjusted annual rates)9. Trade balance -31.1 -44.8 -31.2 -32.2 -31.3 -29.8 -29.210. GNP net exports of
goods and services -10.9 -24.1 -5.5 -10.7 n.a. n.a. n.a.11. Current account balance -15.3 -27.4 -12.4 -15.3 n.a. n.a. n.a.
1/ Includes bank-reported capital, foreign purchases of U.S. Treasury securities, andother private securities transactions.
2/ Adjusted for reporting bias in bank-reported data associated with week-end transactions.See page IV 10-11 in the June 1976 greenbook.
3/ International accounts basis. For seasonally-adjusted number see line 9.4/ Includes service transactions, unilateral transfers, U.S. government capital, direct
investment, nonbank capital transactions, and statistical discrepancy.*/ Less than $50 million.
NOTE: Capital account data for December are not yet available.Trade data for December,fourth quarter, and the year 1978 are shown in the text table on page IV-10.

IV-13
A large part of the increase in claims on nonbanks apparently took the form of
financing through bankers' acceptances. Bankers' acceptances are a con-
venient vehicle for accelerating the conversion of the proceeds of dollar-
denominated trade receivables into foreign currencies.
OPEC banking and security holdings in the United States are
estimated to have increased by slightly more than $1 billion in the
fourth quarter. For the year as a whole, OPEC holdings in the United States
are estimated to have fallen by almost $1.5 billion.
Foreign private purchases (net) of U.S. corporate stocks were
negligible in November, bringing the total for 11 months to $1.5 billion,
most of which occurred in the rising market in the second quarter. U.S.
net purchases of foreign securities were about $250 million in November,
bringing the total for 11 months to $3 billion, considerably less than the
$54 billion for the year 1977. The decline in U.S. purchases of foreign
securities in 1978 largely reflects foreign borrowers' reluctance to finance
with fixed-interest U.S. dollar-denominated long-term debt.
IV - 14
Foreign Economic Developments. A major factor in foreign
economic growth performance continues to be the pace of economic
activity in Germany and Japan. As shown in the accompanying chart,
there was a pickup in GNP growth in both of these key countries
in 1978, albeit only a modest one in Japan. Similarly, there also
was an acceleration of growth in Canada, France, Italy, and the
United Kingdom in 1978.
According to provisional data, German GNP rose by about
3-1/2 per cent between 1977 and 1978. This figure implies that
between the third and fourth quarters of 1978 GNP increased by
nearly 6 per cent (s.a.a.r.) if the first three quarters of the
year are not revised. Data on Japanese industrial production in
the 3-month period ending in December indicates a rate of growth
of 9 per cent (s.a.a.r.) over the previous 3-month period. If the
pace of activity indicated by the latest German GNP and Japanese
industrial production data is sustained, other foreign countries'
export and output performances can be expected to be enhanced.
During the course of last year, there was a fairly gen-
eral pattern of decline in price inflation rates in the major
foreign industrialized countries. As measured by the change between
the latest 3-month period and the previous 3-month period, inflation
rates are very low in Germany and Japan, and of the major countries,
only Italy has a rate of consumer-price inflation that exceeds 10
per cent.

Real GNP in Major Industrial CountriesPercentage Change from Previous Year
PercentS8
1976
JAPAN
1978 tigures tot Japan. Canada, France, Italy, and the United Kingdom re estimates.1/ Weighted average
CANADA, FRANCE, ITALY,AND UNITED KINGDOM 1/
r UNITED STATES
-18
-14
--1 2
1978 *
..........
II; CGERMANY
19,17
I .
""""':::::::::''"'"":::::::::""""'""""'""""'"" ""'' """'"" ""'""""'""""'"""' """""""""'""""'' """'""""'""""'"""" '' " """"""'""""'"""""""' ""'""""""""""""""'"""""""" """""""""""'
:t"""""' ""'
""""""' """'""""""""""""" """"""""""' "'""""""""""""""""'"""'""""'"""""""""""""""""ill""""".i 'I
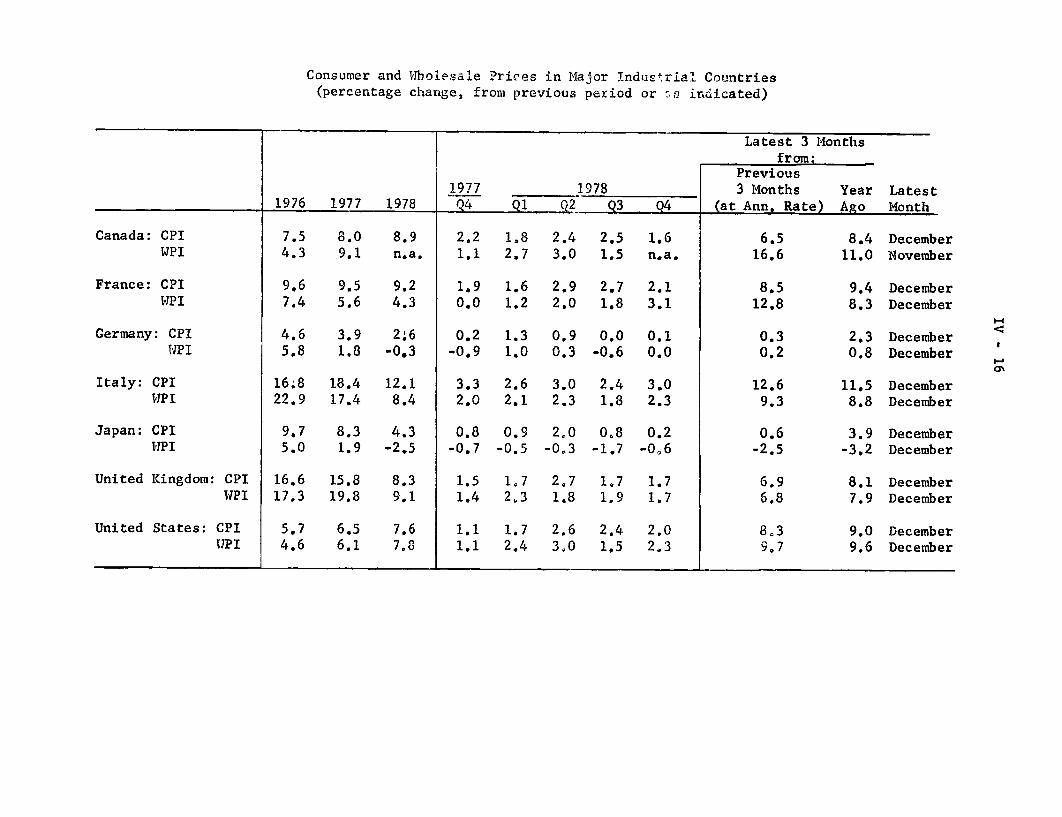
Consumer and Wholesale Prices in Major Industrial Countries(percentage change, from previous period or as indicated)
Latest 3 Monthsfrom:
Previous1977 1_978 3 Months Year Latest
___1976 1977 1978 Q4 Ql Q2 Q3 Q4 (at Ann. Rate) Ago Month
Canada: CPI 7.5 8.0 8.9 2,2 1.8 2.4 2.5 1.6 6.5 8.4 DecemberWPI 4.3 9.1 n.a. 1.1 2.7 3.0 1.5 n.a. 16.6 11.0 November
France: CPI 9,6 9.5 9.2 1.9 1.6 2.9 2.7 2.1 8.5 9.4 DecemberWPI 7.4 5.6 4.3 0.0 1.2 2.0 1.8 3.1 12.8 8.3 December
Germany: CPI 4.6 3.9 2.6 0.2 1.3 0.9 0.0 0.1 0.3 2.3 DecemberWPI 5.8 1.8 -0.3 -0.9 1.0 0.3 -0.6 0.0 0.2 0.8 December
Italy: CPI 16.8 18.4 12.1 3.3 2.6 3.0 2.4 3.0 12.6 11.5 DecemberWPI 22.9 17.4 8.4 2.0 2.1 2.3 1.8 2.3 9.3 8.8 December
Japan: CPI 9.7 8.3 4.3 0.8 0.9 2.0 0.8 0.2 0.6 3.9 DecemberWPI 5.0 1.9 -2.5 -0.7 -0.5 -0,3 -1.7 -0,6 -2.5 -3.2 December
United Kingdom: CPI 16.6 15.8 8.3 1.5 1.7 2.7 1,7 1.7 6.9 8.1 DecemberWPI 17.3 19.8 9.1 1.4 2.3 1.8 1.9 1.7 6.8 7.9 December
United States: CPI 5.7 6.5 7.6 1.1 1.7 2,6 2.4 2.0 8.3 9.0 DecemberUPI 4,6 6.1 7,8 1.1 2.4 3.0 1.5 2,3 9.7 9.6 December
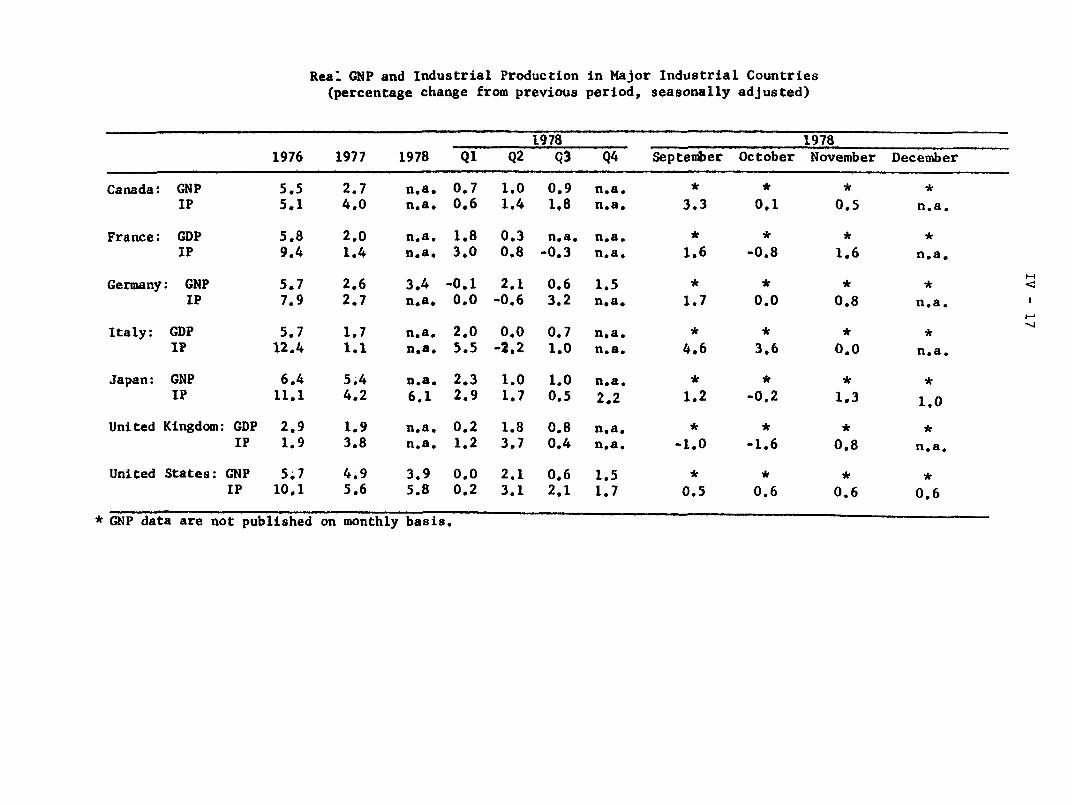
Real GNP and Industrial Production(percentage change from previous
in Major Industrial Countriesperiod, seasonally adjusted)
Canada: GNPIP
France: GDPIP
Germany: GNPIP
Italy: GDPIP
Japan: GNPIP
United Kingdom: GDPIP
United States: GNPIP
1976
5.55.1
5.89.4
5.77.9
5.712.4
6.411.1
2.91.9
5.710,1
1977
2.74.0
2.01.4
2.62.7
1.71.1
5.44.2
1.93.8
4.95.6
1978
n.a.n.a.
n.a.n.a.
3.4n.a.
n.a.n.a.
n.a.6.1
n.a.n.a.
3.9
Q1
0.70.6
1.83.0
-0.10.0
2.05.5
2.32.9
0.21.2
0.0
Q2
1.01.4
0.30.8
2.1-0.6
0.0-2.2
1.01.7
1.83.7
2.1
19781978Q3
0.91,8
n.a.-0.3
0.63.2
0.71.0
1.00.5
0.80.4
0.65.8 0.2 3.1 2.1 1.7
Q4
n.a.n.a.
n.a.n.a.
1.5n.a.
na.n.a.
n.a.
2.2
n.a.n.a.
1.5
bL'I oa-a ar no pu e on monni Dass
September
*
3.3
*
1.6
*
1.7
*
4.6
*
1.2
*
-1.0
0.50.5
1978
Sitr oacta are not puolisneaJ.
on montnty Dasis.
October
*
0.1
*
-0.8
*
0.0
*
3.6
*
-0.2
*
-1.6
0.60.6
November
*
0.5
*
1.6
*
0.8
*
0.0
*
1.3
*
0.8
0.60.6
December
*
n.a.
*
n,a.
*
n.a.
*
n.a.
*
1.0
*
n.a.
060.6
II

a/Trade and Current-Account Balances of Major Industrial Countries-
(billions of U.S. dollars; seasonally adjusted)
1977 1978 19781977 1978 Q3 Q4 Q1 Q2 Q3 Q4 Sept. Oct. Nov. Dec.
Canada: TradeCurrent Account
France: TradeCurrent Account
Germany: TradeCurrent Account b/
Italy: TradeCurrent Account b/
Japan: TradeCurrent Account
United Kingdom: TradeCurrent Account
2.7 3.1 0.5-3.9 n.a. -1.2
-2.1 0.5 -0.5-3.3 n.a. -0.8
16.53.8
20.48.3
3.7-2.0
-2.5 n.a. -0.22.3 n.a. 2.3
1.0-0.7
0.1-0.4
1.2-0.6
-0.10.0
0.6-1.0
0.6 0.6-1.2 n.a.
0.3 0.3 0.01.4 0.9 n.a.
4.8 4.3 5.0 5.5.3.8 1.6 2.0 -0.8
-0.20.7
-0.10.3
n,ar5.5
0.5 -0.8 n.a.1.8 n.a. n.a.
17.3 24.7 4.2 4.6 7.4 6.8 6.7 3.910.9 16.6 2.7 3.1 5.5 4.8 4.5 1.7
0.5 0.1 0.4 0.1* *0 * *
0.3 0.2 0.1 -0.2* * * *
2.3 2.2 1.90.2 1.9 2.0
n.a./1.6
0.1 0.3 -0.1 n.a. aS * * *
2.4 0.8 1.6 1.4 '1.6 0.2 0.8 0.8
-2.9 -2,0 -0.1 0.1 -1.1 -0.3 -0.6 0.1 -0.5 0.2 -0.4 0.30.8 0.2 1.0 1.1 -0.8 0.2 0.0 0.8 -0.3 0.4 -0.1 0.5
United States: TradeCurrent Account
-31.1 n.a. -7.3 -10.2 -11.2-15.3 n.a. -2.9 -7.0 -6.9
-7.8 -8.0-3.1 -3.8
n.a. -2.6 -2.5 -2.4n.a. * * *
The current account includes goods, services, andNot seasonally adjusted.Seasonally-adjusted data for December are not yet
private and official transfers.
available; 1978 total is based on unadjusted data.* Comparable monthly current-account data are not published,
n.a.*
--

IV - 19
The German trade surplus in 1978 was some $20-1/2 billion,
up $4 billion from its 1977 level. For Japan, the 1978 trade surplus
was about $25 billion, over $7 billion more than the 1977 level.
Japanese trade volumes seem to be responding to the yen's appre-
ciation, and the mark's strength appears to be having a similar
effect on German trade volumes. There has been a dramatic improve-
ment in the trade balances of France, Italy, and the United Kingdom,
especially compared to the 1976 outcomes of $4 - 6-1/2 billion
deficits in each of those countries.
Individual country notes. The new government in Japan
appears to be placing less emphasis than its predecessor on expan-
sion of the domestic economy as a way of reducing Japan's current-
account surplus. At the end of 1978, the government abandoned
Japan's summit commitment of 7 per cent growth for the fiscal year
ending March 1979. On January 11, the Japanese cabinet approved
an only moderately expansionary budget for fiscal year 1979. The
new budget calls for an increase of about 12 per cent in general
account expenditure over last year's total (including both the
original budget and the September supplementary budget), and the
government's fiscal investment and loan program is to be increased
by about 8 per cent. According to official Japanese projections,
the ratio of government deficit to government expenditures is ex-
pected to approach 40 per cent.
IV - 20
Although the 1978 current-account surplus reached
$16-1/2 billion (compared with $11 billion in 1977), the adjust-
ment of trade volumes to past exchange rate changes as well as
to special programs (such as emergency imports) is continuing and
in the fourth quarter the current-account surplus fell to $7 billion
(s.a.a.r.). Average export volume in the 3 months ending in
November was nearly 3 per cent below its level a year earlier; over
the same period import volume rose by 12 per cent. The growth in
the volume of manufactured imports was especially strong.
Despite the weakening external sector, activity in the
domestic economy has strengthened somewhat in recent months.
Official Japanese forecasts of 6 per cent GNP growth in the year
ending March 1979 imply growth of about 9 per cent (s.a.a.r.) in
the last 2 quarters of that year. Conditions in the labor market
are virtually unchanged, however, with unemployment at high levels.
Neither the consumer price nor the wholesale price index indicates
much inflationary pressure in Japan.
In Germany, recently released provisional data on real
GNP indicate a rate of growth of about 3-1/2 per cent between 1977
and 1978, which confirms earlier evidence of a strengthening in
economic activity since last summer. The rate of unemployment de-
clined gradually throughout most of 1978 and the average number of
unemployed was below 1 million for the first time since 1974.

IV - 21
The current-account surplus of DM 16 billion ($8-1/4
billion) for the year exceeded most expectations and is the
largest surplus since 1974. Similarly, the 1978 trade surplus
is second only to the record 1974 surplus. However, in constant
(1970) prices, the trade surplus for the first 3 quarters of 1978
was DM 18 billion, compared to DM 38 billion in 1974 and DM 20
billion in 1977. This decrease in the trade volume surplus may
be attributable to the recent appreciation of the mark.
One area of concern for the Bundesbank has been the
relatively rapid expansion of the money supply. Central bank money
in 1978 increased by nearly 12 per cent, exceeding the Bundesbank's
target of 8 per cent. Furthermore, the rate of increase accelerated
in late 1978 and is currently 13 per cent (fourth quarter over third
quarter, s.a.a.r.). In December the Bundesbank set its 1979 target
to be a 6-9 per cent rate of growth for central bank money between
the fourth quarter of 1978 and the fourth quarter of 1979. Since
the announcement of the target, the Bundesbank has reduced rediscount
quotas by DM 5 billion, raised reserve requirements by 5 per cent,
and increased the Lombard rate from 3-1/2 to 4 per cent.
Recent economic developments in France have been marked
by a sharp recovery of the trade and current accounts, both of which
moved into surplus in 1978 following large deficits in 1976 and 1977.
Improvements on trade in food, automobiles, and energy products account
for the bulk of the gains. Domestic activity has shown few signs of

IV - 22
strength in recent months, with the level of industrial production
in November about the same as it had been earlier in the year.
However, recent business surveys indicate an improvement in the
business climate. In response to rapid increases in recent years
in the social insurance system's deficit (about a third of the over-
all public sector deficit), the government has announced an increase
in most of the system's charges and revisions in some benefits,
effective this month.
In the United Kingdom, real GDP increased by 3-1/2 per
cent (s.a.a.r.) between the second and third quarters of 1978.
Contributing to this growth was an 11 per cent (s.a.a.r.) increase
in real private consumption expenditures, while the volume of gross
fixed capital formation and government spending was virtually un-
changed. Data on retail sales and provisional data on consumption
indicate that consumer spending may have leveled off in the fourth
quarter of 1978. Industrial production figures for the 3 months
ending in November -- 6-1/4 per cent (s.a.a.r.) below the previous
3 months' level -- do not indicate much strength in U.K. domestic
output.
The source of the strength in British consumer demand has
been a surge in real personal disposable income, attributable
primarily to wage increases that have outstripped price increases.
In the 12 months ending November 1978, average earnings rose by
14-1/2 per cent while consumer prices increased by 8 per cent. The
rate of growth in wages has created some concern about the outlook for
the U.K. economy. The government was forced by Parliament in
IV - 23
mid-December to abandon most of the measures it had been using
in its attempt to enforce its (nonstatutory) 5 per cent limit to
wage increases. In January, the United Kingdom was hit by several
strikes in support of pay claims far in excess of the government's
5 per cent limit. Nevertheless, a substantial number of British
workers have agreed to pay increases within the government's guide-
lines, and so it is difficult to tell at this stage what the future
course of average wages will be.
Industrial production in Canada in the latest 3 months has
increased by nearly 13 per cent (s.a.a.r.) over the previous 3-
month period. Reflective of this growth in output, the Canadian
Conference Board's most recent quarterly survey of business atti-
tudes showed an increased willingness to invest due to higher
profits and capacity utilization rates. However, concern was ex-
pressed about the effect on future investment of rising interest
rates -- the Bank of Canada's bank rate was raised from 10-3/4 to
11-1/4 per cent at the beginning of January and short-term money
market rates subsequently rose an equivalent amount.
Economic activity in Italy has rebounded strongly after
the spring and summer pause; industrial production in September-
November 1978 was 26 per cent (s.a.a.r.) higher than in the previous
3 months. The main sources of strength appear to be consumer
spending and exports; at the same time, investment continues to lag.
The strength of exports -- in September-November the value of
exports (customs basis, s.a.) rose by 17 per cent (quarterly rate)

IV - 24
over the previous 3 months -- has enabled the external sector to
continue in substantial surplus, despite a sharp rise in imports
reflecting the upsurge in activity. The strong trade performance,
plus a large services surplus due mainly to tourism, is expected
to produce a current-account surplus of about $5 billion in 1978,
more than twice the 1977 surplus.
The Italian government has completed work on its 3-year
economic plan, the Pandolfi Plan, which has goals similar to those
announced last year -- higher growth of output, employment, and in-
vestment and a reduction of the inflation rate and the public-sector
deficit (as a percentage of GDP). A crucial aspect of the plan is
the assumption that real wages will be stable; however, the trade
unions' demands in the current round of negotiations of the 3-year
contract renewals would entail a significant real wage increase. In
line with the government's intention to raise investment by
providing more credit for the private sector, the Bank of Italy
announced on January 18 that it is relaxing the existing ceiling on
bank lending for the period ending March 31.
The Swiss National Bank announced on January 10 that it
will not set a money supply growth target for 1979, thereby in-
dicating that exchange-rate considerations will continue to dominate
monetary policy. Intervention to hold down the value of the Swiss
franc led to an M1 growth of about 17 per cent in 1978, more than
IV - 25
triple the 5 per cent target rate. A recent cantonal bond issue
set a coupon of 2-3/4 per cent -- equal to the post-war low -- as
the very high money-market liquidity continues to depress Swiss
interest rates.
APPENDIX A*THE FEDERAL BUDGET FOR FISCAL YEAR 1980
Overview
On January 22, 1979, President Carter submitted his fiscal
year 1980 budget to Congress. As the President promised last fall,his new budget imposes considerable restraint in the growth of Federalspending and reduces the size of the Federal deficit in fiscal years1979 and 1980. For fiscal year 1980, the budget calls for unified out-lays of $531.6 billion and projects receipts at $502.6 billion, and theresulting unified budget deficit for the fiscal year is expected to be$29.0 billion (see Table 1), significantly less than the $37.4 billiondeficit estimated for fiscal year 1979.
The reduction in the fiscal year 1980 deficit understatesthe degree of fiscal restraint proposed in the budget. The high-employ-ment budget, which measures discretionary changes in fiscal policy, isprojected to shift toward surplus by more than $10 billion between fiscalyears 1979 and 1980. The most severe restraint is expected to occur inthe second and third quarters of fiscal year 1980, when previously legis-lated social security tax increases and the President's spending curbsbegin to take effect.
The combined deficit--unified plus off-budget--is expected tobe $49 billion in the current fiscal year and $41 billion in fiscal year1980. The Treasury is expected to finance the fiscal year 1979 deficitby drawing down its cash balance and by issuing $40 billion in securitiesto the public. In fiscal year 1980, the Administration does not plan afurther drawdown in the cash balance; hence, borrowing from the publicis expected to remain about the same as in fiscal year 1979.
Economic Assumptions
The new budget estimates for both fiscal years 1979 and 1980are based on the assumption (see Table 2) that real GNP grows--fourthquarter over fourth quarter--by 2.2 per cent during 1979 and 3.2 percent during 1980. The unemployment rate is expected to edge up to6.2 per cent at the end of calendar year 1979, and to remain there through1980. The average rate of inflation--as measured by the GNP deflator--isprojected by the Administration to be 7.4 per cent in the final quarter of1979 and 6.4 per cent in the final quarter of 1980. These economic assump-tions are somewhat more optimistic than those advanced by a number of pri-vate forecasters.
* Prepared by Kevin Riper, Research Assistant, Government Finance Section,Division of Research and Statistics.
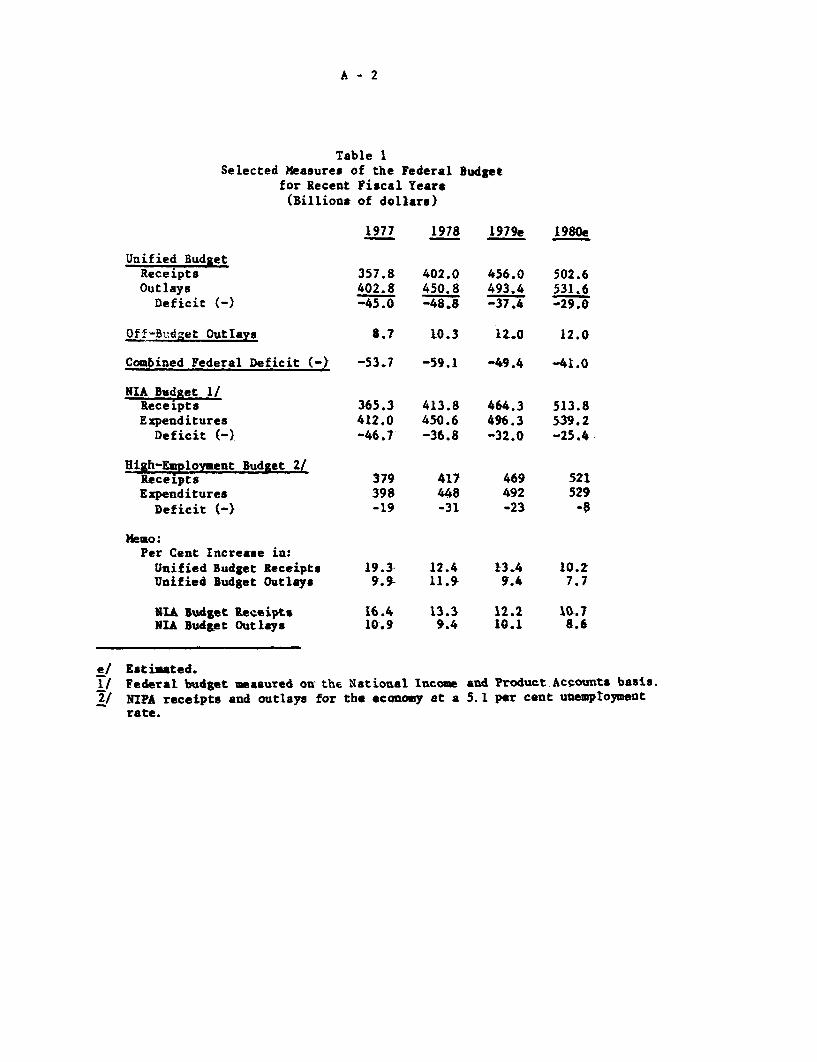
A - 2
Table 1Selected Measures of the Federal Budget
for Recent Fiscal Years(Billions of dollars)
1977 1978 1979e 1980e
Unified BudgetReceiptsOutlays
Deficit (-)
357.8402.8-45.0
402.0450.8-48.8
456.0493.4-37.4
502.6531.6-29.0
Off-Budget Outlays
Confined Federal Deficit (-)
NIA Budget 1/ReceiptsExpenditures
Deficit (-)
High-Employment Budget 2/ReceiptsExpenditures
Deficit (-}
Hemo:Per Cent Increase in:
Unified Budget ReceiptsUnified Budget Outlays
VIA Budget ReceiptsNIA Budget Outlays
8.7 10.3 12.0 12.0
-53.7 -59.1 -49.4 -41.0
365.3412.0-46.7
413.8450.6-36.8
417448-31
464.3496.3-32.0
469492-23
513.8539.2-25.4
521529-8
19.3 12.4 13.4 10.29.9- 11.9 9.4 7.7
16.4 13.3 12.2 10.710.9 9.4 10.1 8.6
Estimated.Federal budget measured on the National IncomeNIPA receipts and outlays for the economy at arate.
and Product Accounts basis.5.1 per cent unemployment

A -3
Table 2
Economic Assumptions in the Budget(Calendar years; dollar amounts in billions)
Forecast1978 1979 1980
GNP:Current dollars:
Amount 2,106 2,343 2,565Per cent change, year over year 11.6 11.3 9.5Per cent change, fourth over fourth 12.7 9.8 9.8
Constant (1972) dollars:Amount 1,384 1,430 1,466Per cent change, year over year 3.9 3.3 2.5Per cent change, fourth over fourth 4.0 2.2 3.2
Price level:GNP implicit price deflator:Level (1972 - 100), annual average 152.1 163.9 175.0Per cent change, year over year 7.4 7.7 6.8Per cent change, fourth over fourth 8.4 7.4 6.4
Unemployment rate:Total, annual average 6.0 6.0 6.2
A- 4
Receipts
There are few major new initiatives on the receipts sideof the President's budget aside from the President's real wageinsurance proposal. The Administration's insurance proposal isdesigned to increase compliance with the President's wage standardand thereby reduce inflationary pressures. Under the proposal,certain groups of employees whose compensation increases fromOctober 1978 to October 1979 are within the guidelines would be eligi-ble for a tax credit on their 1979 income tax returns, if the rateof inflation exceeds 7 per cent. Such workers would receive a taxcredit (as a per cent of wages up to $20,000) equal to the differencebetween the percentage increase in the Consumer Price Index and 7 percent. The maximum tax credit is 3 per cent even if the inflationrate exceeds 10 per cent. Given the Administration's assumed infla-tion rate of 7.5 per cent, the cost of the program is estimated bythe Administration at $2.5 billion. Most of this amount would appearas a reduction in individual taxes, and $0.2 billion would be acash grant to those wage earners whose real wage insurance creditexceeds their tax liabilities.
A small increase in railroad retirement taxes and an oilpollution levy also are proposed by the Administration. Thisrecommendation would add $0.3 billion to receipts in fiscal year1980. Thus, the President's tax initiatives would reduce revenuesby a net $2.0 billion from the current services level of $504.5billion (see Table 3). The resulting $502.6 billion in fiscal 1980receipts represents an increase of 10.2 per cent over the previousfiscal year. Receipts are expected to amount to 20.1 per cent ofprojected GNP, compared to the 19.9 rate expected for fiscal year1979.
Outlays
The rate of growth of Federal spending is expected to declinefrom the current fiscal year's 9.4 per cent pace to 7.7 per cent infiscal year 1980. This is the smallest percentage increase sincefiscal year 1973, as Table 4 shows. Federal spending as a percentageof GNP is scheduled to continue its decline from 22.6 per cent infiscal year 1976 to an estimated 21.6 per cent by fiscal year 1979and 21.2 per cent in fiscal year 1980.
In real terms, the Administration's budget proposes growthin fiscal year 1980 expenditures of 0.7 per cent, as compared with3.9 per cent in fiscal year 1978. Total spending for national

A-5
Table 3
Effects of Administration Proposals on Receipts(billions of dollars)
Current services receipts estimates
Real wage insurance
Increase in railroad retirement payroll tax
Oil pollution liability and compensation
Total proposed changes
Proposed receipts, President's budget
Fiscal Year 1980
504.5
-2.3
.2
.1
-2.0
502.6
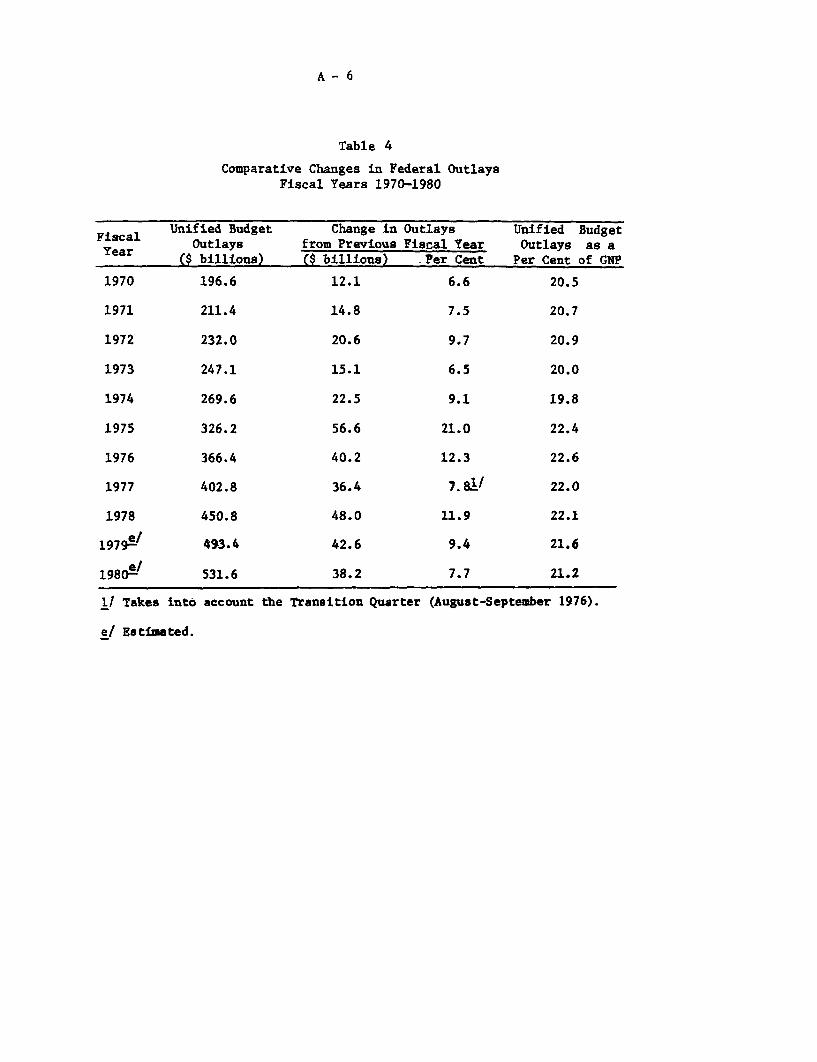
A- 6
Table 4
Comparative Changes in Federal OutlaysFiscal Years 1970-1980
Unified BudgeOutlays
($ billions:
196.6
211.4
232.0
247.1
269.6
326.2
366.4
402.8
450.8
493.4
531.6
into account
et Change in Outfrom Previous Fis() $ billions)
12.1
14.8
20.6
15.1
22.5
56.6
40.2
36.4
48.0
42.6
38.2
the Transition Quarter
:laysical YearPer Cent
6.6
7.5
9.7
6.5
Unified BudgetOutlays as a
Per Cent of GNP
20.5
20.7
20.9
20.0
FiscalYear
1970
1971
1972
1973
1974
1975
1976
1977
1978
1979-
1980
I1 Takes
e/ Estimated.
Fiscal
9.1 19.8
21.0 22.4
12.3 22.6
7.81/ 22.0
11.9 22.1
9.4 21.6
7.7 21.2
(August-September 1976).

A- 7
defense is projected to grow at a 3 per cent rate in real terms infiscal year 1980, in line with the President's May 1977 pledge toNATO members. Similarly, payments to individuals are expected toregister a gain of 4.3 per cent in real terms. Offsetting theseincreases is a sharp decline of 7.0 per cent in real nondefensepurchases and grants to states and localities.
The Administration's budget outlays may be examined in termsof current service expenditures, that is, spending that would occurif all Federal programs were carried on as currently legislated andif there were no new policy initiatives. The Administration's estimateof "current services" takes into account inflation adjustments thatare mandatory under current law or that reflect a Congressionalintent to cover costs; the estimates also allow for such items asexpected changes in the number of beneficiaries in Federal programs.In other instances, the OMB estimate does not adjust its spendingprograms for inflation. In fiscal year 1980, the Administrationprojects the current services outlay total at $536.1 billion, up$44.8 billion, or 9.1 per cent from fiscal year 1979. If OMB wereto adjust all spending programs for the extra cost of inflation, thenthe current service or policy outlays would be $544 billion.
Proposed Expenditure Increases From Current Service Levels
In order to achieve his goal of a 3 per cent rise in realdefense outlays in fiscal year 1980, the President has asked foracross-the-board program increases of $2.2 billion above the currentservices level. This increase emphasizes procurement, researchand development. These recommendations are expected to push fiscalyear 1980 defense outlays to $125.8 billion, 9.9 per cent up from aprojected $114.5 billion in fiscal year 1979.
Similarly, fiscal year 1980 outlays for income securityare budgeted to rise 12.7 per cent to $179.1 billion from anestimated $158.9 billion in fiscal year 1979. Proposed increasesfrom current services spending levels also include $0.7 billion forless stringent food stamp eligibility requirements, $0.2 billionfor the real wage insurance program, $0.4 billion for improvedmedicaid health care to children and pregnant women, and $0.3 billionfor more effective educational services for children of low incomefamilies (see Table 5).
Other budget requests for funding in excess of currentservices projections include: $0.3 billion for a greater U. S.

A- 8
Table 5
Differences Between Administration's Fiscal YearRequest and Current Services Levels
(billions of dollars)
Current Services Estimate
Proposed Increases (Total)National Defense (excluding pay)Food StampsReal Wage InsuranceHealth Services (Medicaid)Elementary and Secondary EducationMultilateral Development BanksNational Development BankVeteran's CompensationAll Other
Proposed Decreases (Total)Cap on Federal Pay Raises (civilian and military)Public Service EmploymentSummer JobsImpact AidMedicare and MedicaidSocial SecurityVeteran's BenefitsAgricultural Price Supports (CCC)Strategic Petroleum ReserveRailroadsEducationAll Other
Predident's Request (Total)
1980 Budget
Fiscal Year 1980
536.1
7.02.2.7.2.4.3.3.2.52.2
-11.5-3.0-.5-.3-.2-1.7-.7
-. 4-2.9
531.6
A- 9
contribution to multilateral development banks; $0.2 billion for theNational Development Bank, part of the President's urban initiative;and $0.5 billion for a 7.8 per cent increase in veteran's compensa-tion benefits. In all, the budget for fiscal year 1980 proposes$7.0 billion in spending increases relative to current service levels,as shown in Table 5.
Proposed Expenditure Reductions From Current Service Levels
The largest spending cut from current services resultsfrom a 5.5 per cent limit on pay raises for all Federal employees--military and civilian--instead of the 10.25 per cent pay raise thatwould occur under present law. This is expected to save $3.0 billionin 1980. In the grants category, the Administration proposesreduced spending of $0.5 billion as countercyclical public serviceemployment jobs are cut from 625,000 at the end of fiscal year 1979to 467,000 at the end of fiscal year 1980. In addition, $0.3 billionis cut from the summer jobs program for economically disadvantagedyouths and $0.2 billion is cut from impact aid.
The Administration also will ask Congress for three piecesof legislation which would cut current services outlays in fiscalyear 1980: (1) hospital cost containment, which, if passed,presumably would reduce Medicare and Medicaid spending by $1.7 billion;(2) Social Security program changes which would eliminate the $255lump sum burial payment, phase out benefits for students 18 to 21 andtighten eligibility requirements under the disability program (totalestimated savings $0.7 billion); (3) reform in the veteran's programwhich would tighten eligibility requirements for certain medical carereimbursements and educational benefits (estimated savings $0.3 billion).Other reductions in current services spending levels are anticipatedfor agricultural price supports ($0.7 billion), strategic petroleumreserve ($0.3 billion), railroads ($0.5 billion), and education ($0.4billion).
The proposed decreases total $11.5 billion but thesereductions are offset by the $7 billion in proposed increasesdescribed earlier. The net change is a decrease of $4.5 billionand this yields the President's final spending proposal of $531.6billion in fiscal year 1980. (See Table 5).
The Administration's success in attaining the goals setforth in this budget will depend as much on prevailing economicconditions as on programmatic decisions within the Administration'scontrol. A higher-than-expected unemployment rate, for example, would

A - 10
automatically trigger greater outlays for unemployment insurance.Rapid increases in the price level would imply greater spending forthose programs indexed for inflation such as social security benefits.(On the other hand, higher nominal incomes would increase receipts,as inflation pushes wage earners into higher tax brackets.)
In addition, continued high interest rates would result inhigher than estimated interest outlays. It should be noted that OMBhas changed its estimating assumptions for interest rates. Untilrecently, the interest rate assumed throughout the forecast periodwas the same as the interest rate prevailing at the time estimateswere made. Starting with this budget, however, the interest outlayprojection rests on the assumption that the 91-day bill rate willdecline in conformance with reductions in the rate of inflation. Theaverage level of the bill rate in calendar year 1979 is assumed tobe 8.8 per cent and to be 7.6 per cent in calendar year 1980. Hadthe old method been used, fiscal year 1980 interest outlays wouldhave been $2.0 billion higher than the figure presented in this year'sbudget.

B- 1
APPENDIX B*NEW ESTIMATES OF THE HIGH EMPLOYMENT BUDGET SURPLUS/DEFICIT
The high employment budget surplus/deficit (HES/D)presents estimates of the Federal government budget surplus ordeficit (NIPA basis) that would be recorded if the economy wereoperating at its potential level of output. The official esti-mates of potential output--made by the Council of EconomicAdvisers--have recently been revised and these new estimateshave been incorporated into our estimates, and projections,of the HES/D.
The subsequent discussion (1) explains the nature ofthe revision in the estimates of potential GNP, (2) brieflydescribes how the HES/D is calculated, and (3) compares the staff'snew and old estimates of the level and change in the HES/D.
Revision in Estimates of Potential GNP by Council
Potential GNP is defined as the level of real outputthat the economy could produce at high rates of resource utili-zation. The Council of Economic Advisers has revised its estimatesof GNP and the (full employment) unemployment rate associatedwith it. 1/ Potential real GNP is now estimated to have grownat a 3 per cent annual rate since 1973; this compares with theprevious estimate of about 3-1/2 per cent over the precedingfive years. (See Table 1.) With the downward revision in thegrowth of potential GNP, the level of potential GNP was alsorevised down somewhat. In determining what is a high level ofresource utilization, the Council has raised its estimate ofthe full employment unemployment rate--for 1978 and 1979--from4.9 per cent to 5.1 per cent.
The slowing in the rate of productivity growth inrecent years, particularly in both 1977 and 1978, was the pri-mary factor responsible for the revisions in high employmentpotential GNP. An important--but not sole--contributor to thelower rate of productivity growth has been the slowdown in
1/ The Annual Report of the Council of Economic Advisers,pp. 72-76.
* Prepared by Darrel Cohen, Economist, Government FinanceSection.
B - 2
capital investment relative to the expansion of the labor force.Because of this experience, the estimated potential rate of growthof productivity for the 1973 to 1978 period has been revised down-ward from over 1.5 per cent to around 1 per cent a year--aboutequal to the average rate of increase since 1973. The underlyinggrowth rate of the labor force is still estimated to have been
2-1/2 per cent per year, and the workweek to have declined 0.5per cent per year. Taken together these components of potentialgrowth yield growth in potential GNP of 3 per cent per year forthe 1973 to 1978 period. This same rate of growth is projectedto hold during the next few years (1978-1983), as a projected.fall in labor force growth is estimated to be offset by a pickupof productivity growth.
Calculating and Interpreting the HES/D
The HES/D is an attempt tormeasure discretionary fiscalactivity alone. It has long been recognized that the actualFederal surplus or deficit is not a satisfactory measure of dis-cretionary fiscal policy; because changes in revenues and, tosome extent, expenditures reflect not only new policy initiativesbut also the impact of economic fluctuations on the budget. TheHES/D seeks to abstract from the influence of such fluctuationsby estimating what the budget position would be if there were nobusiness cycle, and if the economy were growing along a path ofrelatively full capacity output. Given such estimates of thelevel of the HES/D, one can determine the degree of discretionaryfiscal restraint or stimulus over a period by examining changesin the HES/D. A positive change (or increase) in the HES/D isnormally an indication of fiscal restraint while a negativechange (or decrease) is an indication of fiscal stimulus.
The method employed by the staff and most other analyststo estimate the high employment budget is rather straight forward.High employment receipts are estimated by (1) defining a highemployment rate of resource utilization and calculating the hypo-thetical level of real GNP consistent with that rate, (2) com-puting nominal potential GNP by multiplying real potential GNPby the rate of inflation observed or assumed in the actual
B-3
economy 2/, (3) estimating three income components of nominalpotential GNP--corporate profits, personal income, and wages andsalaries, and (4) applying the appropriate tax rates on theseincome components in order to derive the high employment NIPAreceipts estimate. The difference between the receipts thatresult from the high employment potential output and actualreceipts measures the effect of economic fluctuations on taxcollections.
Estimating high employment expenditures is somewhatless complicated. It is assumed that only unemployment compensa-tion.responds to changes in the level of economic activity, 3/and thus, high employment expenditures simply equal actual (orbudgeted) expenditures adjusted for cyclically related unemploy-ment compensation.
The Staff's Estimate of the HES/D
The new potential GNP estimates result in lowerpotential tax receipts, and a reduction in both the level andthe change in the high employment surplus. A comparison of thenew and old estimates of the HES/D for fiscal years 1974-1980is found in Table 2. 4/
2/ This inflation assumption obviously is crude and should bekept in mind by the user of the data.
3/ This assumption may not be realistic given that the food-stamp program, veteran's benefits, social security payments,and public assistance grants also respond to changes in thelevel of economic activity. These items are not included inthe expenditures adjustment due to the difficulty of separa-ting cyclically related increases in spending from theirnormal program growth.
4/ It should be noted that the new estimates of the HES/D forfiscal years 1979 and 1980 found in Table 2 differ from theestimates found in Part 1 of the Greenbook. This is becausethe estimates in Table 2 allow only for the changes in poten-tial GNP whereas the estimates in Part 1 allow for otherchanges in fiscal policy assumptions as well.
The difference in the new and old estimates of the highemployment surplus is $1.3 billion in fiscal year 1974; almost$23 billion in fiscal year 1980. The new estimates fall increas-ingly short of the old ones because of the lowering of the growthrate of potential GNP. For the same reason, the difference betweenthe new and old estimates of the change in the HES/D grows overtime, although in not nearly so pronounced a way.
As discussed earlier, the change in the HES/D is muchbetter than the level as a measure of discretionary fiscal policy.Examination of the changes in the HES/D shows that both the newand old estimates yield a qualitatively identical view of thestance of fiscal policy. For example, both estimates show thatfiscal policy was expansionary in fiscal years 1975 and 1976.Fiscal restraint was indicated in fiscal years 1977 and 1978,while increasing restraint is shown through 1980.

APPENDIX B
Table 1
COMPARISON OF OLD AND NEW POTENTIAL GNP ESTIMATES(Billions of dollars, except as noted)
Fiscal Year
1974
1975
1976
1977
1978
1979
1980
Old HighEmploymentBenchmarkUnemployment
rate (%)
4.8
4.8
4.8
4.8
4.9
4.9
4.8
New HighEmploymentBenchmark
Unemploymentrate (%)
5.0
5.1
5.1
5.1
5.1
5.1
5.0
Real Potential GNPOld New
1,249.8
1,294.1
1,340.0
1,399.7
1,449.4
1,500.8
1,554
1,243.9
1,281.2
1,319.6
1,369.3
1,410.3
1,452.7
1,496
% Growth inReal Potential
GNPOld New
3.5 3.0
3.5 3.0
3.5 3.0
3.5 3.0
3.5 3.0
3.5 3.0
3.5 3.0
Source: Council of Economic Advisers and Economic Report of the President,January 1979.
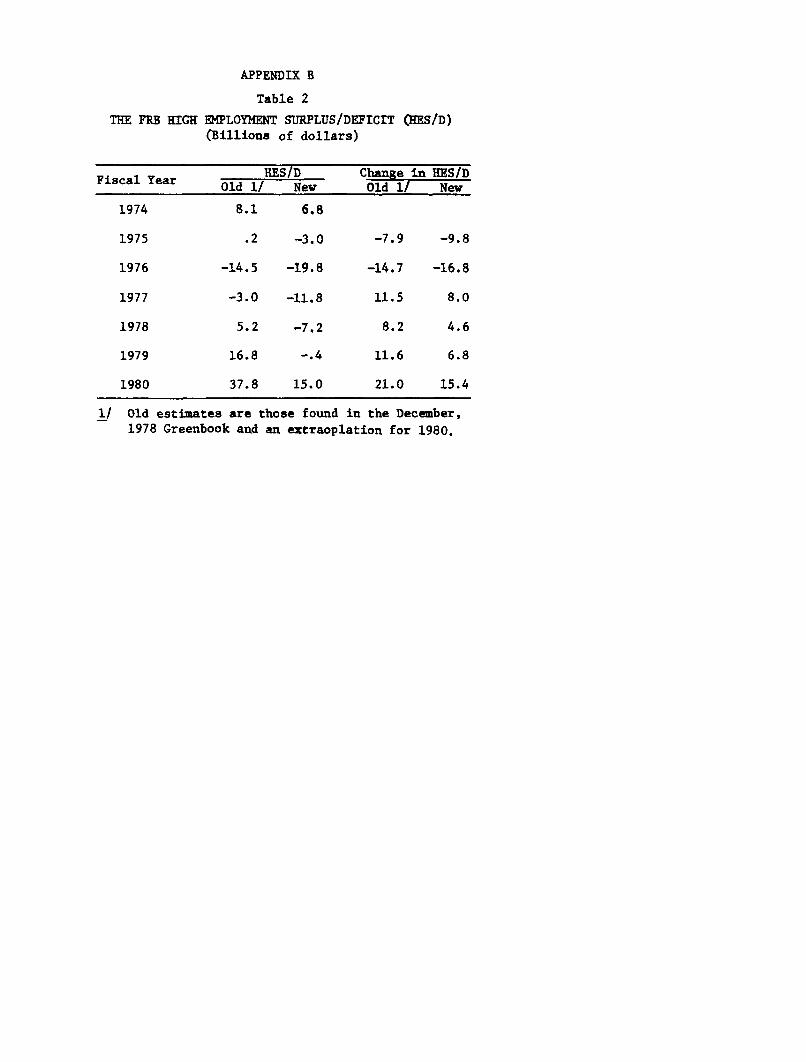
APPENDIX B
Table 2
THE FRB HIGH EMPLOYMENT SURPLUS/DEFICIT (HES/D)(Billions of dollars)
Fiscal Year
1974
1975
1976
1977
1978
1979
1980
HES/DOld 1/ New
8.1 6.8
.2 -3.0
-14.5 -19.8
-3.0 -11.8
5.2 -7.2
16.8 -. 4
37.8 15.0
Change in HES/DOld 1/ New
-7.9
-14.7
11.5
8.2
11.6
21.0
-9.8
-16.8
8.0
4.6
6.8
15.4
1/ Old estimates are those found in the December,1978 Greenbook and an extraoplation for 1980.