focal mechanism determination and identification of the...
TRANSCRIPT

Bulletin of the Seismological Society of America, 89, 6, pp. 1558-1574, December 1999
Focal Mechanism Determination and Identification of the Fault Plane of Earthquakes Using Only One or Two Near-Source Seismic Recordings
by Bertrand Delouis and Denis Legrand
Abstract A waveform inversion scheme was developed in order to explore the resolving power of one or two seismic recordings at short epicentral distance for the determination of focal mechanisms and the identification of the fault plane of earth- quakes. Two key features are used to constrain the fault parameters with a reduced number of stations: (1) a simple finite-dimension source model and (2) the modeling of the complete displacement field, including the near-field waves. The identification of the fault plane should be possible, even with a single station, as soon as the seismograms produced by the two nodal planes of a same focal mechanism are significantly different, which is the general case when waveforms are controlled by source finiteness. Seven parameters, including the strike, dip, rake, and dislocation, are explored with a grid search, and the minima of the misfit error between the observed and calculated seismograms are mapped. With such an approach, it is pos- sible to conclude about the uniqueness or nonuniqueness of the solutions. The method is tested with three earthquakes of moderate to large size for which the fault plane is well established and for which strong-motion records are available at maximum distances of a few tens of kilometers. Test events are the 1994 Northridge (Mw = 6.7, California), the 1996 Copala (Mw = 7.3, Mexico), and the 1996 Pinotepa Na- cional (Mw = 5.4, Mexico) earthquakes. In the case of inversions with two stations, we find a unique solution, or a group of similar solutions, with a good estimation of the focal mechanism and the proper selection of the fault plane. Our results also show that in some cases a single station may be enough to recover the fault parameters. The inversion scheme presented here may be systematically applied to future earth- quakes, especially to those recorded by few stations. It should be particularly useful in the case of blind faults for which the fault plane may not be identified with the help of other data.
Introduction
The determination of focal mechanisms and the identi- fication of the fault plane of earthquakes can be a critical contribution of seismology to regional tectonic studies and to the assessment of expected deformation and damage pat- terns. Near-source seismograms, recorded at a hypocentral distance not much larger than the source dimension, are par- ticularly sensitive to the three-dimensional orientation and finiteness of the earthquake rupture plane. We aim to take advantage of this property, that is, use near-source record- ings to constrain focal mechanisms and discriminate be- tween the fault and auxiliary planes of earthquakes.
Many seismic regions of the world are still equipped with sparse arrays of strong-motion or broadband instru- ments, and in those areas, earthquakes have a high proba- bility to be recorded by only one or a few near-source sta- tions. For that reason, we considered it important to explore
the extreme case where only one or two near-source records would be available.
Teleseismic waveform inversions can provide a focal mechanism for most earthquakes of magnitude larger than about 5.5, but near-source seismograms can also be used to control, or refine, focal mechanisms. In some cases, near- source recordings may even be the only source of informa- tion for the determination of a focal mechanism.
Automatic or routine teleseismic point-source inver- sions (e.g., Dziewonsld et al., 1981; Sipldn, 1982; Kawa- katsu, 1995) give the seismic moment tensor but cannot specify the fault plane. With the point-source representation, the fault plane cannot be identified among the two nodal planes by waveform modeling. When surface ruptures are not observed, as in the case of too small events or blind faults, and when neither well-distributed aftershocks nor
1558

Focal Mechanism Determination and Identification of the Fault Plane of Earthquakes Using Seismic Recordings 1559
local GPS data are available, the fault plane may be unde- termined. Methods generally used to select the fault plane of earthquakes by waveform analysis are based on the ob- servation of directivity effects associated with finite ruptures (e.g., Mori and Hartzell, 1990; Li etaL, 1995; Dreger, 1997). They start with a beforehand fixed focal mechanism and re- quire a relatively large number of seismic stations that are well distributed azimuthally around the epicenter. The method presented in this article includes the effects of source finiteness directly in the inversion process, allowing us to invert sparse, near-field data for the focal mechanism and for the fault plane simultaneously. No a priori information about the fault orientation is needed. The seismic data con- sidered here are displacement seismograms integrated from three-component strong-motion records.
Kanamori et aL (1990) and Singh et aL (1997) showed clear examples of local events for which source parameters could be well constrained by using near-field waves, even with a single station. Singh et al. (1998) have proposed an inversion scheme for near-field data. However, it is based on point-source synthetics in an infinite space. For that reason, it is valid for small- to moderate-sized events and cannot be used for determining the fault plane. Here, a good constraint of the source parameters with a few stations is researched through the use of both a finite source model and near-field waves. Near-field waves contain information about the source that is complementary to the contribution of the P and S far- field waves. Furthermore, near-field waves are characterized by a faster decay in amplitude with distance in comparison to far-field waves (decay like R-2 for near-field waves in- stead of R-1, Wu and Ben-Menahem, 1985). Legrand et al. (1999) showed how this property may help to locate point sources with nearby stations. Here, this property is suspected to provide a sharp constraint on the orientation of the fault plane when a finite-dimension-source model is used.
An important question to be addressed in the single- or two-station inversion is the uniqueness of the solution. Re- sults of the inversion may not be confidently used for seis- motectonic interpretations if the existence of significantly different solutions fitting the data equally well is not inves- tigated. For that reason, we choose a grid-search approach.
For the sake of simplicity, the source model used here is a single finite fault with a homogeneous slip distribution and a constant rupture velocity. Synthetic seismograms are calculated at the surface of a uniform elastic half-space using the formulation of Johnson (1974), with exact expressions for the displacement field, including the near-field waves.
The method is tested with three earthquakes: the 1994 Northridge (Mw = 6.7, California), the 1996 Copala (M w = 7.3, Mexico), and the 1996 Pinotepa Nacional (Mw = 5.4, Mexico) mainshocks.
Earthquake Rupture Model
Earthquakes are modeled here as extended-finite sources. Source finiteness is approximated by a summation
of dislocation point sources (Hartzell et al., 1978). Point sources are distributed at the nodes of a regular square grid covering the entire fault. Each point source represents a square subfault, and the sum of the subfault areas is equal to the total surface of the fault. We will assume for the sake of simplicity that the source-time function is identical for each point of the fault and that it is a linear ramp with a rise time r and a final slip offset Au (dislocation). The rupture front propagates from the hypocenter at a constant velocity Vr- The relative position of the fault center with respect to the hypocenter is inverted for, allowing for ruptures varying from symmetric to strongly asymmetric. With the approach used here, the only a priori information needed is the hy- pocentral location (which represents the nucleation point of the rupture) as well as an a priori estimation of the seismic moment.
Rupture Parameters
Earthquake ruptures are represented here using a simple square fault model described by nine parameters, as illus- trated in Figure 1: the length (L) of the fault plane; the strike
N
Soaree time fanction : Fa~It offset
Au ............ Down
~ Circular rupture front progating
at velocity V r
- , ~ hylx~center (rupture initiation) C center of tile f~lt • point source
~"-~"---~'- slip direction
Figure l . Earthquake rupture model. The gray shaded surface is the fault plane. The nine rupture parameters are as follows: L (fault dimension); 4), 3, 2 (strike, dip, rake angles); £t, £2 (coordinates of the hypocenter on the fault plane); r (rise time); Au (fault slip offset, or dislocation); and Vr (rupture velocity). The slip direction, rise time, and slip offset are the same for each point source. The arrow representing the slip vector is not scaled. A1 is the spatial sampling. The ~:1 and ~:2 axes are along fault strike and fault dip, respectively.

1560 B. Delouis and D. Legrand
Table 1 Station Data for the Three Test Events
Sampling Sensor Lat. Long. Filter* (Hz)t
Northridge JFG SMA-1 34.313 - 118.498 BP 0.1-0.3 2 SCT FBA-23 34.106 - 118.454 LP 0.3 2
Copala COPL FBA-23 16.605 - 98.974 LP 0.3 2 PNIG FBA-23 16.392 - 9 8 . 1 2 7 LP 0.3 2
Pinotepa PNIG FBA-23 16.392 - 98.127 no filtering 10
*Burterworth filter, 3 poles, BP = bandpass, LP = lowpass. "~'After decimation
Table 2 Values of the Parameters Explored during the Grid Search
First Step: Coarse Search
Strike 0 ° 45 ° 90 ° 135 ° 180 ° 225 ° 270 ° 315 °
Dip 10 ° 25 ° 40 ° 55 ° 70 ° 85 °
Rake - 180 ° - 135 ° - 9 0 ° - 4 5 ° 0 ° 45 ° 90 ° 135 °
Vr 3 values tested: V1 = 0.95. Vs, V2 = 111-0.4 kin/see, V3 = Vt-0.8 km/ sec
Position of the rupture initiation with respect to the fault center 5 posit ions (~-t, ~2): (0,0) ( - L / 3 , 0 ) (L/3,0) ( 0 , - L / 3 ) (0,L/3)
Second Step: Fine Search (Zoom)
Min represents the value of the parameter at one of the min ima of the rms function found during the coarse search
Strike (Min - 2 0 °) (Min - 1 0 °) (Min) (Min + 10 °) (Min + 20 °)
Dip (Min - 5 °) (Min) (Min + Y)
Rake (Min - 20 °) (Min - 10 °) (Min) (Min + 10 °) (Min + 20 °)
Vr fixed to Min
Position of the rupture initiation with respect to the fault center 5 positions (~1, ~2): (Min,Min) ( M i n - L / 6 , Min) (Min + L/6,Min)
(Min, M i n - L/6) (Min,Min + L/6)
(~b), dip (c5), and rake (2) angles of the focal mechanism (Aid and Richards, 1980); the rise time (3); the final dislocation on the fault (Au); the rupture velocity (Vr); and the Cartesian coordinates (¢1, ~2) of the hypocenter on the fault surface. In fact, the absolute position in space of the hypocenter is kept fixed. It is the fault center that is allowed to move rela- tive to it. We proceed in such a way because the location of the hypocenter is generally better known than the location of the fault center. In the examples treated in this article, the main fault plane is taken to be square (width equal to length). However, rectangular faults may be used as well (e.g., Le- grand and Delouis, 1999).
In order to reduce the number of parameters in the in- version, we decided to fix the size of the fault (L) and the rise time (3) that can be estimated from an a priori value of
the seismic moment (Mo) resulting from previous studies. The slip offset (Au), on the other hand, is inverted for be- cause a proper value of Au is needed in order to match the amplitude of the observed signals (Au only has an influence on the amplitude of the signals). The values of L for the three test examples presented in this article are estimated using the empirical relation M w = 4.33 + 0.9 log (RAt) given by Wells and Coppersmith (1994) for reverse faulting events, where RA is the rupture area in km 2. Here, we sup- pose that RA is equal to L 2. The rise times 3 used are esti- mated using the relation 3 = Au/V slip, where Au is the dislocation that is supposed to be the same everywhere on the fault, and Wslip is the slip velocity taken to be 1 m/see. Compilations of slip rise times for moderate to large earth- quakes made by Heaton (1990) and Somerville et al. (1993), together with more recent inversion studies of the 1992 Landers and 1994 Northridge earthquakes (Wald and Hea- ton, 1994; Cotton and Campillo, 1995; Hartzell et al., 1996; Wald et al., 1996), indicate that slip velocity ranges between 0.5 and 2.5 m/see, with an average value of about 1 m/see (Graves, 1998). In order to calculate 3 before starting the inversion, we need an a priori estimation of the dislocation. For that purpose, we use the formula Au = Mo/pL 2, with # = 3.5 × 10 it dyne cm -2.
Data and Data Processing
The selection of the seismic data and the processing methodology was aimed at obtaining displacement seismo- grams in which the lowest frequencies generated by earth- quakes are as well preserved as possible. We model only the low-frequency part of the seismograms because it is sup- posed to contain the information needed to constrain the fault orientation and slip direction and because it is less af- fected by the crustal structure and rupture complexities. In the three test examples chosen in this article, we use with preference digital strong-motion accelerometers installed on hard rock. With such records, the static displacement (resid- ual offset that may be observed on the displacement seis- mograms) may be retrieved after double integration (e.g., Anderson et al., 1986; Courboulex et al., 1997; Delouis et al., 1997). In order to correct for possible artificial baseline shifts in the acceleration records, we use a modified version of the method proposed by Iwan et al. (1985). We used a low-pass filter that preserves the static component to smooth the seismograms. Sensor types and filters are indicated in Table 1, together with other station data. Analog instruments (e.g., SMA-1) may also be used for our purpose if they are close enough to the rupture so that the seismic signal dom- inates the noise level at relatively low frequency. The noise level is, however, too high in SMA- 1 records to retrieve the static displacement. In the case where an SMA-1 has been used (station JFG, Table 1), we applied an additional high- pass filter with a cutoff frequency at 0.1 Hz in order to avoid artifacts produced by the integration of low-frequency noise.

Focal Mechanism Determination and Identification of the Fault Plane of Earthquakes Using Seismic Recordings 1561
Invers ion Procedure
To invert the seismic data for the seven source param- eters described earlier (~b, c~, 2, Vr, ~1, ~2, Au), we use a two- step grid search. The criterion of selection in the grid search is the minimization of the normalized rms error between the observed data (complete recorded seismograms) and the cal- culated synthetics:
rms = (1 / ns ta t ) ' £ k rmsk
with nstat = number of stations and Z k = sum from k --- 1 to nstat,
mas k = SQRT [Zj(Oj - Cj) 2 / Y~,j(Oj)2]k
with Ej = sum from j = 1 to N, N being the total number of samples for the three components of the seismogram, O] and C] corresponding to the observed and calculated signals, respectively.
The first step corresponds to a coarse search in the over- all parameter space. The second step is a fine search around the minima of the rms function resulting from the coarse search (zoom effect). The discrete values of the parameters tested in the grid search are indicated in Table 2. The tested positions of the fault center with respect to the rupture ini-
Station
I I I I
I I I I
I I I P
Figure 2. Scheme showing why source finiteness leads to different seismograms for the two nodal planes of a same focal mechanism. The shaded sur- faces represent the two nodal planes of an arbitrary focal mechanism for a finite source at depth. Black spots, representing examples of radiating points on the nodal planes, were chosen to show how paths to a near-source station can be different for one nodal plane (continuous lines) and for the other (dashed lines). Different paths will lead to different seismo- grams because the travel times and the positions of the radiating points relative to the station will be dif- ferent for both nodal planes.
tiation in the coarse search correspond to the following five rupture types: a centered symmetric rupture, and~ nearly uni- lateral ruptures along the strike, antistrike, updip, and down- dip directions (Table 2), Oblique directions of rupture are tested in the fine search. In order to save computing time by reducing the number of synthetics calculations, a specific procedure is applied to determine the dislocation Au. Once test values for the other parameters have been selected by the grid search, synthetic seismograms are generated for a unit slip offset. Then, a series of evenly spaced values of Au are tested, and the value minimizing the rms error is retained. Because the relation between the amplitude of the synthetics
nodal plane 2 fault length = 15 km fault center at 10 km depth epic. distance = 15 km hypocenter at the center of the fault
nodal plane 1
nodal plane 1 nodalplane, 2 N_.S.
10 cm ', E W
i t
Z
0 5 sec I I
Figure 3. Example of synthetic seismograms pro- duced by the two nodal planes of a same focal mech- anism for a finite-dimension source model and a near- source station. The focal mechanism was chosen arbitrarily, and the open circle indicates the position of the station on the focal sphere (lower hemisphere, equal-area projection). The three-component syn- thetic seismograms are drawn for each nodal plane and compared. The rupture is symmetric with an ini- tiation at the fault center in both cases. In this ex- ample, the rupture velocity is 2.8 km/sec, the rise time 0.6 sec, the slip offset 80 cm. Seismograms are unfil- tered. Seismograms generated by each nodal plane are significantly different, though rupture propagates in the same fashion on each plane,
1562 B. Delouis and D. Legrand
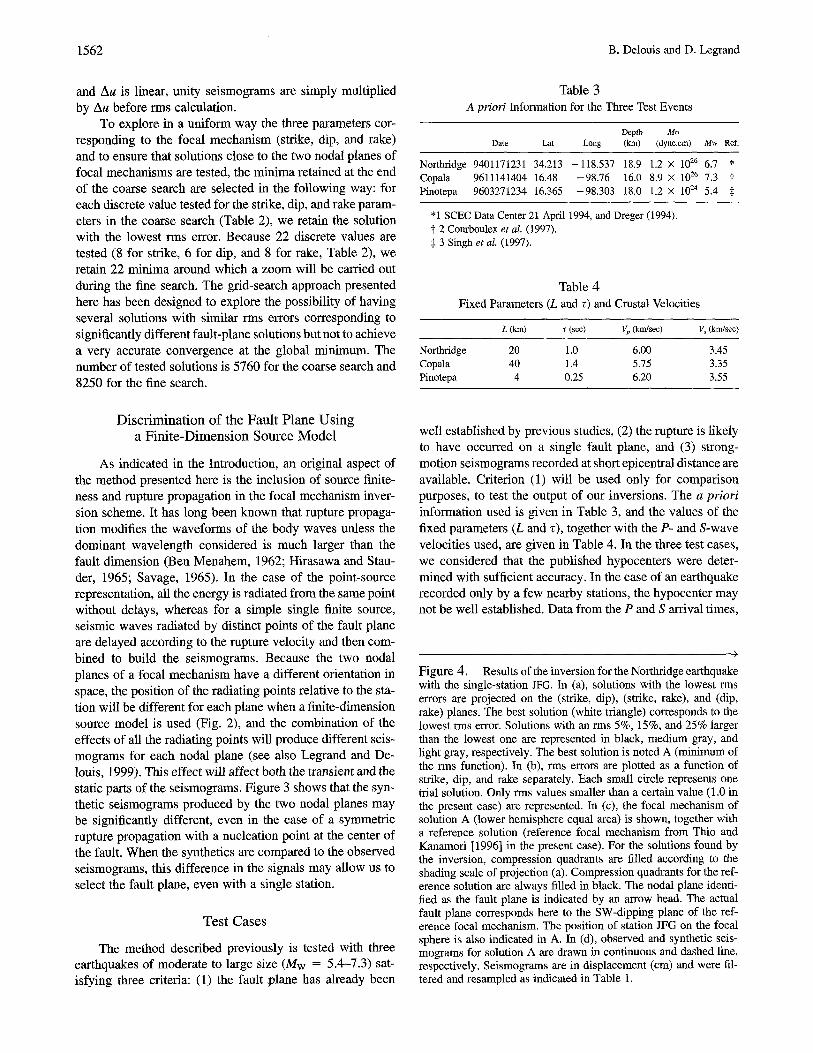
and Au is linear, unity seismograms are simply multiplied by Au before rms calculation.
To explore in a uniform way the three parameters cor- responding to the focal mechanism (strike, dip, and rake) and to ensure that solutions close to the two nodal planes of focal mechanisms are tested, the minima retained at the end of the coarse search are selected in the following way: for each discrete value tested for the strike, dip, and rake param- eters in the coarse search (Table 2), we retain the solution with the lowest rms error. Because 22 discrete values are tested (8 for strike, 6 for dip, and 8 for rake, Table 2), we retain 22 minima around which a zoom will be carried out during the fine search. The grid-search approach presented here has been designed to explore the possibility of having several solutions with similar rms errors corresponding to significantly different fault-plane solutions but not to achieve a very accurate convergence at the global minimum. The number of tested solutions is 5760 for the coarse search and 8250 for the fine search.
Table 3 A priori Information for the Three Test Events
Depth Mo Date Lat Long (kin) (dyne.cm) Mw Ref.
Northridge 9401171231 34.213 -118.537 18.9 1.2 × 1026 6.7 * Copala 9611141404 16.48 -98.76 16.0 8.9 × 1026 7.3 t Pinotepa 9603271234 16.365 -98.303 18.0 1.2 × 1024 5.4 $
*1 SCEC Data Center 21 April 1994, and Dreger (1994). ~ 2 Courboulex et al. (1997). :) 3 Singh et aL (1997).
Table 4 Fixed Parameters (L and z) and Crustal Velocities
L (km) ~ (sec) V~ (km/sec) V, (kngsec)
Northridge 20 1.0 6.00 3.45 Copala 40 1.4 5.75 3.35 Pinotepa 4 0.25 6.20 3.55
Discr iminat ion of the Fault Plane Using a Fini te-Dimension Source Model
As indicated in the Introduction, an original aspect of the method presented here is the inclusion of source finite- ness and rupture propagation in the focal mechanism inver- sion scheme. It has long been known that rupture propaga- tion modifies the waveforms of the body waves unless the dominant wavelength considered is much larger than the fault dimension (Ben Menahem, 1962; Hirasawa and Stan- der, 1965; Savage, 1965). In the case of the point-source representation, ail the energy is radiated from the same point without delays, whereas for a simple single finite source, seismic waves radiated by distinct points of the fault plane are delayed according to the rupture velocity and then com- bined to build the seismograms. Because the two nodal planes of a focal mechanism have a different orientation in space, the position of the radiating points relative to the sta- tion will be different for each plane when a finite-dimension source model is used (Fig. 2), and the combination of the effects of all the radiating points will produce different seis- mograms for each nodal plane (see also Legrand and De- louis, 1999). This effect will affect both the transient and the static parts of the seismograms. Figure 3 shows that the syn- thetic seismograms produced by the two nodal planes may be significantly different, even in the case of a symmetric rupture propagation with a nucleation point at the center of the fault. When the synthetics are compared to the observed seismograms, this difference in the signals may allow us to select the fault plane, even with a single station.
Test Cases
The method described previously is tested with three earthquakes of moderate to large size (Mw = 5 .47.3) sat- isfying three criteria: (1) the fault plane has already been
well established by previous studies, (2) the rupture is likely to have occurred on a single fault plane, and (3) strong- motion seismograms recorded at short epicentral distance are available. Criterion (1) will be used only for comparison purposes, to test the output of our inversions. The a priori information used is given in Table 3, and the values of the fixed parameters (L and z), together with the P- and S-wave velocities used, are given in Table 4. In the three test cases, we considered that the published hypocenters were deter- mined with sufficient accuracy. In the case of an earthquake recorded only by a few nearby stations, the hypocenter may not be well established. Data from the P and S arrival times,
Figure 4. Results of the inversion for the Northridge earthquake with the single-station JFG. In (a), solutions with the lowest rms errors are projected on the (strike, dip), (strike, rake), and (dip, rake) planes. The best solution (white triangle) corresponds to the lowest rms error. Solutions with an rms 5%, 15%, and 25% larger than the lowest one are represented in black, medium gray, and light gray, respectively. The best solution is noted A (minimum of the rms function). In (b), rms errors are plotted as a function of strike, dip, and rake separately. Each small circle represents one trial solution. Only rms values smaller than a certain value (1.0 in the present case) are represented. In (c), the focal mechanism of solution A (lower hemisphere equal area) is shown, together with a reference solution (reference focal mechanism from Thio and Kanamori [1996] in the present case). For the solutions found by the inversion, compression quadrants are filled according to the shading scale of projection (a). Compression quadrants for the ref- erence solution are always filled in black. The nodal plane identi- fied as the fault plane is indicated by an arrow head. The actual fault plane corresponds here to the SW-dipping plane of the ref- erence focal mechanism. The position of station JFG on the focal sphere is also indicated in A. In (d), observed and synthetic seis- mograms for solution A are drawn in continuous and dashed line, respectively. Seismograms are in displacement (cm) and were fil- tered and resampled as indicated in Table 1.

Focal Mechanism Determination and Identification of the Fault Plane of Earthquakes Using Seismic Recordings 1563
NORTHRIDGE Mw = 6.7, extended source, single station (JFG)
9 0 t~ 6 0
30 0-
a) A A b )
60 120 180 240 300 360 0 30 60 90 A Dip
60 120 180 240 300 360 S t r i k e
A-best II :+5% N:+15% :+25%
C ~ ) A Thio and Kanamori (1996)
1.0
0.8
0.6
0.4-
~i,o~ i ' , r l i l Q , ; l i J l i l
8
A 60 120 180 240 300
Strike
1.0 ,!|~,
o J'll 0.6-1
i
0.4 I I
360
Oo.i o 1°/ii' i !ii iiiiii!l ! .... ,.~,. !!]!!o ] ][!!i111i!111 .,-..'. o oo;,j ~ ,,. ,..,. ~'~"~'~ f i~l °o! ~!ill!l'°° I-
o14 . . . . ....... , -180 -120 -60 0 60 120 180
Rake
A 0 30 60 90
Dip
N N
J F G
d) JFG DIST'12 AZ' 18
cm EW
Z
5 s e c " J f
1564 B. Delouis and D. Legrand
together with the azimuth of the arrival of the P wave, and the angle of incidence of the P wave at the free surface may permit the hypocenter to be located adequately (e.g., Singh et al., 1997, with a single station). In the case of a doubtful location, a series of inversions for different hypocenter lo- cations would preferably be carried out.
Results of the inversion are shown in Figures 4, 6--10, and 12. In each of those figures, the following features are shown: (a) a projection of the best solutions on the (strike, rake), (strike, dip), and (dip, rake) planes, allowing us to map the minima of the rms function in the (strike, dip, rake) space; (b) individual plots of rms as a function of tested values of the strike, dip, and rake parameters that give ad- ditional information about the shape and relative position of the global and secondary minima over a larger interval of rms; (c) focal mechanisms of representative solutions for which the misfit error is not larger than the lowest rms by more than 15% the fault plane selected by the inversion is indicated with an arrow head; a reference solution, chosen on the basis of the available information on the focal mech- anism, is also shown; and (d) comparison between the ob-
served and calculated seismograms for the best solution. Pre- sentation of the results is focused on the solutions for strike, dip, and rake, but the complete listing of the values found for the inverted parameters is given in Tables 567-8. Instead of a formal calculation of error bars on the parameter, we prefer to show the shape of the minima of the rms function (in a and b) and to draw representative solutions associated to them.
Northridge
The 17 January 1994 (M w = 6.7) Northridge earth- quake occurred in the Los Angeles (California) metropolitan area. Numerous strong-motion records, GPS data, leveling lines, and well located aftershocks, in addition to teleseismic data, permitted a detailed mapping of the rupture of this event at depth (e.g., Hartzell et al., 1996; Wald et al., 1996). The Northridge earthquake is a blind thrust along a SW- dipping fault with a small right-lateral strike-slip component (Thio and Kanamori, 1996; Wald et al., 1996). We selected two stations: one among the available digital and uncor- rected strong-motion records that are located in the vicinity
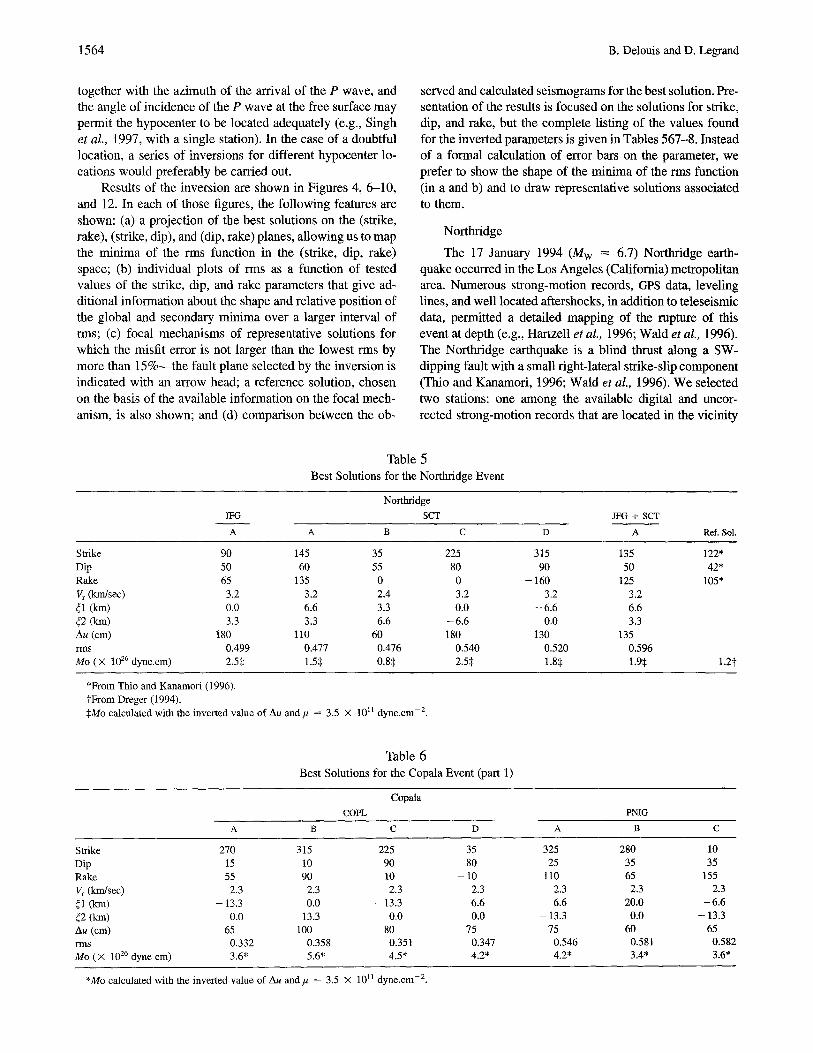
Table 5 Best Solutions for the Northridge Event
JFG A
Northridge SCT JFG + SCT
A B C D A Ref. Sol.
Strike 90 145 35 Dip 50 60 55 Rake 65 135 0 V~. (km/sec) 3.2 3.2 2.4 ~1 (km) 0.0 6.6 3.3 42 (km) 3.3 3.3 6.6 Au (cm) 180 110 60 rms 0.499 0.477 0.476 Mo (X 1026 dyne.cm) 2.55; 1.5, 0.8:~
225 8O
0 3.2 0.0
- 6 . 6 180
0.540 2.5,
315 90
- 160 3.2
- 6 . 6 0.0
130 0.520 1.8,
135 5O
125 3.2 6.6 3.3
135 0.596 1.9,
122" 42*
105"
1.2t
*From Thio and Kanamori (1996). tFrom Dreger (1994). *Mo calculated with the inverted value of Au and # = 3.5 × 10¹¹ dyne.cm -2.
Table 6 Best Solutions for the Copala Event (part 1)
Copala COPL PNIG
A B C D A B C
Strike 270 315 225 35 Dip 15 10 90 80 Rake 55 90 10 - 10 Vr (km/sec) 2.3 2.3 2.3 2.3 41 (km) - 13.3 0.0 - 13.3 6.6 ~2 (km) 0.0 13.3 0.0 0.0 Au (cm) 65 100 80 75 rms 0.332 0.358 0.351 0.347 Mo (× 1026 dyne cm) 3.6* 5.6* 4.5* 4.2*
325 25
110 2.3 6.6
- 13.3 75
0.546 4.2*
280 35 65
2.3 20.0
0.0 60
0.581 3.4"
10 35
155 2.3
- 6 . 6 - 13.3
65 0.582 3.6"
*Mo calculated with the inverted value of Au and # = 3.5 × 10¹¹ dyne.cm -2.

Focal Mechanism Determination and Identification of the Fault Plane of Earthquakes Using Seismic Recordings 1565
Table 7 Best Solutions for the Copala Event (part 2)
Table 8 Best Solutions for the Pinotepa Nacional Event
Copala Pinotepa Nacional COPL + PNIG PN1G
A B C D Ref. Sol. A B
Strike 250 290 45 155 289* Strike 0 260 Dip 15 10 5 5 I 1 * Dip 20 25 Rake 35 65 170 - 70 75* Rake 155 45 Vr (km/sec) 2.3 2.3 2.3 2.3 Vr (km/sec) 2.9 2.5 ~1 (km) -6.6 -13.3 13.3 13.3 41 (km) -0.7 2.0 ~2 (km) 0.0 6.6 6.6 -6.6 ~2 (kin) - 1.3 0.0 Au (cm) 95 60 60 60 Au (cm) 23 31 rms 0.631 0.635 0.690 0.694 rms 0.307 0.310 Mo 5.3? 3.4"[" 3.4"1" 3.4? 8.9* Mo ( × 1024 dyne.cm) 1.3t 1.77 (× 1026 dyne.cm)
*Courboulex et aL (1997) and Harvard CMT catalog. ?Mo calculated with the inverted value of Au and,u = 3.5 × 10 H dyne
cm -2.
Ref. Sol.
291' 10" 80*
1.2"
*Singh et al. (1997). "~Mo calculated with the inverted value ofAu and/t = 3.5 × 10¹¹ dyne
cm -2.
of the Los Angeles city (station SCT, from the SCEC) and a second one among the numerous analog SMA-1 records but close enough to the epicenter and located on hard ground (station JFG, from the USGS).
Single-Station Inversion: JFG. Station JFG is located above the rupture plane of the Northridge event at an epi- central distance of 12 kin. The inversion gave a single min- imum for the rms function (best solution A, Fig. 4a and 4b). The corresponding focal mechanism of thrust type (Fig. 4c) is close to the reference one (Thio and Kanamori, 1996), although the small strike-slip component is in the opposite sense. The nodal plane selected as the fault plane by the inversion is the correct one. The fault plane found (strike = 90, dip = 50, rake = 65) is slightly rotated counterclock- wise with respect to the reference one (strike = 122, dip = 42, rake = 105) and dips slightly more. To illustrate how waveform modeling may be used to select the fault plane, we show in Figure 5 how the waveform fit degrades for solutions close to the auxiliary plane of solution A.
Single-Station Inversion: SCT. Station SCT is located to the SE of the rupture at an epicentral distance of 14 km. Several minima of the rms function came out from the in- version (A-D, Fig. 6a and 6b), but they correspond essen- tially to only two different focal mechanisms (Fig. 6c); A is a thrust mechanism with a right-lateral component close to the reference solution; B - D are strike-slip mechanisms of similar kind, clearly erroneous. Solutions A and B arc not significantly distinguishable from the rms point of view, and without additional information, it would not be possible to choose between the two. For the solution A close to the reference one, the proper fault plane (strike = 145, dip = 60, rake = 135) has been selected among the two nodal planes.
(text continues on page 1571)
l'7
20 cm V EW
Z
10 sec " ," I
: observed signal . . . . . : calculated signal for solution A close to
the actual fault plane (RMS = 0.499) . . . . . . . : calculated signal for the best solution (X) close to
the auxilliary plane of A (RMS = 0.792)
Figure 5. Comparison of the waveform fit for the best solution A found for the Northridge earthquake with the single-station JFG (Fig. 10) and for the so- lution (X) with the lowest rms error in the vicinity (within 30 ° in strike, dip, and rake) of the auxiliary plane of solution A. Solution A is (strike = 90, dip = 50, rake = 65), its auxiliary plane is (strike = 306, dip = 46, rake = 117), and solution X is (strike = 315, dip = 70, rake = 135).

1566 B. Delouis and D. Legrand
N O R T H R I D G E M w = 6.7, extended source, single station (SCT)
a ] B A C D A
z~
0 60 I20 180 240 300 360 0 30 60 90 . ~ ~ D i p
0 60 t20 180 240 300 360 Strike
ZX :best II : + 5 % It :+15% ~ :+25%
c) SCT
A B C D N N N
b)
0.8- I
0.6-i
0"4" I B A C D
o 60 t20 180 240 300 360 Strike
O.8
0.6
0A
-180 -120 -60 0 60 120 180 Rake
Thio and Kanamori (1996)
N
13.6
0 3O6O9O Dip
d) SCT rnST: 14 AZ: 147
#
4 cm EW
Z
lOsee t
Figure 6. Results of the inversion for the Northridge earthquake with the single-station SCT. For a general description of the features represented in (a) to (d), refer to the text and to Figure 4. The four groups of solutions with the lowest rms are noted A to D. Two best solutions are indicated (A and B, white triangles) because they are nearly indistinguishable from the rms point of view (Table 5).
Focal Mechanism Determination and Identification of the Fault Plane of Earthquakes Using Seismic Recordings 1567
a)
~D
NORTHRIDGE Mw = 6.7, extended source, two stations (SCT and JFG)
A A
0 60 170 IN 240 300 360 A
• L~ 6090 ~i ~' '
o 0 60 120 180 240 300 360
Strike
A :best II : + 5 % Iii :+15% F~ :+25%
o 3o6090
T~oand C ) A r, a n a m o ~ ( l ~ 6 )
SCT N
b)
1.0 r ~i LO-
o., qi"~: o.6. A
0 ~ I~ I~ 240 3(10 3~ Strike
L0-
0.6-
Rake
iii A I
0 306090 Dip
IFG
d) JFG D I S T : 12 AZ : 18 SCT DIST : 14 AZ : 147
...~" -~'-Xd22q
4 cm EW
Z / , _ Z
5 see lOsee
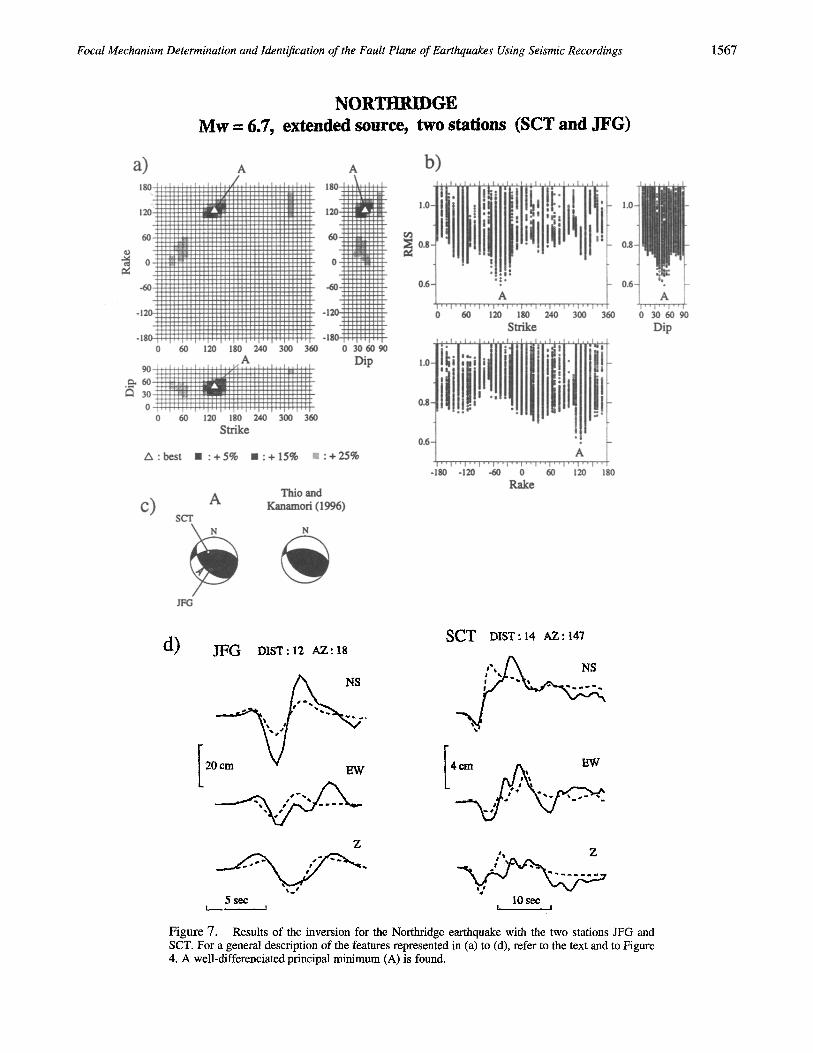
Figure 7. Results of the inversion for the Northridge earthquake with the two stations JFG and SCT. For a general description of the features represented in (a) to (d), refer to the text and to Figure 4. A well-differenciated principal minimum (A) is found.

1568 B. Delouis and D. Legrand
C O P A L A M w = 7.3, e x t e n d e d source , s ing le s ta t ion ( C O P L )
a) D C A B
0 60 120 180 240 300 360
"'~ 30 0
0 60 120 180 240 300 360 Str ike
A : b e s t ill : + 5 % 1 1 : + 1 5 % : + 2 5 %
0 3o6o9o Dip
C) A B C D N N N
b) 0.8- ' ~ "'
o,o. !l!!lP4! I!iiill!i 0.4,
I t
IF' ) , - ~. ]ql I ' l J 1 L . . ti1'7,tltl
] i l l , d ! i t l ~ i * i I , ! : : ?~ ! '
0.2- 0 6O 120 180 Strike
!), :I ~! ;i~. II; ")~ * o.6 )~. :Ji::~,
121!!~ .: - 0.4 , , ~ * l l " ,°
) DC A B i -180 -120 -60 0 60 120 180
Rake Courboulex et al.
0997) N
0.8-, ' /
o,6- i
)
COPA
-~ - ' ~ , t ' " f~'r'r'rT - 0 . 2 ~ 240 300 360 0 30 60 90
Dip
d) COPA DIST: 26 hZ: 3O2
NS
[ ,"
EW
15 see I . i
Figure 8. Results of the inversion for the Copala earthquake with the single-station COPL. For a general description of the features represented in (a) to (d), refer to the text and to Figure 4. Solutions A and B belong to the same elongated minimum characterized by a low dip; C and D correspond to two additional minima of the rms function characterized by a high dip. The actual fault plane corre- sponds to the NE shallow-dipping plane of the reference focal mechanism (Courboulex e t a l . , 1997).

Focal Mechanism Determination and Identification of the Fault Plane of Earthquakes Using Seismic Recordings 1569
COPALA Mw = 7.3, extended source, single station (PtCIG)
a) c B A C b)
0.8-
0.6.
0.4.
tili!l!! i!illli!!!!!!l!!illil , . . ! 1 : " t H , -;. ' l 'li Jilil
C B A
0 60 120 180 24O 300 360 St r i ke
0 ~ 120 1~ 240 300 36O C • A
0 6o 1~ 180 NO 3OO 36O Strike
Z~:bes t B : + 5 % B : + 1 5 % ~ : + 2 5 %
C) A B C N N N
0 3O6O9O Dip
-180 -12o .60 0 60 120 180 Rake
Courboulex et al. (1997)
N
PNI(
0IF 0 ~
Dip
d) PNIG DIST: 68 AZ: 99
. . . . . , ~ EW
10 see ! !
Figure 9. Results of the inversion for the Copala earthquake with the single-station PNIG. For a general description of the features represented in (a) to (d), refer to the text and to Figure 4. Solutions A to C belong to the same elongated minimum.

1570 B, Delouis and D. Legrand
COPALA Mw = 7.3, extended source, two stations
a) c D A
0 60 120 180 240 300 301 C D , A B
90
3 0 ~ o 6o ~m ~o a40 300 360
Strike
c)
PN
Z~:best Im :+5% m : + 1 5 % ~ : + 2 5 %
(COPL and PNIG)
A B
c b)
1,0 - 1,0
÷ .
B o,a-
C D A B ~- O.,~ ~D " IA-D !
60 120 IN) 240 300 360 0 30 60 Strike Dip
o ~ Dip
0.6 D
{N I{~ ),
A B C F
-180 -t20 -60 0 60 120 180 Rake
C D Courboule× et al. (1997)
N N N~
d) C O P A DIST:26 AZ:302 PNIG DIST : 68 AZ : 99
NS
[,o. L " E W
Z
15 sec t
. A E W
- . 2./.. I0 see
Figure I0. Results of the inversion for the Copala earthquake with the two stations COPL and PNIG. For a general description of the features represented in (a) to (d), refer to the text and to Figure 4. Solutions A to D belong to the same elongated minimum.

Focal Mechanism Determination and Identification of the Fault Plane of Earthquakes Using Seismic Recordings 1571
Two-Station Inversion: JFG and SCT. The inversion pro- duced a principal minimum (A, Fig. 7a and 7b) clearly dis- tinguishable from other secondary minima. Figure 7c shows that the corresponding focal mechanism and selected fault plane (strike = 135, dip = 50, rake = 125) are very close to the reference one (strike = 122, dip = 42, rake = 105).
Copala
The 14 September 1996 (Mw = 7.3) Copala earthquake is a shallow, thrust faulting interplate earthquake along the Mexican subduction zone (Courboulex et aL, 1997). The fault plane, corresponding to the subduction interface, is dip- ping - 1 1 ° toward the NE (Courboulex et al., 1997). The event has been recorded by two nearby digital strong-motion stations, COPL and PNIG, belonging to the Mexican acce- lerornetric network.
Single-Station Inversion: COPL. Station COPL is located to the NW of the rupture at an epicentral distance of 26 km. Several minima of the rms function came out from the in- version (A-D, Fig. 8a and 8b), but here again they corre- spond essentially to only two different focal mechanisms (Fig. 8c); A and B are shallow-dipping thrust mechanisms close to the reference solution (Courboulex et aL, 1997); C and D are strike-slip mechanisms of similar kind, clearly erroneous. Without additional information, it would not be possible to identify the correct solution with enough confi- dence. For solutions A and B close to the reference one, the proper fault plane has been selected among the two nodal planes.
Single-Station Inversion: PNIG. Station PNIG is located to the ESE of the rupture at an epicentral distance of 68 km. The inversion gave a principal minimum of elongated shape (A-C, Fig. 9a and 9b). The corresponding focal mechanisms are of thrust type like the reference (Figure 9c) but with an overestimated dip and a strike that is not well constrained. The nodal plane selected as the fault plane is the correct one. The difficulty in constraining the strike of the fault plane for the Copala event is subsequently discussed in the two-station case.
Two-Station Inversion: COPL and PNIG. The inversion produced a very elongated .minimum region with a well-" defined dip but with a poorly constrained strike and rake (A- D, Fig. 10a and 10b). However, when the corresponding focal mechanisms are drawn (Fig. 10c), it appears that they are similar to each other and close to the reference solution. Furthermore, the minimum is centered on solution B, which is the closest to the reference one, and the proper nodal plane has been selected as the fault plane. The elongated minimum indicates both an undetermination in the strike, and a trade- off between the strike and rake parameters. This result has a physical meaning and is related to the way in which pa- rameters are defined. The true dip of the fault plane corre- sponding the subduction interface is very shallow (around 10°), and the strike is expected to become unconstrained in
the case of a near-horizontal plane (for a strictly horizontal plane, the strike parameter is no longer defined). On the other hand, Figure 10c shows that the focal solutions have some constant characteristics, which may be described as a nearly constant auxiliary plane. This nearly constant auxiliary plane, which means a nearly constant slip vector, explains the trade-off between the strike and rake parameters. When the strike parameter varies, the rake parameter adjusts itself in order to maintain a constant slip vector. It is noteworthy that the slip vector found is oriented in the convergence di- rection of this part of the Mexican trench.
A plot of the P and T axes of solutions A-D, together with those of the reference solution, shows how all the so- lutions are indeed close to each other (Fig. 11). Figure 10 shows difficulties in matching the observed waveforms, es- pecially for the N-S component of station PNIG. Courbou- lex et al. (1997) obtained a better waveform fitting by in- verting the same seismograms at COPL and PNIG with a variable slip rupture model, the orientation of the fault plane and the slip vector being fixed. Although Courboulex et al. used also a more precise crustal structure (layered velocity model), we attribute the essential part of the difference in waveform fitting to the difference between the constant and variable slip models. However, the difficulty in modeling the waveforms precisely seems not to have affected the re- sults significantly, and this may be taken as an indication of the robustness of the method. :
C O P A L A E A R T H Q U A K E
PLOT OF THE P AND T AXES OF THE SOLUTIONS FOUND BY THE INVERSION WITH TWO STATIONS
N
A : P axis of the reference solution O : P axes of solutions A to D of Figurel0
/~ : T axis of the reference solution O : T axes of solutions A to D of Figure 10
Figure 11. Plot of the P and T axes of solutions A to D of Figure 10, together with those of the ref- erence focal mechanism from Courboulex et aL (1997). This representation shows how all the solu- tions are close to each other.

1572 B. Delouis and D. Legrand
P I N O T E P A N A C I O N A L M w = 5.4, extended source, single station (PNIG)
B a) A
0 ~ 1~ 1~ 240 3~ 3~ A B
90~ '~, ~,
3o= O.i
0 60 t20 t80 240 300 360 Strike
A : b e s t t i t :+5% a1:+15%
A
~-~ : + 25%
0 306090 Dip
C ) A B Singh et al. 0997)
N N N
b)
,B o.e g
0.4. I!"""-"IN
o;
° ' "i 0.8-
{16-
B ~ 0 60 120 lg0 240 3430 360
Strike
ii -180 -120 -60 0 60 120 180
Rake
ii 3060 90 Dip
PN] d) P N I G OIST: 20 ~z : 81
NS
EW
Z
2s¢c
Figure 12. Results of the inversion for the Pinotepa Nacional earthquake with the single-station PNIG. For a general description of the features represented in (a) to (d), refer to the text and to Figure 4. Solutions A and B correspond to the two principal minima of the rms function. The actual fault plane corresponds to the NE shallow-dipping plane of the reference focal mechanism (Singh et al., 1997). First-motion polarities shown on (c) are from Singh et al. (1997).

Focal Mechanism Determination and Identification o f the Fault Plane o f Earthquakes Using Seismic Recordings 1573
Pinotepa Nacional
The 27 March 1996 (Mw = 5.4) Pinotepa Nacional earthquake occurred in the vicinity of the Copala event. Its focal mechanism is approximately the same (Singh et al., 1997) and indicates also a shallow, thrust faulting interplate earthquake along the Mexican subduction zone. The fault plane, corresponding to the subduction interface, dips - 1 0 ° toward the NE (Singh et al., 1997). The only short-distance digital strong-motion record available is from station PNIG.
Single-Station Inversion: PNIG. Station PNIG is located to the ENE of the rupture at an epicentral distance of 20 km. The inversion gave similar results as for the Copala event with the same station. Focal mechanisms corresponding to the two principal minima of the rms function (A and B, Fig. 12a-12c) are thrusts close to the reference one, though the dip is slightly overestimated and the strike not well con- strained. However, the difficulty in constraining the strike of the fault plane may be explained in the same way as for the Copala event. The nodal plane selected as the fault plane is the correct one. The fact that the single-station inversion for such a moderate-sized event gives a result of similar quality as for the much larger Copala earthquake may be due to the high quality of the seismograms of the Pinotepa Nacional event, which, in particular, show a very nice near-field ramp (Fig. 12).
Conclusions
For the examples presented in this article, the two- station inversions resulted in a single solution or family of similar solutions, close to the true one. The single2station inversions gave either a single solution or a limited number of alternatives. In the latter case, additional independent in- formation would be required in order to select the correct solution. In all the inversions performed, at least one of the best solutions found was close to the actual fault plane. This is an indication of the efficiency of the method. We cannot ensure that such good results may be obtained in all cases; certainly the possibility of constraining the focal mechanism and the fault plane with only one or two stations will depend on several factors, like the position of the stations on the focal sphere (azimuth and distance of the station with respect to the hypocenter) and the quality of the records. However, this work demonstrates that focal mechanisms and fault planes of moderate to large earthquakes may be determined by inverting the combined far-field and near-field wave- forms at a few near-source stations with the help of a simple finite-dimension source model. The method presented here would certainly be useful to obtain information about the faulting process of future blind earthquakes for which only a limited amount of coseismic data are available.
Acknowledgments
We are grateful to S. K. Singh and F. Courboulex for providing us the data for the Copala and Pinotepa Nacional earthquakes. The Copala
strong-motion station (COPL) is part of the Guerrero Accelerograph Net- work of Mexico, operated by the Institute of Engineering, UNAM, and the University of Nevada, Rent. The Pinotepa Nacional station (PNIG) is part of the National Seismological Service of Mexico, Instituto de Geofisica, UNAM. We thank the SCEC (Southern California Earthquake Center) for access to their strong-motion data base. We thank Amaando Cisternas, Luis Rivera, Nicholas Deichrnann, and S. Singh for helpful comments, as well as Diane Doser and an anonymous reviewer for improving the manuscript. We thank the ETH Zurich and the French Minist~re des Affaires Etrang~res for their support, and Prof. Kawakatsu for his hospitality in his team at the Earthquake Research Institute of Tokyo for one of the authors (D.L.).
References
Aki, K., and P. G. Richards (1980). Quantitative Seismology, Vol. I, W. H. Freeman and Co., San Francisco, 512 pp.
Anderson, J. G., P. Bodin, J. N. Brune, J. Prince, S. K. Singh, R. Qaas, and M. Onate (1986). Strong ground motion from the Michoacan, Mexico, earthquake, Science 233, 1043-1049.
Ben Menahem, A. (1962). Radiation of seismic body waves from a finite moving source in the earth, J. Geophys. Res. 67, 345-350.
Cotton, F., and M. Campillo (1995). Frequency domain inversion of strong motion: application to the 1992 Landers, California, earthquake, J. Geophys. Res. 100, 3961-3975.
Courboulex, F., M. A. Santoyo, J. F, Pacheco, and S. K. Singh (1997). The 14 September 1995 (M = 7.3) Copala, Mexico, earthquake: a source study using teleseismic, regional, and local data, Bull. Seism. Soc. Am. 87, 999-1010.
Delouis, B., T. Monfret, L Dorbath, M. Pardo, L. Rivera, D. Comte, H. Haessler, J. P. Carninade, L. Ponce, E. Kausel, and A. Cistemas (1997). The M w = 8.0 Antofagasta (northern Chile) earthquake of 30 July 1995: a precursor to the end of the large 1877 gap, Bull. Seism. Soc. Am. 87, 427-445.
Dreger, D. S. (1994). Empirical Green's function study of the January 17, 1994 Northridge Mainshock (M w 6.7), Geophys. Res. Lett. 21, 2633- 2636.
Dreger, D. S. (1997). The large aftershocks of the Northridge earthquake and their relationship to mainshock slip and fault-zone complexity, Bull. Seism. Soc. Am. 87~ 1259-1266.
Dziewonski, A., T. Chou, and J. Wood_house (1981). Determination of earthquake source parameters from waveform data for studies of global and regional seismicity, J. Geophys. Res. 86, 2825-2852.
Graves, R. W. (1998). Three-dimensional finite-difference modeling of the San Andreas fault: source parameterization and ground-motion levels, Bull. Seism. Soc. Am. 88, 881-897.
Hartzell, H., G. Frazier, and J. Brune (1978). Earthquake modeling in a homogeneous half-space, Bull. Seism. Soc. Am. 68, 301-316.
Hartzell, H., P. Liu, and C. Mendoza (1996). The 1994 Northridge, Cali- fornia earthquake: investigation of the rupture velocity, risetime, and high frequency radiation, J. Geophys. Res. 101, 20091-20108.
Heaton, T. H. (1990). Evidence for and implications of self-healing pulses of slip in earthquake rupture, Phys. Earth. Planet Interiors 64, 1-20.
Hirasawa, T., and W. Stauder (1965). On the seismic body waves from a finite moving source, Bull Seism. Soc. Am. 55, 237-262.
Iwan, W. D., M. A. Moser, and C. Peng (1985). Some observations of strong-motion earthquake measurement using a digital accelerograph, Bull. Seism. Soc. Am. 75, 1225-1246.
Johnson, L. (1974). Green's function for Lamb's problem, Geophys. J. R. Astr. Soc. 37, 99-131.
Kanamori, I-/., J. Moil, and T. H. Heaton (1990). The 3 December 1988, Pasadena earthquake (M E = 4.9) recorded with very broadband sys- tem in Pasadena, Bull. Seism. Soc. Am. g0, 483-487.
Kawakatsu, H. (l 995). Automated near-realtime CMT inversion, Geophys. Res. Lett. 21, 1963-1966.
Legrand, D., and B. Delouis (1999). Automatic detenrtination of the fault

1574 B. Delouis and D. Legrand
plane using a single near field seismic station with a finite dimension source model, Geophys. J. Int. 138, 801-808.
Legrand, D., S. Kaneshima, and H. Kawakatsu (1999). Moment tensor anal- ysis of near field broadband waveforms at Aso volcano, Japan, J. Volc. Geotherm. Res. (in press).
Li, Y., C, Doll, and M. N. Toksi3z (1995). Source characterization and fault plane determinations for MbLg = 1.2 to 4.4 earthquakes in the Char- levoix seismic zone, Quebec, Canada, Bull. Seism. Soc. Am. 85, 1604- 1621.
Mori, J., and S. Hartzell (1990). Source inversion of the 1988, Upland, California earthquake: determination of a fault plane for a small event, Bull. Seism. Soc. Am. 80, 507-518.
Savage, J. C. (1965). The effect of rupture velocity upon seismic first mo- tions, Bull Seism. Soc, Am. 55~ 263-275.
Singh, S. K., J. Paeheco, F. Courboulex, and D. A. Novelo (1997). Source parameters of the Pinotepa Nacional, Mexico, earthquake of 27 March, 1996 (Mw = 5.4) estimated from near-field recordings of a single station, J. Seism. 1, 39--45.
Singh, S. K., M. Ordaz, J. F. Pacheco, and F. Courboulex (1998). A simple source inversion scheme for displacement seismograms recorded at short distances, J. Seism., (in press).
Sipkin, S. (1982). Estimation of earthquake source parameters by the in- version of waveform data: synthetic waveforms, Phys. Earth. Planet. Interiors 30, 242-259.
Somerville, P. G., K. Irikura, S. Sawada, Y. Iwasaki, M. Tai, and M. Fu- shimi (1993). Characterizing earthquake slip models for the prediction of strong ground motion, Proc. of the 22 JSCE Earthquake Engi- neering Symposium, Japan Soc. Civil Eng., 291-294.
Thin, H. K., and H. Kanamori (1996). Source complexity of the 1994 North- ridge earthquake and its relation to aftershock mechanisms, Bull. Seism. Soc. Am. 86, $84-$92.
Wald, D. J., and T. H. Heaton (1994). Spatial and temporal distribution of slip for the 1992 Landers, California, earthquake, Bull Seism. Soc. Am. 84, 668-691.
Wald, D. J., T. H. Heaton, and K. W. Hudnut (1996). The slip history of the 1994 Northridge, California, earthquake determined from strong- motion, teleseismic, GPS, and leveling data, Bull. Seism. Soc. Am. 86, $49-$70.
Wells, D. L., and K. J. Coppersmith (1994). New empirical relationships among magnitude, rupture length, rupture width, rupture area, and surface displacement, Bull Seism. Soc. Am. 84, 974-1002.
Wu, R.-S., and A. Ben-Mehahem (1985). The elastodynamic near field, Geophys. Z R. Astr. Soc. 81, 609-621.
lnstitut fOr Geophysik ETH Htnggerberg 8093 Ztirich, Switzerland E-mail: bertrand @ seismo.ifg.ethz.ch
03 .D .)
Earthquake Research Institute University of Tokyo Tokyo, Japan
(D.L.)
Maison Franco-Japonaise 3-9-25 Ebizu, Shibuya-ku Tokyo 150-0013, Japan
(D.L.)
Manuscript received 17 June 1999.