fluidized bed reactor technology
DESCRIPTION
fluid bed technologyTRANSCRIPT

c© 2007 Wiley-VCH Verlag GmbH & Co. KGaA, Weinheim10.1002/14356007.b04 239.pub2
Fluidized-Bed Reactors 1
Fluidized-Bed Reactors
Joachim Werther, Hamburg University of Technology, Hamburg, Germany
Related Articles For other industrial reactors and their applications, see → Stirred-Tank and Loop Reactors,→ Tubular Reactors, → Fixed-Bed Reactors, → Bubble Columns, → Three-Phase Trickle-Bed Reactors, →Reaction Columns, → Thin-Film Reactors, → Metallurgical Furnaces, and → Biochemical Engineering.
1. Introduction . . . . . . . . . . . . . . . 31.1. The Fluidization Principle . . . . . . 31.2. Forms of Fluidized Beds . . . . . . . 31.3. Advantages and Disadvantages of
the Fluidized-Bed Reactor . . . . . . 42. Fluid-Mechanical Principles . . . . . 52.1. Minimum Fluidization Velocity . . . 52.2. Expansion of Liquid–Solid
Fluidized Beds . . . . . . . . . . . . . . 62.3. Fluidization Properties of Typical
Bed Solids . . . . . . . . . . . . . . . . . 62.4. State Diagram of Fluidized Bed . . . 72.5. Gas Distribution . . . . . . . . . . . . . 82.6. Gas Jets in Fluidized Beds . . . . . . 102.7. Bubble Development . . . . . . . . . . 102.8. Elutriation . . . . . . . . . . . . . . . . 122.9. Circulating Fluidized Beds . . . . . . 132.9.1. Hydrodynamic Principles . . . . . . . . 132.9.2. Local Flow Structure in Circulating
Fluidized Beds . . . . . . . . . . . . . . 152.9.3. Design of Solids Recycle System . . . 162.10. Cocurrent Downflow Circulating
Fluidized Beds (Downers) . . . . . . 162.11. Attrition of Solids . . . . . . . . . . . . 173. Solids Mixing in Fluidized-Bed
Reactors . . . . . . . . . . . . . . . . . . 203.1. Mechanisms of Solids Mixing . . . . 203.2. Vertical Mixing of Solids . . . . . . . 213.3. Horizontal Mixing of Solids . . . . . 223.4. Solids Residence-Time Properties . 223.5. Solids Mixing in Circulating
Fluidized Beds . . . . . . . . . . . . . . 22
4. Gas Mixing in Fluidized-BedReactors . . . . . . . . . . . . . . . . . . 23
4.1. Gas Mixing in Bubbling FluidizedBeds . . . . . . . . . . . . . . . . . . . . . 23
4.2. Gas Mixing in Circulating FluidizedBeds . . . . . . . . . . . . . . . . . . . . . 23
5. Heat and Mass Transfer inFluidized-Bed Reactors . . . . . . . . 24
6. Gas-Solid Separation . . . . . . . . . . 257. Injection of Liquid Reactants into
Fluidized Beds . . . . . . . . . . . . . . 268. Industrial Applications . . . . . . . . 268.1. Heterogeneous Catalytic Gas-Phase
Reactions . . . . . . . . . . . . . . . . . 278.2. Polymerization of Olefins . . . . . . . 298.3. Homogeneous Gas-Phase Reactions 308.4. Gas–Solid Reactions . . . . . . . . . . 308.5. Applications in Biotechnology . . . . 369. Modeling of Fluidized-Bed Reactors 379.1. Modeling of Liquid–Solid Fluidized-
Bed Reactors . . . . . . . . . . . . . . . 379.2. Modeling of Gas–Solid Fluidized-
Bed Reactors . . . . . . . . . . . . . . . 379.2.1. Bubbling Fluidized-Bed Reactors . . . 379.2.2. Circulating Fluidized-Bed Reactors . 389.3. New Developments in Modeling
Fluidized-Bed Reactors . . . . . . . . 409.3.1. Computational Fluid Dynamics . . . . 409.3.2. Modeling of Fluidized-Bed Systems . 4110. Scale-up . . . . . . . . . . . . . . . . . . 4211. References . . . . . . . . . . . . . . . . . 43
The article gives an overview on fundamen-tals and applications of fluidized-bed technol-ogy. Some basic fluid-mechanical principles—minimum fluidization velocity, status diagram,gas distribution, bubble development, and solidsentrainment and elutriation—are presented atthe beginning, followed by a detailed discus-sion of circulating fluidized beds, downers,and attrition effects in fluidized-bed systems.Sections on solids mixing, gas mixing, and
heat and mass transfer in fluidized beds com-plete the fundamentals section, which is fol-lowed by an overview on industrial applications.Fluidized-bed processes for heterogeneous cat-alytic gas-phase reactions, for the polymeriza-tion of olefins, for homogenous gas-phase re-actions, gas–solid reactions and applications inbiotechnology are described in detail. A finalchapter is devoted to the modeling of fluidized-bed reactors.

2 Fluidized-Bed Reactors
Symbolsa volume-specific mass-transfer area bet-
ween bubble and suspension phases,m−1
A0 cross-sectional area of orifice, m2
Ar Archimedes number, defined by Equa-tion (5)
At cross-sectional area of reactor, m2
b parameter def. by Equation (54)cv solids volume concentrationcb bubble attrition rate constant, defined
by Equation (50), s2/m4
cc cyclone attrition rate constant definedby Equation (51), s2/m3
cj jet attrition rate constant, defined byEquation (52),s2/m3
Cb concentration in bubble phase,kmol/m3
Cd concentration in suspension phase,kmol/m3
do orifice diameter, mdp Sauter diameter, defined by Equation
(6), mdpi diameter of particle size class i, mdt bed diameter, mdv local bubble volume equivalent sphere
diameter, mdv0 initial bubble diameter, mD coefficient of molecular diffusion, m2/sDsh lateral solids dispersion coefficient,
m2/sDsv vertical solids dispersion coefficient,
m2/sFrp Froude number, defined by Equation
(29)Gs solids mass flow rate, based on reactor
cross-sectional area, kg m−2 s−1
h height above distributor level, mho height above distributor where bubbles
are forming, mhgs gas-to-solid heat transfer coefficient,W
m−2K−1
hwb wall-to-bed heat transfer coefficient, Wm−2K−
H expanded bed height, mHmf bed height at minimum fluidization, mkG mass-transfer coefficient, m/sL jet length, mma mass of elutriated solids, kg.matt mass flow due to attrition, kg/smb bed mass, kg
.ms solids mass flow, g/snp number of passages through cyclonep pressure, PaPer, c Peclet number, defined by Equation
(43)Q3 cumulative mass distributionra attrition rate, defined by Equation (33),
s−1
rj reaction rate, based on catalyst mass,kmol kg−1 s−1
Re Reynolds numberSv volume-specific surface area of parti-
cles, m−1
t time, sTDH transport disengaging height, mu superficial fluidizing velocity, m/sub local bubble rise velocity, m/suc velocity at cyclone inlet, m/sumf superficial minimum fluidizing veloc-
ity, m/suo jet velocity at orifice, m/susl slip velocity, defined by Equation (27),
m/sut single particle terminal velocity, m/s.
V b visible bubble flow, based on bed area,m3 m−2 s−1
.
V mf minimum fluidizing flow rate, m3/s.
V o flow rate of gas issuing from orifice,m3/s
xi mass fraction of particle size fraction iin bed material
α velocity ratio, defined by Equation (14)∆pd pressure drop of the gas distributor, Paε bed porosityεb local bubble gas holdupεi porosity of catalyst particleεmf bed porosity at minimum fluidizationκ* elutriation rate constant, kg m−2 s−1
λ average life time of a bubble, sµ solid-to-gas mass flow ratioν kinematic viscosity, m2/sνij stoichiometric number of species i in
reaction j�f fluid density, kg/m3
�s solids density, kg/m3
ϑ stress history parameter, defined byEquation (54)
ϑb parameter, defined by Equation (23)ψ pressure ratio, defined by Equation (28)

Fluidized-Bed Reactors 3
1. Introduction
1.1. The Fluidization Principle
In fluidization an initially stationary bed of solidparticles is brought to a “fluidized” state by anupward stream of gas or liquid as soon as thevolume flow rate of the fluid exceeds a certainlimiting value
.
V mf (wheremf denotesminimumfluidization). In the fluidized bed, the particlesare held suspended by the fluid stream; the pres-sure drop ∆pfb of the fluid on passing throughthe fluidized bed is equal to the weight of thesolids minus the buoyancy, divided by the cross-sectional areaAt of the fluidized-bed vessel (Fig.1):
∆pfb =At·H· (1−ε) · (�s−�f) ·g
At(1)
In Equation (1), the porosity ε of the fluidizedbed is the void volume of the fluidized bed (vol-ume in interstices between grains, not includingany pore volume in the interior of the particles)divided by the total bed volume; �s is the solidsapparent density; and H is the height of the flu-idized bed.
In many respects, the fluidized bed behaveslike a liquid. The bed can be stirred like a liquid;objects of greater specific gravity sink, whereasthose of lower specific gravity float; if the ves-sel is tilted, the bed surface resumes a horizontalposition; if two adjacent fluidized beds with dif-ferent bed heights are connected to each other,the heights become equal; and the fluidized bedflows out like a liquid through a lateral open-ing. Particularly advantageous features of the
fluidized bed for use as a reactor are excellentgas–solid contact in the bed, good gas–particleheat and mass transfer, and high bed–wall andbed–internals heat-transfer coefficients.
The fluidization principle was first used onan industrial scale in 1922 for the gasification offine-grained coal [1]. Since then, fluidized bedshavebeen applied inmany industrially importantprocesses. The present spectrum of applicationsextends from a number of physical processes,such as cooling–heating, drying, sublimation–desublimation, adsorption–desorption, coating,and granulation, to many heterogeneous cat-alytic gas-phase reactions aswell as noncatalyticreactions.
What follows is a survey of the fluid mechan-ical principles of fluidization technology, gasand solid mixing, gas–solid contact in the flu-idized bed, typical industrial applications, andapproaches to modeling fluidized-bed reactors.Further information is given in textbooks (e.g.,[2]) and monographs (e.g., [3 – 8]). Summarytreatments can also be found in [9 – 19]. Otheruseful literature includes reports of the Engi-neeringFoundationConferences onFluidization[20 – 22], the Circulating FluidizedBedConfer-ences (e.g., [23 – 25], and—for use of the flu-idized bed in energy technology—the FluidizedBed Combustion Conferences (e.g., [26 – 28]).
1.2. Forms of Fluidized Beds
As the volume flow rate.
V or the superficial ve-locity u =
.
V /At of the fluid increases beyond
Figure 1. Pressure drop in flow through packed and fluidized beds
4 Fluidized-Bed Reactors
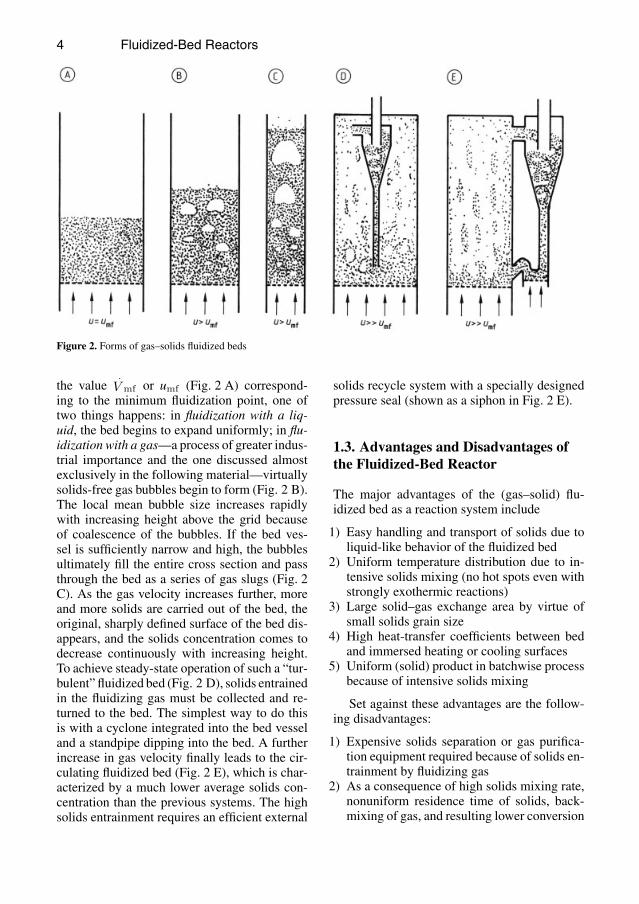
Figure 2. Forms of gas–solids fluidized beds
the value.
V mf or umf (Fig. 2 A) correspond-ing to the minimum fluidization point, one oftwo things happens: in fluidization with a liq-uid, the bed begins to expand uniformly; in flu-idization with a gas—aprocess of greater indus-trial importance and the one discussed almostexclusively in the following material—virtuallysolids-free gas bubbles begin to form (Fig. 2 B).The local mean bubble size increases rapidlywith increasing height above the grid becauseof coalescence of the bubbles. If the bed ves-sel is sufficiently narrow and high, the bubblesultimately fill the entire cross section and passthrough the bed as a series of gas slugs (Fig. 2C). As the gas velocity increases further, moreand more solids are carried out of the bed, theoriginal, sharply defined surface of the bed dis-appears, and the solids concentration comes todecrease continuously with increasing height.To achieve steady-state operation of such a “tur-bulent” fluidized bed (Fig. 2 D), solids entrainedin the fluidizing gas must be collected and re-turned to the bed. The simplest way to do thisis with a cyclone integrated into the bed vesseland a standpipe dipping into the bed. A furtherincrease in gas velocity finally leads to the cir-culating fluidized bed (Fig. 2 E), which is char-acterized by a much lower average solids con-centration than the previous systems. The highsolids entrainment requires an efficient external
solids recycle system with a specially designedpressure seal (shown as a siphon in Fig. 2 E).
1.3. Advantages and Disadvantages ofthe Fluidized-Bed Reactor
The major advantages of the (gas–solid) flu-idized bed as a reaction system include
1) Easy handling and transport of solids due toliquid-like behavior of the fluidized bed
2) Uniform temperature distribution due to in-tensive solids mixing (no hot spots even withstrongly exothermic reactions)
3) Large solid–gas exchange area by virtue ofsmall solids grain size
4) High heat-transfer coefficients between bedand immersed heating or cooling surfaces
5) Uniform (solid) product in batchwise processbecause of intensive solids mixing
Set against these advantages are the follow-ing disadvantages:
1) Expensive solids separation or gas purifica-tion equipment required because of solids en-trainment by fluidizing gas
2) As a consequence of high solids mixing rate,nonuniform residence time of solids, back-mixing of gas, and resulting lower conversion

Fluidized-Bed Reactors 5
3) In catalytic reactions, undesired bypass orbroadening of residence-time distribution forreaction gas due to bubble development
4) Erosion of internals and attrition of solids (es-pecially significant with catalysts), resultingfrom high solids velocities
5) Possibility of defluidization due to agglomer-ation of solids
6) Gas–solid countercurrent motion possibleonly in multistage equipment
7) Difficulty in scaling-up
Table 1 compares the fluidized-bed reac-tor with alternative gas–solid reaction systems:fixed-bed, moving-bed, and entrained-flow re-actors.
2. Fluid-Mechanical Principles
2.1. Minimum Fluidization Velocity
The minimum fluidization point, which marksthe boundary between the fixed- and thefluidized-bed conditions, can be determined bymeasuring the pressure drop ∆p across the bedas a function of volume flow rate
.
V (Fig. 1).Measurement should always be performed withdecreasing gas velocity, by starting in the flu-idized condition.
Only for very narrow particle-size distribu-tions, however, does a sharply definedminimumfluidization point occur. The broad size distribu-tions commonly encountered in practice exhibit
Table 1. Comparison of gas–solid reaction systems [2, 18]

6 Fluidized-Bed Reactors
a blurred range; conventionally, the minimumfluidization point is defined as the intersectionof the extrapolated fixed-bed characteristic withthe line of constant bed pressure drop typical ofthe fluidized bed (Fig. 1).
Themeasurement technique already containsthe possibility of calculating the minimum flu-idization velocity umf : The pressure drop in flowthrough the polydisperse fixed bed at the point u= umf , given, for example, by the Ergun relation[29] (→ Fluid Mechanics), is set equal to thefluidized-bed pressure drop given by Equation(1). From the Ergun relation
∆ph
= 4.17·S2v · (1−ε)
2
ε3ηu+0.29Sv ·1−ε
ε3�f u
2
it follows
umf = 7.14 (1−εmf) ν·Sv
·[√
1+0.067ε3mf
(1−εmf )2· (�s−�f )·g
�fν2 · 1S3
v−1
](2)
Accordingly, to calculateumf , the characteristicsof the gas (�f , ν), the density �s of the particles,the porosity εmf of the bed at minimum fluidiza-tion, and the volume-specific surface area Sv ofthe solids must be known. The specific surfacearea defined by
Sv =surface area of all particles in the bed
volume of all particles in the bed
(this takes into account only the external area,which governs hydraulic resistance, not the poresurface area as in porous catalysts) cannot bedetermined very exactly in practice. Hence umfshould not be calculated on the basis of themeasured particle-size distribution of a repre-sentative sample of the bed solids; instead, itis better measured directly. Equation (2) can beemployed advantageously to calculate umf in anindustrial-scale process on the basis ofminimumfluidization velocities measured in the labora-tory under ambient conditions [30].
An equation from Wen and Yu [31] can beused for approximate calculations:
Remf = 33.7(√
1+3.6×10⁻⁵·Ar−1)
(3)
where
Remf =umfdp
ν(4)
Ar =gd3
p
ν2·�s−�f
�f(5)
Here the surface mean or Sauter diameter calcu-lated from the mass–density distribution q3 (d)of the particle diameters
dp =1
dmax∫dmin
d−1·q3 (d) d (d)(6)
should be used for the characteristic particle di-ameter dp.
Both the Ergun approach and the Wen andYu simplification have been confirmed experi-mentally over a wide range of parameters. Morerecently, Vogt et al. [32] found that Equations(2) and (3) are also applicable to high-pressurefluidized beds in which the fluid is under super-critical conditions
2.2. Expansion of Liquid–SolidFluidized Beds
The uniform expansion of a bed on fluidizationwith a liquid can be described byu
ut= εn (7)
according to Richardson and Zaki [33]. Here utis the terminal velocity of isolated single parti-cles; the exponent n is given as follows, providedthe particle diameter is much smaller than thatof the vessel:
n =
4.65 0<Ret≤0.24.4·Re−0.03
t 0.2<Ret≤14.4·Re−0.1
t 1<Ret≤5002.4 500<Ret
(8)
The Reynolds number used above is calculatedvia the single-particle terminal velocity ut:
Ret =ut·dp
ν(9)
2.3. Fluidization Properties of TypicalBed Solids
In fluidization with gases, solids display char-acteristic differences in behavior that can alsoaffect the operating characteristics of fluidized-bed reactors. Geldart has proposed an empir-ically based classification of solids into fourgroups (A to D) by fluidization behavior [34].
Fluidized-Bed Reactors 7
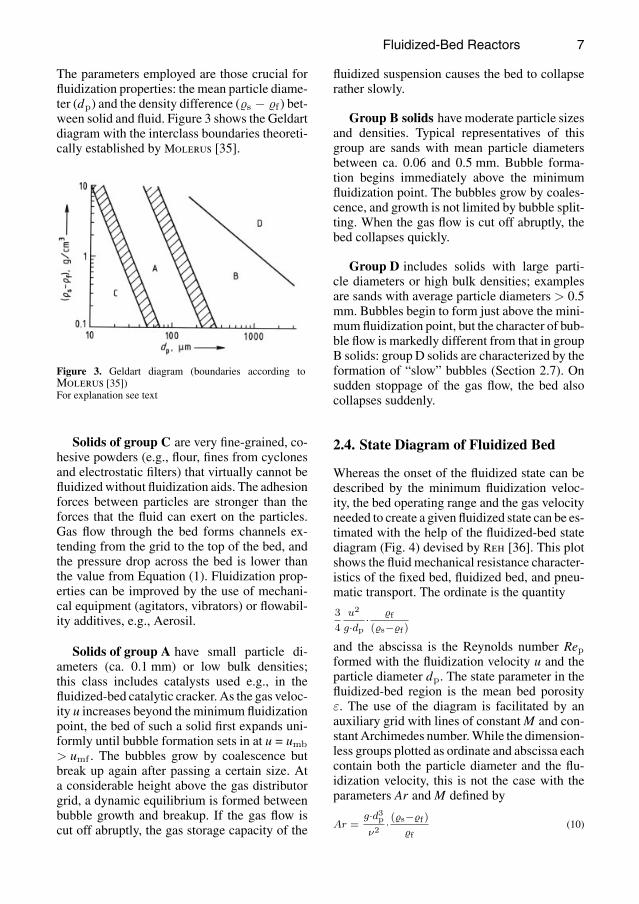
The parameters employed are those crucial forfluidization properties: the mean particle diame-ter (dp) and the density difference (�s − �f ) bet-ween solid and fluid. Figure 3 shows the Geldartdiagram with the interclass boundaries theoreti-cally established by Molerus [35].
Figure 3. Geldart diagram (boundaries according toMolerus [35])For explanation see text
Solids of group C are very fine-grained, co-hesive powders (e.g., flour, fines from cyclonesand electrostatic filters) that virtually cannot befluidizedwithout fluidization aids. The adhesionforces between particles are stronger than theforces that the fluid can exert on the particles.Gas flow through the bed forms channels ex-tending from the grid to the top of the bed, andthe pressure drop across the bed is lower thanthe value from Equation (1). Fluidization prop-erties can be improved by the use of mechani-cal equipment (agitators, vibrators) or flowabil-ity additives, e.g., Aerosil.
Solids of group A have small particle di-ameters (ca. 0.1 mm) or low bulk densities;this class includes catalysts used e.g., in thefluidized-bed catalytic cracker. As the gas veloc-ity u increases beyond the minimum fluidizationpoint, the bed of such a solid first expands uni-formly until bubble formation sets in at u = umb> umf . The bubbles grow by coalescence butbreak up again after passing a certain size. Ata considerable height above the gas distributorgrid, a dynamic equilibrium is formed betweenbubble growth and breakup. If the gas flow iscut off abruptly, the gas storage capacity of the
fluidized suspension causes the bed to collapserather slowly.
Group B solids have moderate particle sizesand densities. Typical representatives of thisgroup are sands with mean particle diametersbetween ca. 0.06 and 0.5 mm. Bubble forma-tion begins immediately above the minimumfluidization point. The bubbles grow by coales-cence, and growth is not limited by bubble split-ting. When the gas flow is cut off abruptly, thebed collapses quickly.
Group D includes solids with large parti-cle diameters or high bulk densities; examplesare sands with average particle diameters > 0.5mm. Bubbles begin to form just above the mini-mumfluidization point, but the character of bub-ble flow is markedly different from that in groupB solids: group D solids are characterized by theformation of “slow” bubbles (Section 2.7). Onsudden stoppage of the gas flow, the bed alsocollapses suddenly.
2.4. State Diagram of Fluidized Bed
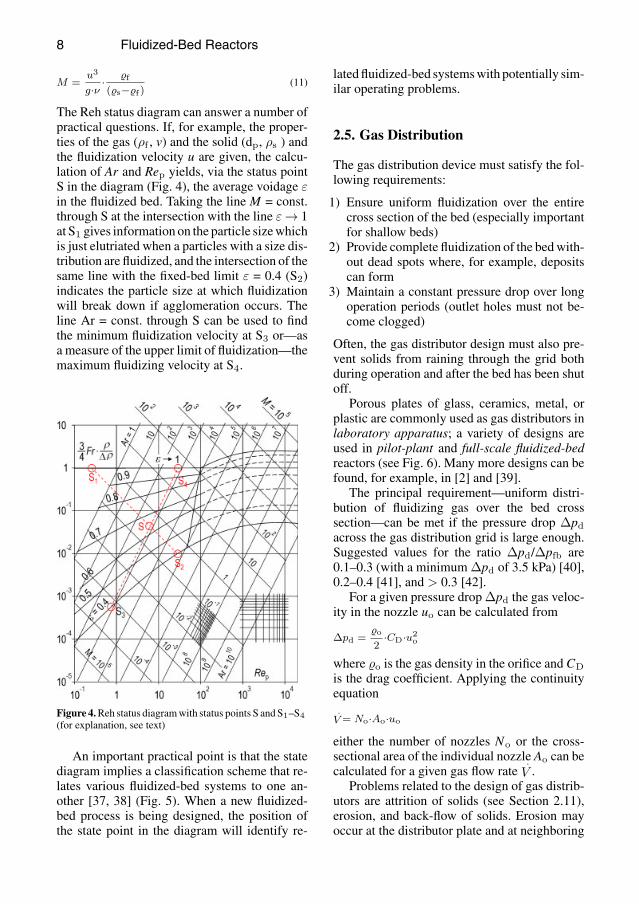
Whereas the onset of the fluidized state can bedescribed by the minimum fluidization veloc-ity, the bed operating range and the gas velocityneeded to create a given fluidized state can be es-timated with the help of the fluidized-bed statediagram (Fig. 4) devised by Reh [36]. This plotshows the fluid mechanical resistance character-istics of the fixed bed, fluidized bed, and pneu-matic transport. The ordinate is the quantity
34
u2
g·dp· �f
(�s−�f)and the abscissa is the Reynolds number Repformed with the fluidization velocity u and theparticle diameter dp. The state parameter in thefluidized-bed region is the mean bed porosityε. The use of the diagram is facilitated by anauxiliary grid with lines of constant M and con-stant Archimedes number.While the dimension-less groups plotted as ordinate and abscissa eachcontain both the particle diameter and the flu-idization velocity, this is not the case with theparameters Ar and M defined by
Ar =g·d3
p
ν2· (�s−�f)
�f(10)
8 Fluidized-Bed Reactors
M =u3
g·ν · �f
(�s−�f)(11)
The Reh status diagram can answer a number ofpractical questions. If, for example, the proper-ties of the gas (ρf , v) and the solid (dp, ρs ) andthe fluidization velocity u are given, the calcu-lation of Ar and Rep yields, via the status pointS in the diagram (Fig. 4), the average voidage εin the fluidized bed. Taking the line M = const.through S at the intersection with the line ε→ 1at S1 gives information on the particle sizewhichis just elutriated when a particles with a size dis-tribution are fluidized, and the intersection of thesame line with the fixed-bed limit ε = 0.4 (S2)indicates the particle size at which fluidizationwill break down if agglomeration occurs. Theline Ar = const. through S can be used to findthe minimum fluidization velocity at S3 or—asa measure of the upper limit of fluidization—themaximum fluidizing velocity at S4.
Figure 4.Reh status diagramwith status points S and S1–S4(for explanation, see text)
An important practical point is that the statediagram implies a classification scheme that re-lates various fluidized-bed systems to one an-other [37, 38] (Fig. 5). When a new fluidized-bed process is being designed, the position ofthe state point in the diagram will identify re-
latedfluidized-bed systemswith potentially sim-ilar operating problems.
2.5. Gas Distribution
The gas distribution device must satisfy the fol-lowing requirements:
1) Ensure uniform fluidization over the entirecross section of the bed (especially importantfor shallow beds)
2) Provide complete fluidization of the bedwith-out dead spots where, for example, depositscan form
3) Maintain a constant pressure drop over longoperation periods (outlet holes must not be-come clogged)
Often, the gas distributor design must also pre-vent solids from raining through the grid bothduring operation and after the bed has been shutoff.
Porous plates of glass, ceramics, metal, orplastic are commonly used as gas distributors inlaboratory apparatus; a variety of designs areused in pilot-plant and full-scale fluidized-bedreactors (see Fig. 6). Many more designs can befound, for example, in [2] and [39].
The principal requirement—uniform distri-bution of fluidizing gas over the bed crosssection—can be met if the pressure drop ∆pdacross the gas distribution grid is large enough.Suggested values for the ratio ∆pd/∆pfb are0.1–0.3 (with a minimum ∆pd of 3.5 kPa) [40],0.2–0.4 [41], and > 0.3 [42].
For a given pressure drop ∆pd the gas veloc-ity in the nozzle uo can be calculated from
∆pd =�o
2·CD·u2
o
where �o is the gas density in the orifice and CDis the drag coefficient. Applying the continuityequation.V= No·Ao·uo
either the number of nozzles No or the cross-sectional area of the individual nozzle Ao can becalculated for a given gas flow rate
.
V .Problems related to the design of gas distrib-
utors are attrition of solids (see Section 2.11),erosion, and back-flow of solids. Erosion mayoccur at the distributor plate and at neighboring

Fluidized-Bed Reactors 9
Figure 5. Reh’s fluidized-bed state diagram with operating regions of different reaction systemsa) Circulating fluidized bed; b) Fluidized-bed roaster; c) Bubbling fluidized bed; d) Shaft furnace; e) Moving bed
Figure 6. Industrial gas distributorsA) Perforated plate; B) Nozzle plate; C) Bubble-cap plate

10 Fluidized-Bed Reactors
nozzles or walls due to gas jets as well as at thenozzle itself. Back-flow of solids into the wind-box is caused by pressure fluctuations. In orderto prevent this either the design pressure drophasto be larger than the pressure fluctuations or—if this is not feasible for economic reasons—adesign must be chosen which tolerates short pe-riods of gas flow reversal without permitting thesolids to penetrate into the windbox. For the lat-ter case the bubble cap design has turned out tobe advantageous [43].
In the operation of fluidized-bed reactors, thequadratic response (∆pd ∼ u2) of industrial gas-distributor designs must be kept in mind, be-cause even if the fluidization velocity is low-ered only slightly, an unacceptably low pressuredrop across the gas distributor may occur. In-dustrial experience with different distributor de-signs, practical design rules, and a discussion ofdistributor-related problems, such as weepageinto the windbox and erosion by grid jets and atgrid nozzles, has been compiled in [44].
2.6. Gas Jets in Fluidized Beds
Gas jets can form at the outlet openings of in-dustrial gas distributors and also where gaseousreactants are admitted directly into the fluidizedbed. A knowledge of the geometry of such jets,in particular the depth of penetration, is impor-tant for the implementation of chemical opera-tions in fluidized-bed reactors, and not just fromthe standpoint of reaction engineering. It is alsovital for reasons of design: the strongly erosiveaction of these jets means that internals, such asheat-exchanger tubes,must not be locatedwithintheir range.
The literature containsmany empirical corre-lations for estimating the mean depth of jet pen-etration L (e.g., [2 – 4]); these must, however,be used with care and, whenever possible, onlywithin the range of parameter values for whichthey were derived. By way of example, Merrygives the following correlations for vertical gasjets [45]:
L
do= 5.2
(�fdo
�sdp
)0.3[1.3
(u2o
gdo
)0.2
−1
](12)
and for horizontal jets [46]:
Ldo
= 5.25[
�ou2o
(1−ε) �sg dp
]0.4 (�f�s
)0.2
·(
dpdo
)0.2−4.5(13)
Here do is the diameter of the outlet opening, uois the outflow velocity, and �o is the density ofthe jet gas.
2.7. Bubble Development
For many applications, especially physical op-erations and noncatalytic reactions, the state ofa fluidized bed can adequately be described interms of a single quantity averaged over the en-tire bed, such as the mean bed porosity ε. In con-trast, the design of fluidized-bed catalytic reac-tors requires that local fluid-flow conditions alsobe taken into account.
The local fluid mechanics of gas–solid flu-idized beds are determined by the existence ofbubbles, which influence the performance offluidized-bed equipment in several ways: thestirring action and convective solids transportby the rising bubbles are helpful; the resultingintensive solids motion produces a uniform tem-perature throughout the fluidized bed and rapidheat transfer between the bed and the heating orcooling tubes submerged in it. The bubbles andthe motion of solids that they cause, however,also have some drawbacks: attrition of solid par-ticles, erosion of internals, and increased solidsentrainment by bubbles bursting at the bed sur-face. The existence of bubbles is particularlydetrimental in the case of a heterogeneous cat-alytic gas-phase reaction, because the bypass ofreactant gas in the bubble phase limits the con-version achieved in the fluidized bed.
The ultimate cause of bubble formation is theuniversal tendency of gas–solid flows to seg-regate. Many studies on the theory of stabil-ity (e.g., [3, 4]) have shown that disturbancesinduced in an initially homogeneous gas–solidsuspension do not decay but always lead to theformation of voids. The bubbles formed in thisway exhibit a characteristic flow pattern whosebasic properties can be calculatedwith themodelof Davidson and Harrison [47]. Figure 7 showsthe streamlines of the gas flow relative to a bub-ble rising in a fluidized bed atminimumfluidiza-tion conditions (ε = εmf ). The characteristic pa-rameter is the ratio α of the bubble’s upward

Fluidized-Bed Reactors 11
velocity ub to the interstitial velocity of the gasin the suspension surrounding the bubble:
α =ub
umf/εmf(14)
Figure 7. Gas flow for isolated rising bubbles in theDavidson model [47]
The case α > 1 is typical for solids of Gel-dart groupsA andB. The gas rising in the bubbleflows downward again in a thin layer of sus-pension (“cloud”) surrounding the bubble. Animportant point for heterogeneous catalytic gas-phase reactions is that the presence of a bound-ary between bubble gas and suspension gas leadsto the existence of two distinct phases (bubblephase and suspensionphase)with drastically dif-ferent gas–solid contact.
If α < 1, some of the gas in the suspensionphase undergoes short-circuit flow through thebubble, while only part of the bubble gas recir-culates through the suspension. This type of flowis typical for fluidized beds of coarse particles(Geldart group D).
Under the real operating conditions of afluidized-bed reactor, a number of interactingbubbles occur in the interior of the fluidized bed.As a rule, the interaction leads to coalescence.As detailed studies have shown, this process isquite different from that between gas bubbles inliquids because of the absence of surface-tensioneffects in the fluidized bed [48, 49].
For predicting mean bubble sizes in freelybubbling fluidized beds, a differential equationfor bubble growth should be used in the case ofGeldart group A and B solids [50]:
ddh
dv =(2εb9π
) 13 − dv
3λ ub(15)
with the following boundary condition at h = ho:
(16)dv0
m=
{ 0.008ε1/3b porous plate
1.3( .
V2o
g
)0.2industrial gas distributor
where ho is the height above the grid where thebubbles form (for a porous plate, ho ≈ 0; for aperforated plate, ho = L; for a nozzle plate, ho isthe height of the outlet opening above the plate;and for a bubble-cap plate, ho is the height of thelower edge of the cap above the plate). V0 is thevolume flow rate of gas through the individualgrid opening.
The local volume fraction of bubble gas εb isgiven by
εb =.V b/ub (17)
and the visible bubble flow.
V b is.V b≈0.8 (u−umf) (18)
The upward velocity ub of bubbles dependsnot only on the bubble size but also on the diam-eter dt of the fluidized bed:
where
ub=.V b+0.71·ϑb·
√gdv (19)
ϑb=
{3.2 d0.33
t 0.05≤dt≤1m, Geldart groupA3.2 d0.5
t 0.1≤dt≤1m, Geldart groupB(20)
Outside these limits, ϑb is taken as constant.The differential equation (Eq. 15) describes
not only bubble growth by coalescence but alsothe splitting of bubbles (second termon the right-hand side [51]). The crucial parameter here is themean bubble lifetime λ:
λ≈280·umf
g(21)
In practice, bubble growth is limited not only bythe splitting mechanism based on the particle-size distribution of the bed solids, but also byinternals (screens, tube bundles, and the like)that cause bubbles to break up. Computationaltechniques for estimating this process are givenin [52, 53].
Hilligardt and Werther have derived a cor-responding bubble-growth model for coarse-particle fluidized beds (Geldart group D) [50].
An example of a measured and calculatedbubble-growth curve is presented in Figure 8.
12 Fluidized-Bed Reactors
Figure 8. Bubble growth in a fluidized bed of fine particles(Geldart group A; data points from [54], calculation from[50])
2.8. Elutriation
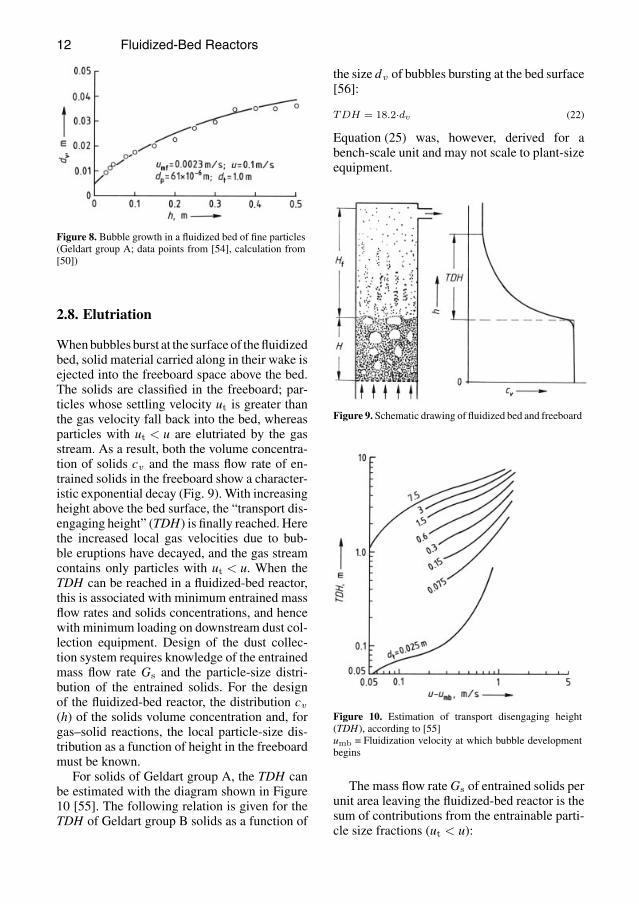
Whenbubbles burst at the surfaceof thefluidizedbed, solid material carried along in their wake isejected into the freeboard space above the bed.The solids are classified in the freeboard; par-ticles whose settling velocity ut is greater thanthe gas velocity fall back into the bed, whereasparticles with ut < u are elutriated by the gasstream. As a result, both the volume concentra-tion of solids cv and the mass flow rate of en-trained solids in the freeboard show a character-istic exponential decay (Fig. 9). With increasingheight above the bed surface, the “transport dis-engaging height” (TDH) is finally reached. Herethe increased local gas velocities due to bub-ble eruptions have decayed, and the gas streamcontains only particles with ut < u. When theTDH can be reached in a fluidized-bed reactor,this is associated with minimum entrained massflow rates and solids concentrations, and hencewith minimum loading on downstream dust col-lection equipment. Design of the dust collec-tion system requires knowledge of the entrainedmass flow rate Gs and the particle-size distri-bution of the entrained solids. For the designof the fluidized-bed reactor, the distribution cv(h) of the solids volume concentration and, forgas–solid reactions, the local particle-size dis-tribution as a function of height in the freeboardmust be known.
For solids of Geldart group A, the TDH canbe estimated with the diagram shown in Figure10 [55]. The following relation is given for theTDH of Geldart group B solids as a function of
the size dv of bubbles bursting at the bed surface[56]:
TDH = 18.2·dv (22)
Equation (25) was, however, derived for abench-scale unit and may not scale to plant-sizeequipment.
Figure 9. Schematic drawing of fluidized bed and freeboard
Figure 10. Estimation of transport disengaging height(TDH), according to [55]umb = Fluidization velocity at which bubble developmentbegins
The mass flow rateGs of entrained solids perunit area leaving the fluidized-bed reactor is thesum of contributions from the entrainable parti-cle size fractions (ut < u):

Fluidized-Bed Reactors 13
Gs =∑
ixi·κ∗
i (23)
Here xi is the mass fraction of particle-sizefraction i in the bed material and κ*i is the elu-triation rate constant for this fraction. The lit-erature contains a number of empirical corre-lations for estimating κ*i (e.g., [2 – 4]). Morephysical-based are the elutriationmodels ofWenand Chen [57] and of Kunii and Levenspiel [2,58], which enable not only calculation of the ex-iting mass flow rate but also estimation of theconcentration versus height cv (h) in the free-board. The model by Smolders and Baeyens ad-ditionally takes the effect of variable freeboardgeometry into account [59].
A literature survey on the factors affectingelutriation and the available modeling tools isgiven in [60].
2.9. Circulating Fluidized Beds
2.9.1. Hydrodynamic Principles
In Reh’s state diagram of the fluidized bed [36],the circulating fluidized bed (CFB) is locatedabove the single-particle suspension curve forRe < 102 and porosities ε greater than about 0.8(dashed line in Fig. 5). The shortcoming of thisdiagram is that it does not show an importantparameter in the operation of a circulating flu-idized bed: the circulating solids mass flow rateper unit area Gs. The diagram of Figure 11 [61]attempts to remedy this by plotting themean slipvelocity usl between gas and solids
usl =u
ε− (Gs/�s)
1−ε (24)
versus the mean solids concentration cv = 1 −ε, with Gs as the parameter. The limiting condi-tions are high solids concentration (bed at mini-mumfluidization) and cv → 0with usl = ut (iso-lated single particle). In the circulatingfluidized-bed region, slip velocity increases with increas-ing Gs and can become much higher than thesingle-particle settlingvelocity (the physical jus-tification for this statement comes from the for-mation of strands or clusters of particles). In theentrained-flow region the slip velocities againdecrease with decreasing solids concentration.
Figure 11. Fluidized-bed state diagram, according to [61]
The fluidized-bed state diagrams discussedthus far, aswell as others (e.g., [62, 63]), are suit-able mainly for the qualitative interpretation offlow phenomena. A diagram proposed byWirth(e.g., [11, 64, 65]) also provides quantitative as-sistance in the design of circulating fluidizedbeds. The schematic in Figure 12 applies to agiven gas–solid system described by a constantvalue of the Archimedes number Ar. The ordi-nate is the dimensionless pressure drop of thefluidized bed
ψ =∆p
(�s−�f) (1−εmf) g∆h(25)
the abscissa is the particle Froude number
Frp =u√
(�s−�f )�f
gdp
(26)
The dimensionless pressure dropψ is the ratio ofthe pressure drop ∆p along the flow path ∆h tothe maximum possible value for ascending flow(the value that would be attained if the pipe crosssection were filled with solids corresponding tothe concentration at the minimum fluidizationpoint). The parameter of the family of curves isa volume flow rate ratio
µ �f
�s (1−εmf)(27)
where µ is the ratio of solid-to-gas mass flowrates. The limiting curve bounds the region ofstable, vertically upward gas–solid flow on thelow gas velocity side.
Figure 13 shows how the state diagram ofFigure 12 is constructed for a circulating flu-idized bed with siphon recycle. If solids holdupin the recycle line and siphon is ignored, thiscase represents operation with a constant bedmass independent of velocity. At high gas ve-locities and if acceleration effects are neglected,

14 Fluidized-Bed Reactors
the bedmaterial is distributed uniformly over thetotal heightHcfb of the fluidized bed (Fig. 13 C).The circulating fluidized bed then exhibits a sin-gle steady-state section with a constant pressuregradient (∆p/∆h). This pressure gradient can becalculated from the bed mass as
ψhom =(�s−�f) gHmf (1−εmf)(�s−�f) gHcfb (1−εmf)
=Hmf
Hcfb(28)
where Hmf is the bed height at minimum flu-idization.
Figure 12. State diagram for the circulating fluidized bedwith siphon, according to Wirth [64]Ar = const., parameter of family of curves is the volumeflowrate ratio µ �f /(�s (1 − εmf )); Frp= particle Froude num-ber for superficial minimum fluidization velocity (pumf ),single-particle terminal velocity (pt), and transport velocity(pT), respectively.
The states identified by ψhom to the right ofthe bounding curve in Figure 12 are accessibleby increasing the gas velocity (corresponding to
increasing Frp). With increasing Frp the vol-ume flow ratio increases; that is, relatively moresolids are elutriated (and thus circulated).
If Frp is allowed to drop below the limitFrpmax (Fig. 13 B, Fig. 12) two steady-statesections appear in the riser tube: the one in thelower part is marked by a high pressure gradi-ent, that in the upper part by a lower gradient.Figure 13 illustrates the physical significanceof these two pressure gradients. In practice, thetransition between the two linear regions takesplace gradually. The height of the transition zonecorresponds to the transport disengaging height(TDH).
The picture changes further if the gas velocitydeclines to values lower than the settling velocityut of a single isolated particle. In this case (forFrp < Frpt, Fig. 13 A, Fig. 12), no more solidscan be elutriated, and the pressure gradient in theupper linear region vanishes. All the solid mate-rial is now in the form of a bubbling or turbulentfluidized bed.
The solids concentrations averaged over thetube cross section (1 − ε) can be calculated fromthe dimensionless pressure drop:
1−ε = (1−εmf) ·ψ (29)
Besides the pressure and solids concentrationprofile, the circulating mass flow rate of solidsGs · At is important for the design of the circu-lating fluidized bed. In particular, the design ofthe solids collection and recycle system dependsvery much on this quantity. The mass flow rateof solids depends on the flow regime. At gas ve-locities such that two steady-state sections are
Figure 13. Pressure profile in the circulating fluidized bed with siphon, according to Wirth [64]A) Frpumf<Frp<Frpt; B) Frpt<Frpmax ; C) Frp>Frpmax

Fluidized-Bed Reactors 15
present in the bed vessel (i.e., Frpumf < Frp< FrpT), the mass flow rate of entrained solidsdepends on the physics of the gas–solid flow.Figure 14 plots the dimensionless solids massflow rate versus Frp, with the Archimedes num-ber as parameter. For a given Ar, the flow ratetends to zero as Frp→ Frpt and reaches a maxi-mum at Frp = FrpT. The slope of the elutriationcurve becomes greater with increasing Ar; thatis, the coarser the particles, the greater is the rel-ative change in the circulating mass flow rate ofsolids with a change in gas velocity.
Figure 14. Elutriation diagram when the circulatingfluidized bed contains two steady-state sections, accordingtoWirth [64]
At high gas velocities in the circulating flu-idized bed (i.e., when a single steady-state sec-tion exists), the entrainedmass flow rate dependson the particle Froude number and the solidsholdup. More detailed information about the ap-plication of Wirth’s theory in practice may befound in [11].
Whereas Wirth’s analysis of the circulatingfluidized bed starts from the pneumatic transportcondition, the models of Rhodes and Geldart[66], as well as Kunii and Levenspiel [2, 58],are based on the bubbling fluidized bed and de-scribe the circulating fluidized bed as a limiting
case of a bubbling bed with a very high rate ofsolids entrainment.
2.9.2. Local Flow Structure in CirculatingFluidized Beds
TheWirth state diagram, as a first step toward thelocal characterization of flow regimes in a circu-lating fluidized bed, describes the vertical profileof the solids concentration. In the lower sectionof a circulating fluidized bed a dense region ex-its near the gas distributor. It has been observedthat in this bottom zone bubble-like voids co-exist with a surrounding dense suspension. Thesolids volume concentration is higher at the wall(cv ≈ 0.4) then in the center (cv ≈ 0.15) of thebottom zone [67]. The splash zone which linksthe bottom zone to the upper dilute zone is char-acterized by violent gas–solid mixing. Many re-cent experimental studies with various measure-ment techniques (e.g., X-ray tomography [68],capacitance tomography [69] and fiber-opticalprobes [70]) have shown that the upper section ofthe circulating fluidized bed exhibits character-istic horizontal profiles, with the concentrationcv ,wall near the vessel wall always significantlyhigher than the value cv averaged over the ves-sel cross section; for example, cv , wall = 2.3 · cv[71].
Local measurements of the solids concen-tration and solids velocity show that upward-flowing regions of low solids concentration anddownward-flowing aggregates of high solidsconcentration alternate in time at every point in-side the fluidized bed, with downward-movingaggregates (strands, clusters) predominatingnear the wall and upward-moving regions of lowsuspension concentration predominating in thecentral zone. However, no significant downwardflowof solids near thewallwas observed in high-density circulating fluidized beds, e.g., [72]. Thepicture of the local flow structure in a circulat-ing fluidized bed, as derived from these obser-vations, is shown schematically in Figure 15.
A modeling approach which is based on thelocal flow structure of the CFB is the energy-minimization multiscale (EMMS) model [73].It considers the tendency of a fluid in a gas–solid two-phase flow to pass through the partic-ulate layer with least resistance and the tendencyof the solids to maintain least gravitational po-

16 Fluidized-Bed Reactors
tential. Least resistance means that the volume-specific energy consumption for suspending andtransporting solids is minimized, and minimiza-tion of the gravitational potential is equivalentto the requirement that the local mean voidageε attains a minimum. The model has been ap-plied as a description of fluid-mechanical phe-nomena in CFB risers of different sizes [74, 75]but also for the prediction of flow patterns ofgas and solids in industrial-scale units, such as aCFB boiler [76] and a petrochemical processingunit [77]. Another promising line of develop-ment is the introduction of the EMMS conceptinto computational fluid dynamical calculationsof multiphase flows; first results obtained witha drag model based on the EMMS model areencouraging [78].
Figure 15. Schematic diagram of flow structure in a circu-lating fluidized bed
2.9.3. Design of Solids Recycle System
Solids carried over with the fluidized gas aregenerally collected in cyclones. In the case ofbubbling beds, the solids can easily be returnedto the bed through the standpipe of the cyclone,which dips directly into the bed.
Due to the large amounts of circulating solids,circulating fluidized beds require very large cy-clones arranged beside and outside the bed, withspecial “valves” needed to connect the standpipeto the bed vessel. Figure 16 shows two designoptions, the siphon and the L-valve. With thesiphon, the solids are fluidized (i.e., enabled toflowback into the reactor). In theL-valve design,
the mass flow rate of the solids can be regulatedby varying the gas supplied to the standpipe.
Figure 16. Design options for solids recycleA) Siphon; B) L-valve
Because the solids path does not contain anysort of mechanical closure, the characteristicpressure distribution plotted in Figure 17 is ob-tained.Thedistributionof solids between theflu-idized bed and the recycle line is directly relatedto this pressure distribution. Operating proper-ties differ from one recycle design to another[79].
2.10. Cocurrent Downflow CirculatingFluidized Beds (Downers)
A certain drawback of circulating and bubblingfluidized beds when applied for gas-phase reac-tions is the backmixing which inevitably occursin the gas phase. In bubbling fluidized beds itis the bubble-induced solids circulation, and incirculating fluidized beds the downflowof solidsin the wall zone, which entrains gas in the up-stream direction and thus lowers the yield of acatalytic reaction or gives rise to undesired con-secutive or side reactions. These disadvantagescaused by the hydrodynamic effects of both gasand solids flowing against gravity could be over-come in the so-called downer reactor, in whichthe flow directions of both gas and solids aredownward, i.e., in the same direction as gravity[80]. Another incentive is the possibility of real-izing short contact times between gas and solidsof around or even below one second.
Downer systems have been intensely stud-ied [80]. Hydrodynamics [81, 82], gas mixing

Fluidized-Bed Reactors 17
Figure 17. Pressure distribution in solids recycle system of a circulating fluidized beda) Fluidized bed; b) Return leg
[83], and solids mixing [84, 85] have been in-vestigated both experimentally andbynumericalsimulation [86]. It has been found that the hydro-dynamics of the downer are also characterizedby a wall zone of increased solids concentra-tion. However, axial and radial gas-solids flowstructures are much more uniform than in con-ventional fluidized beds. Another result is thatthe length of the flow development zone is muchshorter for the downer than for the riser, whichmeans that reactions with very short contacttimes can be carried out under near-plug-flowconditions. However, the solids feeding processand the geometry of the entrance region are crit-ical points that deserve special attention [87].
The patent and open literature suggest vari-ous applications for downer reactors, e.g., resid-ual oil cracking [88], coal pyrolysis [89], andbiomass pyrolysis [90]. The catalytic pyrolysisof heavy feeds for the production of light olefinshas been investigated on the laboratory scalewith promising results [88]. However, no large-scale industrial process has emerged yet.
2.11. Attrition of Solids
The attrition of solid particles is an unavoid-able consequence of the intensive solids mo-tion in the fluidized bed. The attrition prob-lem is especially critical in processes where the
bed material needs to remain unaltered for thelongest possible time, as in fluidized-bed reac-tors for heterogeneous catalytic gas-phase reac-tions. Catalyst attrition is important in the eco-nomics of such processes and may even becomethe critical factor.
Figure 18. Attrition modes and their effects on the particlesize distribution (q3 = mass density distribution of particlesizes dp)
Catalyst attrition in fluidized-bed reactorsoccurs normally as surface abrasion (Fig. 18)which means that surface asperities are abradedand edges of the catalyst particles are roundedoff. Fragmentation may also play a role, espe-cially for some fresh catalyst particles which on

18 Fluidized-Bed Reactors
entering the reactor may simply be crushed intopieces. If in an industrial process extraordinar-ily high catalyst losses are observed it is advis-able to examine catalyst samples under the scan-ning electronmicroscope. If the sample containsmany fragments this could be an indication of awrong design (e.g., too high a velocity at thecyclone inlet or at the distributor).
When designing catalytic fluidized-bed pro-cesses, the attrition performance of candidatecatalysts should be tested under standardizedconditions in the process development stage.This test can be performed in a small laboratoryapparatus; it consists essentially of an extendedfluidization test in which the mass of solids car-ried out of the bed is recorded as a function oftime. Figure 19 presents a typical test result: dur-ing the first hours of testing, both the attritedma-terial and the fine fraction of the bedmaterial areelutriated. Only after a relatively long operatingperiod is a quasi-steady state attained. The at-trition rate ra in this steady state can be definedas
ra =1mb
·∆ma
∆t(30)
where ma is the elutriated mass and mb thebed mass. Usually ra is expressed as percent-age per day; for relatively attrition-resistant,fluidized-bed catalysts, it is of the order of 0.2%per day [9].
Figure 19. Result of an attrition measurement
Many standard test apparatuses have beenproposed for comparative attrition tests (e.g.,[91, 92]), but all such equipment has been suit-able only for comparative studies of differentcatalysts under consideration for the same pro-cess.The attritionmeasured in large-scale equip-ment can be far different from the values mea-sured in a test apparatus.
A number of sources can be identified forcatalyst attrition in industrial fluidized-bed re-actors:
1) Jet attrition at gas distribution grid openingsand nozzles where gaseous reactants are ad-mitted to the bed
2) Bubble attrition in the bed due to solids mo-tion caused by bubbles
3) Attrition in cyclones4) Attrition in pneumatic conveying lines, such
as those between reactor and regenerator beds
Empirical correlations are available for theattriting action of a gas jet in the fluidized bed[93] and for the size reduction effect of solidsmotion in the bed [94, 95].
Werther and coworkers [96] employ the lab-oratory apparatus shown schematically in Figure20 which enables separate study of the attritiondue to jets fromnozzles of various diameters andthat due to bubbles.
Figure 20. Experimental apparatus for attrition measure-ment

Fluidized-Bed Reactors 19
Under steady-state conditions the jet-attrition-related mass production of fines perunit time for a gas distributor with a number noof orifices from mother particles with diameterdp,i which are present in the catalyst inventorywith a mass fraction ∆Q3i is proportional to theparticle size dpi, the mass fraction ∆Q3i, thedensity ρo of the gas issuing from the orifice,the square of the orifice diameter do, and to thecube of the jet exit velocity uo [97, 98]:·matt,jet,i=cjn0dpi∆Q3iρ0d
20u
30 (31)
Attrition due to the bubble induced solidsmovement is given by [98]·matt,bubble,i=cbdpi∆Q3imb(u−umf)
3 (32)
where mb denotes the bed mass which containsbubbles (i.e., which is located outside the jet-dominated grid region). Equation (32) also de-notes the mass production of attrited fines whichis resulting from the size fraction dpi in the bed.
The stress on the catalyst particles will be dif-ferent in contact with a gas jet, in the bulk of thebubbling fluidized bed, and during its passagethrough a cyclone. Recent investigations of cy-clone-induced catalyst attrition [99 – 101] haveshown that the mass flow of attrited fines whichis produced by attrition inside the cyclone whena solids mass flow mc·∆Q3ci of particles of thesize fraction dpi enters the cyclone is given by
·matt,c,i=cc· ·
mc·∆Q3ci·dpi· u2c√µc
(33)
where uc is the gas velocity at the cycloneinlet, and µc the solids loading of the incominggas flow
µc=·mc
ρc·uc·Ac(34)
where ρc is the density of the inflowing gas,and Ac the cross-sectional area of the cycloneinlet.
Equations (31)–(34) describe the catalyst at-trition under conditions of steady state, i.e.,when the particles are more or less roundedoff (Fig. 18). To describe also the initial break-age and attrition of fresh catalyst particles, it isnecessary to follow the fate of the particles ontheir introduction into the reactor, which is pos-sible with population balance models (cf. Sec-tion 9.3.2). Klett et al. [102] and Hartge et al.[103] have defined a stress history parameter ϑ
ϑ=
t/t∗jfor jet − induced attrition
t/t∗bfor in − bed attrition
np/n∗pfor attrition in cyclones
(35)
where the definition of the characteristic pa-rameters t∗j , t
∗b, and n∗
p can be taken from Figure21, np is the number of passages of a given par-ticle through the cyclone, and tb and tj are thetime periods during which the particle is sub-jected to bubble and jet stress, respectively. If itis assumed that the effects of the different stressmechanisms on the catalyst particles are addi-tive, a uniform treatment of the overall stresshistory for all three attritionmechanisms is givenby
·matt (ϑ)
·matt,∞
=
1.1·ϑb ϑ≤1.1
−1/b
1 ϑ>1.1−1
/b
(36)
The parameter b is characteristic of a givencatalyst. Figure 22 shows measurements withFCC catalyst [103] which lead to b = −1.16.Equation (36) allows the description of thestress-history-dependent attrition rate and can beused for the simulation of fluidized bed reactors(see Section 9.3.2).
Figure 21. Dependence of attrition on time (bubble- andjet-induced attrition) and number of passages np through acyclone.
A variety of approaches exist for reducingattrition in industrial fluidized-bed reactors. Thejet attrition action can be controlled with spe-cial gas distributor designs ([9]; e.g., by the useof bubble caps, Fig. 6) such that gas jets do notissue directly into the bed at high velocity. Attri-tion due to bubbles can be lowered by limitingbubble growth (avoiding high gas velocities andlarge bed heights; use of fine catalysts with low

20 Fluidized-Bed Reactors
umf , as implied by Eqs. 18 and 24). Attrition incyclones can be prevented, in the simplest case,by replacing the cyclones with devices such asfilters. Attrition can also be minimized by cut-ting back the load on the cyclone, for example,by placing the cyclones above the TDH. Rela-tively high catalyst attrition also occurs in circu-lating fluidized beds where very large quantitiesof solids must be collected in the cyclones.
Figure 22. Dimensionless attrition rate of FCC catalyst asa function of stress history.
3. Solids Mixing in Fluidized-BedReactors
The intensive solids mixing typical of fluidized-bed reactors has several effects on performance.In catalytic reactions, the large-scale verticalsolids mixing results in a transport of the gascomponents, adsorbed to the catalyst, so that thegas phase is backmixed and the conversion andselectivity are impaired. In noncatalytic gas–solid reactions, the mean solids residence timeand residence-time distribution, as well as thepropagation behavior of the solids from indi-vidual feed points, play a role. In general, fastand strongly exothermic reactions require fairlyvigorous solids mixing to prevent temperaturepeaks near the reactant inlet.
3.1. Mechanisms of Solids Mixing
The wake of the rising bubbles produces a ratherslight upward and lateral drift of the particles(Fig. 23 A) [104]. In addition, solid particles aredrawn upward in the wake, portions of the wake
are shed at irregular intervals during bubble mo-tion, and newportions of solids are taken into thewake (Fig. 23 B). Solids transport in the wake isessentially the reason that vertical solids mixingis from one to two orders of magnitude betterthan horizontal mixing.
Figure 23. Solids mixing in bubbling fluidized beds due toparticle drift (A) and wake transport (B)a) Cloud; b) Wake
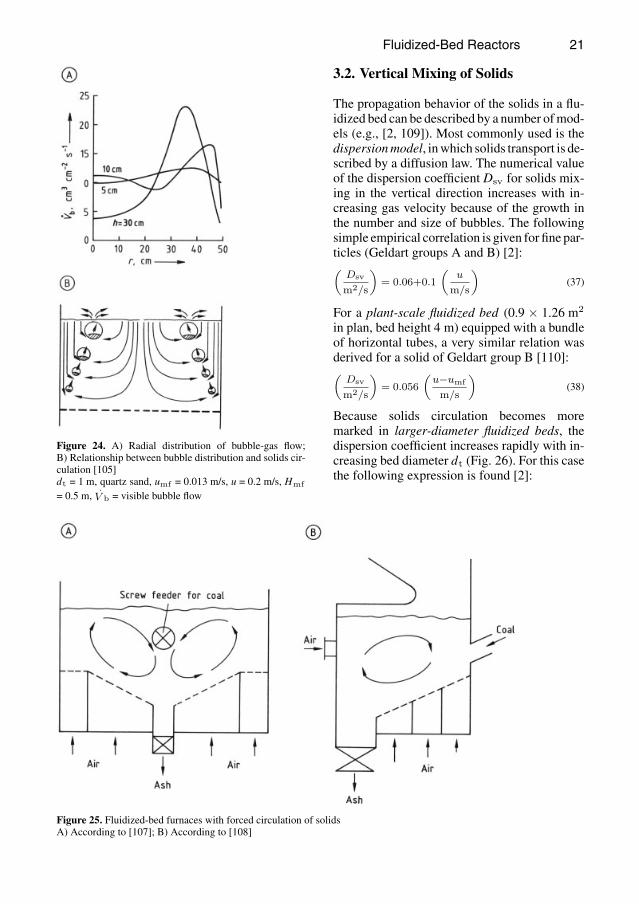
For reasons of continuity, the upward trans-port of particles by bubbles is coupled with adownward movement in the suspension phasethat surrounds the bubbles.Measurements of thelocal bubble-gas flow have shown that the ris-ing bubbles are not distributed evenly over thebed cross section. As a typical example, Figure24 A gives a plot of the radial distribution ofthe bubble-gas flow at three heights above thegrid in a fluidized bed 1 m in diameter. The pro-file is comparatively flat in the bottom zone butexhibits a steeper slope as the height increases,with an annular zone of preferentially rising bub-bles. The resulting circulation of the solids alsofeatures an annular region of upward transportin the wakes with predominantly downwardmo-tion of the solids in the center and at the periph-ery of the bed (Fig. 24 B).
The large-scale solids circulation can be rein-forced by uneven distribution of the fluidized gasover the distributor cross section [106]. Figure25 presents examples of industrial fluidized-bedfurnaces inwhich forced circulation of the solidsis employed to improve coal burnup.
Fluidized-Bed Reactors 21
Figure 24. A) Radial distribution of bubble-gas flow;B) Relationship between bubble distribution and solids cir-culation [105]dt = 1 m, quartz sand, umf = 0.013 m/s, u = 0.2 m/s, Hmf
= 0.5 m,.V b = visible bubble flow
3.2. Vertical Mixing of Solids
The propagation behavior of the solids in a flu-idized bed can be described by a number ofmod-els (e.g., [2, 109]). Most commonly used is thedispersionmodel, inwhich solids transport is de-scribed by a diffusion law. The numerical valueof the dispersion coefficient Dsv for solids mix-ing in the vertical direction increases with in-creasing gas velocity because of the growth inthe number and size of bubbles. The followingsimple empirical correlation is given for fine par-ticles (Geldart groups A and B) [2]:(Dsv
m2/s
)= 0.06+0.1
(u
m/s
)(37)
For a plant-scale fluidized bed (0.9 × 1.26 m2
in plan, bed height 4 m) equipped with a bundleof horizontal tubes, a very similar relation wasderived for a solid of Geldart group B [110]:(Dsv
m2/s
)= 0.056
(u−umf
m/s
)(38)
Because solids circulation becomes moremarked in larger-diameter fluidized beds, thedispersion coefficient increases rapidly with in-creasing bed diameter dt (Fig. 26). For this casethe following expression is found [2]:
Figure 25. Fluidized-bed furnaces with forced circulation of solidsA) According to [107]; B) According to [108]

22 Fluidized-Bed Reactors
(Dsv
m2/s
)= 0.030
(dt
m
)0.65(39)
Figure 26. Vertical solids dispersion in fluidized beds offine particles (Geldart groups A and B) [2]
The above correlations can provide onlyrough values. Other effects observed in prac-tice include, in particular, a significant effect ofparticle-size range [111, 112].
3.3. Horizontal Mixing of Solids
In gas–solid reactions, the propagation behaviorof the solids in the horizontal direction is im-portant if, for example, the solid material is fedinto the bed at isolated feed points.Werther andcoworkers model the horizontal propagation ofcoal in a fluidized-bed furnace, describing thecarbon conversion in terms of a simple first-order reaction (rate constant k with dimensions−1) [113]. The crucial parameter is the ratiokd2
t /Dsh between the rate of the chemical reac-tion and the rate of dispersive mass transport.For high values of k (fast reaction), large reactordiameters dt, and low values of the dispersioncoefficientDsh, the local carbon concentration inthe bed exhibits a rather steep horizontal profile,resulting in a significantly nonuniform distribu-tion of gas emissions over the bed cross section.
On the basis of Kunii and Levenspiel’smodelof bubble-induced solids mixing [114], an ex-pression has been derived for calculating the
horizontal dispersion coefficient Dsh averagedover the bed height H, given local bubble prop-erties (bubble diameter dv , bubble-gas holdupεb) [115]:
Dsh=0.67×10⁻³+0.0231H
H∫0
εb
1−εb·√g·d3
v dh (40)
This correlation holds for solids of Geldartgroups B and D with Archimedes numbers bet-ween 8 600 and 58 000.
3.4. Solids Residence-Time Properties
Many applications of fluidization technologyinvolve continuous processing of solids. Im-portant considerations in such cases are notonly the mean solids residence time but alsothe residence-time distribution. Whereas all el-ements have the same residence time in a plug-flow system, a stirred tank exhibits a broad dis-tribution of residence times. To a good approxi-mation, the residence-time properties of the flu-idized bedwith respect to the solids are the sameas those of a stirred tank. The mean residencetime τ is the ratio of the solids mass mb in thereactor to the solids throughput
.ms:
τ =mb.ms
(41)
Themass fraction dms/mb of solids having a res-idence time between t and t + dt is
dms
mb=
1τe− t
τ dt (42)
Similarly, the fraction f of solids having a res-idence time less than t in the bed is calculatedas
f = 1−e−t/τ (43)
The residence-time distribution can be narrowedby placing a number of fluidized beds in series.Multistage systems of this type are used, for ex-ample, in fluidized-bed drying [18].
3.5. Solids Mixing in CirculatingFluidized Beds
The circulating fluidized bed exhibits a complexgas–solid flow pattern as discussed in Section

Fluidized-Bed Reactors 23
2.9. Different regions can be discriminated withrespect to the prevailing mechanisms of solidsmotion and mixing. An extensive survey on ex-perimental findings in solids mixing is given in[116]. In the upper diluted zone of the circu-lating fluidized bed, clusters are formed withmainly upward flow in the core and predomi-nantly downwards motion near the wall. Whilethe wall region can be modeled by a plug-flowapproach, the core region exhibits radial gra-dients. The Peclet number characterizing radialsolids mixing in the core region
Per, s =uc·2R∗
Dr, s
increases from 150 to 300 with increasing solidsvolume concentrations [117]. A recent investi-gation of solids mixing in the bottom zone withsolid carbon dioxide as a tracer showed that inthis zone solids are almost ideally mixed in thevertical direction but lateral mixing is limitedwith dispersion coefficients of about 0.1 m2/swhich corresponds to Peclet numbers of around40, [118].
Counteracting to solids mixing, segregationoccurs in applications using particles of a broadsize distribution and/or different densities. Eas-ily fluidized particles tend to be elutriated whileothers tend to sink. A dynamic equilibrium bet-ween solids mixing and segregation is estab-lished, causing a spatial distribution of particleswith significantly different solids properties, aswas shown in an experimental study with a mix-ture of iron powder and quartz sand with a broadparticle size distribution [119].
4. Gas Mixing in Fluidized-BedReactors
The mixing and residence-time distribution ofthe gas are particularly important for catalyticreactions but are also significant for gas–solidreactions when gaseous reactants are to be con-verted to the greatest possible extent in fluidizedbeds (e.g., reduction of fine-grained iron ores tosponge iron with gaseous reductants [18]). Gasmixing is closely linked to the motion and mix-ing of the solids in the bed.
4.1. Gas Mixing in Bubbling FluidizedBeds
If the flow and mixing of gas in the bubbling flu-idized bed are described by a simple one-phasedispersion model, the coefficients Dgv and Dghof gas dispersion in the vertical and horizon-tal directions have similar numerical values andfollow trends similar to those of the solids dis-persion coefficients. By way of example, Figure27 shows the effect of fluidized-bed diameter dton vertical gas dispersion. The increase in dis-persion coefficient with vessel diameter mightbe attributable to the formation of large-scalesolids circulation patterns, which becomesmoremarked in larger equipment. As in the solidscase, the coefficients of horizontal gas disper-sion are a factor of 10–100 lower than those ofvertical gas dispersion.
Figure 27. Vertical gas dispersion in a fluidized bed ofsolids of Geldart group A (measurements by variousworkers; [2])
A single-phase dispersion model gives onlya rough description of gas mixing in bubblingfluidized beds. A more exact description comesfrommodels that take account of local flow con-ditions in the bed, especially the presence of bub-bles (see Chap. 9).
4.2. Gas Mixing in Circulating FluidizedBeds
Only a few detailed studies of gas mixing incirculating fluidized beds have been published,which are summarized in [120]. The bubbles

24 Fluidized-Bed Reactors
in a bubbling fluidized bed influence the gasresidence-time distribution and mixing directlythrough the bypass action of the bubble-gas flowand gas exchange between the bubbles and thesurrounding suspension phase, and also indi-rectly through the solidsmotion that they induce.In the circulating fluidized bed, on the otherhand, the gas-mixing properties are controlledby segregation due to the formation of solid ag-gregates (jets, clusters) and the rapid downwardmovement of solids strands predominantly nearthe wall. Grace and coworkers, for example,show that a single-phase dispersion model can-not describe the tracer gas residence-time distri-butions that they measured [121]. They proposeinstead a two-phase model featuring exchangebetween a wall zone with stagnant gas and acore zone with plug flow.
For the case of horizontal gas mixing,Werther and coworkers [122, 123] have shownthat, for the bed solids they used (quartz sand,dp = 0.13 mm, Geldart group B), horizontal gasmixing in the top part of the circulating fluidizedbed in the core zone can be described by themodel of turbulent single-phase flow [124]. ThePeclet number
Per, c =uc·2R∗
Dr, c(44)
(defined in terms of uc, the superficial velocityin the core zone; R*, the radius of the core zone;and Dr, c, the horizontal dispersion coefficientin the core zone) has a value of 465, which isin fairly good agreement with values measuredin single-phase flows [125]. This value is inde-pendent of the solids circulation rate Gs. Thecirculating fluidized bed thus exhibits no espe-cially intensive horizontal gas mixing, at leastin the upper section where solids concentrationsare relatively low.
5. Heat and Mass Transfer inFluidized-Bed Reactors
Fluidized-bed reactors exhibit a uniform temper-ature distribution even in case of highly exother-mic or endothermic reactions. Approximationsof the heat transfer rates are necessary for thedesign and control of fluidized-bed reactors inorder to determine the appropriate design of in-ternals for cooling or heating and to estimate the
changes in the performance with changing op-erating conditions.
However, up to now there is no general theoryon heat and mass transfer in fluidized beds. Nu-merous correlations for the calculation of heatand mass transfer coefficients are reported inthe literature. Since these correlations aremainlybased on experimental investigations performedunder laboratory conditions, they may be differ-ent to the situation in large-scale reactors. De-tails on models of heat and mass transfer withtheir respective range of application are given inrelated surveys, e.g., [14 – 17, 126, 130].
Fluid-to-Particle Heat and Mass Transfer.Since the particle surface area is very large, fluid-to-particle heat and mass transfer is rarely alimiting factor in the design and operation offluidized bed reactors. The heat-transfer coeffi-cients of fluidized-beds range between charac-teristic values for flow through a fixed bed andflow around a single particle [127].
Fixed bed (Rep > 80)
Nu =hgs·dp
λg= 2+1.8Re0.5
p Pr0.33
Single particle
Nu =hgs·dp
λg= 2+0.6Re0.5
p Pr0.33
where hgs is the gas–solid heat-transfer coef-ficient, dp the particle size, and λg the thermalconductivity of gas. The mass transfer coeffi-cient can be determined applying the analogy ofheat and mass transfer by replacing in the aboveformulas the Nusselt number Nu by the Sher-wood number Sh and the Prandtl number Pr bythe Schmidt number Sc. For particle Reynoldsnumbers below 100 and for fine particles, thetransfer coefficients are significantly lower thanestimated by the above formulas. If necessary,the effect of adsorption in mass transfer and ofradiation in heat transfer needs to be taken intoaccount additionally.
Heat Transfer to Submerged Surfaces.Heat-transfer coefficients between fluidized bedand submerged surfaces are one or two orders ofmagnitude larger than for gases alone [126]. Forsingle phase flow a stagnant gas layer is estab-lished at the wall causing a hindered heat trans-fer. This layer is disrupted by solids transported

Fluidized-Bed Reactors 25
at the wall. The solids adsorb heat and are mixedinto the fluidized bed [9].
An example of the time-averaged local heattransfer along the circumference of a tube im-mersed horizontally in a fluidized bed is givenin Figure 28. It exhibits lower values of the heat-transfer coefficient below the tube due to a gasgap caused by bubbles and lower values on topof the tube because of solids being at rest. Withintensified mixing this effect becomes less sig-nificant.
Figure 28. Local heat-transfer coefficient around a 35 mmdiameter tube immersed horizontally in a fluidized bed of0.37 mm alumina particles operated at a superficial gas ve-locity of 0.8 m/s and a temperature of 500 ◦C, adapted from[128]
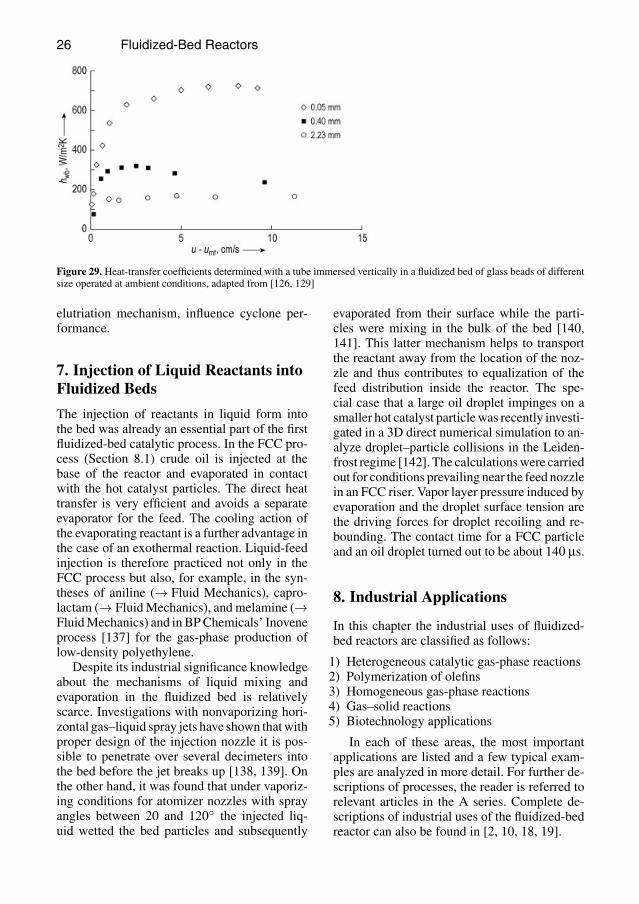
The dependence of the heat-transfer coef-ficient on the superficial gas velocity is illus-trated in Figure 29. Fluidized beds of fine parti-cles yield a larger heat-transfer coefficient thancoarse particles. According to Molerus andWirth [126], different transfer mechanisms canbe identified. In case of fine particles, solidsact as agents transporting heat between wallsand bed, whereas gas convective transport isthe mechanism dominating the heat transfer ofcoarse particles. The heat-transfer coefficient ofparticles of intermediate sizes exhibits a maxi-mum due to the superposition of these two trans-port mechanisms. Heat-transfer rates in circulat-ing fluidized beds are lower than in bubbling flu-idized beds due to reduced solids volume con-centrations and are dominated by clusters andstrands [130].
The heat-transfer coefficient increases withincreasing pressure [131] and temperature. Theeffect of radiation has to be considered for tem-peratures above 500◦C, but opaque particles canform an effective radiation shield [132].
6. Gas-Solid Separation
The fluidizing gas inevitably carries fine catalystparticles by entrainment to the reactor exit. Notonly for environmental reasons (i.e., tominimizeemissions) is it necessary to separate the solidsfrom the gas. It may also be necessary to stop themain reaction and to avoid unwanted side or con-secutive reactions or to protect followingprocesssteps or machines from particle-laden streams.In fluidized-bed technology cyclones are mostlyused for this purpose.Knowlton [133] has givena survey on the state of the art of cyclone designand application in fluidized-bed reactors.
The cyclone should not be considered as aseparate apparatus following the fluidized bedbut should be seen as an integral part of thefluidized-bed process. The reason is that, notonly in circulating fluidized beds but also inbubbling or turbulent fluidized beds, the cata-lyst particles which are recovered in the cycloneare recycled to the fluidized bed. The collec-tion efficiency of the cyclone is thus responsiblefor maintaining the particle size distribution inthe bed inventory, which in turn determines thefluidized-bed fluid mechanics and the chemicalperformance of the bed as a reactor. The inter-relation between fluidized bed and cyclone isdiscussed in Section 9.3.2.
The influence of cyclone performance on theoverall process performance is increasingly con-sidered. For example, Pulupula et al. [134] in-vestigated the role of cyclones in the regenera-tor system of a commercial FCC unit. Arnoldet al. [135] were able to trace the deteriorationof plant performance in the ALMA maleic pro-cess back to problemswith cyclone efficiency. Achange of the cyclone design improved the par-ticle size distribution of the bed inventory andconsequently bed hydrodynamics and chemicalconversion. Smit et al. [136] report on cycloneperformance in turbulent fluidized-bed Syntholreactors for Fischer–Tropsch synthesis. Carbondeposition on the catalyst particles influencesthe bed hydrodynamics, which in turn, via the
26 Fluidized-Bed Reactors
Figure 29. Heat-transfer coefficients determined with a tube immersed vertically in a fluidized bed of glass beads of differentsize operated at ambient conditions, adapted from [126, 129]
elutriation mechanism, influence cyclone per-formance.
7. Injection of Liquid Reactants intoFluidized Beds
The injection of reactants in liquid form intothe bed was already an essential part of the firstfluidized-bed catalytic process. In the FCC pro-cess (Section 8.1) crude oil is injected at thebase of the reactor and evaporated in contactwith the hot catalyst particles. The direct heattransfer is very efficient and avoids a separateevaporator for the feed. The cooling action ofthe evaporating reactant is a further advantage inthe case of an exothermal reaction. Liquid-feedinjection is therefore practiced not only in theFCC process but also, for example, in the syn-theses of aniline (→ Fluid Mechanics), capro-lactam (→ FluidMechanics), and melamine (→FluidMechanics) and inBPChemicals’ Inoveneprocess [137] for the gas-phase production oflow-density polyethylene.
Despite its industrial significance knowledgeabout the mechanisms of liquid mixing andevaporation in the fluidized bed is relativelyscarce. Investigations with nonvaporizing hori-zontal gas–liquid spray jets have shown thatwithproper design of the injection nozzle it is pos-sible to penetrate over several decimeters intothe bed before the jet breaks up [138, 139]. Onthe other hand, it was found that under vaporiz-ing conditions for atomizer nozzles with sprayangles between 20 and 120◦ the injected liq-uid wetted the bed particles and subsequently
evaporated from their surface while the parti-cles were mixing in the bulk of the bed [140,141]. This latter mechanism helps to transportthe reactant away from the location of the noz-zle and thus contributes to equalization of thefeed distribution inside the reactor. The spe-cial case that a large oil droplet impinges on asmaller hot catalyst particlewas recently investi-gated in a 3D direct numerical simulation to an-alyze droplet–particle collisions in the Leiden-frost regime [142]. The calculationswere carriedout for conditions prevailing near the feed nozzlein an FCC riser. Vapor layer pressure induced byevaporation and the droplet surface tension arethe driving forces for droplet recoiling and re-bounding. The contact time for a FCC particleand an oil droplet turned out to be about 140 µs.
8. Industrial Applications
In this chapter the industrial uses of fluidized-bed reactors are classified as follows:
1) Heterogeneous catalytic gas-phase reactions2) Polymerization of olefins3) Homogeneous gas-phase reactions4) Gas–solid reactions5) Biotechnology applications
In each of these areas, the most importantapplications are listed and a few typical exam-ples are analyzed in more detail. For further de-scriptions of processes, the reader is referred torelevant articles in the A series. Complete de-scriptions of industrial uses of the fluidized-bedreactor can also be found in [2, 10, 18, 19].

Fluidized-Bed Reactors 27
8.1. Heterogeneous Catalytic Gas-PhaseReactions
The fluidized-bed reactor offers the followingprincipal advantages over the fixed-bed reactorfor heterogeneous catalytic gas-phase reactions:
1) High temperature homogeneity, even withstrongly exothermic reactions.
2) Easy solids handling, permitting continuouswithdrawal of spent catalyst and addition offresh if the catalyst rapidly loses its activity.
3) Ability to operate in the explosion range, pro-vided the reactants are not mixed until theyare inlet to the fluidized bed. This is becausethe high heat capacity of the bed solids, to-gether with intensive solids mixing, preventsthe propagation of explosions.
Figure 30. Fluid catalytic cracking process (Kellogg-Orthoflow system; according to [143, 144])a) Reactor; b) Regenerator
Catalytic Cracking (→ Oil Refining,Chap. 3.2). The ease of solids handling was thebasic reason for the success of catalytic crackingof long-chain hydrocarbons in the fluidized bed
(Fig. 30). The cracking reaction is endothermicand involves the deposition of carbon on thecatalyst surface, which quickly renders the cat-alyst inactive. Accordingly, the catalyst must becontinuously discharged from the reactor andregenerated in an air-fluidized regenerator bed(b), where its carbon loading is lowered from1–2 to 0.4–0.8 wt%. The combustion in thisbed simultaneously furnishes the heat requiredfor the cracking reactor; the catalyst acts as aheat carrier. The temperature in the regeneratoris 570–590 ◦C and in the reactor, 480–540 ◦C[2]. In a stripper, steam is admitted to removehydrocarbons adhering to the catalyst before itis forwarded to the regenerator.
With the advent of high-activity zeolite cat-alysts in the 1960s, the bubbling fluidized bed,operated at gas velocities between 0.31 and 0.76m/s [2], was replaced by the riser cracker (Fig.31), in which the oil fed in at the bottom of theriser (c) is vaporized in contact with the hot cat-alyst and the mixture of oil vapors and crackinggas transports the catalyst up through the riser.In the reactor bed (a), solids are collected beforepassing through the stripper (b) to the regener-ator (f). By virtue of the short contact time ofthe order of a few seconds and the narrow gasresidence-time distribution, the high activity ofthe zeolite catalyst is optimally utilized and ahigher gasoline yield is achieved [2, 10].
Figure 31. Riser cracking process (UOP system), [2]a) Reactor; b) Stripper; c) Riser; d) Slide valve; e) Air grid;f) Regenerator

28 Fluidized-Bed Reactors
Synthesis of Acrylonitrile. The crucial fac-tor in the successful use of the fluidized-bed re-actor for the synthesis of acrylonitrile by theammonoxidation of propene (Sohio process)(→ Acrylonitrile) was reliable control of thisstrongly exothermic reaction:
C3H6+NH3+3/2O2 →C3H3N+3H2O ∆Hr
= −515 kJ/mol of acrylonitrile.
The reaction is carried out at a bed tempera-ture of 400–500 ◦C and gas contact time of 1–15s [145] or 5–20 s [2]. Figure 32 is a schematicof the reactor. Air is fed to the bottom of thefluidized-bedvessel. The reactants ammonia andpropene are fed in through a separate distribu-tor (b). Catalyst regeneration by carbon burnoffoccurs in the space between the air distributorand the feed-gas distributor. The heat of reac-tion is removed by bundles of vertical tubes (a)inside the bed (horizontal tubes are used in otherdesigns [146]).
Figure 32. Synthesis of acrylonitrile (Sohio process) [2]a) Cooler with internals; b) Distributor
Fischer–Tropsch Synthesis. The Fischer–Tropsch synthesis of hydrocarbons is used ona large scale for fuel production in the Republicof South Africa [149]. Synthesis gas generated
from coal in Lurgi fixed-bed gasifiers enters theSynthol reactor (Fig. 33),where it is reacted overan iron catalyst at ca. 340 ◦C. The reactor workson the principle of the circulating fluidized bed.The mean porosity in the riser is 85%, and thegas velocity varies between 3 and 12 m/s [2]. Re-action heat is removed byway of heat-exchangertube bundles placed inside the riser.
Figure 33. Fischer–Tropsch synthesis in the Synthol reactor[2, 147]a) Hopper; b) Standpipe; c) Riser; d) Cooler (coil);e) Reactor; f) Gooseneck
However, experience has shown that this re-actor is costly, relatively expensive to operateand maintain, and scale-up to the size of the re-actors in operation is probably close to themaxi-mum achievable for operation at 350 ◦C and 2.5MPa. Therefore, in the 1990s the 16 circulat-ing fluidized-bed reactors operating at Sasol’sSecunda site were replaced by eight turbulentfluidized-bed reactors each of 10.7 m diameter,which achieve a higher per-pass syngas conver-sion [150].
Different process routes have been devel-oped for the synthesis of maleic anhydride. TheMitsubishi process [152, 153] used the naphtha

Fluidized-Bed Reactors 29
cracker C4 fraction. The ALMA process uses n-butane as feedstock [154, 155]. A more recentdevelopment is the Du Pont process, which isalso based on n-butane but uses a circulating flu-idized bed as reactor (Fig. 34) [156]. It is basedon a vanadium phosphorus oxide (VPO) catalystwhich oxidizes n-butane to maleic anhydride bya redoxmechanismon its surface layers [157]. Inthe riser n-butane is selectively oxidized by theoxidized catalyst. In the fluidized-bed regenera-tor the spent catalyst is reoxidized. Since 1996 acommercial plant has beenoperating inAsturias,Spain [158].
Figure 34. The Du Pont maleic anhydride process [158].
Other Processes. Other catalytic reactionscarried out in fluidized-bed reactors are the oxi-dation of naphthalene to phthalic anhydride (→Phthalic Acid and Derivatives) [2, 10, 151];the ammoxidation of isobutane to methacryloni-trile [2]; the reaction of acetylene with aceticacid to vinyl acetate [2]; the oxychlorinationof ethylene to 1,2-dichloroethane (→ Chlorinat-ed Hydrocarbons) [2, 10, 159, 160]; the chlo-rination of methane [2]; the reaction of phe-nol with methanol to cresol and 2,6-xylenol [2,161]; the reaction of methanol to gasoline [162,
163]; the synthesis of phthalonitrile by ammoxi-dation ofo-xylene (→ PhthalicAcid andDeriva-tives) [164]; the synthesis of aniline by gas-phase hydrogenation of nitrobenzene (→ Ani-line, Chap. 3.2) [165]; and the low-pressure syn-thesis of melamine from urea (→ Melamine andGuanamines) [166].
An overviewon the various fluidized-bed cat-alytic processes has been given [167].
8.2. Polymerization of Olefins
The gas-phase polymerization of ethylene inthe fluidized bed was developed by Union Car-bide (Unipol process [168]; see Fig. 35) (→Polyolefins). The reaction gas (ethylene and itscomonomers butene or hexene) fluidizes the bedat 75–115 ◦C and 20–30 bar. Extremely fine-grained catalyst is metered into the bed. Poly-merization occurs on the catalyst surface andyields a granular product with diameter rangingfrom 0.25 to 1 mm. Ethylene conversion is com-paratively low, 2% per pass; so the reaction gasis recycled. The heat of reaction is removed bycooling the recirculating gas. The catalysts usedhave such a high activity thatmore than 105 partsby volume of polymer can be produced per unitweight of active substance in the catalyst [2].Because of the high degree of catalyst dilutionin the granular polymer, the catalyst need notbe removed from the product. In the process de-veloped by BP Chemicals, prepolymers with adiameter from 0.2 to 0.25 mm rather than cata-lyst particles are fed into the fluidized bed [169].
Mitsui Petrochemical Industries has devel-oped a process for the gas-phase fluidized-bedpolymerization of propene (→ Polyolefins); aplant using this process came on stream in 1984[170]. The Unipol–Shell process was jointly de-veloped by Union Carbide and Shell and com-missioned in 1986.
Burdett et al. [171] have given a broadoverview on this still-developing technology,which presents many challenges for the engi-neer. One of the biggest problems is the sticki-ness of the particles under the operating condi-tions of the process, which has often led to par-ticle sintering with subsequent defluidization ofthe bed. Seville et al. [172]monitored themotionof particles in a scaled polymer reactor and stud-ied the sintering kinetics in order to determine

30 Fluidized-Bed Reactors
a safe operating window. Cai and Burdett [173]developed a model of single-particle polymer-ization in the fluidized bed to simulate particlegrowth and particle-temperature evolution withthe residence time of a catalyst particle in thereactor.
Figure 35. Gas-phase polymerization of ethylene (Unipolprocess) [2]a) Compressor; b) Cooler; c) Catalyst feed hopper;d) Reactor; e) Separator
8.3. Homogeneous Gas-Phase Reactions
The decisive advantage of the fluidized bed forhomogeneous gas-phase reactions is the abilityto carry large quantities of heat into or out ofthe reactor by using direct heat exchange via thebed solids. An example is the Exxon fluid cokingprocess (Fig. 36; [2, 18, 174, 175]), which con-verts heavy residual oils to petroleum coke andgas-oil. The reactor (d) and heater (e) beds areconnected in a single solids loop. The bed mate-rial is coke generated in coking at 480–570 ◦C,which grows to spherical particles 0.1–1 mm indiameter in the reactor. The coke is dischargedcontinuously from the reactor andheated to 500–690 ◦C by partial combustion in the heater. Thehot coke stream then transports the heat neededfor the endothermic coking reaction into the re-actor. Excess coke is removed as a coarse frac-
tion in a classifier connected to the heater. Fluidcoking is used, e.g., for refining bitumen fromthe Athabasca tar sands in Canada. To make ef-ficient use of the product coke, Exxon combinedthe fluid coking process with a fluidized-bedgasification reactor [2, 175]. This Flexi-Cokingprocess was first implemented in 1976 in Japan;the daily capacity of one plant is ca. 3400 t ofvacuum residue.
Figure 36. Fluid coking process [2, 18]a) Slurry recycle; b) Stripper; c) Scrubber; d) Reactor;e) Heater; f) Quench elutriator
The bed solids also find use as heat-transferagents in the thermal cracking of naphtha, a pro-cess carried out in the Lurgi sand cracker [2, 18,176]. The solids circulating between the reactorand the heater consist of coarse sand particles(ca. 1 mm in diameter). When the coke depositproduced in cracking is burned off the particlesurface with air, the solids are heated to 800–850 ◦C and can thus deliver the heat requiredfor endothermic cracking. The temperature inthe reactor is ca. 700–750 ◦C.
Other thermal cracking processes include theBASF Wirbelfliess process [2, 18, 177], and theKunii–Kunugi process [2].
8.4. Gas–Solid Reactions
Coal Combustion. Thehigh heat capacity ofthe fluidized bed permits stable combustion atlow temperature (ca. 850 ◦C), so that the forma-tion of thermal and prompt nitrogen oxides [178]can be suppressed and total nitrogen oxide emis-sions can be reduced. If limestone is added to thebed, the calcination reaction

Fluidized-Bed Reactors 31
Figure 37. Power plant with circulating fluidized-bed furnace (Lurgi process) [180]a) Circulating fluidized-bed reactor; b) Recycling cyclone; c) Siphon; d) Fluidized-bed heat exchanger; e) Convective pass;f) Dust filter; g) Turbine; h) Stack
CaCO3 →CaO+CO2
yields CaO, which can bind in situ the SO2 pro-duced in combustion:
SO2+CaO+1/2O2 →CaSO4
During the 1980s the fluidized bedwas estab-lished in power-plant engineering. The unit sizerapidly increased from 5 MWe in 1970 to about350MWe during this time [179].Meanwhile (ca.2006) some 500 power plants are in operationworldwide. By far the majority of these plantsoperate with circulating fluidized beds. As anexample, Figure 37 shows a Lurgi design.
The staged admission of the combustion airminimizes NO production from nitrogen in thefuel in the lower part of the combustion cham-ber. The admission of secondary air completesthe combustion in the upper part of the cham-ber by oxidizing most of the CO. Some of thecirculating solids are led through the externalfluidized-bed cooler, which enhances the flexi-bility of control and permits load variation overa wide range.
More recent developments aim at even largercapacitieswith a further enlargement of the com-bustion chamber and making use of supercrit-ical steam conditions and once-through boilerdesign. One problem associated with the sizeenlargement is the distribution of both the coal
and the secondary air from the sidewalls overthe cross section of the combustion chamber.Since the lateral mixing of gas and solids in acirculating fluidized bed is quite slow, sufficientnumbers of feed ports for the coal and air injec-tion nozzles have to be arrangedon the sidewalls.The “pants-leg” design shown inFigure 38 is onepossibility to provide sufficient lateral mixing atthe bottom of the combustion chamber. A first450 MWe unit is being built in Lagisza/Poland[181] and 600 MWe CFB combustors are in thedesign phase [182].
If a fluidized-bed furnace running under apressure of 12–16 bar is linked to a gas turbine,the efficiency of the power plant can bemarkedlyenhanced [183]. At the same time, however,this concept imposes severe requirements on gascleaning [184]. Pressurized fluidized-bed com-bustion has been tested in several large experi-mental plants (e.g., [186]). In the meantime sev-eral plants of the 80 MW range are in commer-cial operation. Recently, a pressurized fluidized-bed combustor with an electrical power of 360MW was erected by ABB Carbon [185] (Fig.39); these units employ bubbling fluidized beds[187, 188]. Pressurized fluidized-bed boilersemploying circulating fluidized beds are still un-der development (e.g., [189]).
For further details on fluidized-bed combus-tion systems see the proceedings of the Fluidized

32 Fluidized-Bed Reactors
Figure 38. Furnace cross section of a large CFB combustor (after [179])
Figure 39. Power plant with pressurized fluidized-bed combustor (ABB design) [187]a) Pressurized fluidized-bed boiler; b) Cyclone; c) Gas turbine; d) Economizer; e) Ash removal; f) Fuel feed; g) Feed-watertank; h) Steam turbine; i) Condenser; j) Bed material hopper
Bed Combustion Conferences [25] and a mono-graph [190].
Waste Incineration. The incineration ofmunicipal sewage sludge in fluidized-bed fur-
naces is now practiced in many facilities [191].The total amount of sludge thermally treatedin Germany in 1996 was 513 000 t (dry basis)[192]. Figure 40 is a diagram of an incinerator.Moist, centrifuged sludge is fed from above to

Fluidized-Bed Reactors 33
the fluidized bed by means of piston pumps.The fluidizing air is preheated in an oil-firedmuffle before reaching the furnace. Fuel oil,used as a supplemental fuel, is metered directlyinto the bed. Developments in sludge incinera-tion have achieved energy autarky by recoveringwaste heat and utilizing it to predry the sludgeso that self-sustaining combustion is possible[194 – 196]. Later, the more stringent emissionlimits set forth in the 17th Bundesimmission-schutzverordnung (BImSchV, regulation in theFederal Republic of Germany concerning thelimitation of immissions)maynecessitate stagedcombustion (as in power generation), particu-larly to control NOx emissions [197, 198].
Figure 40. Fluidized-bed furnace for municipal sludgeincineration (Uhde system) [193]
For the incineration ofmunicipalwaste, a fur-nace with a “rotating” fluidized bed has beendeveloped. The inclined distribution grid in thisdesign generates two rollerlike flows of circu-lating bed solids, leading to rapid and efficientmixing of the waste in the bed [199].
Coal Gasification. A number of fluidized-bed processes have been developed for gasifyingcoal (→ Gas Production; e.g., [2]). Interest inthese processes for cogeneration power plantshas recently become more intense. In the co-generation system shown in Figure 41, high-pressure gasification is combined with com-
bustion in a circulating fluidized bed; efficien-cies of more than 40% are expected, depend-ing on the available gas turbine technology[180]. The Rheinische Braunkohlenwerke com-pany has developed a high-temperature Winkler(HTW) process based on Winkler gasification(Fig. 42) [200]. The pressure (ca. 10 bar) andtemperature (ca. 1100 ◦C) are higher than in theWinkler process; coal is gasified with oxygenand steam. Recycling of solids from the cycloneto the fluidized bed results in a much higher car-bon conversion than in the Winkler process.
Gasification of Solid Waste. In comparisonwith incineration, the gasification of solid wasteoffers the advantage of a smaller volume of off-gas, so the cleaning system can bemade smaller.In the Japanese Pyrox process, heat requiredby the gasification reactor is supplied by sandheated in a fluidized-bed furnace, so that a high-Btu-gas can be generated [2].
A cement kiln plant at Ruedersdorf in Ger-many is operated with a biomass gasification re-actor. This circulating fluidized-bed reactor de-signed by Lurgi supplies fuel gas for the calcin-ers [201].
Calcination. The calcination of aluminumhydroxide in the Vereinigte Aluminiumwerke(VAW)/Lurgi circulating fluidized-bed processfeatures an overall thermal efficiency of morethan 70%, which is achieved through down-stream heat recovery from the calcined aluminaand the off-gas [18, 202 – 204]. The circulatingfluidized bed proper (c) is coupled to two venturifluidized beds (a), in which the moist hydroxideis first dried and heated by direct contact with theoff-gas before it is forwarded to the calcinationfurnace (see Fig. 43). The five-stage fluidized-bed cooler (d) downstream of the furnace servesto preheat the combustion air. A furnace 3.8 min diameter and 20 m tall, with a fluidization ve-locity of 3 m/s and mean particle diameter of0.04–0.05 mm, produces more than 500 t/d ofAl2O3 [18].
Other applications include the calcinationof limestone (in multistage fluidized-bed fur-naces), limemuds, and crude phosphates [2, 18].
Roasting Processes. Fluidized-bed roastingfollows the general reaction equation

34 Fluidized-Bed Reactors
Figure 41. Concept for cogeneration power plant based on high-pressure gasification in circulating fluidized bed [185]a) High-pressure CFB gasification; b) Gas cleaning; c) CFB combustion; d) Waste-heat boiler; e) Gas turbine; f) Steam turbine
Figure 42. Flow sheet of HTW demonstration plant [200]a) Coal lock hopper system; b) Gasifier; c) Cyclone; d) Ash lock hopper system; e) Raw gas cooler; f) Wet dust separator;g) Carbon monoxide conversion
Metal sulfide + Atmospheric oxygen
→ Metal oxide + Sulfur dioxide
This is one of the earliest industrial uses offluidization.Many such processes are used in theroasting of pyrite, zinc blende, and other sulfideores. Bubbling fluidized beds with gas veloci-ties between 0.5 and 2.3 m/s [2] are employed;
heat generated by the exothermic roasting reac-tion is removed by tube banks immersed in thebed, via a solid heat-transfer agent, or by simplewater injection. Roasting furnaces are availablein very large sizes (bed diameters up to 11 m)with capacities of several hundred tonnes of oreper day [2, 18].

Fluidized-Bed Reactors 35
Figure 43. Fluidized-bed calcination of aluminum hydroxide (VAW/Lurgi system) [18]a) Venturi fluidized bed; b) Cyclones; c) Fluidized-bed furnace; d) Fluidized-bed cooler; e) Recycle cylone; f) Electrostaticprecipitator
Figure 44. Flow sheet of Lurgi Circored process [206]a) Preheater; b) Cyclone; c) First stage reactor; d) Second stage reactor; e) Briquetting unit; f) Gas cleaning unit

36 Fluidized-Bed Reactors
Iron Ore Direct Reduction. (→ Iron). Forthe direct reduction of iron ore, Lurgi has de-veloped two processes [205]. Hydrogen is ap-plied as reductant in the Circored process, coalgas is used in the Circofer process. A plant forthe Circored process has been built in Trinidadwith a capacity of 500 000 t iron briquette peryear [206]. Applying two stages, a circulatingfluidized-bed reactor reduces the preheated ironore (800 ◦C) at 630–650 ◦C to a degree ofmetal-lization of 65–85%and a bubbling fluidized-bedreactor proceeds at temperatures up to 680 ◦Cto achieve a degree of metallization of 93–95%(see Fig. 44). The metallized product is thentransported to the hot briquetting unit. At a pres-sure of 4 bar, the process gas is recycled to a gascleaning unit and made up with hydrogen.
Other Processes. Fluidized-bed processesfor the production of high-purity silicon andactivated carbon and the chlorination and flu-orination of metal oxides are described in [2].A detailed description of TiO2 synthesis in afluidized-bed reactor and a survey of the useof fluidized-bed processes in the production ofnuclear fuels are given in [10].
8.5. Applications in Biotechnology
A comprehensive survey of the use of fluidized-bed reactors in biotechnology is given in [10,207].
Liquid–solid and liquid–gas–solid systemsare used in aerobic and anaerobic wastewatertreatment (nitrification and denitrification); themicroorganisms are grownas a biofilmonpartic-ulate supports to prevent their entrainment fromthe reactor with the fluidizing medium. The ad-vantages of the fluidized-bed reactor over thefixed-bed reactor include higher capacity perunit volume and less susceptibility to plugging[208]. A study showing the potential of liquid–solid circulating fluidized beds in biotechnologi-cal processes such as fermentation has been pub-lished recently [209].
Full-scale fluidized-bed biogas productionreactors have come on stream since 1984 [210,211]. The process consists of two stages, acidi-fication andmethanation. Sand particles 0.1–0.3
mm in diameter serve as support for themicroor-ganisms; at fluidization velocities of 8–20 m/h,the biofilm grows to a thickness of 0.06–0.2 mmon these particles. The reactors are large deviceswith diameters of 4.6 m and bed heights of 21m.
Figure 45. Solid-state fermentation of Aspergillus sojae inthe fluidized bed (adapted from [216])a) Separator; b) Electrode; c) Agitator; d) Distributor;e) Ejector
Gas–Solid Systems. Gas–solid fluidized-bed fermenters have been investigated on a pilotscale for the growth of Saccharomyces cere-visiae [212], the production of ethanol with S.cerevisiae [213, 214], and the enrichment of glu-tathione in yeast by S. cerevisiae [214, 215]. Inthese applications, the substrate is metered intothe bed in liquid form. A process used in Japanfor the culture of Aspergillus sojae on wheatgroats employs a solid substrate [216, 217]. Thelatter process is in service on a plant scale (bedmass 500 kg, bed diameter 1.5 m). The reactor(Fig. 45) contains an agitator (c) just above thedistributor (d), as well as a rotating separator (a)in the top of the vessel. Water is sprayed onto

Fluidized-Bed Reactors 37
the bed from above to maintain the proper mois-ture level; electrodes (b) dipping into the bedmeasure this parameter. The moisture contentof the solids is generally a critical parameterfor the fluidized-bed fermenter; the bioreactionsextinguish if it becomes too low, whereas theparticles agglomerate and fluidization is dis-rupted if it becomes too high. Sterilized air isused for fluidization. Seed spores of the mi-croorganisms are fed into the bed via the ejector(e). This system achieves a considerable gain incell yield and an enrichment of certain enzymesby a factor of 5–15 over conventional fixed-bedcultures. The generated biomass forms the basisfor soy sauce production.
9. Modeling of Fluidized-BedReactors
9.1. Modeling of Liquid–SolidFluidized-Bed Reactors
An expansion formula of the Richardson–Zakitype, Equation (7), describes the hydrodynamicsof liquid–solid fluidized beds fairly well [218].The difficulty in modeling this kind of reactorfor bioreactions thus lies not so much in deter-mining the flow and mixing conditions in thefluid as in describing the diffusion processes inthe biofilm and the kinetics of the biological re-actions [219]. In view of the small number ofexperimental studies reported thus far, no finaljudgment can be made on the suitability of var-ious models [208].
9.2. Modeling of Gas–SolidFluidized-Bed Reactors
Exhaustive literature surveys can be found in [2,9, 10, 220]. [221].Manymodels exist in the liter-ature, which are classified in the cited referencesunder various schemes. The available informa-tion can be summed up as follows: No generallyaccepted model of the fluidized-bed reactor ex-ists; instead, many models have been proposedon the basis of more-or-less extensive experi-mental findings for various applications.
Any fluidized-bed reactor model can be bro-ken down into separate components that de-scribe, with varying degrees of accuracy, the
hydrodynamics (depending on solid properties,operating conditions, and geometry), gas–solidcontact, and reaction kinetics. The essentialpoint is that the reactor geometry effect, which isimportant for scale-up (Chap. 10), manifests it-self in the flow conditions and must therefore beincluded in the hydrodynamic part of the model.
Before a reactor model found in the litera-ture can be applied to a given problem, the de-signer must determine whether numerical val-ues are available for all model parameters, thatis, whether the model is appropriate for designcalculations or is a “learning model” [222] inwhich the numerical values of important param-eters can be determined only after the model isadapted to actual test results.
Reaction kinetics may be determined in afixed-bed reactor, provided measurements areperformed under conditions comparable to thosethat prevail in the fluidized-bed reactor (e.g., thesame solids composition and particle-size distri-bution, the same activity state in the case of cata-lysts) [223].However, the kinetic parameters canalso be determined directly by measurements ina bench-scale fluidized-bed apparatus [224].
9.2.1. Bubbling Fluidized-Bed Reactors
By far themajority of fluidized-bed reactormod-els described in the literature deal with reactionsin bubbling fluidized beds [2, 9, 10, 225, 226].For a specific application, modeling depends onthe bubble flow regime. For slow-bubble systems(Fig. 7, left), the short-circuit flowofgas throughthe bubblesmust be taken into account [227]. Forfast-bubble systems (Fig. 7, right), the specieshave to be balanced separately in the bubble andsuspension phases.
If models from the literature are employed, itshould be taken into account that those devisedin the past, when adequate computing hardwarewas not available, often sought to obtain analyt-ical expressions for the degree of conversion ofa single reaction (usually taken as first-order).The simplifying assumption of a single “effec-tive” bubble size for the entire fluidized bed wastherefore made [2], or the mass-transfer areabetween the bubble and suspension phases wastaken as uniformly distributed over the heightof the bed (HTU or NTU concept, where HTU

38 Fluidized-Bed Reactors
denotes height of transfer unit and NTU denotesnumber of transfer units [228]. Today, in view ofthe computing power available at the PC level,the recommendedprocedure is to start from localmass-transfer relations, write balance equationsfor the differential volume element of the reac-tor, and then numerically integrate these equa-tions.
Figure 46 presents a model used byWertherfor a constant-volume reaction [224, 229]. Herethe simplifying assumption is that flow throughthe suspension phase is at the minimum flu-idization velocity umf . For a heterogeneous cat-alytic gas-phase reaction, the material balancesfor species i in the unsteady-state cases are asfollows:
Bubble phase
εbδCbi
δt= − [u−umf (1−εb)] · δCbi
δh
−kG,ia (Cbi−Cdi)(45)
Suspension phase
(1−εb) [εmf+(1−εmf) εi]δCdi
δt=
−umf (1−εb) · δCdiδh
+kG,i·a (Cbi−Cdi)
+ (1−εb) · (1−εmf) �sM∑
j=1νi,j rj
(46)
In Equations (45) and (46) the following simpli-fying assumptions have been made:
1) Plug flow through the suspension phase at aninterstitial velocity (umf /εmf )
2) Bubble phase in plug flow, bubbles are solidsfree
3) Reaction in suspension phase only4) Constant-volume reaction (see [224] for han-
dling a change in number of moles)5) Sorption effects neglected (see [229] for han-
dling sorption)
Here εi is the porosity of the catalyst parti-cles; a is the local mass-transfer area per unit offluidized-bed volume, which can be calculatedas
a =6εbdv
(47)
for spherical bubbles; rj is the rate of partial re-action j per unit mass of catalyst; and νij is thestoichiometric number of species i in reaction j.The relation
kG,i =umf
3+
√4Diεmfub
πdv(48)
proposed by Sit andGrace [230] has proved use-ful for describing the mass-transfer coefficientkGi associatedwith component i inmass transferbetween the bubble and suspension phases; Diis the molecular diffusion coefficient of speciesi.
The freeboard space above the bubbling flu-idized bed must be considered in the reactormodel if the entrainment rate is high and thereactions in the freeboard are not quenched, forexample, by cooling.
Most fluidized-bed models include concen-tration profiles only for the vertical direction.This one-dimensional modeling is acceptablewhen the reactants are admitted uniformly overthe bed cross section. If, however, reactants aremetered into the bed at individual feed points,three-dimensional modeling may become nec-essary. Such models have been devised for thecombustion of coal in bubbling fluidized beds[232 – 234].
As a rule, the modeling of solids behavior inbubbling fluidized-bed reactors is based on thatin stirred tanks. Fluidized-bed combustion is oneof the few exceptions; here the model must takeaccount of the propagation of coal from the feedpoint if the furnace emission behavior is to bedescribed correctly [232, 234].
Temperature homogeneity is a virtually fun-damental property of the fluidized-bed reactor.Even so, one exception is industrially important:in high-pressure fluidized-bed furnaces, the highenergy density can cause local hot spots near thefuel injection points [235]. Reactor models thattake care of this have been described, e.g., in[236].
9.2.2. Circulating Fluidized-Bed Reactors
In the early days of circulating fluidized-bed re-actor modeling, negligible axial dispersion andlaterally uniform flow structure were believed tocharacterize these systems. Thus, simple plug-flowmodelswere used [237]. This approachwasfound to oversimplify the behavior of circulat-ing fluidized-bed reactors, because a significantamount of axial dispersion was observed. As aresult, the plug-flow model has often been mod-ified by adding a dispersion term to the balanceequations. Axial dispersion coefficients have

Fluidized-Bed Reactors 39
Figure 46. Two-phase model of the fluidized-bed reactor
been determined by many authors who mea-sured the residence time distribution of tracergases [238, 239]. Typical values of Peclet num-bers they found are on the order of 10.
By means of a model reaction it has beenproved that in many cases circulating fluidized-bed reactors cannot be characterized by solelyconsidering mixing phenomena [240]. Instead,the presence ofmass-transfer limitations and by-passing was found to have a significant influ-ence. In analogy to low-velocity fluidized bedsa detailed description of the local flow structurewithin the reaction volume must serve as a basisfor appropriate reactor modeling.
The highly nonuniform flow structure of cir-culating fluidized beds described in 2.9.2 hasled to reactor models which separately deal withdifferent axial zones. The bottom zone–if it ex-ists under the given operating conditions–canbe described by models whose basic approacheswere originally developed for modeling of bub-bling fluidized beds [241]. Modeling of the up-per section of the circulating fluidized bed isin most cases based on a proper description ofthe heterogeneous core–annulus flow structure[242 – 244]. These state-of-the-art models areone-dimensional and define two phases or zoneswhich are present at every axial location:
1) A dense phase or annulus zone: high solidsconcentration, gas stagnant or moving down-wards
2) A dilute phase or core zone: low solids con-centration, gas flowing quickly upward.
Similar to the situation in bubbling fluidizedbeds, the two phases exchange gas with each
other and are modeled by separate equationswhich are obtained from mass balances for eachcomponent in each phase.
Today’s models still suffer from the prob-lem that not all fluid-mechanical variables canbe predicted on the basis of the operating con-ditions. Instead, reasonable estimations or mea-surements in cold-flowmodels are used to obtainnumerical values for many variables.
A common feature of all models for the upperpart of circulating fluidized beds is the descrip-tion of the mass exchange between dense phaseand dilute phase. In analogy to low-velocityfluidized beds the product of the local spe-cific mass transfer area a and the mass-trans-fer coefficient k may be used for this purpose.Many different methods for determination ofvalues for these important variables have beenreported, such as tracer-gas backmixing experi-ments [241], non-steady-state tracer-gas experi-ments [245], model reactions [244] and theoret-ical calculations [243].
Similar to the bubbling fluidized-bed reactor,the solids behavior of the circulating fluidized-bed reactor can usually be described as com-pletely mixed. This does not hold for riser reac-tors with very high gas velocities, such as thoseused in FCC risers (u > 10 ms−1). Here, bettermodeling results will be obtained by assumingdispersed plug flow of solids [239].
Like for bubbling fluidized beds, it can beassumed that circulating fluidized beds exhibita high degree of temperature homogeneity evenin the case of highly exothermic reactions. How-ever, in the case of very large circulating flu-idized beds for coal combustion, significant hor-

40 Fluidized-Bed Reactors
Figure 47. The multiscale approach for CFD modeling of fluidized-bed reactors [254].
izontal and vertical temperature profiles havebeen observed inside the combustion chambers[246].
Despite the many uncertainties, circulatingfluidized bed reactors have been modeled suc-cessfully. For example, three-dimensional gasand solids concentration profileswere calculatedin circulating fluidized-bed boilers with local in-jection of reactants [247] and coal feeding viadiscrete feeding points [248].
9.3. New Developments in ModelingFluidized-Bed Reactors
9.3.1. Computational Fluid Dynamics
The models described above follow the “classi-cal” chemical engineering approach which re-places the complex particle–fluid interaction inthe fluidized bed by idealized configurations(plug flow, stirred tank, either valid overall orin regions) with mixing and mass-transfer coef-ficients describing the transport of matter. How-ever, more recently, there has been a strong ten-
dency to model the fluid mechanics of fluidized-bed reactors from first principles. The problemof computational fluid dynamics (CFD) model-ing in this area is that the particle–particle andparticle–fluid interaction must be considered onthe particle scale, while the reactor performancemust be described on a much larger scale, typi-cally on the order of several meters. This leadsto computational difficulties and problems withavailable computing capacities. At present (ca.2006) there is no generally accepted CFDmodelof the fluidized-bed reactor available, but rapidprogress can be seen in this area [249 – 253].A promising approach appears to be multiscalemodeling strategy [254].
The idea essentially is that fundamental mod-els which take into account the relevant detailsof fluid–particle (lattice Boltzmann model) andparticle–particle (discrete-particle model) inter-actions are used to develop closure laws to feedcontinuum models which can then be used tosimulate the flow structures on a larger scale.Figure 47 illustrates this approach, which finallyleads to the discrete-bubble model and shouldbe applicable to the large industrial scale of the

Fluidized-Bed Reactors 41
Figure 48. Fluidized-bed reactor model system [256].
Figure 49. Reactor behavior as a function of operating time [256].
bubbling fluidized-bed reactor. The multiscalemethodology [255] still requires developmentwork but provides a good chance to arrive atmore realistic fluidized-bed reactor models inthe not too far future.
9.3.2. Modeling of Fluidized-Bed Systems
Another line of development is the modeling offluidized-bed reactor systems. Whereas previ-ously the isolated fluidized bed was modeled,

42 Fluidized-Bed Reactors
the focus now is on the coupling between thefluidized bed and the cyclone for catalyst recov-ery and recycle [256] or even on the couplingbetween two fluidized-bed reactors [257], e.g.,reactor–regenerator systems as are used in theFCC and maleic anhydride processes.
Figure 50. Influence of the Sauter diameter on the chemicalconversion of a simple first-order reaction [256].
As an example, Figure 48 shows a fluidized-bed coupled with a cyclone and its translationinto the model system. Attrition leads to a lossof material from the system, which requires theaddition of fresh catalyst after some time (Fig.49). A population balance model which con-siders the changes in the catalyst particle sizeintervals allows the change in the catalyst in-ventory with time to be followed. We see thatit takes several weeks for the system to reacha quasisteady state. As a consequence of attri-tion and incomplete separation in the cyclone,the mean particle diameter in the bed increaseswith time, and this leads to larger bubbles anda reduced area of mass transfer between bub-bles and the surrounding suspension in the bed.As a further consequence the conversion rate ofa simple first-order reaction falls off with time.Finally, Figure 50 shows that improvements inthe efficiency of the solids-recovery system areable to increase the conversion rate again, whichis in agreement with large-scale industrial expe-rience [258, 259].
10. Scale-up
Typical diameters of bench-scale fluidized-bedreactors are roughly 30–60 mm, and of pilot-scale units 450–600 mm, which should allow a
reliable scale-up [9]. Full-scale fluidized-bed re-actors used in the chemical industry have di-ameters up to ca. 10 m. Circulating fluidizedbed combustors are even bigger with bed cross-sectional areas reaching200 m2 [261].As equip-ment size increases, characteristic changes takeplace in the gas–solid flow that can decisivelyaffect reactor performance. Such changes resulteither directly from the geometry or indirectlyfrom design changes made as the unit is en-larged. In particular, experience has shown thatthe following factors affect the performance ofbubbling fluidized beds during scale-up [262]:
Bed Diameter. According to Equation (22),the mean upward bubble velocity increases asthe bed diameter dt increases. As a result, thebubbles have a shorter residence time in the bed;hence the exchange area between the bubble andsuspension phases is smaller, so conversion is re-duced [263]. In case of circulating fluidized-bedcombustors, measurements have shown that thedownwards velocity of solids in the wall zoneincreases drastically with increasing size of thecombustor [260].
Grid Design. In the laboratory, porous platesare the preferred type of gas distributor becauseof the ease of working with them. Gas distribu-tion becomes worse when these are replaced byindustrial distributor designs; thus the exchangearea between the bubble and suspension phasesis reduced, again with consequently lower con-version [43].
Internals. Whereas the laboratory fluidizedbed is generally operatedwith no internals, plantequipment often must contain bundles of heat-exchanger tubes. Screens, baffles, or similar in-ternals are frequently used to redisperse the bub-ble gas in industrial reactors. The mass-transferarea is thus increased relative to the fluidizedbed without internals; the extra area can be uti-lized to partially offset the conversion-reducingeffects of bed diameter and gas distributor [263].
Catalyst Particle-Size Distribution. Bub-ble growth is influenced by the proportion offines in the particle-size distribution of the bed(usually measured as the weight fraction <0.044 mm) or by the mean grain size dp (via

Fluidized-Bed Reactors 43
umf , Eq. 18). If the content of fines increases,bubbles collapse sooner and the equilibriumbubble size becomes smaller, with a resultantgreater bubble–suspension mass-transfer area.This effect generally is fully developed only inthe plant-scale reactor, where bubbles can growwithout the hindrance of vessel walls. Thus, inprinciple, the performance of catalytic fluidized-bed reactors can be controlled by modifying thecatalyst particle-size distribution [112, 264].Therecommended content by weight of fines (<0.044 mm) for “good fluidization” is 30–40%[265], but maintaining this high a fines contentin the system over a long span of time requiresa very efficient solids recovery system.
Lateral Mixing of Reactants. On a labora-tory scale, reactants experience compulsory uni-form distribution over the bed cross section. Inplant equipment, on the other hand, reactantsoften arrive in the reactor via individual feedpoints. The resulting uneven distribution of re-actants can have a marked effect on reactor per-formance, which has been shown for the effectof coal feeding on the emission properties offluidized-bed furnaces [248].
Secondary Reactions in the Freeboard. Ina bench-scale apparatus, the fluidized gas israpidly cooled by the vessel wall in the free-board space after leaving the bed, so secondaryreactions in the freeboard are often negligible.Such is not the case in the plant-scale reactor.The action ofwall cooling is not significant here,and the entrainment rate is high because of thehigher fluidization velocities common in full-scale equipment. Both effects—lack of coolingand high solids concentration in the freeboard—may lead to marked secondary reactions in thefreeboard of industrial fluidized-bed reactors. Inthe case of a system of consecutive reactionswhere the desired product is formed as an inter-mediate, the freeboard reactions will generallylower the selectivity. The effect of freeboard re-actions has been demonstrated for the exampleof NO and CO emissions from a fluidized-bedfurnace [232].
Catalyst Attrition. Catalyst attrition is min-imal in laboratory apparatus, because of the useof porous plates as gas distributors, as well asthe low gas velocities and bed depths. Attrition
is necessarily greater in industrial reactors. Toreduce this risk in scale-up, the attrition testsdescribed in Section 2.11 should be carried outand the results converted to the full-scale con-ditions with the aid of Equations (34), (35) and(36).
Other Factors. In addition to the factors justlisted,many other effects become apparentwhena fluidized-bed reactor is scaled up that aredifficult to calculate. Examples are the riskof nonuniform gas distribution over very largecross sections in shallow fluidized beds; the for-mation of deposits in the bed; the fouling of heat-exchange surfaces; and catalyst aging and poi-soning. On the whole, accordingly, the scale-upof fluidized-bed reactors is a complex process,commonly requiring a large amount of pilot-scale experimentation.Current knowledge aboutthe fluid mechanics in the fluidized bed, how-ever, enables simulation calculations of many ofthe scale-up effects, so the amount of testing dur-ing process development may be decreased andthe risk can be at least limited.
11. References
1. I. G. Farben, DE 437 970, 1922 (F. Winkler).2. D. Kunii, O. Levenspiel: Fluidization
Engineering, Butterworth–Heinemann, Boston1991.
3. D. Geldart (ed.): Gas Fluidization Technology,John Wiley & Sons, Chichester 1986.
4. J. F. Davidson, R. Clift, D. Harrison:Fluidization, Academic Press, London 1985.
5. W.-C. Yang (ed.): Fluidization, SolidsHandling and Processing, Noyes Publications,Westwood 1999.
6. D. Gidaspow: Multiphase Flow andFluidization, Academic Press, London 1994.
7. J. R. Grace, A. A. Avidan, T. M. Knowlton(eds.): Circulating Fluidized Beds, Chapman& Hall, London 1997.
8. W. -C Yang (eds.): Handbook of Fluidizationand Fluid-Particle Systems, Marcel Dekker,New York 2003.
9. M. Pell: Gas Fluidization, Elsevier,Amsterdam 1990.
10. J. G. Yates: Fundamentals of Fluidized-BedChemical Processes, Butterworths, London1983.

44 Fluidized-Bed Reactors
11. K.-E. Wirth: Zirkulierende Wirbelschichten –Stromungsmechanische Grundlagen,Anwendungen in der Feuerungstechnik,Springer Verlag, Heidelberg 1990.
12. P. Basu: Combustion and Gasification inFluidized Bed, Taylor & Francis, Boca Raton2006.
13. K. B. Mathur, N. Epstein: Spouted Beds,Academic Press, New York 1974.
14. K.-E. Wirth in E.-U. Schlunder (ed.): VDIWarmeatlas, 8th ed., VDI Verlag, Dusseldorf1997, pp. Lf 1–9.
15. K.-E. Wirth in E.-U. Schlunder (ed.): VDIHeat Atlas, 1st English ed., VDI Verlag,Dusseldorf 1993, pp. Lf 1–9.
16. H. Martin in E.-U. Schlunder (ed.): VDIWarmeatlas, 8th ed., VDI Verlag, Dusseldorf1997, pp. Mf 1–9.
17. H. Martin in E.-U. Schlunder (ed.): VDI HeatAtlas, 1st English ed., VDI Verlag, Dusseldorf1993, pp. Mf 1–9.
18. Ullmann, 4th ed. 3, 433–460.19. Ullmann, 4th ed. 3, 480–493.20. U. Arena, R. Chirone, M. Micchio, P. Salatino
(eds.): Fluidization XI, EngineeringConferences International, Brooklyn 2004.
21. M. Kwauk, J. Li, W.-C. Yang (eds.):Fluidization X, Engineering Foundation, NewYork 2001.
22. L.-S. Fan, T. M. Knowlton (eds.): FluidizationIX, Engineering Foundation, New York 1998.
23. K. Cen (eds.): Circulating Fluidized BedTechnology VIII, International AcademicPublishers, Beijing 2005.
24. J. R Grace, J.-X. Zhu H. de Lasa (eds.):Circulating Fluidized Bed Technology VII,Can. Soc. Chem. Engng., Ottawa 2002.
25. J. Werther (ed.): Circulating Fluidized BedTechnology VI, DECHEMA, Frankfurt 1999.
26. L. Jia (ed.): Proc. 18th Int. Conf. FluidizedBed Combustion, ASME, New York 2005.CD-ROM, ISBN 0-7918-3755-6.
27. S. Pisupati (ed.): Proc. 17th Int. Conf.Fluidized Bed Combustion, ASME, New York2003. CD-ROM, ISBN 0-7918-3755-6.
28. F. Preto (ed.): Proc. 16th Int. Conf. FluidizedBed Combustion., ASME, New York 2001,CD-ROM, ISBN 07918-3523-5.
29. S. Ergun, Chem. Eng. Prog. 48 (1952) 89–97.30. J. Werther, Chem.-Ing.-Tech. 54 (1982) no. 10,
876–883.31. C. Y. Wen, Y. H. Yu, AIChE J. 12 (1966)
610–612.32. C. Vogt, R. Schreiber, G. Brunner, J. Werther,
Powder Technol. 158 (2005) 102–114.
33. J. F. Richardson, W. N. Zaki, Trans. Inst.Chem. Eng. 32 (1954) 35–54.
34. D. Geldart, Powder Technol. 7 (1973)285–292.
35. O. Molerus, Powder Technol. 33 (1982) 81–87.36. L. Reh: “Das Wirbeln von kornigem Gut in
schlanken Diffusoren als Grenzzustandzwischen Wirbelschicht und pneumatischerForderung”, Dissertation, TH Karlsruhe 1961.
37. L. Reh, Chem.-Ing.-Tech. 46 (1974) 180–189.38. L. Reh, Chem.-Ing.-Tech. 49 (1977) 786–794.39. VGB-Merkblatt M218H, Gasverteilerboden
von Wirbelschichtsystemen,VGB-Kraftwerkstechnik GmbH, Essen (1994)
40. J. C. Agarwal, W. L. Davis, D. T. King, Chem.Eng. Prog. 58 (1962) 85–91.
41. F. J. Zuiderweg, Proc. Int. Symp. Fluid. 1967,739–750.
42. F. Zenz, D. Othmer: Fluidization andFluid/Particle Systems, Reinhold Publ. Corp.,New York 1960.
43. E.-U. Hartge, J. Werther in L.-S. Fan, T. M.Knowlton (eds.): Fluidization IX, EngineeringFoundation, New York 1998, pp. 213–220.
44. S. B. Reddy Karri, J. Werther in W.-C. Yang(ed.): Handbook of Fluidization andFluid-Particle Systems, Marcel Dekker, NewYork 2003, pp. 155–170.
45. J. M. D. Merry, AIChE J. 21 (1975) 507–510.46. J. M. D. Merry, Trans. Inst. Chem. Eng. 49
(1971) 189–195.47. J. F. Davidson, D. Harrison: Fluidised
Particles, Cambridge University Press,Cambridge 1963.
48. R. Clift, J. R. Grace, Chem. Eng. Prog. Symp.Ser. 66 (1970) no. 105, 14–27.
49. R. Clift, J. R. Grace, AIChE Symp. Ser. 67(1971) no. 116, 23–33.
50. K. Hilligardt, J. Werther, Chem. Eng. Technol.10 (1987) 272–280.
51. R. Toei, R. Matsuno, M. Oichi, K. Yamamoto,J. Chem. Eng. Jpn. 7 (1974) no. 6, 447–450.
52. J. Werther, D. Bellgardt, H. Groenewald, K.Hilligardt, Proc. Int. Conf. Fluid. Bed.Combust. 9th (1987) 515–522.
53. K. Hilligardt, J. Werther, Chem.-Ing.-Tech. 59(1987) no. 7, 596–597, MS 1613/87.
54. J. Werther in D. Kunii, R. Toei (eds.):Fluidization, Engineering Foundation, NewYork 1983, pp. 93–102.
55. F. A. Zenz, Hydrocarbon Process. 53 (1974)no. 4, 119–124.
56. S. E. George, J. R. Grace, AIChE Symp. Ser. 74(1978) no. 176, pp. 67–74.

Fluidized-Bed Reactors 45
57. C. Y. Wen, L. H. Chen, AIChE J. 28 (1982)117–128.
58. D. Kunii, O. Levenspiel, Powder Technol. 61(1990) 193–206.
59. K. Smolders, J. Baeyens, Powder Technol. 92(1997) 35–46.
60. J. Werther, E.-U. Hartge, in W. C. Yang (ed.):Handbook of Fluidization and Fluid-ParticleSystems, Marcel Dekker, New York 2003, pp.113–128.
61. J. Yerushalmi, N. T. Cankurt, D. Geldart, B.Liss, AIChE Symp. Ser. 74 (1978) no. 176,1–12.
62. Y. Li, M. Kwauk in J. R. Grace, J. Matsen(eds.): Fluidization, Plenum Press, New York1980, pp. 537–544.
63. J. M. Matsen, Powder Technol. 32 (1982)21–33.
64. K.-E. Wirth, Chem. Eng. Technol. 11 (1988)no. 1, 11–17.
65. K.-E. Wirth, Chem. Eng. Technol. 14 (1991)29–38.
66. M. Rhodes, D. Geldart in P. Basu (ed.):Circulating Fluidized Bed Technology,Pergamon Press, Toronto 1986, pp. 193–200.
67. P. Schlichthaerle, J. Werther, Chem. Eng. Sci.54 (1999) 5485–5494.
68. T. Grassler, K.-E. Wirth in J. Werther (ed.):Circulating Fluidized Bed Technology VI,DECHEMA, Frankfurt 1999, pp. 65–70.
69. M. J. Rhodes, M. Sollaart, X. S. Wang in L.-S.Fan, T. M. Knowlton (eds.): Fluidization IX,Engineering Foundation, New York 1998, pp.141–148.
70. C. Rudnick, J. Werther in L.-S. Fan, T. M.Knowlton (eds.): Fluidization IX, EngineeringFoundation, New York 1998, pp. 573–580.
71. K.-E. Wirth, M. Seiter in R. J. Anthony (ed.):Fluidized Bed Combustion, ASME, New York1991, pp. 311–315.
72. J. R. Grace, A. S. Issangya, D. Bai, H. Bi, J.Zhu, AIChE J. 45 (1999) 2108–2116.
73. J. Li, M. Kwauk : Particle-Fluid Two-PhaseFlow–The Energy-Minimization Multi-ScaleMethod., Metallurgical Industry Press, Beijing1994.
74. W. Ge, J. Li, Chem. Eng. Sci. 57 (2002)3993–4004.
75. J. Li., W. Ge, J. Zhang, M. Kwauk, Trans.ChemE, Part A Chem. Eng. Res. Des. 83(2005) 574–582.
76. J. Li., C. Cheng, Z. Zhang, J. Yuan, A. Nemet,F.N. Fett, Chem. Eng. Sci. 54 (1999) 574–582.
77. J. Li, J. Ouyang, S. Gao, W. Ge, N. Yang, W.Song: Multi-Scale Simulation of Particle-FluidComplex Systems, Science Press, Beijing 2005,
78. N. Yang, W. Wang, W. Ge, J. Li, Chem. Eng. J.96 (2003) 71–80.
79. T. M. Knowlton in P. Basu, J. F. Large (eds.):Circulating Fluidized Bed Technology II,Pergamon Press, Oxford 1988, pp. 31–41.
80. Y. Jin, Y. Zheng, F. Wei in J. R. Grace, J. Zhu,H. de Lasa (eds.): Circulating Fluidized BedTechnology VII, Can. Soc. Chem. Eng., Ottawa2002, pp. 40–60.
81. P. Lehner, K.-E. Wirth, Chem. Eng. Sci. 54(1999) 5471–5483.
82. M. Zhang, Z. Quian, H. Yu, F. Wei, Chem.Eng. J. 92 (2003) 161–167.
83. F. Wei, J. Z. Liu, Y. Jin, Z. Q. Yu, Chem. Eng.Tech. 18 (1995) 59–62.
84. H. E. Liu, F. Wei, Y. H. Yang, Y. Jin in J. R.Grace, J. Zhu, H. de Lasa (eds.): CirculatingFluidized Bed Technology VII, Can. Soc.Chem. Eng., Ottawa 2002, pp. 83–89.
85. C. Huang, Z. Quian, M. Zhang, F. Wei,Powder Technol. 161 (2006) 48–52.
86. M. Zhang, K. Chu, A. Yu, F. Wei in K. Cen(ed.): Circulating Fluidized Bed TechnologyVIII, Int. Academic Publ., Beijing 2005, pp.299–305.
87. H. Brust, K.-E. Wirth, Ind. Eng. Chem. Res. 43(2004) pp. 5796–5801.
88. R. Deng, F. Wei, Y. Jin, Q. Zhang, Y. Jin,Chem. Eng. Tech. 25 (2002) 711–716.
89. H. Brachold, C. Peuckert, H. Regner, Chem.Ing. Tech. 65 (1993) 293–297.
90. A. S. Bassi, C. L. Briens, M. A. Bergougnou inA. A. Avidan (ed.): Circulating Fluidized BedTechnology IV, AIChE, New York 1994, pp.25–32.
91. W. L. Forsythe, W. R. Hertwig, Ind. Eng.Chem. (1949) 1200–1206.
92. J. E. Gwyn, AIChE J. 15 (1969) no. 1, 35–39.93. F. A. Zenz, E. G. Kelleher, J. Powder Bulk
Solids Technol. 4 (1980) nos. 2/3, 13–20.94. W. G. Vaux, J. S. Schruben, AIChE Symp. Ser.
79 (1983) no. 222, 222–228.95. W. G. Vaux, J. S. Schruben, Chem. Eng.
Commun. 33 (1985) 333–347.96. W. Xi, J. Werther, “Jet Attrition of Catalyst
Particles in Gas Fluidized Beds”, Int. Symp. onAttrition and Wear in Powder Technology,Utrecht 1992.
97. J. Werther, W. Xi, Powder Technol. 33 (1993)39–46.
98. J. Werther, J. Reppenhagen, in W.-C. Yang(eds.): Handbook of Fluidization andFluid-Particle Systems, Marcel Dekker, NewYork 2003, pp. 201–237.
46 Fluidized-Bed Reactors
99. J. Reppenhagen, J. Werther, AIChE J. 45(1999) 2001–2010.
100. J. Reppenhagen, J. Werther, Powder Technol.113 (2000) 55–69.
101. J. Reppenhagen, A. Schetzschen, J. Werther,Powder Technol. 112 (2000) 251–255.
102. C. Klett, E.-U. Hartge, J. Werther, Proc.Combustion Inst. 30 (2005) 2947–2954.
103. E.-U. Hartge, C. Klett, J. Werther, AIChE J.(2007), in press.
104. P. N. Rowe in J. F. Davidson, E. Harrison(eds.): Fluidization, Academic Press, London1971, pp. 121 – 192.
105. J. Werther, Chem.-Ing.-Tech. 49 (1977) no. 3,193–202.
106. J. M. D. Merry, J. F. Davidson, Trans. Inst.Chem. Eng. 51 (1973) 361–368.
107. M. Virr, Inst. Energy Symp. Ser. (London) 4(1980) IA–1–1-11.
108. D. Ormston, E. Robinson, D. Buckle, Inst.Energy Symp. Ser. (London) 4 (1980)IIA–1–1-10.
109. J. J. van Deemter in J. F. Davidson, R. Clift, D.Harrison (eds.): Fluidization, Academic Press,London 1985, pp. 331–355.
110. J. Werther, H. Groenewald, A.-K.Schroeder-Lanz, Energietechnik (Leipzig) 40(1990) no. 5, 164–167.
111. J. H. De Groot, Proc. Int. Symp. Fluid. 1967,348–358.
112. R. J. de Vries, W. P. M. van Swaaij, C.Mantovani, A. Heijkoop, Chem. React. Eng.Proc. Eur. Symp. 5th (1972) session B 9, pp.56–69.
113. D. Bellgardt, F. W. Hembach, M. Schoßler, J.Werther, Proc. Int. Conf. Fluid. Bed Combust.9th (1987) 713–722.
114. D. Kunii, O. Levenspiel, J. Chem. Eng. Jpn. 2(1969) 122–129.
115. D. Bellgardt, J. Werther, Powder Technol. 48(1986) 173–180.
116. B. Hirschberg, J. Werther in J. R. Grace, A. A.Avidan, T. M. Knowlton (eds.): CirculatingFluidized Beds, Chapman & Hall, London1997, pp. 119–148
117. R. Koenigsdorff, J. Werther, Powder Technol.84 (1995) 317–329.
118. P. Schlichtharle, J. Werther, Powder Technol.120 (2001) 21–33.
119. B. Hirschberg, J. Werther, AIChE J. 44 (1998)25–34.
120. U. Arena in J. R. Grace, A. A. Avidan, T. M.Knowlton (eds.): Circulating Fluidized Beds,Chapman & Hall, London 1997, pp. 86–118.
121. C. M. H. Brereton, J. R. Grace, J. Yu in P.Basu, J. F. Large (eds.): Circulating FluidizedBed Technology II, Pergamon Press, Oxford1988, pp. 307–314.
122. J. Werther, E.-U. Hartge, M. Kruse, W. Nowakin P. Basu, M. Horio, M. Hasatani (eds.):Circulating Fluidized Bed Technology III,Pergamon Press, Oxford 1990, pp. 593–598.
123. J. Werther, E.-U. Hartge, M. Kruse, PowderTechnol. 70 (1992) 293–301.
124. A. Klinkenberg, H. J. Krajenbrink, H. A.Lauwerier, Ind. Eng. Chem. 45 (1953) no. 6,1202–1208.
125. T. K. Sherwood, R. L. Pigford, C. R. Wilke:Mass Transfer, McGraw Hill, New York 1975.
126. O. Molerus, K.-E. Wirth, Heat Transfer inFluidized Beds, Chapman & Hall, London1997.
127. R. Turton, T. J. Fitzgerald, O. Levenspiel, Int.J. Heat Mass Transfer 32 (1989) 289–296.
128. J. S. M. Botterill, Y. Teoman, K. R. Yuregir,Powder Technol. 39 (1984) 177–189.
129. R. Wunder, A. Mersmann, Chem.-Ing.-Tech.51 (1979) no. 3, 241.
130. L. R. Glicksman in J. R. Grace, A. A. Avidan,T. M. Knowlton (eds.): Circulating FluidizedBeds, Chapman & Hall, London 1997, pp.261–311.
131. J. Schweinzer, O. Molerus, Chem. Eng.Technol. 12 (1989) 38–44.
132. A. P. Baskakov, B. Leckner, Powder Technol.90 (1997) 213–218.
133. T. M. Knowlton, in W.-C. Yang, (ed.):Handbook of Fluidization and Fluid-ParticleSystems, Marcel Dekker, New York 2003, pp.599–617.
134. S. Pulupula, H. Singh, S. J. Chopra, in L. S.Fan, T. M. Knowlton (eds.): Fluidization X,Engineering Foundation, New York 1998, pp.733–739.
135. S. C. Arnold, M. Cecchini, G. Fenati, J. W.Stanecki, in M. Kwauk, J. Li, W. C. Yang(eds.): Fluidization X, EngineeringFoundation, New York 2001, pp. 707–714.
136. P.W. Smit, S. Baloyi, T. Shingles, in U. Arena,R. Chirone, M. Micchio, P. Salatino (eds.):Fluidization XI, ECI Engineering ConferencesInternational, Brooklyn 2004, pp. 587–593.
137. Y. Jiang, K. M. Mc Auley, J. C. C. Hsu, Ind.Eng. Chem. Res. 37 (1997) 1176–1180.
138. S. Ariyapadi, D. W. Holdsworth, C. J. D.Norley, F. Berruti, C. Briens, Int. J. Chem.Reactor Eng. 1 (2003) A 60.http://www.bepress.com/ijcre/Vol1/A60

Fluidized-Bed Reactors 47
139. S. Ariyapadi, F. Berruti, C. Briens, P. Griffith,C. Hulet, Can. J. Chem. Eng. 81 (2003)891–891.
140. S. Bruhns, J. Werther, AIChE J. 51 (2005) pp.766–775
141. J. Werther, S. Bruhns Int. J. Chem. ReactorEng. 2 (2004) A31.http://www.bepress.com/ijcre/Vol 2/A31
142. Y. Ge, L.S. Fan in U. Arena, R. Chirone, M.Micchio, P. Salatino (eds.): Fluidization XI,ECI Engineering Conferences International,Brooklyn 2004, pp. 259–266.
143. B. Riediger: Die Verarbeitung des Erdols,Springer Verlag Berlin 1971.
144. D. Kunii, O. Levenspiel: FluidizationEngineering, John Wiley, New York 1969.
145. J. L. Callahan, R. K. Grasselli, E. C.Milberger, H. A. Strecker, Ind. Eng. Chem.Process Des. Dev. 6 (1970) 134–140.
146. H. S. van der Baan in R. Prins, G. C. A. Schuit(eds.): Chemistry and Chemical Engineeringof Catalytic Processes, Nato Advanced StudyInstitute Series E: Applied Sciences no. 39,Academic Press, London 1980.
147. M. E. Dry: Applied Industrial Catalysis,Academic Press, New York 1983.
148. R. W. Silverman et al. in K. Ostergaard, A.Sorensen (eds.): Fluidization, EngineeringFoundation, New York 1986, pp. 441–448.
149. A. P. Steynberg, R. L. Espinoza, B. Jager, A.C. Vosloo, Appl. Catal. A 188 (1999) 41–54.
150. S. Sookai, P.L. Langenhoven, T. Shingles,inM. Kwauk, J. Li and W.C. Yang (eds.):Fluidization X, Engineering Foundation, NewYork 2001, pp. 620–628.
151. J. J. Graham, Chem. Eng. Prog. 66 (1970)54–60.
152. Mitsubishi Kasei Kogyo, DE 2 165 323 C 2,1971 (K. Terahata et al.).
153. Mitsubishi Chemical Industries, DE 2 658861, 1976 (S. Kamimura, T. Otaki).
154. S. C. Arnold, G. D. Suciu, L. Verde, A. Neri,Hydrocarbon Process. 64 (1985) no. 9,123–126.
155. G. Stefani, F. Budi, C. Fumagalli, G. D. Suciuin G. Centi, F. Trifiro (eds.): NewDevelopments in Selective Oxidation, ElsevierScience Publ., Amsterdam 1990, pp. 537–552.
156. R. M. Contractor, J. Ebner, M. J. Mummey, inC. Centi, F. Trifiro (eds.): New Developmentsin Selective Oxidation, Elsevier, Amsterdam1990, pp. 553–562.
157. K. G. Golbig, J. Werther, Chem. Eng. Sci., 52(1997) pp. 583–595.
158. R.M. Contractor, Chem. Eng. Sci. 54 (1999)pp. 5627–5632.
159. T. Miyauchi et al., Adv. Chem. Eng. 11 (1981)275–448.
160. R. Pearce, W. R. Patterson: Catalysis andChemical Processes, Leonard Hill, Glasgow1981.
161. T. Katsumata, T. Dozono, AIChE Symp. Ser. 83(1987) no. 255, 86–96.
162. C. D. Chang: Hydrocarbons from Methanol,Marcel Dekker, New York 1983.
163. H. H. Gierlich, W. Dolkemeyer, A. Avidan, N.Thiagarajan, Chem.-Ing.-Tech. 58 (1986) no.3, 238–239, MS 1462/86.
164. Ullmann, 4th ed., 18, 521–544.165. Ullmann, 4th ed., 7, 566–576.166. M. Schwarzmann, Hydrocarbon Process. 48
(1969) no. 9, 184–186.167. B. Jazayeri in W.-C. Yang (ed.): Handbook of
Fluidization and Fluid-Particle Systems,Marcel Dekker, New York 2003, pp.421–444.
168. F. J. Karol, Catal. Rev. Sci. Eng. 26 (1984)557–565.
169. T. Xie, K. B. McAuley, J. C. C. Hsu, D. W.Bacon, Ind. Eng. Chem. Res. 33 (1994)449–479.
170. H. Koda, T. Kurisaka in M. Kwauk, D. Kunii,Z. Jiansheng, M. Hasatani (eds.): Fluidization’85, Science and Technology, Science Press,Beijing 1985, 402–413.
171. J. D. Burdett, R. S. Eisinger, P. Cai, K. H. Lee,in M. Kwauk, J. Li, W. C. Yang (eds.):Fluidization X, Engineering Foundation, NewYork 2001, pp. 39–52.
172. A. M. Salleh, A. Ingram, A. McCormack, R.Coreenwood, V. Reiling, in U. Arena, R.Chirone, M. Micchio, P. Salatino (eds.):Fluidization XI, Engineering Conferences,New York 2004, pp. 211–218.
173. P. Cai, I. D. Burdett in K. Cen (ed.):Circulating Fluidized Bed Technology VIII,Int. Academic Publ., World Publ. Corp.,Beijing 2005, pp. 410–417.
174. F. T. Barr, C. E. Jahnig, Chem. Eng. Prog. 51(1955) 167–177.
175. J. M. Matsen in G. Hetsroni (ed.): Handbookof Multiphase Systems, McGraw Hill, NewYork 1982, pp. 8/178–183.
176. P. Schmalfeld, Hydrocarbon Process Pet.Refin. 42 (1963) no. 6, 145–155.
177. A. Steinhofer, Chem.-Ing.-Tech. 36 (1964) no.9, 889–898.
178. J. Zelkowski: Kohleverbrennung,VGB-Kraftwerkstechnik GmbH, Essen 1986.

48 Fluidized-Bed Reactors
179. G. Stamatelopoulos, J. Seeber, R.S. Skowyrain L. Jia (ed.): Proc. 18th Int. Conf. FluidizedBed Combustion, ASME, New York 2005, CDROM, ISBN 0-7918-3755-6.
180. Lurgi AG, Jahresbericht 1989, Frankfurt/Main1989.
181. F. van Dijen, P. Savat, J. Vanormelingen, H.Sablon, VGB PowerTech (2005) no. 11, pp.64–66.
182. G. Stamatelopulos, J. Seeber, VGB PowerTech2005, no. 11, 38–43
183. L. Carpenter et al.in R. J. Anthony (ed.): Proc.Int. Conf. Fluid. Bed Combust. ASME, NewYork, 1991, p. 467–474.
184. H. Martin, VGB Kraftwerkstech. 71 (1991) no.4, 347–354.
185. S. A. Jansson, J. Anderson in R. B. Reuther(ed.): Proc. Int. Conf. Fluid. Bed Combust.,ASME, New York 1999, FBC99–0191.
186. G. Dehn, H. Meier, H. Mollenhoff, H.Rehwinkel, G. von Wedel, Proc. Int. Conf.Fluid. Bed Combust. (R. J. Anthony, ed.),ASME New York 1991, p. 345–362.
187. K. K. Pillai, S. A. Jansson, Proc. Int. Conf.Fluid. Bed Combust. (R. J.Anthony, ed.)ASME New York 1991, p. 493–502.
188. J. Anderson, S. A. Jansson, Proc. Int. Conf.Fluid. Bed Combust. (R. J.Anthony, ed.)ASME New York 1991, p. 787–793.
189. D. Adams, A. Dodd, D. Geiling, A. Robertsonin R. B. Reuther (ed.): Proc. Int. Conf. Fluid.Bed Combust., ASME, New York 1999,FBC99–0076.
190. M. A. Cuenca, E. J. Anthony (eds.):Pressurized Fluidized Bed Combustion,Chapman & Hall, London 1995.
191. J. Werther, T. Ogada, Progress EnergyCombust. Sci. 25 (1999) 55–116.
192. J. Werther, M. Saenger, J. Chem. Eng. Japan33 (2000) 1–11.
193. Uhde: Verbrennung pastoser Ruckstande,company brochure, Dortmund 1988.
194. J. Werther, L. Muhlhaus, W. Liebig,Maschinenmarkt 94 (1988) no. 22, 50–54.
195. U. Urban, WLB Wasser Luft Betr. (1987) no. 9,66–68.
196. Sulzer-Escher-Wyss: Verfahren fur dieumweltfreundliche und energiesparendeBehandlung von Klarschlamm, companybrochure, Ravensburg 1989.
197. C. Berse, H. Teufel, G. Muller, Chem. Eng.Process. 24 (1990) no. 5, 36–39.
198. H. v. Raczeck, J. Werther, M. Wischniewski,VDI-Ber. 522 (1991) 585–595.
199. H. Hannemann et al.: Wirbelschichtsysteme1990, VGB-TB 212, VGB Techn. Vereinigungder Großkraftwerksbetreiber e.V., Essen 1990,V 29/1–23.
200. W. Adlhoch, J. Keller, P. K. Herbert:“Kohlevergasung 1991” VGB Conference,Dortmund, May 16th/17th, 1991.
201. R. Wirthwein, P. Scur, H. Hirschfelder, H.Vierrath in J. Werther (ed.): CirculatingFluidized Bed Technology VI, DECHEMA,Frankfurt 1999, pp. 737–746.
202. L. Reh, Chem. Eng. Prog. 67 (1971) no. 2,58–68.
203. L. Reh, Chem.-Ing.-Tech. 42 (1970) no. 7,447–451.
204. L. Reh, J. Ernst, H. W. Schmidt, K. H.Rosenthal, Aluminium (Dusseldorf) 47 (1971)no. 11, 681–685.
205. W. Bresser, P. Weber, Iron Steel Eng. (1995)81–85.
206. R. Husain, P. Weber, A. Orth, H. Eichberger inJ. Werther (ed.): Circulating Fluidized BedTechnology VI, DECHEMA, Frankfurt 1999,pp. 593–598.
207. L.-S. Fan, Gas-Liquid-Solid FluidizationEngineering, Butterworth, Boston 1989.
208. K. Schugerl, Can. J. Chem. Eng. 67 (1989)178–184.
209. J.-X. Zhu, Y. Zheng, D. G. Karamanev, A. S.Bassi, Cand. J. Chem. Eng. 78 (2000) 82–94.
210. J. J. Heijnen, Chem.-Ing.-Tech. 56 (1984)526–532.
211. J. J. Heijnen, A. Mulder, W. Enger, F. Hoeks:Anaerobic Treatment, a Grown-up Technology,NVA Water Treatment Conference Aquatech’86, Amsterdam Sept. 15–19, 1986.
212. O. Moebus, M. Teuber, Kiel. Milchwirtsch.Forschungsber. 33 (1981) 3–23.
213. L. Rottenbacher: “Entwicklung undModellierung eines Gas/FeststoffWirbelschichtfermenters fur die Erzeugungvon Ethanol mit S. Cerevisiae”, Dissertation,Techn. Universitat Hamburg-Harburg 1985.
214. W. Bauer in K. Ostergaard, A. Sorensen (eds.):Fluidization V, Engineering Foundation, NewYork 1986, pp. 619–626.
215. W. Bauer, Can. J. Chem. Eng. 64 (1986)561–566.
216. T. Akao, Y. Okamoto in D. Kunii, R. Toei(eds.): Fluidization, Engineering Foundation,New York 1983, pp. 631–637.
217. T. Akao, Y. Okamoto, Kagaku Kogaku 49(1985) 349–355.
218. M. Asif, Chem. Eng. Technol. 21 (1998)77–82.

Fluidized-Bed Reactors 49
219. A. Tanyolak, H. Beyenal, Chem. Eng. J. &Biochem. Eng. J. 2 (1998) 207–216.
220. J. R. Grace, K. S. Lim in J. R. Grace, A. A.Avidan, T. M. Knowlton (eds.): CirculatingFluidized Beds, Chapman & Hall, London1997, pp. 504–524.
221. P. Jiang, F. Wei, L.S. Fan in W. C. Yang (ed.):Handbook of Fluidization and Fluid-ParticleSystems, Marcel Dekker, New York 2003, pp.309–342.
222. R. Shinnar, ACS Symp. Ser. 72 (1978) 1–13.223. W. Bock, G. Emig, W. Sit, J. Werther, Chem.
React. Eng. Proc. Int. Symp. 8th (1984)479–486.
224. W. Sitzmann, M. Schoßler, J. Werther,Chem.-Ing.-Tech. 59 (1987) no. 1, 68/69 andMS 1553/87.
225. W. P. M. van Swaaij in J. F. Davidson, R. Clift,D. Harrison (eds.): Fluidization, AcademicPress, London 1985, pp. 595–629.
226. J. R. Grace in D. Geldart (ed.): GasFluidization Technology, John Wiley & Sons,Chichester 1986, pp. 285–340.
227. D. Kunii, O. Levenspiel: FluidizationEngineering, Butterworth-Heinemann, Boston1991, pp. 303–305.
228. W. P. M. van Swaaij, F.J. Zuiderweg, Proc. 5thEur. Symp. Reaction Eng., Amsterdam 1972,pp. B9–25.
229. D. Rokita: “DynamischeWirbelschichtmodellierung einer komplexenReaktion”, Dissertation, TechnischeUniversitat Hamburg-Harburg 1991.
230. S. P. Sit, J. R. Grace, Chem. Eng. Sci. 36(1981) 327–335.
231. L. H. Chen, C. Y. Wen, AIChE J. 28 (1982) no.6, 1019–1029.
232. M. Schoßler, H. v. Raczeck, J. Werther,Chem.-Ing.-Tech. 61 (1989) no. 8, 652–653and MS 1771/89.
233. T. Minoura, Y. Sakamoto, S. Toyama in A. M.Manaker (ed.): Proc. Int. Conf. Fluid. BedCombust., ASME, New York 1989, pp.1155–1161.
234. D. Bellgardt, F. Hembach, M. Schossler, J.Werther in J. P. Mustonen (ed.): Proc. 9th Int.Conf. Fluid. Bed Combust., ASME, New York1987, pp. 713–722.
235. P. Raven, G. A. Sparham, Proc. Int. Conf.Fluid. Bed Combust. 7th (1982) 275–283.
236. S. Artlich, E.-U. Hartge, J. Werther, Ind. Eng.Chem. Res. 37 (1998) 782–792.
237. W. P. M. vanSwaaij in D. Luss, V. W.Weekman (eds.): Chemical Reaction
Engineering Review, ACS, Washington 1978,pp. 329–338.
238. M. Edwards, A. A. Avidan, Chem. Eng. Sci. 41(1986) pp. 829–836.
239. P. I. Viitanen, Ind. Eng. Chem. Res. 32 (1993)pp. 577–583.
240. S. Ouyang, J. Lin, O. E. Potter, PowderTechnol. 74 (1993) pp. 73–79.
241. H. Schoenfelder, J. Werther, J. Hinderer, J. F.Keil, AIChE Symposium Series 90 (1994) 301,92–104.
242. H. Kagawa, H. Mineo, R. Yamazaki, K.Yoshida in P. Basu, M. Horio, M. Hasatani(eds.): Circulating Fluidized-Bed TechnologyIII, Pergamon Press, Oxford 1991, pp.551–559.
243. T. S. Pugsley, G. S. Patience, F. Berruti, J.Chaouki, Ind. Eng. Chem. Res. 31 (1992) pp.2652–2660.
244. S. Ouyang, O.E. Potter in A. Avidan (ed.):Circulating Fluidized-Bed Technology IV,AIChE, New York 1993, pp. 515–521.
245. G.S. Patience, P.L. Mills, AIChE AnnualMeeting, St. Louis 1993.
246. J. Werther in K. Cen (ed.): CirculatingFluidized-Bed Technology VIII, InternationalAcademic Publishers, Beijing 2005, pp. 1–25.
247. T. Knoebig, J. Werther, Chem. Eng. Technol.21 (1999) 656–659.
248. E.-U. Hartge, K. Luecke, J. Werther, Chem.Eng. Sci. 54 (1999) 5393–5407.
249. J.A.M. Kuipers, B.P.B. Hoomans, W.P.M.vanSwaaij in L.S. Fan, T.M. Knowlton (eds.):Fluidization IX, Engineering Foundation, NewYork 1998, pp. 15–30.
250. B.A. Kashiwa, W.C. Yang in J.R. Grace, J.Zhu, H. de Lasa (eds.): Circulating FluidizedBed Technology VII, Can. Soc. Chem. Eng.,Ottawa 2002, pp. 27–39.
251. N. Yang, W. Ge, G. Niu, C. Yang, J. Li in K.Cen (ed.): Circulating Fluidized-BedTechnology VIII, International AcademicPublishers, Beijing 2005, pp. 291–298.
252. M. Zhang, K. Chu, A. Yu, F. Wei in K. Cen(ed.): Circulating Fluidized-Bed TechnologyVIII, International Academic Publishers,Beijing 2005, pp. 299–305.
253. X. Xiao, W. Wang, H. Yang, J. Zhang, G. Yuein K. Cen (ed.): Circulating Fluidized-BedTechnology VIII, International AcademicPublishers, Beijing 2005, pp. 394–401.
254. M. A. van der Hoef, M. vanSint Annaland, J.A. M. Kuipers, Chem. Eng. Sci. 59 (2004) pp.5157–5165.

50 Fluidized-Bed Reactors
255. J. Li, W. Ge, J. Zhang, M. Kwauk, Trans. IChemE, Part A Chem. Eng. Des., 83 (2005) pp.574–582.
256. J. Werther, E. -U. Hartge, Ind. Eng. Chem. Res.43 (2004) pp. 5593–5604.
257. J. Werther, E. -U. Hartge, Powder Technol. 148(2004) pp. 113–122.
258. M. Pell, S.P. Jordan, AIChE Symp. Ser. 84(1988) no. 262, pp. 68–73.
259. R. J. de Vries, W. P. M. van Swaaij, C.Mantovani, A. Heijkoop, Proc. 5th Eur. Symp.Chem. Reaction Eng., Session B9, Amsterdam1972, pp. 56–69.
260. E.-U. Hartge, J. Werther, V. Wiesendorf in J.R.Grace, J. X. Zhu,H. de Lasa (eds.): CirculatingFluidized Bed Technology VII, Can. Soc.Chem. Eng., Ottawa 2002, pp. 325–332.
261. W. Nowak, Z. Bis, J. Laskawiec, W.Krzywoszynski, R. Walkowiak in J. Werther(ed.): Circulating Fluidized Bed TechnologyVI, DECHEMA, Frankfurt 1999, pp.1003–1008.
262. J. Werther, Chem. Eng. Sci. 47 (1992) 9–11,2457–2462.
263. W. Bauer, J. Werther, Chem. React. Eng. Proc.Int. Symp. 7th (1982);ACS. Symp. Ser. 196 (1982) 121–132.
264. M. Pell, S. P. Jordan, paper presented atAIChE Meeting, New York, November 1987.
265. Y. Ikeda, in M. Kwauk, D. Kunii, J. Zheng, M.Hasatani (eds.): Fluidization ’85–Science andTechnology, Elsevier, Amsterdam 1985, pp.1–10.