flow pattern analysis in haor areas using...
TRANSCRIPT

4th International Conference on Water & Flood Management (ICWFM-2013)
315
FLOW PATTERN ANALYSIS IN HAOR AREAS USING DELFT3D
Supria Paul 1*, Saiful Islam 2, Mashfiqus Salehin 3 and Anisul Haque 4
1 Institute of Water and Flood Management, Bangladesh University of Engineering and Technology,Dhaka-1000, Bangladesh. Email: [email protected]
2 Institute of Water and Flood Management, Bangladesh University of Engineering and Technology, Dhaka-1000, Bangladesh. Email: [email protected]
3 Institute of Water and Flood Management, Bangladesh University of Engineering and Technology, Dhaka-1000, Bangladesh. Email: [email protected]
4Institute of Water and Flood Management, Bangladesh University of Engineering and Technology, Dhaka-1000, Bangladesh. Email: [email protected]
ABSTRACT Surnamganj district is surrounded by the Surma river which is originated in the hills of Shillong and Meghalaya of India. The main source of the Surma is the Barak river of India. During the monsoon flows of the rivers and Haor areas pose considerable impact on the hydraulic structures crossing it. To understand flow pattern and flood wave characteristics of this area, it is necessary to simulate 2D model as one dimensional typical modeling is not quite capable of generating flows. In this context, Delft3D has been selected to represent flow process of the Haor areas. In this study, FLOW module of Delft3D has been used to derive floods with a return period of 50 years during the monsoon season (June to August). Simulation has been started from April to provide spin-up period of two months before actual monsoon season. The time step of simulation is one minute to satisfy the stability criteria of the model. It is found that flood inundation depth increases with time and reaches to the maximum level at the end of the third week of July. The Kushiyara-Kalni system overspills only at the upper reach of the river. By this time, the floodplain of the Darain, Surma and Kalni river gets deeply flooded. At that time, flow of Dirain and Surman river systems are converged towards the Kushiyara river at Madna. However, with the road in place, the obstructed flood flow would pass from north to the south mostly parallel to the road along both sides of the road. Keywords: Delft3D, flow pattern, hoar area, hydro-morphology, Meghna basin.
1. INTRODUCTION In Bangladesh, most of lands in terms of geographical elevation are lower than 8 meter (Salaudin and Saiful, 2011). Numerous rivers pass through these low lying areas which create mesh in this low lying area. This behavior creates haors and beels in northeastern part of Bangladesh. Haors are large bowl-shaped floodplain depressions located mostly in the north-eastern part of Bangladesh covering about 25% of the entire region. Haors are used for agriculture during dry season and fisheries during rainy season. Haors have profound not only ecological importance but also environmental importance. About 8,000 migratory wild birds visit the area annually. Haors are frequently affected by the flash floods due to hilly topography and steep slope of the rivers draining the area. These flash floods spill onto low-lying flood plain lands in the region, inundate crops, damage infrastructures by erosion and often cause loss of lives and properties. For appropriate risk mitigation mechanism, it is necessary to explore flood characteristics of that region (Bhattacharya and Suman, 2012). Under a current project, a numerical model is setup based
4th International Conference on Water & Flood Management (ICWFM-2013)
316
on Delft3d to study the flooding characteristics. It is important to understand flood wave characteristics, velocity patterns of rivers which pass through haor region. With 1D model it is not quite possible understand which flow paths the floods will follow as these depend on the magnitude of inflows and on the spatial distribution of terrain levels. During a model schematization, the overall distribution of elevations cannot always be analyzed to provide sufficient insight about the paths that floods may follow (Verwey, 2009). However, using simulation of the 3D model in the flood plain it is possible to quantify the spatial distribution of flows for a large area. In this context, this paper made an attempt to understand the flow patterns of haor area using Delft3D model.
2. STUDY AREA The north eastern part of Bangladesh is known locally as the haor area of Bangladesh and consists of mainly the districts of Sunamganj, Moulovibazar, Sylhet, Kishorganj and Netrokona. Our study are is located between latitude 24°30´N to 25°N and longitude 91°15´E to 91°55´E. Sunamganj are shown in Figure 1. The existing Derai-Sulla-Ajmeriganj road would pass parallel to the small river called the Chamti-Darain (locally known as Darain) river. Darain River is a distributary of the river Surma which is originated in the hills of Shillong and Meghalaya of India. The Surma river drains one of the world's heaviest rainfall areas. The main source of the Surma is the Barak River in India, which has a considerable catchment in the ridge and valley terrain of Naga-Manipur hills. On reaching the border with Bangladesh at Amalshid in Sylhet district, the Barak bifurcates to form the steep and highly flashy rivers, the Surma and the Kushiyara. From Amalshild, the Surma flows to the west and then the southwest towards Sylhet town. From there it flows in the northwest and west direction towards Sunamganj town. Flowing to the north of the Sylhet basin, Surma receives tributaries from Khasia and Jaintia Hills of Shillong plateau and bifurcates at the south of Mohanganj soon after it receives the Kangsa and further to the south the Mogra. Then one branch continues to flow to the southwest and the other flows down to the south to Markuli where it meets the Kushiyara. The joint course flows up to Bhairab Bazar and is known as the Kalni. Sometimes the southern course of the Surma is also known as the Kalni from down to Derai. The Chamti-Darain is originated from the southern branch of the Surma river. From Derai the Chamti-Darain flows down to the south and fall into the Bhera Mohona Beel in Sulla Upazilla which finally drains out to the Kalni at Ajmeriganj. The total length of the river is about 50.5 km and the width of the river is about 120 m. The Anandapur bazar and the Sulla Upazilla headquarters are located on the banks of the river. The river Darain flows as irregularly meandering sand-bed channel and the meandering is extreme at the downstream part. At the downstream channel, the river splits around permanent islands and displays bars and shoals. The river system carries sediment originated from the upstream areas.

4th International Conference on Water & Flood Management (ICWFM-2013)
317
Figure 1: Study area in Bangladesh map
3. METHODS
3.1 Topographic and Bathymetric Data Field surveys were carried out to collect up-to-date bathymetric, bank line and topographic data covering for the entire reach of the existing road. Survey data were collected at an interval of 25 meters along the centerline of the road starting from the Baniachang Thana. Road cross sections were taken for every 100 meters. The aim of this task was to produce digital topographic and hydrographic maps which would be utilized for the hydro-morphological study. Preparing maps of physical features and land topography recording site information on water level, High Flood Level, type of traffic and navigation, etc., and preparing bathymetric map and cross-sectional drawings. The topographic and bathymetric survey works were sub-contracted to ‘UpadeshtaJarip Service’. A total of 161 road cross-sections were available from the survey. Hydrological data were collected from BWDB. The existing road is located within a haor area and is subjected to flash floods and prolonged period of monsoon flooding. During monsoon flooding occurs from both sides of the road. Analysis of flood hydrographs for the different gage stations on nearby rivers which are hydraulically connected to the haor area and may contribute to flooding at the site is considered. The flood flow at the road site comes from different tributaries of the Surma and Kushiyara-Kalini systems. The nearest water level stations on the Surma river are MahasinghFerryghat Station (Station ID: 199) on the Surma-Dahuka river and Gobindaganj (Station ID: 33), Offtake of Surma (Station ID: 6) and Sylhet (Station ID: 267) on the Surma river. The Sylhet station and Offtake-Surma station are both also non-tidal discharge stations. All the channels over which bridges are proposed are ungagged. The locations of the gage station and river network are shown in Figure 2.

4th International Conference on Water & Flood Management (ICWFM-2013)
318
Markuli
Ajmeriganj
Kushiyara‐Kalni river
Durlavpur
Figure 2: (A) The layout of the road and nearby water level and discharge measuring stations of BWDB and (B) river system showing BWDB gage stations
Figure 3: Water level of rivers hydraulically connected with the Darainriver
3.2 Model Overview The model used was Delft3D, a multi-dimensional (2D or 3D) modeling technique developed in the Dutch-based research institute (Deltares, 2011). Delft3d is a fully integrated computer software suite applied to simulate hydrodynamics, sediment transport, waves, morphological developments, water quality and ecology for fluvial, estuarine and coastal environments. The Delft3D suite is composed of several modules, grouped around a mutual interface, while being capable to interact with one another. The Delft3D-FLOW module is the heart of Delft3D and is a multi-dimensional (2D or 3D) hydrodynamic (and transport) simulation program which calculates non-steady flow and transport phenomena resulting from hydraulic and meteorological forcing on a curvilinear, boundary fitted grid or spherical coordinates.
Markuli_SW_270
Ajmeriganj_SW_271
(a)
(b)

4th International Conference on Water & Flood Management (ICWFM-2013)
319
3.3 Preparation of DEM Data The NASA Shuttle Radar Topographic Mission (SRTM) digital elevation data (DEMs) were downloaded from the SRTM FTP server (ftp://e0srp01u.ecs.nasa.gov/srtm/version2/) for the study area. The SRTM data is available as 3 arc second (approx. 90m resolution) DEMs. The DEM data were further processed using ArcGIS 9.3 to fill in the no-data voids or cells. The processing involved the production of vector contours and points, and the re-interpolation of these derived contours back into a raster DEM, followed by filling in no-data cells using Spatial Analyst. The data were then projected to WGS84 projection. The SRTM data thus processed were subsequently converted to 298 x 405 grids truncated for the study area using delft3d-RGFGRID. The project model was then updated with the latest data surveyed by IWFM.
3.4 Model Setup As part of the mathematical modeling study for the proposed Derai-Sulla-Ajmeriganj road in Sunamganj district, a two-dimensional hydrodynamic model covering the Kushiyara-Kalni, Old Surma and Darain rivers in the study area was set up. The model requires hydrometric data such as water level and discharge in the rivers. The model boundary set-up is shown in Figure 4. Three upstream discharge boundary conditions were considered: Kushiyara river (at a location upstream of Markuli), Old Surma (a southern branch of Surma river) and Darain river (originating from southwestern branch of Surma river). The downstream water level boundary condition was defined at Ajmeriganj (SW 271) on the Kalni river. The discharge data at Sherpur (SW 175.5) was used on the Kushiyara assuming that there are no loss or gains between Sherpur and the selected location for discharge boundary. The discharge data at the boundaries on Darain and Old Surma river were approximated from the measured discharge data of Surma river (SW 267) taking into consideration the flow conveyance through different branches of Surma river as determined by cross-sectional area and channel slopes. Delft3d-QUICKIN sub-program of the model allowed bathymetry creation of model bathymetry for Delft3d-Flow module. Flow/ water level measuring stations (e.g. Markuli) as well as culverts and bridges were identified as observation points, while the Derai-Sulla-Ajmeriganj road was established by defining ‘dry points’ (which remain free from inundation) in the model bathymetry. Many river exists in this study area so outer world must be influence in this model. Because of this reasons, Neumann boundary condition are used around whole side. The forcing type of Neumann boundary condition, water level condition and discharge condition is harmonic, the forcing type of both water level condition and discharge condition is time series.
Figure 4: Model set-up showing boundary conditions

4th International Conference on Water & Flood Management (ICWFM-2013)
320
4. RESULTS AND DISCUSSION
4.1 Verification of Model The simulation by Delft3D model could not be verified against any observed water level data since the only gage data available within the model domain at Markuli is too close to the discharge boundary. An indirect indication of the performance of the 2D model simulation can be obtained by comparing the estimated flood inundation depth with the model simulated inundation depth. Figure 5 shows the 2D model simulated flood inundation level along the RHD roadway from Anandapur to Ajmeriganj. The 2D model simulated flood inundation level is about 8.1 m PWD at Anandapur (north) end and 7.7 m PWD at Ajmeriganj (south) end, the average being 7.9 m PWD, compared to the estimated design flood level of 7.77 m PWD at Anandapur (north) end and 7.55 m PWD at Ajmeriganj (south) end, the average being 7.66 m PWD. The estimated and simulated flood levels are very close.
-3
-1
1
3
5
7
9
11
0 3000 6000 9000 12000 15000 18000
m P
WD
Chainage from Anandapur end towards Ajmeriganj end (m)
RL of roadFlood inundation level
Figure 5: The 2D model computed flood level along the Derai-Sulla-Ajmeriganj roadway
4.2 Impact on Road for Flood Wave Characteristics The propagation of flood in the floodplains is illustrated by several snapshots of flood inundation maps as presented in Figure 6. Simulations were carried out for both ‘without road’ and ‘with road’ conditions for a period from April to September. It can be seen in the DEM map (Figure 6) that the entire area around the existing RHD road is very low-lying, especially on the right (west) side of the road. It can be seen in Figure 7 that the low lying areas start to get filled up as early as mid-April. The source of inundation water is principally the overbank spillage of Old Surma (to some extent Darain) river. The Kushiyara-Kalni system overspills only at the upper reach. Flood inundation depth increases with time depth and reaches maximum at the end of the third week of July. By this time, the floodplain of the Darain, Surma and the Kalni where the proposed road is located gets almost totally deeply flooded. From the beginning of August, floodwater starts to recede from the floodplains with the recession of flow in the rivers. Impact of the existing road on inundation can be clearly seen in Figure 7. While there is a smooth gradient in flood inundation level in the northeast to the southwest direction for ‘withoutroad’ condition, the change in flood inundation depth between the two sides of the road for ‘with road’ condition is rather very abrupt because of blockage and the resulting accumulation of floodwater behind the road. As discussed before, the alignment of the existing road is from north to south and the northern part is along the right bank of Darain river. At the half way of the proposed road the Darain river crosses the road and flows towards west before it changes its course to the southwards. During high flood the channel flow becomes insignificant and the area turns into a vast floodplain and flow from both the river systems is directed to converge towards the southwest to the Surma-Upper Meghna
4th International Conference on Water & Flood Management (ICWFM-2013)
321
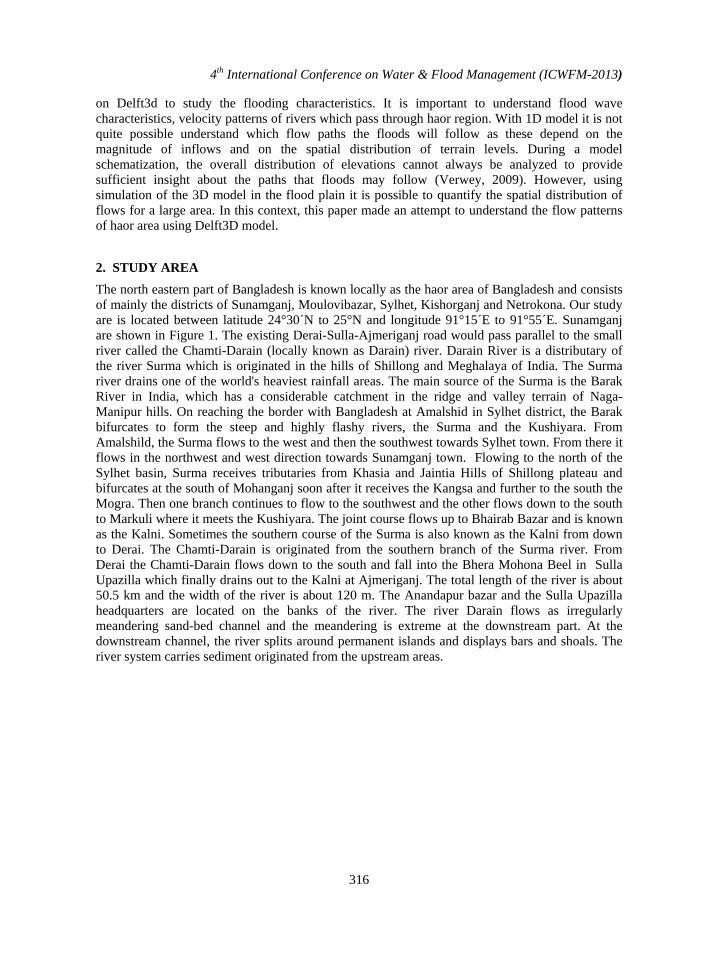
System at Madna. With the road in place, the obstructed flood flow would pass from the north to the south mostly parallel to the road along both sides of the road.
Figure 6: DEM of part of the study area
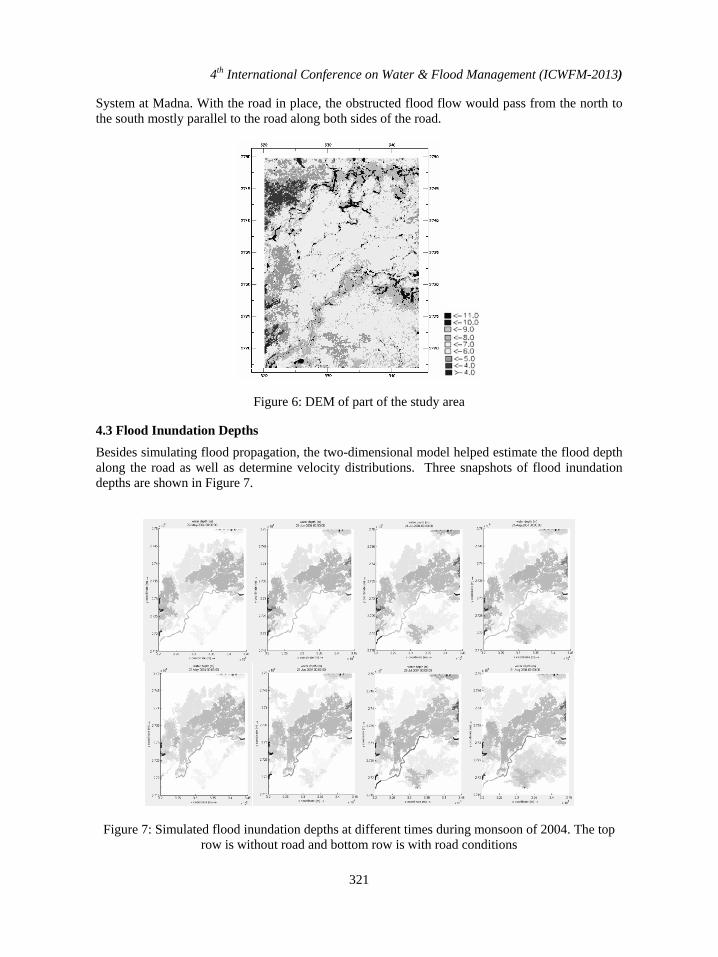
4.3 Flood Inundation Depths Besides simulating flood propagation, the two-dimensional model helped estimate the flood depth along the road as well as determine velocity distributions. Three snapshots of flood inundation depths are shown in Figure 7.
Figure 7: Simulated flood inundation depths at different times during monsoon of 2004. The top row is without road and bottom row is with road conditions

4th International Conference on Water & Flood Management (ICWFM-2013)
322
4.4 Velocity Distribution in Floodplains The velocity distribution in the floodplain areas surrounding the existing RHD road under study is shown in Figure 8. The flow direction over the floodplains is in general from the northeast towards the southwest direction. While the flow takes place unobstructed across the proposed bridge alignment for ‘without’ road condition, under the ‘with road’ condition the cross-drainage takes place mainly through the bridge opening for Darain river, and partly through the opening for another khal (Laylarkhal). The velocity distribution near the road is found to be consistent with expected behavior; flows are parallel to the road, while velocities are higher and follow a direction about perpendicular to the road alignment as floodwater moves through the road openings. Because of flow obstruction near the Anandapur hat end, some flows are seen to take place around the road, with the flows first diverted to the northwards and then to the westwards.
Figure8 : Velocity distributions in floodplains in different parts along the RHD road during the peak flood. The top row is without road and bottom row is with road conditions.
5. CONCLUSIONS This study is mainly focus on flood characteristics of haor area with 2D model. Delft 3d model can able to reproduce the flow path through haor region. This model also detects any obstacle which influence flow path. However, detailed topographic survey data is required to provide more accurate results.
REFERENCES Sutherland,J., Peet, A.H. , Soulsby, R.L. (2004), “evaluating the performance of morphological
models.”Coastal Engineering 51 (917– 939). Salaudin, M., Islam, A.K.M. Saiful (2011), Identification of land cover changes of the haor area
of Bangladesh using MODIS images, the 3rd International Conference on Water & Flood Management, ICWFM, Dhaka.
Verweyadri (2009), The way forward in hydrodynamic flood modeling in the Mekong basin, the 7th Annual Mekong Flood Forum ‘Integrated Flood Risk Management in the Mekong River Basin, Bangkok, Thailand.

4th International Conference on Water & Flood Management (ICWFM-2013)
323
Dastgheib, A., Roelvink J.A. and wang Z.B (2008), long-term process-baesd morphological modeling of the mmarsdiep tidal basin, Journal of marine, geology, geochemistry and geophysics, Elsevier volume 256 (1-4).
Jones, O.P, Petersen, O.S and Hansen, h.kofoed (2007), Modellinh of complex coastal environments: Some consideration for best practice. International Journal for coastal, harbor and offshore engineers, 54(717-733)
Lesser, G.R, Roelvink, J.A, Kester, J.A.T.M and Stelling, G.S(2004), Development and validation of three-dimensional morphological model. International Journal for coastal, harbor and offshore engineers, 51 (883-915)
Roelvink, J.A (2006)coastal morphodynamic evolution techniques.” International Journal for coastal, harbor and offshore engineers.53, (277-287)
Sutherland, J., walstra, D.J.R,chessher,T.J, Rijin,L.C van and Southgate(2004), Evaluation of coastal area modeling system at an estuary mouth. International Journal for coastal, harbor and offshore engineers, 51 (119-142).
Bhattacharya, B. and Suman, A.(2012)Flash flood characteristation of the hoar area of Bangladesh, Geophysical research, Abstracts Vol. 14, EGU2012-11287, 2012, EGU