flow estimation in the wood river sub-basin. study motivation to estimate an historical record at...
TRANSCRIPT
Flow Estimation in the Wood River Sub-Basin

Study Motivation
• To estimate an historical record at the mouth of the Wood River.
– Enables comparison of derived flows to instream claims at the mouth.
– Allows for estimation of zero demand flows.
– Enables derivation of probabilities associated with low flow (drought) conditions.

Crater Lake
Sun CreekAnnie Creek
Wood RiverSprings
Fort Creek
Crooked Creek
$
AgencyLake
InstreamClaimsFourmile Creek
Sevenmile Creek
$
Location
Area Description
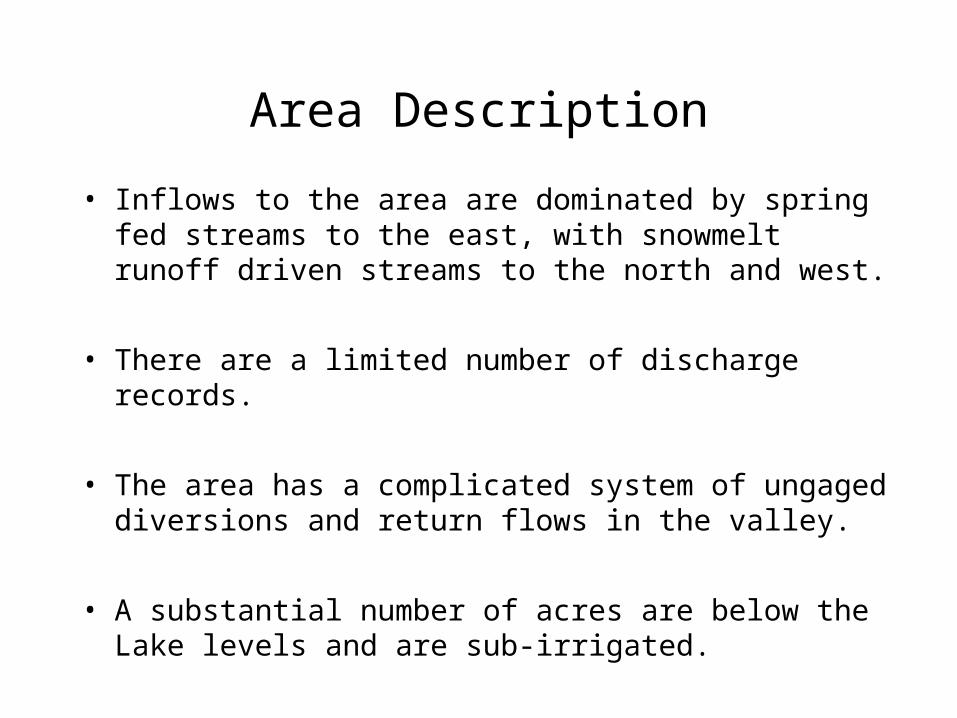
• Inflows to the area are dominated by spring fed streams to the east, with snowmelt runoff driven streams to the north and west.
• There are a limited number of discharge records.
• The area has a complicated system of ungaged diversions and return flows in the valley.
• A substantial number of acres are below the Lake levels and are sub-irrigated.

Area Description
• Instream claims exist at the mouths of Wood River and Crooked Creek.

Major Streams in Wood River Valley
Crater Lake
Sun CreekAnnie Creek
Wood RiverSprings
Fort Creek
Crooked Creek
$
AgencyLake
InstreamClaimsFourmile
Creek
SevenmileCreek
$

Major Streams with Diversions in the Wood River Valley
Crater Lake
Sun CreekAnnie Creek
Wood RiverSprings
Fort Creek
Crooked Creek
$
AgencyLake
InstreamClaimsFourmile
Creek
SevenmileCreek
$

Irrigated and Sub-Irrigated Acreage in Wood River Valley
Crater Lake
Sun CreekAnnie Creek
Wood RiverSprings
Fort Creek
Crooked Creek
$
AgencyLake
InstreamClaims
Sub-Irrigated Acreage
IrrigatedAcreage
$
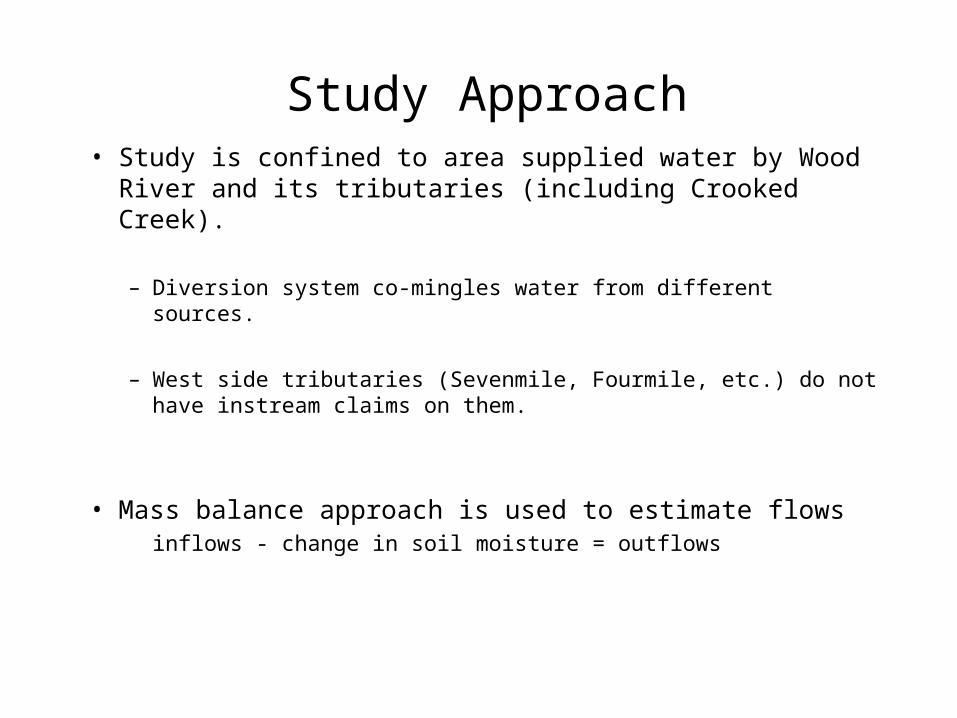
Study Approach• Study is confined to area supplied water by Wood River
and its tributaries (including Crooked Creek).
– Diversion system co-mingles water from different sources.
– West side tributaries (Sevenmile, Fourmile, etc.) do not have instream claims on them.
• Mass balance approach is used to estimate flows inflows - change in soil moisture = outflows

Study Area Control Volume
Crater Lake
Sun CreekAnnie Creek
Wood RiverSprings
Fort Creek
Crooked Creek
#
AgencyLake
Outlet
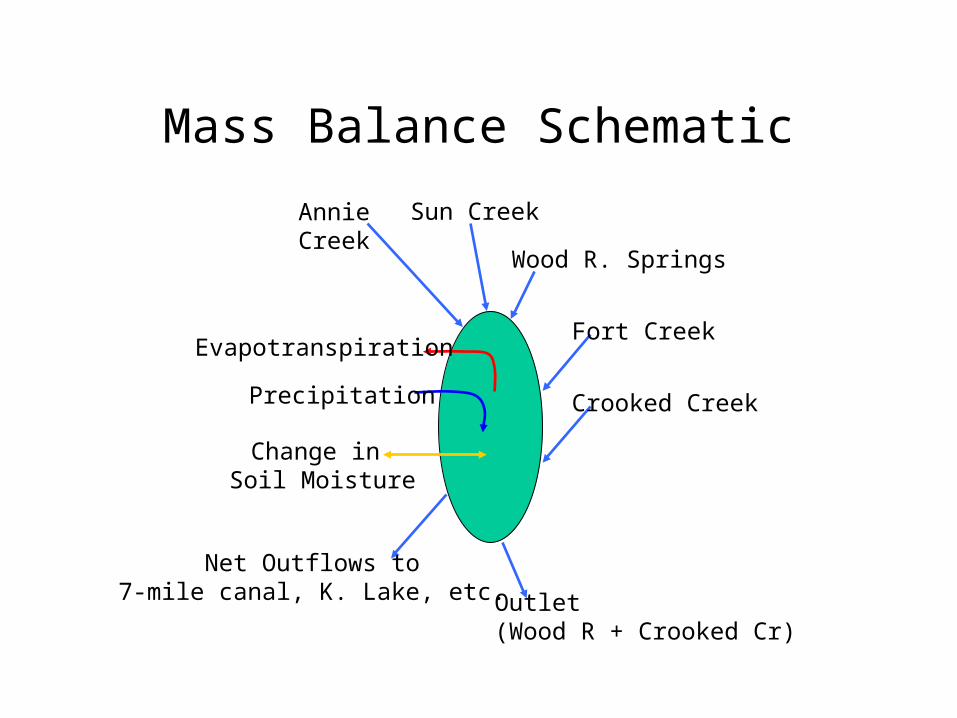
Mass Balance Schematic
AnnieCreek
Sun Creek
Wood R. Springs
Fort Creek
Crooked Creek
Evapotranspiration
Outlet (Wood R + Crooked Cr)
Net Outflows to7-mile canal, K. Lake, etc.
Precipitation
Change in Soil Moisture

Mass Balance Equation
• Inflows - Change in Soil Moisture = Outflows
– Inflows = Annie + Sun + Wood Spr + Fort + Crooked + Precipitation (P)
– Outflows = ET + Net Outflows to Other Areas (R) + Flows at Mouth (M)
• Annie + Sun + Wood Sprg + Fort + Crooked + P - Change in Soil Moisture - ET - M - R = 0
• P - Change in Soil Moisture - ET = Net Consumptive Use (NCU)
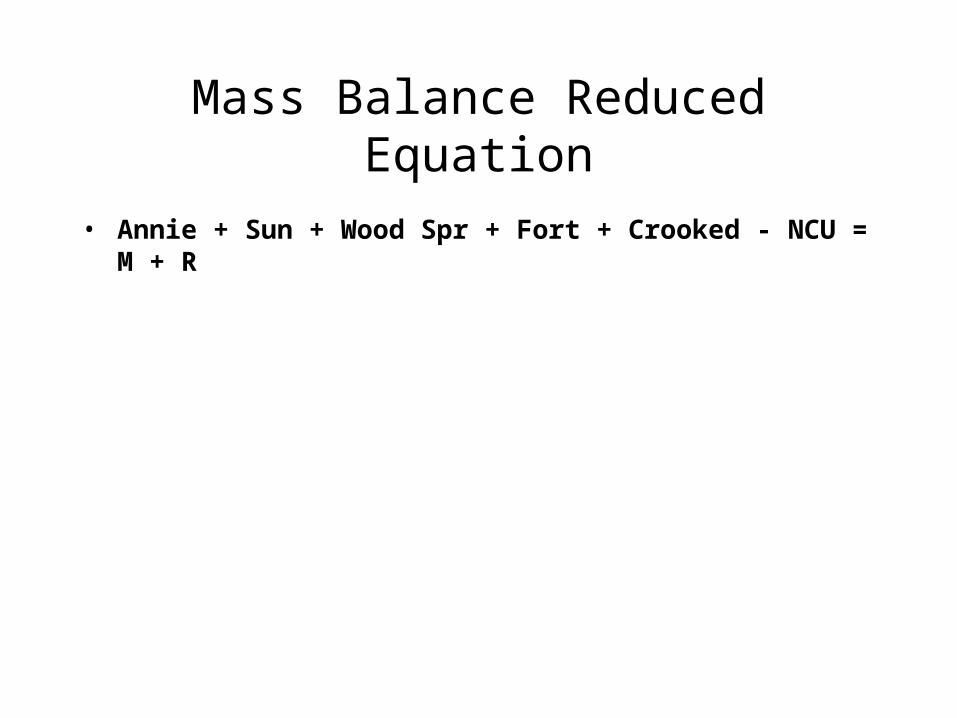
Mass Balance Reduced Equation
• Annie + Sun + Wood Spr + Fort + Crooked - NCU = M + R
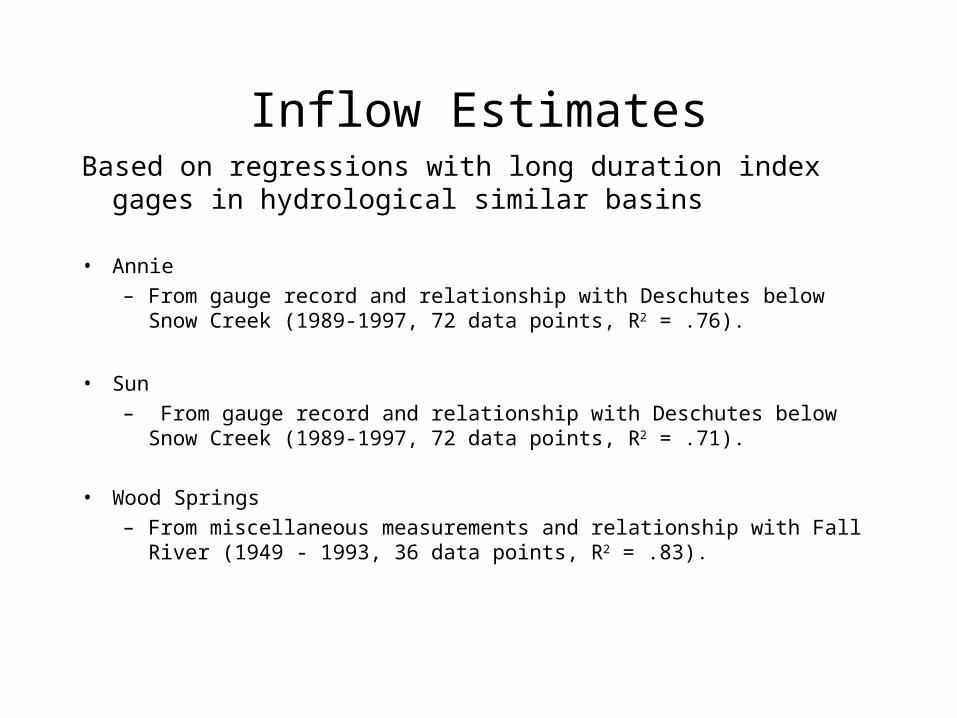
Inflow EstimatesBased on regressions with long duration index gages in
hydrological similar basins
• Annie– From gauge record and relationship with Deschutes below Snow Creek (1989-
1997, 72 data points, R2 = .76).
• Sun– From gauge record and relationship with Deschutes below Snow Creek (1989-
1997, 72 data points, R2 = .71).
• Wood Springs– From miscellaneous measurements and relationship with Fall River (1949 - 1993,
36 data points, R2 = .83).

Inflow Estimates• Fort Creek
– From miscellaneous measurements and relationship with Fall River (1954-1981, 19 data points, R2 = .74).
• Crooked Creek
– From gauge record and relationship with derived Spring Creek Flows (1965-1967, 36 data points, R2 = .53).
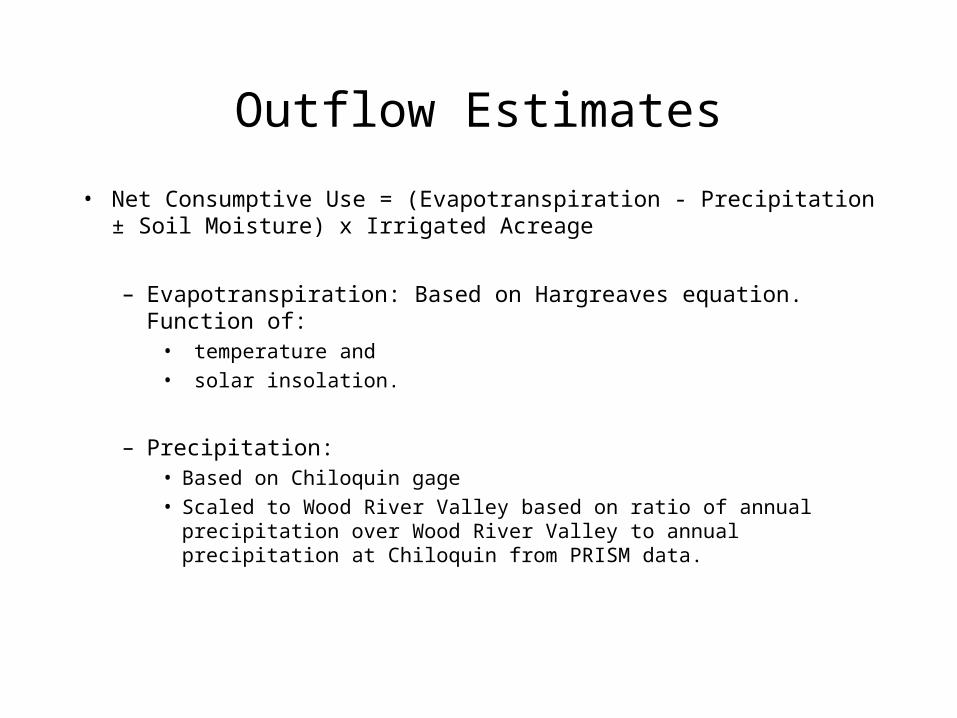
Outflow Estimates
• Net Consumptive Use = (Evapotranspiration - Precipitation ± Soil Moisture) x Irrigated Acreage
– Evapotranspiration: Based on Hargreaves equation. Function of:• temperature and
• solar insolation.
– Precipitation: • Based on Chiloquin gage
• Scaled to Wood River Valley based on ratio of annual precipitation over Wood River Valley to annual precipitation at Chiloquin from PRISM data.

Outflow Estimates
• Net Consumptive Use = (Evapotranspiration - Precipitation ± Soil Moisture) x Irrigated Acreage
– Soil Moisture: Loading and outflow based on available water capacity, antecedent moisture conditions, and loading and delivery percentages. The latter factor is adjusted so that simulated diversions approach available historical diversion data for region.

Outflow Estimates• What does this mean?
– Soil moisture loading and usage monthly percentages are adjusted so that predicted diversions mimic historical diversion as a % of total.
Diversions as % of Totalby Month
0.0%
5.0%
10.0%
15.0%
20.0%
25.0%
30.0%
Nov Dec Jan
Feb Mar
AprM
ay Jun Ju
lAug Sep Oct
predicted
modoc avg
% 92/93 no winter

Outflow Estimates
• Net Consumptive Use
– Irrigated Acreage Estimate
• Account for sub-irrigated lands
• Reconcile claims/permit data base with GIS data on irrigated acreage.

Outflow Estimates
• Sub-irrigated lands
– Treated as non-manageable (i.e. cannot be shut-off)
– Derived from maps, GIS information, and qualitative field assessment.

Outflow Estimates
• Adjusted irrigated acreage from GIS landuse coverage.
– Approximately 22000 acres (may be underestimated)

Crater Lake
Sun CreekAnnie Creek
Wood RiverSprings
Fort Creek
Crooked Creek
$
AgencyLake
InstreamClaims
Non-ManageableAcres
Manageable Acres
$

Outflow Estimates
• Return Flows
– 75 % of return flows directed to Klamath Lake
– 25% returns to Wood River
– Percentages calibrated to available gage record on Wood River near the mouth.
Results• Results are for the combined flows of the Wood River and
Crooked Creek.
• Estimated monthly flows were produced from 1974-1997.
• Following graphs compare estimated flows to available discharge data near the mouth.

Wood River
0
100
200
300
400
500
600
70010
199
111
199
112
199
1
1 19
91
2 19
91
3 19
91
4 19
91
5 19
91
6 19
91
7 19
91
8 19
91
9 19
9110
199
2
cfs
Simulated Flow Zero Demand Flow Measured Flow

Wood River
0
100
200
300
400
500
600
700
10 19
92
11 19
92
12 19
92
1 199
2
2 199
2
3 199
2
4 199
2
5 199
2
6 199
2
7 199
2
8 199
2
9 199
2
10 19
93
cfs
Simulated Flow Zero Demand Flow Measured Flow
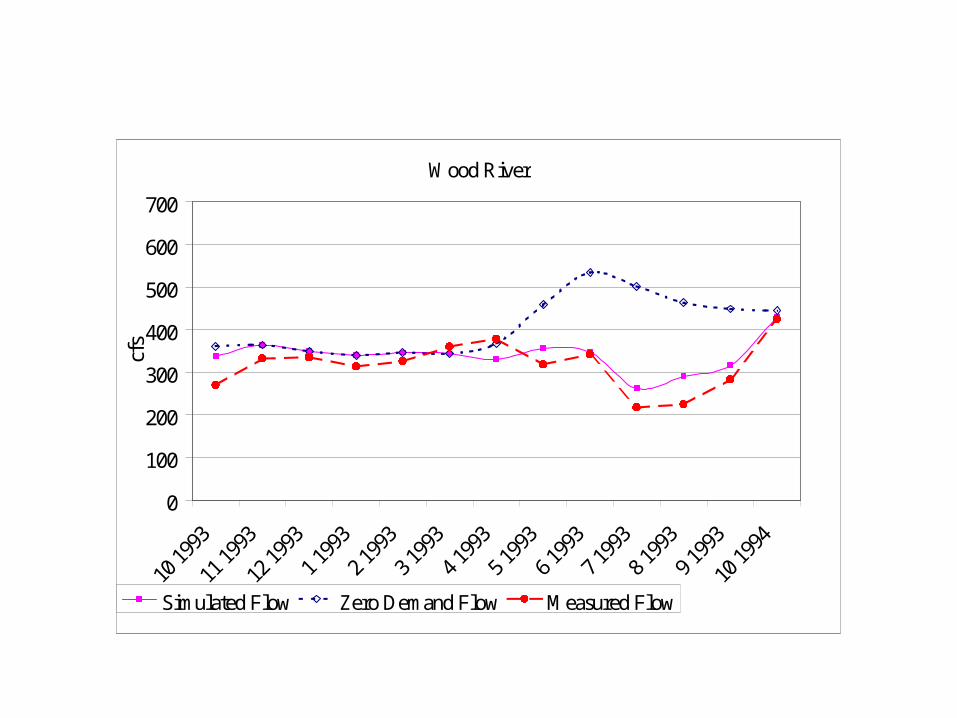
Wood River
0
100
200
300
400
500
600
700
10 19
93
11 19
93
12 19
93
1 199
3
2 199
3
3 199
3
4 199
3
5 199
3
6 199
3
7 199
3
8 199
3
9 199
3
10 19
94
cfs
Simulated Flow Zero Demand Flow Measured Flow

Simulated vs Measured Flows Wood River (4/91-12/94)
y = 0.8771x + 19.757
R2 = 0.8829
0
100
200
300
400
500
0 50 100 150 200 250 300 350 400 450 500Measured (cfs)
Sim
ulat
ed (
cfs)
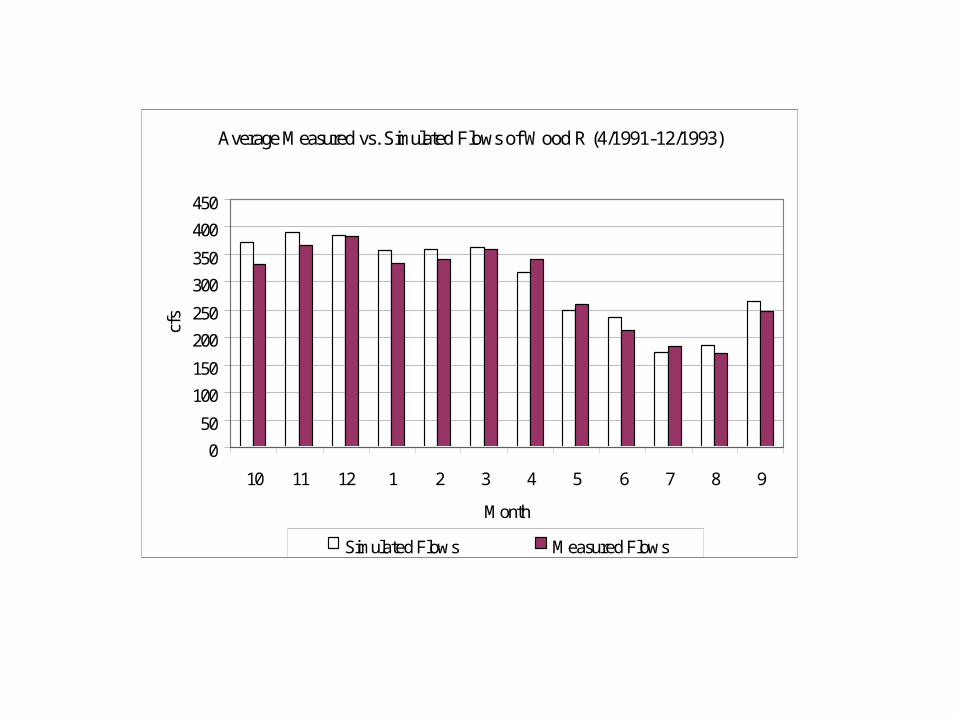
Average Measured vs. Simulated Flows of Wood R (4/1991-12/1993)
0
50
100
150
200
250
300
350
400
450
10 11 12 1 2 3 4 5 6 7 8 9
Month
cfs
Simulated Flows Measured Flows

Conclusion
• Estimated flows appear to be reasonable compared to available gage data.
• Estimated flows generated for 1974-1997 were therefore used in the frequency analysis for the Wood River.
Assumptions
• Irrigation during spring months exceeds demand and the excess water is stored in the soil matrix. This stored moisture is utilized during summer months, thus reducing summer diversion requirements.
• There is no carry over of soil moisture storage from year to year.
• Diversions above net consumptive requirements will return to either Wood River or to Klamath Lake. (100% return flows)
• Irrigation efficiency is 65 %.
Assumptions
• 80 % of precipitation is available to meet crop use requirements.
• 80% of winter precipitation is stored in soil matrix and is available to meet crop use requirements.