florida state university librariesstrouse/theses_strouse... · florida state university libraries...
TRANSCRIPT

Florida State University Libraries
Electronic Theses, Treatises and Dissertations The Graduate School
2011
Targeted Dye Labeling as a Tool forImaging Material and BiomaterialMicroenvironmentsSteven Michael Hira
Follow this and additional works at the FSU Digital Library. For more information, please contact [email protected]

THE FLORIDA STATE UNIVERSITY
COLLEGE OF ARTS AND SCIENCES
TARGETED DYE LABELING AS A TOOL FOR IMAGING MATERIAL AND
BIOMATERIAL MICROENVIRONMENTS
By
STEVEN MICHAEL HIRA
A Dissertation submitted to the Department of Chemistry and Biochemistry
in partial fulfillment of the requirements for the degree of
Doctor of Philosophy
Degree Awarded: Spring Semester, 2011

ii
The members of the committee approve the dissertation of Steven Michael Hira defended
on March 28th, 2011.
__________________________________ Geoffrey F. Strouse Professor Directing Dissertation
__________________________________ P. Bryant Chase University Representative
__________________________________ Albert E. Stiegman Committee Member
__________________________________
Naresh S. Dalal Committee Member
Approved: _____________________________________ Joseph B. Schlenoff, Chair, Department of Chemistry and Biochemistry
The Graduate School has verified and approved the above-named committee members.

iii
Dedicated to those that matter most – friends and family

iv
ACKNOWLEDGEMENTS
First and foremost, I would like to thank my major professor and advisor, Prof. Geoffrey
F. Strouse for the opportunity to study under his direction and grow intellectually while
completing my doctoral degree. During my time at Florida State University (FSU) he inspired
me to target and conduct research on various aspects of chemistry, even expanding into the fields
of biology, physics, and engineering. Most importantly, Prof. Strouse taught me how to learn. I
would also like to thank my doctoral committee, Prof. Strouse, Prof. Albert E. Stiegman, Prof.
Naresh S. Dalal, and Prof. P. Bryant Chase, for their mentoring and support. Throughout my
graduate career I have had the unique opportunity to work with a host of talented graduate
students, post-docs, research faculty, staff, and faculty in numerous departments at FSU and
elsewhere at other institutions. In particular, I had the pleasure of collaborating with Prof. Linda
S. Hirst and Dr. Jing Yuan on imaging the sorting of lipid mixtures in tubules (Chapter 2), the
Strouse research group members concerning nanomaterials (Chapter 2), Prof. D. Tyler
McQuade, Dr. Brian P. Mason, Dr. Massimo Carraro on targeted dye-labeling of polymer
microcapsules and their application to biological systems (Chapter 2), Dr. Brian P. Mason, Dr.
Chad A. Stoltz, and Dr. Colin W. Roberts on the microscopy characterization of energetic
materials (Chapter 3), Dr. Khaled Aledealat, Kansheng Chen, Dr. Mark Field, Dr. Gerald J.
Sullivan, Prof. P. Bryant Chase, Prof. Peng Xiong, and Prof. Stephan von Molnár on the
detection of DNA using Hall magnetometry and fluorescent microscopy (Chapter 4), and Dr. M.
Dru Roycik, Dale B. Bosco, Prof. Jian Cao, Dr. Yonghao Jin, Prof. Martin A. Schwartz, and
Prof. Qing-Xiang Amy Sang for investigating the world of matrix metalloproteinases (Chapter
5). Funding for research accomplished within this dissertation was made possible by the
National Institute of Health (NIH) grants # 5R01EB000832 and # GM079592, Navy Surface
Warfare Center (NSWC) – Indian Head, Materials Research Technology (MARTECH) at FSU,
and the Chemistry Department at FSU. I would also like to thank Ric Villani for all of his expert
advice in optical microscopy. In addition, I would also like to thank all of the office and
technical staff that has helped me throughout my time at FSU. I deeply appreciate my time in
Tallahassee, where I am truly grateful of the close friendships that I have been able to form over
the years. Lastly, I want to thank all of my friends and family for their support while I pursued

v
my dreams. As I transition to the next phase of my career, I will never forget those that
introduced me to the science that I enjoy researching and those that have supported me along the
way.

vi
TABLE OF CONTENTS
List of Tables .................................................................................................................. ix List of Figures ................................................................................................................ x List of Symbols ...............................................................................................................xviii Abstract ........................................................................................................................... xxii 1. GENERAL INTRODUCTION ................................................................................. 1 1.1 Background ................................................................................................ 1 1.2 Literature Examples of Targeted Dye-labeling .......................................... 2 1.3 Relevant Microscopy Techniques .............................................................. 3 1.4 Summary of Remaining Chapters .............................................................. 5 2. IMAGING DISTINCT ENVIRONS IN SYNTHETIC AND NATURALLY OCCURRING MICROENVIRONMENTS ........................... 7 2.1 Introduction ................................................................................................ 7 2.2 Lipid Tubules ............................................................................................. 10 2.2.1 Lipid Tubule Preparation ................................................................ 10 2.2.2 Microscopy Details ......................................................................... 11 2.2.3 Photoinduced Banded Lipid Tubules .............................................. 11 2.3 Nanomaterials ............................................................................................ 12 2.3.1 Microscopy Details ......................................................................... 12 2.3.2 Nanomaterial Cellular Imaging ....................................................... 12 2.2.3 NSET Molecular Beacon Assay and Nanomaterial Cellular Transfer ............................................... 16 2.4 Synthetic Polymer Microcapsules .............................................................. 18 2.4.1 Polymer Microcapsule Formation ................................................... 18 2.4.2 Microscopy Details ......................................................................... 19 2.4.3 Polymer Microcapsule Labeling ..................................................... 19 2.4.4 Triple Labeled Polymer Microcapsules .......................................... 20 2.4.5 Cellular Uptake of Microcapsules into CHO cells ......................... 22 2.5 Conclusions and Future Directions ............................................................ 24
3. PROBING SOLVENT INCLUSIONS IN ENERGETIC CRYSTALS USING TARGETED DYE LABELING ............................................................................... 25 3.1 Introduction ................................................................................................. 25 3.2 RDX Recrystallization ................................................................................ 27 3.3 Microscopy Details ...................................................................................... 28 3.4 Microscopy Analysis of RDX ..................................................................... 28 3.5 Evaluation of Two Distinct Recrystallization Methods .............................. 35 3.6 Conclusions and Future Directions ............................................................. 36
vii
4. DETECTION OF TARGET SINGLE STRANDED DNA USING A MICRO- FABRICATED HALL MAGNETOMOETER WITH CORRELATED OPTICAL READOUTY ........................................................................................... 38 4.1 Introduction ................................................................................................ 38 4.2 Experimental .............................................................................................. 40 4.2.1 Substrate Fabrication ...................................................................... 40 4.2.2 Substrate Cleaning .......................................................................... 42 4.2.3 Substrate Passivation ...................................................................... 43 4.2.4 Synthetic DNA Design ................................................................... 46 4.2.5 DNA Immobilization and Hybridization ........................................ 48 4.2.6 Microscopy Details ......................................................................... 49 4.2.7 Hall Measurement Details ............................................................... 51 4.3 Results and Discussion ............................................................................... 51 4.3.1 Design ............................................................................................. 51 4.3.2 Detection ......................................................................................... 53 4.3.3 Sensitivity ....................................................................................... 58 4.3.4 Selectivity and Detection Limits ..................................................... 59 4.4 Conclusions and Future Directions ............................................................. 61 5. LIVE-CELL OPTICAL TRACKING OF A NOVEL DYE-LABELED MATRIX METALLOPROTEINASE INHIBITOR (MMPI) IN LNCAP AND LNCAP-MT1-GFP CELL LINES ............................................................................ 63 5.1 Introduction ................................................................................................ 63 5.2 Syntheses of Dye-labeled Target MMPI and Controls .............................. 70 5.2.1 Synthesis of Disulfide Protected Dye-labeled Target MMPI (YHJ-8-91) ............................................................... 70 5.2.2 Syntheses of YHJ-8-89 and C3DyeControls ................................... 72 5.3 Quantification of Target MMPI and Controls ........................................... 72 5.4 Microscopy Details .................................................................................... 73 5.5 Cellular Uptake of Target MMPI in LNCaP
and LNCaP-MT1-GFP Cell lines ............................................................... 74 5.6 Cellular Uptake of YHJ-8-91, YHJ-8-89, and C3Dye
in LNCaP-MT1-GFP ................................................................................. 77 5.7 Quantification of Cellular Uptake of YHJ-8-91, YHJ-8-89, and C3Dye in LNCaP-MT1-GFP ............................................................... 78 5.8 Qualitative Time-Dependant Cellular Uptake of YHJ-8-91 ...................... 82 5.9 Probing MMPI-MMP Interactions Using Zymography ............................ 83 5.10 Conclusions and Future Directions ............................................................ 84
APPENDICES ................................................................................................................ 86 A. KH LER ILLUMINATION ALIGNMENT PROTOCOL ...................... 86 B. NMR SPECTRA OF FITC-ACETYLENE ............................................... 87 C. THEORETICAL HALL SENSITIVITY CALCULATIONS ..................................................................................... 91 D. MASS SPECTROGRAM OF TARGET MMPI ....................................... 92 E. NMR SPECTRA OF YHJ-8-91, YHJ-8-89, and C3Dye ........................... 93

viii
F. ANOVA STATISTICS ON THE CELLULAR UPTAKE OF THE MMPI AND CONTROLS .......................................................................... 99 G. COPYRIGHT RELEASE FORMS ............................................................100 REFERENCES ...............................................................................................................102 BIOGRAPHICAL SKETCH ..........................................................................................118

ix
LIST OF TABLES
5.1. Characteristics of designed synthetic DNA using IDT DNA Oligo
Analyzer 3.1. .......................................................................................................... 45 F1. ANOVA Statistics on the quantification of cellular uptake of YHJ-8-91, YHJ-8-89, and C3Dye 6 hours post incubation. ..................................................... 99

x
LIST OF FIGURES
1.1. Labeled components of a modern microscopy platform. ........................................ 3 2.1. Photo-initiated lipid sorting into disordered (red) and ordered (blue) liquid
phases (a,b). Line-scan analysis across (b) showing distinct morphological characteristics for disordered (left, red) and ordered (right, blue) phases (c). Scale bars = 5 µm.................................................................................................... 10
2.2 LSCM micrographs showing the cellular uptake of InP/ZnSMUA passivated
quantum dots using Optifect™ 24 hours post transfection. (a) The TLD-DIC image overlaid with quantum dots (green) and cell membrane stain (red). (b) Quantum dot (green) and cell membrane (red) fluorescence overlaid image. (c) The 3-D reconstruction image of InP/ZnS quantum dots (green) and cell membrane stain (red) overlay. Scale bars = 5 µm. ................................................ 14
2.3 LSCM micrographs showing the cellular uptake of InP/ZnSMUA passivated
quantum dots using Optifect™ 24 hours post transfection. (a) The TLD-DIC image overlaid with nucleus (blue), quantum dots (green), and cell membrane stain (red). (b) Nucleus (blue), quantum dot (green), and cell membrane (red) fluorescence overlaid image. (c) The triply stained 3-D reconstruction image of InP/ZnS quantum dots (green) and cell membrane stain (red) overlay. Scale bars = 5 µm.................................................................................................... 15
2.4. Wide-field fluorescence micrographs showing the cellular uptake of 5.7 nm
Au nanoparticles passivated with fluorescein labeled dsDNA using Optifect™ 24 hours post transfection. (a) The DIC image overlaid with fluorescein fluorescence(green) indicating ligand release. (b) A zoomed in region of (a) depicting fluorescein fluorescence (green) with DIC overlay and fluorescein fluorescence only (green) showing DNA release (punctate) and endosomal escape (diffuse). Scale bar = 50 µm. ....................................................................... 17
2.5. Wide-field fluorescence with DIC overlaid micrographs showing cellular
division and the transfer of DNA released off nanoparticle platform (green) to newly formed daughter cells at 1 hr (a), 2 hr (b), 4 hr (c) and 6 hr (d). Scale bars = 10 µm.................................................................................................. 17
2.6. Pictorial representation of the synthesis of polyurea based polymer
microcapsules. Taken from Mason, B.P., Hira, S.M., Strouse, G.F., McQuade, D.T. Organic Letters 11, 1479-1482 (2009) – Reproduced with permission by the American Chemical Society. ............................................................................ 18
2.7. LSCM micrographs showing the selective labeling of Lissamine rhodamine B
on the outer shell of polyurea microcapsules with encased pCMS. (a) The

xi
TLD-DIC image overlaid with selective microcapsule shell labeling (red). (b-c) The 3-D reconstruction of the polymer shell fluorescent labeling (red)
from two different perspectives. Scale bar = 2 µm. ............................................... 20 2.8. The TLD-DIC overlay showing selective labeling of the interior (blue and
green) and the shell (red) (a). Strategy for selective microcapsule labeling with three reactive fluorescent dyes (b). Scale bar = 5 µm. Adapted from Mason, B.P., Hira, S.M., Strouse, G.F., McQuade, D.T. Organic Letters 11, 1479-1482 (2009).................................................................................................... 20
2.9. The selective simultaneous labeling of three spatially separated reactive sites
on polyurea microcapsules using cascade blue hydrazide™ (blue), FITC acetylene (green), and Lissamine rhodamine B (red). Line-scan analysis for each image is shown as a plot of intensity with respect to distance across the microcapsule for each individual image. Scale bars = 5 µm. Adapted from Mason, B.P., Hira, S.M., Strouse, G.F., McQuade, D.T. Organic Letters 11, 1479-1482 (2009) – Reproduced with permission by the American Chemical Society..................................................................................................................... 21
2.10. The 3-D reconstruction images of microcapsules showing the color
coordinated morphologies for cascade blue hydrazide™ (blue), fluorescein acetylene (green), and Lissamine rhodamine B (red). Overlays of cascade blue hydrazide™ (blue) with Lissamine rhodamine B (red) and FITC acetylene with Lissamine rhodamine B (red) are shown for clarity. Adapted from Mason, B.P., Hira, S.M., Strouse, G.F., McQuade, D.T. Organic Letters 11, 1479-1482 (2009). . ................................................................................................................... 22
2.11. The selective simultaneous labeling of three spatially separated reactive sites
on polyurea microcapsules using cascade blue hydrazide™ (blue), FITC acetylene (green), and Lissamine rhodamine B (red). Line-scan analysis for each image is shown as a plot of intensity with respect to distance across the microcapsule for each individual image. Scale bars = 5 µm. Adapted from Mason, B.P., Hira, S.M., Strouse, G.F., McQuade, D.T. Organic Letters 11, 1479-1482 (2009) – Reproduced with permission by the American Chemical Society..................................................................................................................... 23
3.1. The chemical structures for cyclotrimethylene trinitramine, known commonly
as RDX, (left) and Lissamine rhodamine B sulfonyl chloride (right). ................... 27 3.2. Optical micrographs of RDX crystals with matching index of refraction fluid
(a) and without matching index of refraction fluid (b) showing the presence of internal defects. Adapted from Roberts, C.W., Hira, S.M., Mason, B.P., Strouse, G.F. & Stoltz, C.A., CrystEngComm, 13, 1074-1076, 2011 – Reproduced by permission of the Royal Society of Chemistry. ............................ 28

xii
3.3. Optical micrographs of RDX crystals using bright-field DIC and wide-field microscopy techniques. Bright-field DIC and wide-field fluorescence overlay (a), bright-field DIC (b), and wide-field fluorescence (c) visualizing both the RDX crystal morphology (gray scale) and the presence of crystalline defects (red). Scale bars = 50 m. ...................................................................................... 30
3.4. Optical micrographs of RDX crystals using LSCM techniques. TLD-DIC
and Lissamine rhodamine B sulfonyl chloride overlay (a), TLD-DIC (b), and Lissamine rhodamine B sulfonyl chloride (c) visualizing both the RDX crystal morphology (gray scale) and the presence of crystalline defects (red). Scale bars = 50 m. ......................................................................................................... 31
3.5. Optical micrographs of RDX crystals using TLD-DIC and confocal
microscopy techniques. TLD-DIC and Lissamine rhodamine B sulfonyl chloride overlay (a), TLD-DIC (b), and Lissamine rhodamine B sulfonyl chloride, (c) visualizing both the RDX crystal morphology (gray scale) and the presence of crystalline defects (red). An electronic magnification of the same RDX crystal (white box in (a)), where the TLD-DIC and Lissamine rhodamine B sulfonyl chloride overlay (d), TLD-DIC (e), and Lissamine rhodamine B sulfonyl chloride (f) are shown. The spectral confocal profile of the signal acquired in (g) depicts signal originating from Lissamine rhodamine B sulfonyl chloride fluorescence. Scale bars (a-c) = 20 m and scale bars (d-f) = 1 m. .......................................................................................... 32
3.6. Laser-induced diffraction patterns can be observed in RDX showing
distinct patterns around solvent inclusions. Scale bar = 2 m. .............................. 33 3.7. The 3-D reconstruction of defects within an RDX particle shown in red
from two different perspectives. ............................................................................. 34 3.8. RDX particles formed using mechanical stirring agitation (a) and ultrasonic
agitation (b). Scale bars = 100 µm. Adapted from Roberts, C.W., Hira, S.M., Mason, B.P., Strouse, G.F. & Stoltz, C.A., CrystEngComm, 13, 1074-1076, 2011 – Reproduced by permission of the Royal Society of Chemistry. ................ 35
3.9. The formation of RDX particles using sonocrystallization under fast solvent
evaporation (a-b) and slow evaporation (c-d), where both the TLD-DIC only (a,c) and the Lissamine rhodamine B sulfonyl chloride only (b,d) images are shown. Scale bars = 20 m. Adapted from Roberts, C.W., Hira, S.M., Mason, B.P., Strouse, G.F. & Stoltz, C.A., CrystEngComm, 13, 1074-1076, 2011. .......... 36
4.1. The composition of the Hall device heterostructure is shown, where the
layers include a GaAs substrate base, layers to reduce lattice mismatches, active layers sandwiched between blocking layers, capping layers, an insulating layer, and the target molecule assembling layer. .................................. 41

xiii
4.2. AFM micrographs of glass substrate mimics. The quality was evaluated based on the presence of artifacts, where a good quality substrate (left) lacks excessive topological features and a poor quality substrate (right) contains excessive topological features. ................................................................. 41
4.3. X-Ray Photoelectron Spectroscopy (XPS) characterization of the reduction
of Au2O3 to bulk Au by an ethanol rinse. The characteristic shifts in the Au 4f (top) and O 1s peaks (bottom) are shown for native Au2O3 and Au2O3 rinsed with ethanol. ................................................................................................ 44
4.4. Native polyacrylamide gel electrophoresis characterization for the three-
strand DNA assembly in the absence of nanobeads showing different mobilities of (1) visual loading dye not observed under fluorescent excitation, (2) reporter strand (disulfide 20mer) and complementary target, (3) probe strand (fluorescein labeled 15mer), (4) reporter and probe strands, (5) probe and complementary target, (6) probe and non-complementary target, (7) reporter, probe, and complementary target, (8) reporter, probe, and non- complementary target (a). The visible bands (3-8) originate from the internal fluorescein modification on the probe strand and the differences in mobility reflect the assembling of the three-strand DNA structure (a). The arrow in (7) signifies the three-strand DNA product, and the band immediately below is most likely attributed to the probe annealed to the complementary target (a). Native polyacrylamide gel electrophoresis characterization for the three-strand DNA assembly in the absence of nanobeads showing different mobilities of (1) probe strand (fluorescein labeled 35mer), (2) complementary reporter and probe strands, (3) non-complementary reporter and probe strands (b). The visible bands (1-3) originate from the internal fluorescein modification on the probe strand and the differences in mobility reflect the assembling of the two- strand DNA structure (b). ....................................................................................... 48
4.5. The assembly of two-strand (a-b) and three-strand (c-d) ssDNA strategies,
where green fluorescence indicates the location of the SPM conjugated nanobeads. The complementary sequence (a,c) results in assembly and the non-complementary sequence (b,d) does not result in assembly. Scale bars = 50 m. .......................................................................................................... 50
4.6. Generalized schematic for the detection of label-free target DNA using Hall
magnetometry. The label-free target DNA (black) is detected by immobilization at the Hall device via complementary base pairing with
receptor DNA (blue) pre-assembled on the Hall device surface to additional complementary probe DNA (red) with an internal fluorescent marker pre- conjugated to the surface of a magnetic nanobead resulting in a detectable Hall signal. Nanobead is not drawn to scale. ......................................................... 52
4.7. Optical microscopy characterization (wide-field fluorescence and DIC
overlay) of three-strand DNA assembly is shown by the presence of green

xiv
fluorescence indicating the presence of probe DNA (a). SEM was used to evaluate the location and to quantify the number of nanobeads contributing to the Hall response for (iii), where the grey box designates the location of the underlying Hall junction (b). Hall responses for three active junctions (i, ii, iii) and a single control junction (iiic) are plotted as Hall voltage offset versus time; the presence of nanobeads over the active Hall junctions results in a drop in Hall voltage when a dc magnetic field is applied (c). The theoretical device signal stemming from a single 344 nm SPM bead is shown to the right as a function of position over the Hall junction further illustrating the local sensitivity of Hall magnetometry (d). Scale bars = 2 m in panels a,b. ............................................................................................................... 54
4.8. SEM micrograph depicting label-free, three-strand DNA assembly of all six
junctions of a Hall magnetometer (a). Scale bar (a) = 10 m. SEM micrographs at higher magnification of the three active Hall junctions, where the ratio of beads entirely or partially over the Hall junction versus beads outside of the junction are (b) 8/41, (c)11/68, and (d) 12/73. Scale bars (b-d) = 1 m. Hall responses for three active junctions (i, ii, iii) and three non- active control junction (ic, iic, iiic) are plotted as Hall voltage versus time; the presence of superparamagnetic (SPM) nanobeads over the active Hall junctions results in a drop in Hall voltage when a dc magnetic field is applied (e). When the dc magnetic field is removed the signal returns to baseline (e). ............................................................................................................ 55
4.9. Sequence-specific two-strand DNA assembly and subsequent Hall detection
of a single 344 nm nanobead. (a) Pictorial representation of two-strand DNA assembly, where the probe DNA (red) is complementary to the receptor DNA (blue). (b) Hall response data for the active (iv) and control Hall junction (ivc) plotted as Hall voltage versus time, where the drop in Hall voltage corresponds to the presence of a magnetic nanobead. (c) SEM was used to confirm only one nanobead contributed significantly to the signal measured in (iv). Scale bar = 2 m. .............................................................................................................. 57
4.10. The theoretical Hall device cross-sectional response for a single 344 nm
SPM bead as a function of position from the center of the junction, where red indicates strongest change in voltage, aqua indicates weakest voltage change, and blue indicates a negative voltage readout. The standard deviation of the noise floor for the device is outlined in black for reference. ........ 58
4.11. Three-strand DNA assembly on a mimic array (patterned on a GaAs substrate)
for (a) complementary target only and (c) 10 ppm target in non-target DNA. The inlays in the lower left of (a) and (c) are an enlarged portion of (a) and (c), respectively. Scale bars = 50 m. A line-scan of the wide-field fluorescence microscopy image in (a) showing fluorescein-labeled probe DNA (green) and DIC (black) intensity correlates fluorescence intensity with nanobeads located

xv
primarily over gold pads, where the black arrows signify the presence of a small number of non-specifically bound nanobeads (b). ..................................... 60
5.1. A pictorial description of the varying domains pertinent to MMPs.
Subclassifications of MMPs are shown as follows: Matrilysins (a), Collagenases (b), Stromelysins (c), Gelatinases (d), MT-MMPs (e), and synthetically modified MMPS (f). .......................................................................... 65
5.2. The chemical structures of YHJ-8-91in protected/inactive (a) and
deprotected/active (b) forms, YHJ-8-89 (c), and C3Dye (d). ................................ 69 5.3. The reaction scheme for the synthesis of disulfide protected inhibitor. ................. 71 5.4. Thin Layer Chromatography results showing the difference in mobility
between disulfide protected inhibitor and unreacted Lissamine rhodamine B under white light and UV illumination (bottom). The spotted reactants and reaction mixture are shown before solvent elution (top). ................................ 72
5.5. The normalized offset absorption spectra of YHJ-8-91, YHJ-8-89,
and C3Dye. ............................................................................................................. 73 5.6. The cellular uptake of dye-labeled thiolated inhibitor in
LNCaP-MT1-GFP. LSCM micrographs of TLD-DIC (a), MT1-GFP (b), rhodamine signature (c), and an overlay of MT1-GFP/rhodamine signature (d) are shown ~ 6.5 hrs post incubation. An electronic zoom of a portion of (a-d) is shown depicting MT1-GFP (e) and MT1-GFP/rhodamine signature overlay (f). The 3-D reconstruction image of LNCaP-MT1-GFP cells with internalized dye-labeled thiolated inhibitor after 24 hr post incubation is shown as a Hoechst 34580 (blue)/rhodamine signature (red) overlay (g). Scale bars (a-d) = 50 µm, (e-f) = 10 µm. ........................................... 75
5.7. The cellular uptake of dye-labeled thiolated inhibitor in LNCaP-GFP.
LSCM micrographs of TLD-DIC (a), GFP (b), rhodamine signature (c), and an overlay of GFP/rhodamine signature (d) are shown 4.25 hrs post incubation. An electronic zoom of a portion of (a-d) is shown depicting GFP (e) and GFP/rhodamine signature overlay (f). The 3-D reconstruction image of LNCaP-GFP cells with internalized dye-labeled thiolated inhibitor after 24 hr post incubation is shown as Hoechst 34580 (blue)/rhodamine signature (red) overlay (g). Scale bars (a-d) = 50 µm, (e-f) = 10 µm. ................................... 76
5.8. The qualitative cellular uptake of YHJ-8-91 (a-c), YHJ-8-89 (d-f), and
C3Dye (g-i) at 1 hr (a,d,g), 2 hr (b,e,h), and 3 hr (c,f,i) post material incubation. Scale bars = 50 µm. ............................................................................. 77
5.9. LSCM micrographs showing cellular uptake of YHJ-8-91 (a-e), YHJ-8-89
(f-j), and C3Dye (k-o) into LNCaP-MT1-GFP cells 6 hrs post incubation.

xvi
The individual channels for TLD-DIC (a,f,k), Hoechst 34580 (b,g,l), MT1-GFP (c,h,m), YHJ-8-91 (d), YHJ-8-89 (i), C3Dye (n), and overlay TLD-DIC, Hoechst 34580, MT1-GFP, and respective compound (e,j,o). Scale bars = 50 µm.................................................................................................. 80
5.10. A graph of the quantitative uptake of YHJ-8-91, YHJ-8-89, and C3Dye
in LNCaP-MT1-GFP cells 6 hours post incubation. Error bars represent standard error. ......................................................................................................... 81
5.11. LSCM micrographs showing the cellular uptake of YHJ-8-91 6 hours post
incubation. (a) The TLD-DIC image overlaid with Hoechst 34580 (blue), MT1-GFP (green) and YHJ-8-91 (red). (b) Hoechst 34580 (blue) and YHJ-8-91 (red) fluorescence overlaid image. (c) The 3-D reconstruction image of Hoechst 34580 (blue), MT1-GFP (green), and YHJ-8-91cell membrane stain (red) overlay. Scale bars = 5 µm. ................................................ 82
5.12. LSCM micrographs depicting cellular uptake of YHJ-8-91 (red) at 6, 24,
and 48 hrs post incubation. ..................................................................................... 82 5.13. The gelatin zymogram of conditioned spent media from LNCaP-MT1-GFP
cells incubated with C3Dye, YHJ-8-89, YHJ-8-91, and controls are shown, where white bands indicate gelatin digestion (a). The percentage of active MMP-2 to pro-MMP-2 from (a) shown in (b). Bar graphs indicating the level of gelatin digestion caused from MMP-2 (c) and MMP-9 (d). . .................... 84
A1. Labeled microscope components necessary for alignment
for Khӧler illumination. ......................................................................................... 86 B1. NMR spectrum of FITC-Acetylene. ...................................................................... 87 B2. NMR spectrum of FITC-Acetylene. ...................................................................... 87 B3. NMR spectrum of FITC-Acetylene. ...................................................................... 88 B4. NMR spectrum of FITC-Acetylene. ...................................................................... 88 B5. NMR spectrum of FITC-Acetylene. ...................................................................... 89 B6. NMR spectrum of FITC-Acetylene. ...................................................................... 89 B7. NMR spectrum of FITC-Acetylene ....................................................................... 90 B8. NMR spectrum of FITC-Acetylene ....................................................................... 90 C1. Maple v13 theoretical Hall sensitivity calculations. .............................................. 91

xvii
D1. Mass spectrogram for target MMPI. ....................................................................... 92 E1. NMR spectrum of YHJ-8-91. ................................................................................ 93 E2. NMR spectrum of YHJ-8-91. ................................................................................ 93 E3. NMR spectrum of YHJ-8-91. ................................................................................ 94 E4. NMR spectrum of YHJ-8-91. ................................................................................ 94 E5. NMR spectrum of YHJ-8-89. ................................................................................ 95 E6. NMR spectrum of YHJ-8-89. ................................................................................ 95 E7. NMR spectrum of YHJ-8-89. ................................................................................ 96 E8. NMR spectrum of YHJ-8-89. ................................................................................ 96 E9. NMR spectrum of C3Dye. ...................................................................................... 97 E10. NMR spectrum of C3Dye. ...................................................................................... 97 E11. NMR spectrum of C3Dye. ...................................................................................... 98 G1. American Chemical Society Copyright Release. ...................................................100 G2. Royal Society of Chemistry Copyright Release. ...................................................101

xviii
LIST OF SYMBOLS
2-D ...........................................................two-dimensional 3-D ...........................................................three-dimensional AFM .........................................................atomic force microscopy
BARC .......................................................bead array counter
CHO .........................................................Chinese hamster ovary CPP ..........................................................cell penetrating peptide DCLP .......................................................dichroic-long pass
DIC ...........................................................differential interference contrast DMEM .....................................................Dulbecco’s modified eagle medium
DMAP ......................................................N,N-dimethylaminopyridine
DMF .........................................................dimethylformamide DNA .........................................................deoxyribonucleic acid DOPC .......................................................1,2-Dioleoyl-sn-glycero-3-phosphocholine dsDNA .....................................................double-stranded DNA ECM .........................................................extracellular matrix
ELISA ......................................................enzymelinkedimmunosorbant assay ECM .........................................................extracellular matrix eSM ..........................................................(2S,3R,4E)-2-acylaminooctadec-4-ene-3-hydroxy-
1-phosphocholine (egg sphingomyelin) EtOH ........................................................ethanol FITC .........................................................fluorescein isothiocyanate
FN ............................................................fibronectin

xix
FRET ........................................................fluorescence resonance energy transfer
GFP ..........................................................green fluorescent protein
GMR ........................................................giant magnetoresistance GUV .........................................................giant unilamellar vesicle
HPLC .......................................................high-performance liquid chromatography Ki ..............................................................inhibitor disassociation constant LbL ...........................................................layer-by-layer Ld ..............................................................liquid disordered Lo ..............................................................liquid ordered LNCaP-GFP .............................................LNCaP cells that express GFP
LNCaP-MT1-GFP....................................LNCaP cells that overexpress MT1-GFP LSCM .......................................................laser scanning confocal microscopy MRI ..........................................................magnetic resonance imaging MMP ........................................................matrix metalloproteinase MMPI .......................................................matrix metalloproteinase inhibitor
NMR ........................................................nuclear magnetic resonance NSET........................................................nanometal surface energy transfer ODT .........................................................octadecanethiol PAGE .......................................................polyacrylamide gel electrophoresis
pAMS .......................................................polyazidomethylstyrene
PBS ..........................................................phosphate buffered saline
PBX ..........................................................plastic bonded explosive pCM .........................................................polychloromethylstyrene

xx
PEG-silane ...............................................2-[Methoxy(Polyethyleneoxy)Propyl]- Trimethoxysilane
PET ..........................................................positron emission tomography PMPPI ......................................................polymethylene polyphenol isocyanate
POC ..........................................................point-of-care RDX .........................................................cyclotrimethylenetrinitramine Rh-DPPE ..................................................1,2-dipalmitoyl-sn-glycero-3-phosphoethanol-
amine-N-(Lissamine rhodamine B sulfonyl chloride) (ammonium salt)
SANS .......................................................small angle neutron scattering SEM .........................................................scanning electron microscopy
SERS ........................................................surface enhanced Raman scattering ssDNA ......................................................single-stranded DNA SNP ..........................................................single nucleotide polymorphism
SPM..........................................................superparamagnetic TCEP ........................................................tris(2-carboxyethyl)-phosphine hydrochloride TEA ..........................................................membrane-type matrix metalloproteinases TEPA........................................................tetraethylenepentamine THF ..........................................................tetrahydrafuran TIMP ........................................................tissue inhibitor metalloproteinase TIRF .........................................................total internal reflection fluorescence TLC ..........................................................thin layer chromatography TLD ..........................................................transmitted light detector TNT ..........................................................trinitrotoluene TRITC ......................................................tetramethylrhodamineisothiocycanate

xxi
XPS ..........................................................X-ray photoelectron spectroscopy

xxii
ABSTRACT
The use of targeted-dye-labeling to probe environs within larger microenvironments is a
powerful tool to elucidate the structure and function of specific components in materials.
Combining site-specific dye-labeling with optical microscopy characterization methods can
allow the tracking dynamics of protein function, the sorting of lipid mixtures as a biological
mimic, and the intra-cellular monitoring of cellular proteins through the use of fluorescent
proteins. The chapters included in this dissertation will focus on the use of optical microscopy as
a tool to image particular fluorescently labeled targets within a surrounding microenvironment.
The optical imaging of synthetic and naturally occurring vesicles is shown to be a powerful tool
to follow site-specific chemical reactions in polymer microcapsules and the delivery of quantum
dots to intra-cellular environments via liposomes, as well as, the sorting of lipids into distinct
domains (Chapter 2). The implementation of a dye-labeling strategy to optically identify
specific environs can be extended to energetic materials in an effort to follow the quality of
recrystallization of RDX (Chapter 3). The strategy of dye-labeling can be extended to
specifically labeling individual DNA sequences conjugated to magnetic beads to monitor and
validate Hall-based DNA sequence detection using both two and three-strand DNA assembly
onto condensed matter surfaces (Chapter 4). Finally, the use of strategically placed fluorescent
dye molecules appended to matrix metalloproteinase inhibitor (MMPI) molecules will be
explored to monitor the interaction of MMPIs in the presence of LNCaP-MT1-GFP cells
(Chapter 5). The experiments described within these listed chapters illustrate the validity of
utilizing targeted dye-labeling and subsequent tracking via optical microscopy methods as a tool
to investigate a host of interdisciplinary research aims in an effort to push the boundaries of the
frontiers of science.

- 1 -
CHAPTER 1
GENERAL INTRODUCTION
1.1 Background
Microscopy as a characterization tool of specimens has led directly to an abundant
amount of scientific discoveries including visualizing the phase separation of lipid mixtures,
the complex function of motor proteins, and use of fluorescent proteins to monitor biological
processes1-3. The importance of microscopy in current scientific research can not be
understated. According to the Web of Knowledge database, searches of “microscopy”
yielded 5933 references (articles, reviews, and communications) in 2010, where sub-searches
of “fluorescence” resulted in 2103 references in the same year. The popularization of the use
of microscopy as a tool arguably began in 1665 when Robert Hooke published a book
entitled Micrographica that revolutionized the way one views the world. The book was
composed of illustrations of his microscopy observations and allowed the visualization of
common everyday elements (ie. cork, fleas, flies, cheese mould, etc.) in far more detail than
the naked eye alone can resolve4. The visualization of cork by Hooke led to the smallest unit
of a living thing referred to as a “cell”4. Today, microscopy has evolved from the days of
basic observations of everyday, tangible objects to elucidating structure and function of
intricate biological specimens and advanced functional materials. In particular, microscopy
coupled to targeted fluorescence dyes as a tool to probe microenvironments have pushed the
frontiers of science and changed the view of how scientists think about multi-disciplinary
fields of research. A few literature examples of fluorescent dye-labeling vastly impacting the
global field of science will be described below to illustrate the power of microscopy to gain
new insights in scientific research spanning a variety of disciplines.
- 2 -
1.2 Literature Examples of Targeted Dye-Labeling
The successful use of targeted dye-labeling as tool to answer scientific questions in
varying multi-disciplinary fields of chemistry, biology, physics, and engineering have been
recently reported in literature. Three particular examples described briefly below
demonstrate how new scientific insights can be ascertained through such a strategy. In 2003,
Baumgart et al. were able to clearly show the separation of lipid mixtures in giant unilamellar
vesicles (GUVs)3. This phenomenon is of particular interest due to the relevance to lipid
bilayer membranes in biological systems. The lipid ordered (Lo) and lipid disordered (Ld)
domains of liposomes were selectively stained with a Lissamine rhodamine B lipid derivative
and a perylene dye, respectively3. The precise labeling strategy described from this research
was later applied to the visualization of phase sorting of lipid tubules described in detail in
Chapter 2. The fluorescence microscopy data obtained allowed the geometry and curvature
of lipid domains to be analyzed with potential relevance to biological processes, such as
endocytosis.
The second example of targeted dye-labeling as a tool to elucidate structure and
function was described by Yildiz et al. concerning myosin V2. Myosin V is a motor protein
responsible for transporting cargo down actin filaments within biological systems. The use of
targeted dye-labeling various components of the motor allowed the motion to be described as
“hand-over-hand” walking rather than “inchworm” sliding, which was the previous source of
much debate2. By monitoring the fluorescent intensity of molecular dyes appended to various
positions located on myosin V using a technique known as total internal reflection epi-
fluorescence (TIRF) microscopy, the two heads of the motor clearly displayed “hand-over-
hand” behavior. The ability to record the dynamic movement of motor proteins real-time
opens the door for how proteins natively function in biological systems.
The last example of targeted dye-labeling is the use of fluorescent protein labeling,
which clearly has revolutionized biological research and evolved into its own cross-
disciplinary field involving biochemistry, organic chemistry, molecular biology, and
materials science5. The discovery of green fluorescent protein (GFP) from the jellyfish
Aequorea victoria has allowed a non-invasive approach to monitoring components of
biological systems1, 5, 6. Since the first discovery, minute mutations in the protein have led to
an entire range of fluorescent proteins spanning the entire visible spectrum6. The use of a
modified GFP chimerically tagged to MT1-MMP is exploited in Chapter 5 to simultaneously

- 3 -
monitor a small molecule matrix metalloproteinase inhibitor (MMPI) with one of its
corresponding protein substrates. The development of fluorescent proteins as a fluorescent
based labeling strategy has expanded the available tools for probing unique environs
contained within much larger domains.
Relevant Microscopy Techniques
Although crude in form compared to present technology, the microscope that was
developed throughout the 1600’s allowed viewing specimens in detail otherwise not known
to exist. The lack of an independent recording device to document specimens in the currently
viewed state caused scientists to sketch their observations. At this time, scientists had to
always question the validity of illustrated representations of their microscopy observations4.
Presently, artist renditions have been replaced by charge coupled devices (CCDs), photo-
multiplier tubes (PMTs), and other electronically based detectors to document scientific
observations. The major components of a modern state-of-the-art microscope platform used
to conduct research herein are identified in Figure 1.1 and include a light source, filters,
oculars, and an image recorder. The field of microscopy has evolved into a broad class of
microscope based techniques of which only a subset will be included here. The techniques
most relevant to the following studies represented by the following chapters include bright-
field, wide-field, and laser scanning confocal techniques. A brief introduction to these
techniques will be explained below.
Figure 1.1: Labeled components of a modern microscopy platform.

- 4 -
Bright-field microscopy is the natural use of the absorption features of a specimen
illuminated by a white light source to provide contrast for visualization7, 8. The light source is
usually set-up in a transmission configuration, where the light source is located on one side of
the specimen and the objective is located on the other. Although it is the most common
microscopy technique, it is not suitable for all applications of microscopy. Specimens of
interest need to be generally thick and opaque enough to provide contrast, a characteristic not
always exhibited by biological samples. Combining bright-field microscopy with an optical
interference technique, differential interference contrast (DIC), can allow low contrast
samples to be more easily investigated7, 8. In de Sénarmont bias retardation, a type of DIC,
light passes through a series of optics including a polarizer, quarter wave plate, two Nomarski
prisms, and an analyzer in an effort to take advantage of the difference in velocity of
perpendicular and parallel light as it travels through a specimen. Small differences in the
index of refraction within a specimen cause variation in the recombination of light creating
enhanced depth relief. In a de Sénarmont DIC configuration, the polarizer is adjustable to
plus or minus 45°. It is important that the microscope is aligned for Khӧler illumination
(alignment protocol described in Appendix A)7-9. Unlike other contrast techniques such as
phase, DIC has higher resolving power and does not exhibit a halo surrounding the targeted
feature of interest. Although DIC causes depth relief, it is important to note that the relief is
an artifact that is quite useful for contrast applications, but not representative of the true
three-dimensional (3-D) character of a particular specimen7.
Wide-field fluorescence microscopy is a useful technique for imaging fluorescent
specimens using a broad excitation source with a series of filters to excite fluorophores and
collect the emitted photons along the same optical axis8. In the case of wide-field microscopy
configurations, the objective also serves as an effective condenser allowing the high
numerical aperture characteristics of the objective to increase optical resolution. Modern
microscopes are usually configured with filter cubes containing an excitation filter (band-
pass) to allow only a band of light from the broad excitation source to excite the fluorophore
of interest, a dichroic mirror mounted at a 45° angle to the optical microscope, and a barrier
emission filter (band-pass or long-pass) to collect only the corresponding fluorophore
emission7, 8. This convenient method for general fluorescence microscopy applications
allows multiple fluorescent molecules to be probed by just utilizing an appropriate filter
combination. The drawback of this technique is that the entire field of view is surveyed,
which may pose a concern if the fluorophore of interest has a propensity for photo-bleaching
or the specimen is sensitive to constant illumination for extended periods of time.

- 5 -
Laser scanning confocal microscopy (LSCM) is extremely useful technique for
simultaneously imaging multiple fluorescent probes with overlapping spectral features or
thick specimens9-11. The use of a pinhole to block light not in the focal plane of interest
allows sharper imaging with precise z-resolution to be achieved9-11. The use of multiple
lasers with multiple detecting channels allows single wavelength excitation for single
fluorophore control, further eliminating artifacts contributed from fluorophores not in the
spectral region of interest. The laser is scanned over a precise area of the sample, further
reducing degradation from areas outside of the specific region of interest. The emission of
fluorescent molecules is detected through a series of filters corresponding to specific
wavelengths or spectrally through a series of PMTs. The technique of LSCM can be coupled
to DIC and imaged via a transmitted light detector (TLD) for a transmission based image
originating from the laser excitation source9. The use of TLD-DIC is particularly important
for biological imaging and sample registration in regions that have not been fluorescently
labeled.
1.4 Summary of Remaining Chapters
The use of targeted dye-labeling in conjunction with a variety of optical microscopy
techniques will be utilized as a tool to probe environs in material and biomaterial
microenvironments over the course of the next four chapters. Chapter 2 will focus on the
use of targeted fluorescence dyes in synthetic and naturally occurring microenvironments. In
particular, the visualization of the sorting of ordered and disordered phases of lipid mixtures,
the delivery, tracking, and controlled release of nanomaterial payloads in an intracellular
environment, and the precise labeling of multi-component polymer microcapsules will be
investigated. Chapter 3 will explore, for the first time, solvent inclusions trapped within
energetic crystals using a combination of LSCM and fluorescent dye-labeling. Chapter 4
will investigate the use of Hall magnetometry to detect unlabeled target ssDNA on a device
platform with correlated optical read-out from fluorescently labeled ssDNA conjugated
superparamagnetic (SPM) beads. The fluorescent label provides a means to validate Hall
detection and conduct optical based assays to evaluate the practicality of detection protocols
for future point-of-care (POC) applications. The final chapter, Chapter 5, will use a
fluorescently labeled MMPI to probe the real-time interactions with LNCaP-MT1-GFP
expressing cells. The use of targeted dye-labeling coupled to optical microscopy

- 6 -
characterization techniques to investigate a host of interdisciplinary research will be shown to
be a valuable asset in the pursuit of scientific discovery.
- 7 -
CHAPTER 2
IMAGING DISTINCT ENVIRONS IN SYNTHETIC AND NATURALLY
OCCURRING MICROENVIRONMENTS
Portions of this chapter have been previously published in the following articles:
Yuan, J., Hira, S.M., Strouse, G.F., Hirst, L.S. Lipid bilayer discs and banded tubules:
Photoinduced lipid sorting in ternary mixtures. Journal of the American Chemical
Society130, 2067-2072 (2008).
Mason, B.P., Hira, S.M., Strouse, G.F. &McQuade, D.T. Microcapsules with three
orthogonal reactive sites. Organic Letters11, 1479-1482 (2009).
2.1 Introduction
Biological systems are perhaps the most ideal model for the presence of
microenvironmentssurrounded by a much larger matrix. The simplest component of any
living unit is a cell, which can be further broken down into smaller domains such as
organelles12. The nucleus, cytoplasm, plasma membrane, mitochondria, golgi apparatus,
endoplasmic reticulum, lysosomes, and even endosomes are examples of organelles within a
larger more complete biological system that contain unique micron or sub-micron
environments. In particular, these listed microenvironments are home to a host of functions
including the replication and transcription of DNA, the regulation of proteins, ion mobility,
and even small molecule recognition, signaling, and transport12. Attempts at further
understanding these complex microenvironments and their nested processes down to
differences in the spatial locations of single chemical functionalities may lead to a deeper
understanding of lipid sorting, the capability of trackingnanomaterial cellular uptake, and the
ability to create novel microcapsules for catalysis or drug delivery applications.
Examples of vesicles that contain distinctive microenvironments have been the
interest of study in fields ranging from drug delivery to advanced material design. Creating
artificial polymeric vesicles with unique microenvironments that can be optically interrogated
may lead to significant advances in biomaterials for drug delivery. The experiments

- 8 -
described herein, probe the use of targeted dye labeling to monitor smaller environs contained
within larger domains. Using strategically located dye molecules allows the visualization of
lipid mixture sorting13, nanoparticle payload release, and reactive site labeling of polymer
microcapsules14. Whether the vesicles are of natural (endosome) or synthetic in origin
(polymer microcapsule), novel insights into the structure and function of these
microenvironments can be investigated to gain a better understanding and achieve a global
perspective.
Optical microscopy can provide a powerful tool to interrogate giant unilamellar
vesicles (GUVs), which are a model system for how lipid content affects lipid phases. The
synthetic GUV has been widely explored due to micron-scale domain formation and ease of
investigation using microscopy15, 16. Membrane organization at the cellular level is an area of
active research in molecular biology and biophysics17-20. The generation of lipid rafts has a
variety of fascinating biological relevance and implications in endocytosis, cell adhesion, cell
signaling, and ionic and molecular transport20-22.The synthetic study of the coexistence of
multiple lipid phases and degrees of liquid immiscibility allow complex cellular
environments to be minimized with the absence of proteins and other small molecules
detracting from the source of the physical phenomenon21. Hollow lipid tubules have received
recent attention because of striking similarities to GUVs with added geometric confinement
in an effort to mimic transport channels, as well as, micro-reactors, and synthetic templates23,
24. By allowing the photo-oxidation of unsaturated lipids, it has been shown that chain
reactions initiated by singlet oxygen can alter lipid morphology resulting in the presence of
multiple liquid phases with varying domain size13, 22, 25. The photo-induced phase separation
of lipid tubules formed from a ternary mixture can be probed as a model for new biological
materials.
Nanomaterials are ideal candidates for nucleic acid or drug intracellular delivery and
have gained interest over the last decade for the treatment of a variety of disease states26-31.
Confocal microscopy of traceable bio-mimetic transport agents can allow insight into trans-
membrane transport. Optical tracking of the delivery platform allows confirmation that the
deliverable arrived at the intended destination. Nanomaterials based on quantum dots are of
particular interest due to the favorable nanometer size regime for biological applications,
broad excitation with narrow emission characteristics that shift with size for bar-coding
multiple targets, large absorption cross-sections for two-photon tissue penetration, resistance
to photobleaching, rapid ligand exchange for target functionalization, and ease of synthesis32-
41. Although many compositions of quantum dots exist, quantum dots with InP cores are of
- 9 -
particular interest due to reduced toxicity concerns based on animal studies on larger InP
(100-1000 nm)42, 43. The liposomal cellular uptake of water soluble InP/ZnS nanomaterials
using a commercial transfecting agent, Optifect™, will be investigated for future applications
of tracking biological processes and targeted drug delivery.
The release of molecular components from bio-mimetic transport agents can be
followed using microscopy. Biological materials based on Au nanoparticles have been
recently explored as molecular rulers44-48. The Au nanoparticle core provides a universal
energy transfer acceptor for molecular dyes lower in energy than the surface plasmon
resonance scattering transition of the metal nanoparticle. The quenching of fluorescence by
nanometal surface energy transfer (NSET) follows anr-4 distance dependence and has been
recently thoroughly characterized for a plethora of molecular dyes49. While the metal
nanoparticle does not fluorescence, the fluorescence intensity quenching of molecular dyes in
close proximity to the metal nanoparticle can provide a molecular beacon monitoring
approach to track biological processes50-52. The implementation of a molecular beacon to
investigate the DNA release off a Au nanoparticle platform will be investigated as an optical
tool to monitor nanomaterial cellular delivery.
Polymeric microcapsules are synthetic candidates for drug delivery applications due
to the ability to functionalize the outer shell and protect packages internally from outside
environments53. Optical microscopy allows the cellular delivery of materials and subsequent
intra-cellular response to be visualized. The syntheses of microcapsules have been around
almost a century, but recent advancements on synthesis and functionalization have lead to
novel materials for catalysis and drug delivery applications14, 54-60. The use of layer-by-layer
(LbL) microcapsule synthetic strategies has led to a variety of promising biological
applications61. Although the LbL synthetic strategy results in tailored materials, high
throughput synthesis may not be practical. Implementing a rapid synthetic approach based on
emulsion templating methods, the copolymerization of multiple polymers in the formation of
hollow microcapsules with three chemically specific reactive sites will be investigated for
future applications in drug delivery.

- 10 -
2.2Lipid Tubules
2.2.1 Lipid Tubule Preparation
Lipid tubules composed of1,2-Dioleoyl-sn-glycero-3-phosphocholine (DOPC),
(2S,3R,4E)-2-acylaminooctadec-4-ene-3-hydroxy-1-phosphocholine (egg sphingomyelin)
(eSM), and cholesterol in a 1: 1: 1 mol % DOPC/ eSM/ cholesterol ratio were prepared by
using flow assisted rehydration. Fluorescent dyes of 1,2-dipalmitoyl-sn-glycero-3-
phosphoethanol-amine-N-(Lissaminerhodamine B sulfonyl) (ammonium salt) (Rh-DPPE)
(Avanti Polar Lipids) and perylene (Fluka) were added to the lipid mixture at a final amount
of 0.2 mol %. The lipid solution was dip-coated on a clean glass slide in the form of small
droplets. The slide was dried under vacuum for 2 hours creating a lipid film. The lipids were
re-hydrated with 18.2 mΩ cm-1 Milli-Q water or a 100mM sucrose solution. The sample
were covered with a glass coverslip and sealed with vacuum grease. Optical microscopy
characterization of samples was performed within 24 hours of sample preparation.
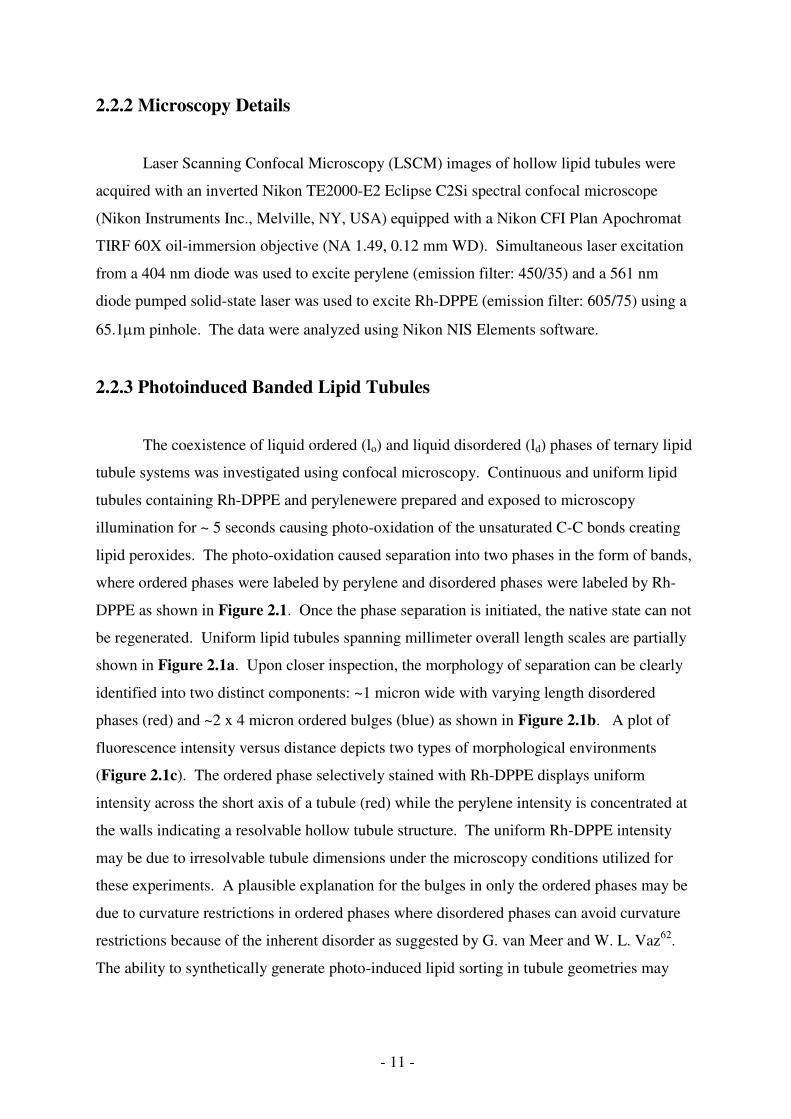
Figure 2.1: Photo-initiated lipid sorting into disordered (red) and ordered (blue) liquid phases (a,b). Line-scan analysis across (b) showing distinct morphological chacteristics for disordered (left, red) and ordered (right, blue) phases(c). Scale bars = 5 µm.
- 11 -
2.2.2 Microscopy Details
Laser Scanning Confocal Microscopy (LSCM) images of hollow lipid tubules were
acquired with an inverted Nikon TE2000-E2 Eclipse C2Si spectral confocal microscope
(Nikon Instruments Inc., Melville, NY, USA) equipped with a Nikon CFI Plan Apochromat
TIRF 60X oil-immersion objective (NA 1.49, 0.12 mm WD). Simultaneous laser excitation
from a 404 nm diode was used to excite perylene (emission filter: 450/35) and a 561 nm
diode pumped solid-state laser was used to excite Rh-DPPE (emission filter: 605/75) using a
65.1m pinhole. The data were analyzed using Nikon NIS Elements software.
2.2.3 Photoinduced Banded Lipid Tubules
The coexistence of liquid ordered (lo) and liquid disordered (ld) phases of ternary lipid
tubule systems was investigated using confocal microscopy. Continuous and uniform lipid
tubules containing Rh-DPPE and perylenewere prepared and exposed to microscopy
illumination for ~ 5 seconds causing photo-oxidation of the unsaturated C-C bonds creating
lipid peroxides. The photo-oxidation caused separation into two phases in the form of bands,
where ordered phases were labeled by perylene and disordered phases were labeled by Rh-
DPPE as shown in Figure 2.1. Once the phase separation is initiated, the native state can not
be regenerated. Uniform lipid tubules spanning millimeter overall length scales are partially
shown in Figure 2.1a. Upon closer inspection, the morphology of separation can be clearly
identified into two distinct components: ~1 micron wide with varying length disordered
phases (red) and ~2 x 4 micron ordered bulges (blue) as shown in Figure 2.1b. A plot of
fluorescence intensity versus distance depicts two types of morphological environments
(Figure 2.1c). The ordered phase selectively stained with Rh-DPPE displays uniform
intensity across the short axis of a tubule (red) while the perylene intensity is concentrated at
the walls indicating a resolvable hollow tubule structure. The uniform Rh-DPPE intensity
may be due to irresolvable tubule dimensions under the microscopy conditions utilized for
these experiments. A plausible explanation for the bulges in only the ordered phases may be
due to curvature restrictions in ordered phases where disordered phases can avoid curvature
restrictions because of the inherent disorder as suggested by G. van Meer and W. L. Vaz62.
The ability to synthetically generate photo-induced lipid sorting in tubule geometries may

- 12 -
lead to novel functional materials and insights on transporter channel properties and lipid raft
function in cellular environments.
2.3Nanomaterials
2.3.1 Microscopy Details
Laser Scanning Confocal Microscopy (LSCM) images of nanomaterials were
acquired with an inverted Nikon TE2000-E2 Eclipse C2Si spectral confocal microscope
(Nikon Instruments Inc., Melville, NY, USA) equipped with a Nikon CFI Plan Apochromat
40X objective (NA 0.95, 0.14 mm WD), condenser (NA 0.52), differential interference
contrast (DIC), and a transmitted light detector. A 404 nm diode was used to excite Hoechst
34580 (emission filter: 450/35), a 488 nm argon ion laser was used to excite InP/ZnS
mercaptoundecanoic acid (MUA) passivated quantum dots (emission filter: 515/30), and a
561 nm diode pumped solid-state laser was used to excite Alexa Fluor® 594 wheat germ
agglutinin conjugate (emission filter: 605/75) using a 33.3 m pinhole.Spectralconfocal (5
nm, resolution) was used to verify that the observed fluorescencewas attributed to the spectral
profile of InP/ZnSMUA quantum dots. Fluorescent microscopy was also carried out on an
inverted Nikon TE2000-E2 Eclipse microscope (Nikon Instruments Inc.) equipped with a
Nikon CFI Plan Apochromat 40x objective (NA 0.95, 0.14 mm WD). Wide-field imaging of
NSET molecular beacon assays utilized an EXFO E-Cite illumination source, a FITC filter
(Chroma, ex: 480/30, DCLP: 505, em: 535/40). Images were acquired on a Photometrics
Coolsnap HQ2CCD camera. Bright-field overlays utilized DIC to observe the differences in
the index of refraction of the samples and provide images of the cells. The data were
analyzed using Nikon NIS Elements software.
2.3.2 Nanomaterial Cellular Imaging
Nanomaterials can be used to track the delivery of biological materials into cells. The
use of InP/ZnS core shell quantum dots are an ideal platform for the delivery of materials into
cells due to the lack of evidence of toxic side effects commonly thought to be problematic in
cadmium based materials42, 43. Core-shell InP/ZnSMUA passivated quantum dots with peak
emission at ~560 nm were transfected into Chinese hamster ovary (CHO) cells at 30%

- 13 -
confluence grown in Dulbecco’s modified eagle medium (DMEM) with non-essential amino
acids using Optifect™ transfecting reagent, a cationic liposome. The role of the cationic
liposome is to encapsulate the nanomaterial target to allow for cell mediated endocytosis.
The transfection was accomplished using published protocols from the manufacturer in the
absence of antibiotics. The uptake of quantum dots from the surrounding media and across
the plasma membrane was investigated after 24 hours of incubation to determine if these
materials are a viable candidate as an optically traceable material delivery platform.
The media containing the nanomaterials in Optifect™ was removed and replaced with
a tris buffered saline (TBS) solution containing (5 µg/ mL of Alexa Fluor® 594 wheat germ
agglutinin conjugate) as a live-cell membrane stain and allowed to react for 1 minute. The
cell membrane stain was removed and washed twice with TBS and replaced with fresh media
for imaging. The use of Alexa Fluor® 594 wheat germ agglutinin conjugate in live
microscopy conditions is ideal for short term studies conducted immediately after staining (<
20 minutes). Initial labeling results in specificity for the plasma membrane. Although, over
time the dye will be endocytosed and lead to Alexa Fluor® 594 based fluorescence artifacts
located within the plasma membrane in addition to the cell surface.
The use of a 488 nm argon ion laser to excite the InP/ZnS quantum dots and overlay
with the differential interference contrast (DIC) image acquired with a transmitted light
detector (TLD) allows the nanomaterials to be visualized in relation to the CHO cells. The
combination of quantum dot excitation with a 488 nm laser and Alexa Fluor® 594 wheat
germ agglutinin conjugate excitation with a 561 nm diode pumped solid state laser allows the
nanomaterial and the cell membrane to be clearly identified as shown in Figure 2.2a-b. Due
to the quantum dot peak emission ~560 nm, the quantum dot signal bleeds into the red
channel. The labeling of the cellular surface with spectrally different fluorescent dye is
critical in determining whether biomaterials have transversed the plasma membrane or solely
lie on the cellular surface. It is important to note, the use of a TLD detector to acquire
transmission based images does not pass through a pinhole and therefore does not provide
good depth resolution. To determine the location of the quantum dot package within the
contents of a cellular environment a series of two-dimensional (2-D) images were acquired
using a small pinhole (33.3 µm) and a step size of 0.250 µm along the z-axis. The series of
discrete 2-D images were compiled and reconstructed to create a three-dimensional (3-D)
image for analysis as shown in Figure 2.2c. The use of a maximum intensity projection
within the Nikon NIS Elements software adjusted all signal acquired from a z-stack and
adjuststo the highest pixel intensity. The 3-D compiled image was rotated 360° across

- 14 -
multiple directions to determine that the InP/ZnSMUA quantum dots are able to be clearly
imaged encapsulated within an internal cellular environment, most likely endosomes, and not
on the cellular surface.
Figure 2.2: LSCM micrographs showing the cellular uptake of InP/ZnSMUA passivated quantum dots using Optifect™ 24 hours post transfection. (a) The TLD-DIC image overlaid with quantum dots (green) and cell membrane stain (red). (b) Quantum dot (green) and cell membrane (red) fluorescence overlaid image. (c) The 3-D reconstruction image of InP/ZnS quantum dots (green) and cell membrane stain (red) overlay. Scale bars = 5 µm.
More advanced nanomaterial microenvironment analysis can be achieved by staining
additional cellular components, such as the nucleus. Although there are numerous DNA
intercalators that selectively stain various grooves of DNA, Hoechst 34580 was specifically
chosen based on the efficient excitation with a 404 nm diode laser excitation source resulting
in predominantly blue emission and a 2-fold fluorescence enhancement upon minor groove
adenine/thymine rich DNA intercalation. Cells were incubated with a TBS solution
containing Hoechst 34580 (5 µg/ mL) for 30 minutes at 37 °C in a 5% CO2 incubator. The

- 15 -
use of three lasers to selectively excite three separate dyes and obtain fluorescence signatures
was utilized to monitor the uptake of InP/ZnSMUA coated quantum dots as shown in Figure
2.3a-b.The 3-D reconstruction of the cell and encased nanomaterial is shown in Figure 2.3c.
Applying an alpha blending projection within the Nikon NIS Elements software takes into
account nearest neighbor pixel intensity to determine the particular 3-D pixel intensity.
Alpha blending is particularly useful for representing surface features. The localization of the
selectively transfected quantum dots (green) is clearly shown contained within the plasma
membrane (red) and not in the nucleus (blue). The static 3-D reconstructed image shown in
Figure 2.3c allows the internalization to be clearly identified within 24 hours of liposomal
incubation and holds promise for applications of stable, optically traceable delivery platform
to cellular microenvironments.
Figure 2.3: LSCM micrographs showing the cellular uptake of InP/ZnSMUA passivated quantum dots using Optifect™ 24 hours post transfection. (a) The TLD-DIC image overlaid with nucleus (blue), quantum dots (green), and cell membrane stain (red). (b) Nucleus (blue), quantum dot (green), and cell membrane (red) fluorescence overlaid image. (c) The triply stained 3-D reconstruction image of InP/ZnS quantum dots (green) and cell membrane stain (red) overlay. Scale bars = 5 µm.

- 16 -
2.3.3NSET Molecular Beacon Assay and Nanomaterial Cellular Transfer
The release of DNA off a nanomaterial platform was investigated using a NSET based
molecular beacon strategy. The proximity based energy transfer assay has been well
characterized for the fluorescence quenching of a series of molecular dyes by Au
nanoparticles49. Although previously published studies utilized 1.5-2.0 nm Au nanoparticles,
larger 5.7 nm Au also can be used to quench molecular dye emission with slightly modified
distant dependent quenching efficiencies. The assay consisted of utilizing a 5.7 nmAu
nanoparticle to efficiently quench the emission of Alexa Fluor® 488 covalently attached to
DNA. The sequences of double-stranded DNA (dsDNA) appended to 5.7 nm Au were
purchased commercially from Midland Certified Reagent Company Inc. are 5'- /SHC6/-GCT
GAT GAC TAT CGA ATT CGG TAG TAG GCG-3' and 5'- /AF488C6/-CGC CTA
CTACCGAATTCG ATA GTCATC AGC-3'. Optifect™ was used as to transfect CHO cells
in DMEM with non essential amino acids at 30% confluence with the DNA labeled Au
nanoparticles analogous to section 2.3.1. The real-time, live-cell Alexa Fluor® 488 labeled
DNA release was detected as an increase in fluorescence intensity with time. The gradual
DNA release off the nanoparticle surface was observed using wide-field fluorescence
microscopy within 1 hr post transfection as shown in Figure 2.4.Micrographs were acquired
at 1, 2, 4, 6, and 12 hours were taken in the same general area of the imaging dish and show
signs of cellular degradation (not shown). The 24 hour time point shows cell elongation
indicative of healthy growth suggesting that 800 µs exposure times over extended periods of
time causes photo-initiated damage. The nanomaterial transfection and subsequent DNA
release was observed to occur within one hour of material transfection. No fluorescence
intensity was observed over the timescale of the experiment for cationic lipsomes prepared
with DNA conjugated nanoparticles in the absence of cells (not shown). Since a transfecting
agent was used, the nanomaterial was taken up by cells through aendocytotic pathway
resulting in punctate packages. The transformation from early to late endosomes involves a
drop in pH and increased levels of glutathione, which is believed to facilitate thiol-based
ligand release as shown by Rotello et al51. Diffuse fluorescence was also observed in the
vicinity of endosomal packages suggesting DNA escape. Large packages of Au can be seen
over the time course suggesting aggregation of the Au nanoparticle following surface
passivated DNA release and subsequent endosomal re-packaging of the nanomaterials over
time due to an osmotic pressure induced perturbation of the endosomal package. Cells that

- 17 -
were transfected while undergoing mitosis were observed to transfer endosomal packages to
newly formed daughter cells as shown in Figure 2.5. This observation has implications on
dosing levels, where cells may be exposed to transfected nanomaterials for extended periods
of time through the slow release of DNA from the surface of the nanomaterial following
package transfer to daughter cells. Further, more extensive studies are currently underway.
Figure 2.4:Wide-field fluorescence micrographs showing the cellular uptake of 5.7 nm Au nanoparticles passivated with fluorescein labeled dsDNA using Optifect™ 24 hours post transfection. (a) The DIC image overlaid with fluorescein fluorescence (green) indicating ligand release. (b)A zoomed in region of (a) depicting fluorescein fluorescence (green) with DIC overlay and fluorescein fluorescence only (green) showing DNA release (punctate) and endosomal escape (diffuse). Scale bar = 50 µm.
Figure 2.5: Wide-field fluorescence with DIC overlaid micrographs showing cellular division and the transfer of DNA released off nanoparticle platform (green) to newly formed daughter cells at 1 hr (a), 2 hr (b), 4 hr (c) and 6 hr (d). Scale bars = 10 µm.

- 18 -
2.4 Synthetic Polymeric Microcapsule
2.4.1 Polymer Microcapsule Formation
Highly cross-linked polymer microcapsules containing a polyureabase structure were
synthesized via a copolymerization of polymethylenepolyphenylisocyanate (PMPPI) and
tetraethylenepentamine (TEPA) in a chloroform and water emulsion. Encapsulating
polychloromethylstyrene (pCMS) and/or polyazidomethylstyrene (pAMS) during the
synthetic process yields a polymer microcapsule with reactive amine functionalities on the
shell and reactive chloromethyl and azidomethyl functionalities encased within the capsule
walls. To ensure that all of the isocyanates were converted to amines, N,N-
dimethylaminopyridine (DMAP) was added. By varying the degree of agitation during the
polymer polymerization, different sized microcapsules can be produced. The amine loading
on the capsule shell was determined to be 0.04 mmol/g amine by treatment with
trifluoroacetic acid anhydride and subsequent elemental analysis. The general synthetic
strategy employed for polymer microcapsule formation is shown in Figure 2.6.
Figure 2.6: Pictorial representation of the synthesis of polyurea based polymer microcapsules. Taken from Mason, B.P., Hira, S.M., Strouse, G.F., McQuade, D.T. Organic Letters 11, 1479-1482 (2009) – Reproduced with permission by the American Chemical Society.
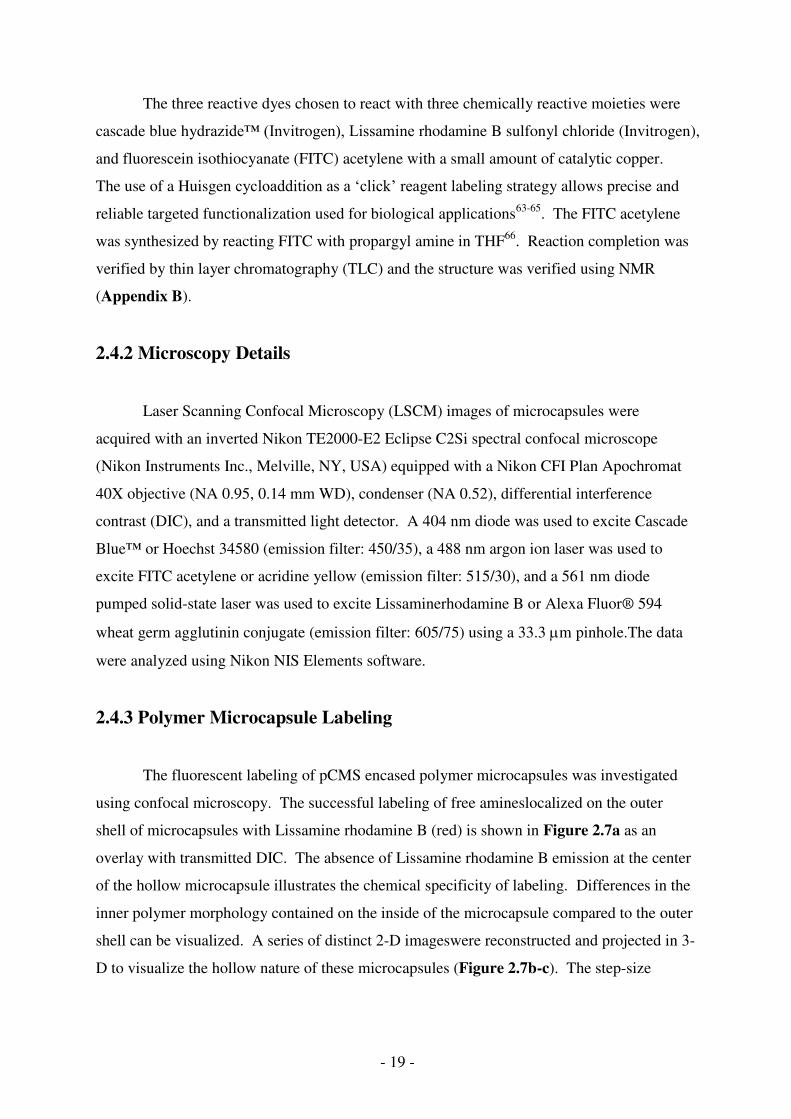
- 19 -
The three reactive dyes chosen to react with three chemically reactive moieties were
cascade blue hydrazide™ (Invitrogen), Lissamine rhodamine B sulfonyl chloride (Invitrogen),
and fluorescein isothiocyanate (FITC) acetylene with a small amount of catalytic copper.
The use of a Huisgen cycloaddition as a ‘click’ reagent labeling strategy allows precise and
reliable targeted functionalization used for biological applications63-65. The FITC acetylene
was synthesized by reacting FITC with propargyl amine in THF66. Reaction completion was
verified by thin layer chromatography (TLC) and the structure was verified using NMR
(Appendix B).
2.4.2 Microscopy Details
Laser Scanning Confocal Microscopy (LSCM) images of microcapsules were
acquired with an inverted Nikon TE2000-E2 Eclipse C2Si spectral confocal microscope
(Nikon Instruments Inc., Melville, NY, USA) equipped with a Nikon CFI Plan Apochromat
40X objective (NA 0.95, 0.14 mm WD), condenser (NA 0.52), differential interference
contrast (DIC), and a transmitted light detector. A 404 nm diode was used to excite Cascade
Blue™ or Hoechst 34580 (emission filter: 450/35), a 488 nm argon ion laser was used to
excite FITC acetylene or acridine yellow (emission filter: 515/30), and a 561 nm diode
pumped solid-state laser was used to excite Lissaminerhodamine B or Alexa Fluor® 594
wheat germ agglutinin conjugate (emission filter: 605/75) using a 33.3 m pinhole.The data
were analyzed using Nikon NIS Elements software.
2.4.3 Polymer Microcapsule Labeling
The fluorescent labeling of pCMS encased polymer microcapsules was investigated
using confocal microscopy. The successful labeling of free amineslocalized on the outer
shell of microcapsules with Lissamine rhodamine B (red) is shown in Figure 2.7a as an
overlay with transmitted DIC. The absence of Lissamine rhodamine B emission at the center
of the hollow microcapsule illustrates the chemical specificity of labeling. Differences in the
inner polymer morphology contained on the inside of the microcapsule compared to the outer
shell can be visualized. A series of distinct 2-D imageswere reconstructed and projected in 3-
D to visualize the hollow nature of these microcapsules (Figure 2.7b-c). The step-size

- 20 -
between 2-D images in Figure 2.7b-cwas intentionally kept larger (1 µm) than the available
z-resolution to create a series of rings to provide additional perception of depth of field.
Figure 2.7: LSCM micrographs showing the selective labeling of Lissamine rhodamine B on the outer shell of polyurea microcapsules with encased pCMS. (a) The TLD-DIC image overlaid with selective microcapsule shell labeling (red). (b-c) The 3-D reconstruction of the polymer shell fluorescent labeling (red) from two different perspectives. Scale bar = 2 µm.
Figure 2.8: The TLD-DIC overlay showing selective labeling of the interior (blue and green) and the shell (red) (a). Strategy for selective microcapsule labeling with three reactive fluorescent dyes (b). Scale bar = 5 µm. Adapted from Mason, B.P., Hira, S.M., Strouse, G.F., McQuade, D.T. Organic Letters 11, 1479-1482 (2009).
2.4.4 Triply Labeled polymer Microcapsules
Simultaneous labeling of all three reactive sites contained on or within the polymer
microcapsule was accomplished by adding all three reactive fluorescent dyes in a 1: 1: 1 ratio
in THF with a catalytic amount of copper and rocked overnight as shown in Figure 2.8. The

- 21 -
microcapsules were washed with DMF until the supernatant was free of unlabeled fluorescent
dye. Additional washes of water, methanol, THF, and diethyl ether were performed and the
product was dried under vacuum. Simultaneous characterizations of all three fluorescent
dyes, along with the DIC overlay, are also shown.
Closer inspection of microcapsule morphology can be evaluated by plotting the
corresponding fluorescence intensity as a function of distance across a microcapsule.
Evidence of labeling specificity solely by chemical functionalityis shown in Figure 2.9. The
cascade blue and fluorescein molecular dyes uniformly labeled the core, while Lissamine
rhodamine B predominately labeled the shell wall resulting in increased intensity over the
capsule shell.The slight amount of cascade blue shell labeling may be due to polymer
emission from the use of a violet, 404 nm, laser source. Further evidence of molecular
specificity can be seen by generating a 3-D reconstruction of the microcapsule and displaying
half the data. The individual components (blue, green, and red) are shown separately and in
combination for clarity in Figure 2.10a-e. Precise morphological defects in the form of
crenation can be clearly seen in the 3-D reconstructed image. The absence of non-specific
chemical labeling outside of the targeted region of interest shows a high level of capsule
control, a characteristic needed for complex biological applications.
Figure 2.9:The selective simultaneous labeling of three spatially separated reactive sites on polyurea microcapsules using cascade blue hydrazide™ (blue), FITC acetylene (green), and Lissamine rhodamine B (red). Line-scan analysis for each image is shown as a plot of intensity with respect to distance across the microcapsule for each individual image. Scale bars = 5 µm. Adapted from Mason, B.P., Hira, S.M., Strouse, G.F., McQuade, D.T. Organic
Letters 11, 1479-1482 (2009) – Reproduced with permission by the American Chemical Society.

- 22 -
Figure 2.10: The 3-D reconstruction images of microcapsules showing the color coordinated morphologies for cascade blue hydrazide™ (blue), fluorescein acetylene (green), and Lissamine rhodamine B (red). Overlays of cascade blue hydrazide™ (blue) with Lissamine rhodamine B (red) and FITC acetylene with Lissamine rhodamine B (red) are shown for clarity. Adapted from Mason, B.P., Hira, S.M., Strouse, G.F., McQuade, D.T. Organic
Letters 11, 1479-1482 (2009).
2.4.5 Cellular Uptake of Microcapsules into Chinese Hamster Ovary Cells
The application of these multifunctional microcapsules with multiple reactive sites
into biological systems may allow for a delivery platform with tailored characteristics for
precise biological applications. One could imagine modifying these capsules by loading
multiple drugs or genetic materials enclosed within the capsule walls, while leaving the
outside native or appending biologically friendly delivery based agents on the outside of the
capsule such as cell penetrating peptides (CPPs) or aptamers67, 68. Experiments described are
preliminary, but focused exclusively on whether a package of considerable size can be
endocytosed by mammalian cells.
Chinese hamster ovary (CHO) cells were utilized for experiments, due in part to their
robustness and accessibility, to determine if microcapsules can transfect across the plasma
membrane. Microcapsules were internally functionalized with acridine yellow by previously
reacting one of the available amines with chloromethyl polystyrene, while the outside
microcapsule shell was maintained in its native state with available reactive amine
functionalities (Figure 2.11a). CHO cells at 30% confluence were incubated with acridine

- 23 -
Figure 2.11: Pictorial reaction labeling of acridine yellow with pCMS encased within polyurea microcapsules (a). LSCM micrographs showing the cellular uptake of acridine yellow microcapsules (green) into CHO cells with a cell membrane stain (red) (b). LSCM micrograph of acridine yellow (green) microcapsules in CHO cell overlaid with a nuclear stain (blue) (c). The 3-D reconstruction image of acridine microcapsule (green) and nuclear stain (blue) showing definitive cellular uptake (d). Scale bars = 5 µm.
yellow functionalized microcapsules for 24 hours. Microscopy analysis shows uptake across
the plasma membrane and into the cytoplasm (Figure 2.11b). Due to the excessive micron
scale size, the microcapsules settle out of solution over time so precise quantification of
uptake was not possible. Those capsules that settle out near cells have the opportunity to be
uptaken into cells via an endocytotic pathway, most likely macro-pinocytosis because of the
large size of the packages. Other known cellular uptake mechanisms such as clatherin or
caveolaemediated endocytosis are not within the same size regime as the micron-sized
polymer capsules. Both cell nuclei staining using Hoechst 34580 and a plasma membrane
stain, Alexa Fluor® 594 wheat germ agglutinin were utilized to ensure that the microcapsules
were located within the plasma membrane and not solely on the cell surface. In addition, z-
stack imaging was performed to reconstruct the material-cell interface in a 3-D fashion to
determine the precise location of the materials in a similar fashion described in section
2.3(Figure 2.11bc). Many microcapsules were washed away indicating that many did not get

- 24 -
endocytosed, but those leftover were located within the plasma membrane as shown in
Figure 2.11b-c. The 3-D reconstruction shown in Figure 2.11dclearly shows the presence of
the acridine yellow stained microcapsule within the plasma membrane and along the nuclear
envelope. Due to the massive size, the nucleus appears to be slightly deformed in shape at
the point of contact between the microcapsule and the nuclear envelope. Acridine
compounds have been shown to intercalate into the structure of DNA69. These preliminary
results suggest that large microcapsules (> 1m) can be taken up by CHO cells without
initially releasing its contents. It is evident from Figure 2.11 that although the microcapsules
are not fully swelled and appear to have significant shape deformation, the exterior
microcapsule walls are still intact.
2.5 Conclusions and Future Directions
The use of targeted dye labeling in conjunction with optical microscopy based
characterization methods has allowed small environs to be probed within much
largerdomains. Whether fluorescent dyes partitioned to ordered and disordered phases of
lipid tubules, nanomaterials encased within CHO cells, or synthetic polymer microcapsules
containing three orthogonal reactive sites, the micron and sub-micron environs can be
selectively probed within larger domains using targeted dye labeling. The extraordinary
specificity of fluorescent molecular dyes and quantum dots to selectively probe environs
containing differences in single chemical functionalities has the potential to compliment and
in specific cases enhance the precise interrogation of microenvironments.

- 25 -
CHAPTER 3
PROBING SOLVENT INCLUSIONS IN ENERGETIC CRYSTALS
USING TARGETED DYE LABELING
Portions of this chapter have been previously published in the following article:
Roberts, C.W., Hira, S.M., Mason, B.P., Strouse, G.F. & Stoltz, C.A. Controlling RDX
explosive crystallite morphology and inclusion content via simple ultrasonic agitation
and solvent evaporation. CrystEngComm 13, 1074-1076 (2011).
3.1 Introduction
Organic energetic materials based on cyclotrimethylene trinitramine, commonly
known as RDX, have been widely used as a major component in many explosive material
formulations including Composition B (60% RDX/40% trinitrotoluene (TNT)), C4 (91%
RDX/9% polyisobutylene), and A5 (99% RDX/1% stearic acid)70. The application of RDX
as a commonly used explosive is due in part to its favorable density for subsequent
detonation velocity and detonation pressure, but its energetic properties are affected by the
quality of crystalline structure70, 71. Recent research has targeted a series of reduced sensitive
versions of RDX for their dominant role in military applications involving insensitive
munitions (IM) for reasons of unintentional detonation in storage, handling, or transportation 72. Combining formulations of RDX with an insensitive surrounding matrix in the form of
plastic-bonded explosives (PBX) has been shown to decrease shock instability over native
RDX providing a safer energetic compound72-74. A number of hypotheses centered on the
source of material instability have been proposed, where the major culprits include internal
crystal defects, surface crystal defects, and particle morphology72, 73, 75-77. Defects, whether
of internal or surface in origin, can be the source of „hot spots‟ during initiation, drastically
changing the material properties75, 78-81. Although the reasons for the reduced shock
sensitivity are debatable, it has been recently shown using small angle neutron scattering
(SANS) that there is a correlation between PBX shock sensitivity and RDX void content82.

- 26 -
Probing structural defects (both surface and internal) in energetic crystals has been
traditionally accomplished using a blend of microscopy-based characterization for qualitative
analysis and complementary mechanical characterization for quantitative analysis.
Microscopy techniques have focused on bright-field microscopy, confocal laser scanning
microscopy, scanning electron microscopy (SEM), atomic force microscopy (AFM), SANS,
and X-ray diffraction70. All of these methods have their advantage and disadvantages
depending on the type of defect and the location of the defect. Although SANS and X-ray
diffraction provide unique chemical information about the uniformity of atoms in a crystal
lattice, high throughput characterization is not feasible and access to such sophisticated
techniques are limited.
The ability to control the amount and location of defects in RDX during the
crystallization process is a major concern. Even though the commercial manufacturing of
reduced sensitivity grades of RDX tends to be proprietary, there have been attempts at
controlling the particle quality, size, morphology, and inclusion content83-85. Studies focused
on altering cooling rates, use of anti-solvents, and the use of sonication during the
recrystallization process have been explored86. Traditional methods controlling the rate of
solvent evaporation or cooling, concomitant with mechanical stirring or agitation of solvent,
leads to a variety of solvent dependent morphologies. Due to the high supersaturation levels
of RDX used under these methods, a large size distribution results from high nucleation and
growth rates. At low saturation levels, variable nucleation leads to irreproducible results.
The use of sonocrystallization to control the crystallization process may provide a way to
induce nucleation at low saturation levels and obtain uniform RDX crystals. More precisely,
the use of ultrasound during the recrystallization causes cavitations in the mother solution
where small voids are formed and violently collapsed84. The cavitations generate localized
areas of supersaturation levels of RDX where nucleation can take place without being at
supersaturation levels throughout the entire volume of solvent. The use of sonocrystallization
in conjunction with tuning the solvent evaporative rates has the potential to improve the
quality of RDX.
The novel use of fluorescent dyes to probe micron and submicron defects during the
recrystallization process of energetic crystals has the potential to eliminate many of the
drawbacks of traditional methods utilized to characterize internal voids while allowing
convenient and rapid characterization. In particular, an additional benefit of using a
fluorescence based characteristic technique allows the sample to be interrogated without the
need to match sample refractive index for background contrast and allow the best resolution

- 27 -
for optical based techniques by ultimately tuning the both the excitation source and the dye
emission towards the violet and blue, respectively. The experiments described herein probe
the crystal morphology and internal inclusion content using microscopy based techniques of
RDX samples prepared using conventional and sonocrystallization strategies87.
Figure 3.1: The chemical structures for cyclotrimethylene trinitramine, known commonly as RDX, (left) and Lissamine rhodamine B sulfonyl chloride (right).
3.2 RDX Recrystallization
Samples of RDX were recrystallized by first dissolving in solvent (acetone or
dimethylformamide) or solvent with 1.3% by mass Lissamine rhodamine B sulfonyl chloride
and allowed to evaporate at 40 °C. The chemical structures of RDX and Lissamine
rhodamine B sulfonyl chloride are shown in Figure 3.1. Solvent evaporation was controlled
by adjusting the size of the opening of the crystallization container to the outside ambient
environment. Agitation of the mother solution was conducted using either sonication using
an ultrasonic bath at a frequency of 40 KHz or mechanical stirring at a rate of 775 rpm.
Samples were stored as a solid in the absence of light until microscopy characterization was
performed.

- 28 -
3.3 Microscopy Details
Optical microscopy characterization using matching index of refraction was carried
out on a Nikon SMZ 1500 stereomicroscope with a magnification of 11.25X and aniline
(nD201.586) as a refractive index matching fluid. Laser Scanning Confocal Microscopy
(LSCM) images of RDX crystals deposited onto a glass coverslip were acquired with an
inverted Nikon TE2000-E2 Eclipse C2Si spectral confocal microscope (Nikon Instruments
Inc., Melville, NY, USA) equipped with a Nikon CFI Plan Apochromat 40X objective (NA
0.95, 0.14 mm WD), condenser (NA 0.52), differential interference contrast (DIC), and a
transmitted light detector. A 561 nm diode pumped solid-state laser was used to excite
Lissamine rhodamine B sulfonyl chloride (emission filter: 605/75) using a 33.3 m pinhole.
Spectral confocal (5 nm, resolution) was used to verify that the observed fluorescence was
attributed to the spectral profile of Lissamine rhodamine B sulfonyl chloride. Wide-field
imaging of the RDX crystals utilized an EXFO X-Cite illumination source at 50% power and
a TRITC filter (Chroma, ex: 540/25, DCLP: 565, em: 620/60). Images were acquired on a
Photometrics Coolsnap HQ2 CCD camera. Bright-field overlays utilized differential
interference contrast (DIC) to observe the differences in the index of refraction of the samples.
The data were analyzed using Nikon NIS Elements software.
3.4 Microscopy Analysis of RDX
Figure 3.2: Optical micrographs of RDX crystals with matching index of refraction fluid (a) and without matching index of refraction fluid (b) showing the presence of internal defects. Adapted from Roberts, C.W., Hira, S.M., Mason, B.P., Strouse, G.F. & Stoltz, C.A., CrystEngComm, 13, 1074-1076, 2011 – Reproduced by permission of the Royal Society of Chemistry.

- 29 -
Internal voids stemming from solvent defects have been traditionally characterized
using optical microscopy with matching refractive index. In order to visualize internal
solvent defects in RDX, the crystals are immersed in aniline (nD201.586) to match the
refractive index of the surrounding crystal and allow the inclusions to be distinguished. A
comparison of RDX crystals using optical microscopy with and without matching refractive
index fluid can be seen in Figure 3.2. Although large inclusions can be easily observed in
Figure 2b, the presence of small defects is not resolvable. The other major drawback of this
technique is that different energetic materials need different fluids to appropriately match the
correct refractive index for each material. This limitation renders formulation analysis
inefficient due to the inability to conduct high throughput microscopic analysis on multiple
types of energetic materials.
Incorporating fluorescently labeled dye molecules into the solvent required for
crystallization allows crystalline defects from trapped solvent inclusions to be identified. The
ability to acquire measurable signal in the absence of substantial background is a desirable
attribute for material characterization that is inherent in fluorescence based techniques. As
shown in Figure 3.3, RDX crystals can be visualized using a combination of bright-field
illumination with DIC and wide-field fluorescence microscopy. The RDX crystal
morphology can be observed in the DIC channel, while the presence of solvent defects can be
observed through a TRITC filter without the need for a matching index of refractive fluid
since the solvent defects will photoluminescence at wavelengths distinct to the fluorophore.
The optical resolution, r, of objects within an image can be theoretically calculated using the
following equation:
( ) , (3.1)
where is the wavelength of light and is the numerical aperture. The bright-field image
shown in Figure 3.3 has a theoretical resolution limit of 978 nm using 550 nm for (mean
wavelength of a tungsten-halogen light source) and a aperture of 0.95 and 0.52 for the
objective and condenser, respectively. In wide-field and other fluorescence techniques in
which the objective serves as both the excitation transmitter and collector a higher the optical
resolution, r, of objects within an image can be calculated using the following equation:
( ) , (3.2)
where the of the objective is solely used. The wide-field fluorescence image shown in
Figure 3.3 has a theoretical resolution limit of 360 nm, where the used to excite Lissamine

- 30 -
rhodamine B sulfonyl chloride sulfonyl chloride was 540 nm. The advantage of utilizing
fluorescence based optical techniques over bright-field clearly allows for higher resolution
data to be realized. A closer inspection of Figure 3.3b-c shows that fluorescence based
techniques can achieve higher resolution, but scattering artifacts from the broad wavelength
excitation source used under wide-field conditions and the crystal face make in-depth
analysis of defects difficult.
Figure 3.3: Optical micrographs of RDX crystals using bright-field DIC and wide-field microscopy techniques. Bright-field DIC and wide-field fluorescence overlay (a), bright-field DIC (b), and wide-field fluorescence (c) visualizing both the RDX crystal morphology (gray scale) and the presence of crystalline defects (red). Scale bars = 50 m.
It has been previously shown in literature that defects in energetic materials can be
observed using confocal laser scanning microscopy by capitalizing on the difference between
laser scattering of the crystal matrix and its defects88, 89. In an effort to increase size and
shape defect resolution from crystal scattering artifacts in Figure 3.3, a fluorescent dye
molecule was investigated to eliminate contributions from scattered light off of the crystal
faces. Coupling the benefits of acquiring signal from an emitting molecule spectrally shifted
from the excitation source with the gained spatial resolution of using a pinhole to eliminate
signal not in the focal plane of interest may significantly enhance current microscopic

- 31 -
characterization specifications. It is clearly shown in Figure 3.4 that the solvent defects in
crystalline RDX shown in Figure 3.3 are much more resolved using LSCM, where the
quantity and the size of defects are more readily observable. The reduction in scattering
artifacts by utilizing a pinhole allow for a more complete picture, where small defects
approaching sub-micron were not previously able to be visualized. This gained resolution
has large implications on the ability to screen batches of energetic materials for even small
amounts of defects that can compromise both the material performance and safe handling.
Figure 3.4: Optical micrographs of RDX crystals using LSCM techniques. TLD-DIC and Lissamine rhodamine B sulfonyl chloride overlay (a), TLD-DIC (b), and Lissamine rhodamine B sulfonyl chloride (c) visualizing both the RDX crystal morphology (gray scale) and the presence of crystalline defects (red). Scale bars = 50 m.

- 32 -
Figure 3.5: Optical micrographs of RDX crystals using TLD-DIC and confocal microscopy techniques. TLD-DIC and Lissamine rhodamine B sulfonyl chloride overlay (a), TLD-DIC (b), and Lissamine rhodamine B sulfonyl chloride, (c) visualizing both the RDX crystal morphology (gray scale) and the presence of crystalline defects (red). An electronic magnification of the same RDX crystal (white box in (a)), where the TLD-DIC and Lissamine rhodamine B sulfonyl chloride overlay (d), TLD-DIC (e), and Lissamine rhodamine B sulfonyl chloride (f) are shown. The spectral confocal profile of the signal acquired in (g) depicts signal originating from Lissamine rhodamine B sulfonyl chloride fluorescence. Scale bars (a-c) = 20 m and scale bars (d-f) = 1 m.

- 33 -
The use of LSCM to probe energetic crystals allows an electronic magnification to be
employed for closer inspection of defects without sacrificing defect resolution as shown in
Figure 3.5. At an objective magnification of 40X and an additional electronic magnification
allows small defects on the order of sub-micron to be visualized. These observable defects
were not observable using either bright-field or wide-field fluorescence microscopy
techniques. The ability to visualize such small defects allows energetic materials to be more
accurately characterized to aide in the development of IM. To ensure that the signal
registered in the confocal microscope originates from Lissamine rhodamine B sulfonyl
chloride and not some other artifact, such as excitation scattering, the intensity profile versus
wavelength was acquired at each pixel and evaluated. The spectral profile for one of the
observable defects in Figure 3.5e clearly demonstrates that the signal is due to the spectral
manifold of Lissamine rhodamine B sulfonyl chloride. Acquiring spectral data is necessary
to validate the observed signal in the respective detector due to scattering or laser diffraction
artifacts. Under some instances of material characterization, the appearance of laser induced
diffraction patterns around inclusions could also be observed as shown in Figure 3.6. The
change in diffraction patterns around the solvent inclusions further validates the measured
fluorescent signal.
Figure 3.6: Laser-induced diffraction patterns can be observed in RDX showing distinct patterns around solvent inclusions. Scale bar = 2 m.
For a more complete picture of the defects found in energetic crystals it is important
to probe the three-dimensional (3-D) defect populations. Since the use of LSCM utilizes a

- 34 -
pinhole to eliminate out of focus light, a series of two-dimensional (2-D) images in the (x,y)
plane can be acquired with discrete steps along the z-axis to access optical information
throughout many focal planes. Multiple 2-D images can be compiled and reconstructed to
form a 3-D rendition for more complete particle characterization and analysis. The resolution
between two objects in a 2-D image is dictated by an airy disk, where the resolution of two
objects in a 3-D image is dictated by a point-spread function. The separation of two objects
is resolvable until one airy disk interacts with more than half of the second airy disk. The
diffraction limited resolution of optical microscopy approaches 200 nm. When comparing
between 2-D and 3-D resolution, the z resolution is always less resolvable. Typically the z-
axis resolution does not exceed 2-3 times the (x,y) resolution for a given specimen. A series
of 2-D images can be compiled to form a z-stack and rendered to build a 3-D image, where
the location and quantity of internal defects found in RDX can be seen as shown in Figure
3.7. The acquired data is shown at two different angles in order to show multiple
perspectives. The elongation in the defects along the z-axis is an artifact attributed to z-
aberration from the reduced resolution. Although slight aberration is observed, the lack of
drastic z-axis fluorescence distortion in the shapes of the defects is quite promising for
applications requiring the overall quality of energetic materials to be evaluated.
Figure 3.7: The 3-D reconstruction of defects within an RDX particle shown in red from two different perspectives.

- 35 -
3.5 Evaluation of Two Distinct Recrystallization Methods of RDX
In an effort to improve the overall quality of RDX, the use of sonocrystallization
during the recrystallization process was evaluated compared to classical stirring
recrystallization methods. Differences between RDX recrystallized from acetone using
mechanical stirring based agitation and ultrasonic agitation are shown using optical
microscopy characterization using matching index of refraction in Figure 3.8. A qualitative
inspection of mechanical stirring agitation data shows a wide size distribution and inclusion
content; while samples prepared using ultrasonic agitation clearly show a small size
distribution with a small amount of internal defects. The rate of solvent evaporation also
plays a major role on the formation of particles of RDX. Figure 3.9 compares RDX prepared
under sonocrystallization conditions with rapid solvent evaporation and slow evaporation. A
clear difference in crystal morphology is observable, where the rapid evaporation of solvent
leads to rough crystals with many solvent defects trapped within the particle. On the contrary,
slow solvent evaporation leads to very smooth and uniform particles with no observable
defects within the detection limits of the microscopy apparatus used in these studies. The
recrystallization of RDX in the presence of ultrasound under slow evaporation conditions
creates an ideal energetic material for IM applications.
Figure 3.8: RDX particles formed using mechanical stirring agitation (a) and ultrasonic agitation (b). Scale bars = 100 µm. Adapted from Roberts, C.W., Hira, S.M., Mason, B.P., Strouse, G.F. & Stoltz, C.A., CrystEngComm, 13, 1074-1076, 2011 – Reproduced by permission of the Royal Society of Chemistry.

- 36 -
Figure 3.9: The formation of RDX particles using sonocrystallization under fast solvent evaporation (a-b) and slow evaporation (c-d), where both the TLD-DIC only (a,c) and the Lissamine rhodamine B sulfonyl chloride only (b,d) images are shown. Scale bars = 20 m. Adapted from Roberts, C.W., Hira, S.M., Mason, B.P., Strouse, G.F. & Stoltz, C.A., CrystEngComm, 13, 1074-1076, 2011.
3.6 Conclusions and Future Directions
The use of fluorescence microscopy techniques to characterize defects in energetic
materials allows for both higher resolution and 3-D characterization. The ability to scatter
particles of RDX onto glass without the need to use an index of refraction matching fluid
allows for the rapid characterization of multiple formulations of energetic materials. The
combination of dark background signal inherent with fluorescence microscopy and increased
resolution of internal defects allows for higher quality materials to be regulated. The
visualization of submicron defects using optical characterization techniques is a major step
forward in energetic characterization. Moreover, the ability to characterize crystals in all
three dimensions makes it possible to understand where these defects are located within the
crystal framework. Future studies comparing crystal size with defect size, quantity, and

- 37 -
location may allow for new insights on the role of “hot spots” on energetic material
properties. In addition to fluorescence based signal acquisition, the use of laser diffraction
may also be used to probe the crystalline inclusions. It has been suggested that the local
environment of Lissamine rhodamine B sulfonyl chloride can affect the energy of the peak
wavelength. A closer investigation on the effect of the location of the defects with changes in
the spectral profile of Lissamine rhodamine B sulfonyl chloride may also provide new
insights into unique environs within a larger macro environment to better understand the
crystal strain present in these materials. It is clear that the use of sonocrystallization
drastically reduces the amount of defects in RDX particles. The adaptation of both the
microscopy characterization and the recrystallization methods described above can
significantly improve the quality regulation of RDX and provide a more uniform energetic
material for its multitude of applications.

- 38 -
CHAPTER 4
DETECTION OF TARGET SINGLE STRANDED DNA USING A
MICRO-FABRICATED HALL MAGNETOMETER
WITH CORRELATED OPTICAL READOUT
Portions of this chapter have been formatted for publication as follows:
Hira, S.M., Aledealat, K., Chen, K., Field, M., Sullivan, G.J., Chase, P.B., Xiong, P., von
Molnár, S., Strouse, G.F. Detection of target ssDNA using a micro-fabricated Hall
magnetometer with correlated optical readout. Manuscript Submitted.
4.1 Introduction
The ability to detect and discriminate specific nucleic acid sequences within a
biological mixture has implications for genome sequencing, bio-warfare target detection, and
the development of an efficient point-of-care (POC) device for pathogen identification90-95.
Through the integration of biology with nanotechnology, a detection platform utilizing
magnetic transduction can capitalize on the high biological specificity of DNA base pairing96,
the scalability of nanotechnology97, the selectivity of self-assembled monolayer technology98,
and the sensitivity of magnetic transduction99, 100. Coupling the extreme sensitivity of Hall
based magnetic detection, which operates over wide magnetic field and temperature ranges,
with the versatility and specificity of DNA base pairing can allow the realization of a new
biological detection strategy that will improve POC diagnostics and subsequent medical
treatment.
In this chapter the detection of a 35-base pair DNA target sequence is demonstrated at
the single-bead level on a Hall magnetometer biosensor. The biosensor is able to identify a
single bead bound to target DNA (35 base pair) and is amenable to the discrimination of
DNA at the 364 pM concentration in 36 M extraneous DNA (< 10ppm). The detection
strategy utilizes three-strand DNA annealing to co-localize a superparamagnetic (SPM) bead
labeled probe strand, a label-free target strand, and a receptor strand at the surface of the Hall
device, which induces a voltage change in the Hall junction due to a change in the stray
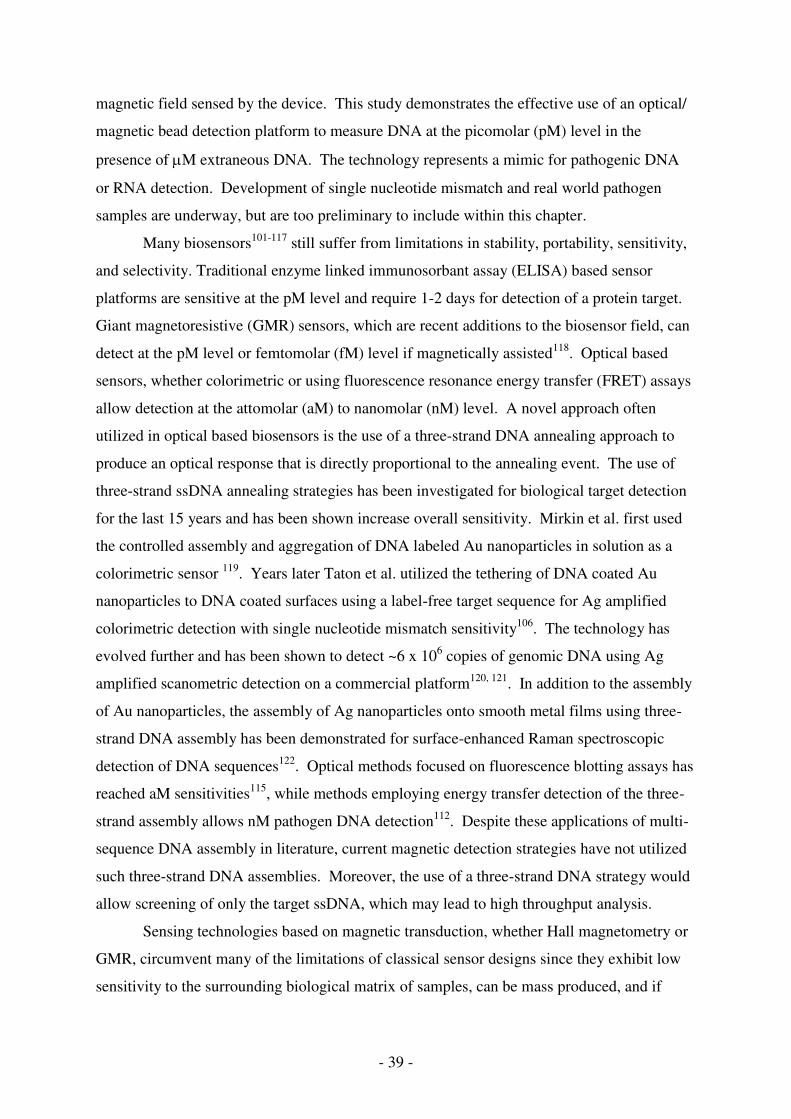
- 39 -
magnetic field sensed by the device. This study demonstrates the effective use of an optical/
magnetic bead detection platform to measure DNA at the picomolar (pM) level in the
presence of M extraneous DNA. The technology represents a mimic for pathogenic DNA
or RNA detection. Development of single nucleotide mismatch and real world pathogen
samples are underway, but are too preliminary to include within this chapter.
Many biosensors101-117 still suffer from limitations in stability, portability, sensitivity,
and selectivity. Traditional enzyme linked immunosorbant assay (ELISA) based sensor
platforms are sensitive at the pM level and require 1-2 days for detection of a protein target.
Giant magnetoresistive (GMR) sensors, which are recent additions to the biosensor field, can
detect at the pM level or femtomolar (fM) level if magnetically assisted118. Optical based
sensors, whether colorimetric or using fluorescence resonance energy transfer (FRET) assays
allow detection at the attomolar (aM) to nanomolar (nM) level. A novel approach often
utilized in optical based biosensors is the use of a three-strand DNA annealing approach to
produce an optical response that is directly proportional to the annealing event. The use of
three-strand ssDNA annealing strategies has been investigated for biological target detection
for the last 15 years and has been shown increase overall sensitivity. Mirkin et al. first used
the controlled assembly and aggregation of DNA labeled Au nanoparticles in solution as a
colorimetric sensor 119. Years later Taton et al. utilized the tethering of DNA coated Au
nanoparticles to DNA coated surfaces using a label-free target sequence for Ag amplified
colorimetric detection with single nucleotide mismatch sensitivity106. The technology has
evolved further and has been shown to detect ~6 x 10⁶ copies of genomic DNA using Ag
amplified scanometric detection on a commercial platform120, 121. In addition to the assembly
of Au nanoparticles, the assembly of Ag nanoparticles onto smooth metal films using three-
strand DNA assembly has been demonstrated for surface-enhanced Raman spectroscopic
detection of DNA sequences122. Optical methods focused on fluorescence blotting assays has
reached aM sensitivities115, while methods employing energy transfer detection of the three-
strand assembly allows nM pathogen DNA detection112. Despite these applications of multi-
sequence DNA assembly in literature, current magnetic detection strategies have not utilized
such three-strand DNA assemblies. Moreover, the use of a three-strand DNA strategy would
allow screening of only the target ssDNA, which may lead to high throughput analysis.
Sensing technologies based on magnetic transduction, whether Hall magnetometry or
GMR, circumvent many of the limitations of classical sensor designs since they exhibit low
sensitivity to the surrounding biological matrix of samples, can be mass produced, and if

- 40 -
configured properly, can offer dynamic, label-free detection in a micro-fabricated scalable
platform123, 124. Magnetic transduction based sensing technologies cover a wide range of
methods including GMR sensors through the use of a spin valves118, 125-129 or bead array
counters (BARCs)130, 131, and Hall based sensors132-137. Already examples of GMR devices
have demonstrated detection of matrix-insensitive proteins at the fM level using a magnetic
transduction based device129 and aM level by adding additional magnetic beads to amplify the
signal138. The use of Hall magnetometry for DNA biosensing could represent the next
generation for magnetic based transduction devices, since a Hall junction is a 4-point probe
device (current, voltage), scalable down to the nanoscale, can be mass produced using
standard photolithography and fabrication methods, displays a linear response through a wide
range of magnetic fields139 with minimal temperature range dependence140, and can operate at
high frequency allowing for phase sensitive detection of the transient fields associated with
SPM nanoscale beads. Hall biosensors may offer a viable alternative to exclusively
fluorescence based microarray technologies for POC applications.
4.2 Experimental
4.2.1 Substrate Fabrication
The 1m2 Hall junction is fabricated into the surface of an epitaxially grown
heterostructure consisting of a GaAs substrate containing an InAs quantum well core supplied
by Teledyne Scientific Company, Thousand Oaks, California, USA. The devices were
fabricated using a combination of photolithography and wet chemical etching. An insulation
layer of SiO2 (60 nm) was sputtered over the entire device surface, followed by a layer of Ti
(5 nm), and deposition of 3 m gold pads (20 nm thick) directly over the protected Hall
junction. A schematic of the layer by layer substrate components is shown in the Figure 4.1.
Registry of the gold pad was accomplished by photolithography using alignment markers in
the photomask. Initial mimics utilized number 1 or 1.5 glass coverslips or SiO2 wafer to
evaluate DNA-bead assembly due to ease of microscopy analysis and availability.
Subsequent mimic microarrays (3 m round patterns and 2 m x 4 m patterns) were
fabricated onto the <100> face of a single crystal GaAs wafer and resembled a more realistic
mimic due to the device composition. Gold evaporation was accomplished immediately prior

- 41 -
to use to limit the contamination of the fresh gold surface from outside sources found in the
ambient atmosphere.
Figure 4.1: The composition of the Hall device heterostructure is shown, where the layers include a GaAs substrate base, layers to reduce lattice mismatches, active layers sandwiched between blocking layers, capping layers, an insulating layer, and the target molecule assembling layer.
Figure 4.2: AFM micrographs of glass substrate mimics. The quality was evaluated based on the presence of artifacts, where a good quality substrate (left) lacks excessive topological features and a poor quality substrate (right) contains excessive topological features.
The overall quality of the patterned mimics or actual Hall device was evaluated prior
to biological assembly using atomic force microscopy (AFM). Micrographs generated by
AFM of two mimic substrates are shown in Figure 4.2 to illustrate successful substrate
patterning (left) and unsuccessful substrate patterning (right). In some cases, the
photolithography process caused large structural artifacts around the photolithography
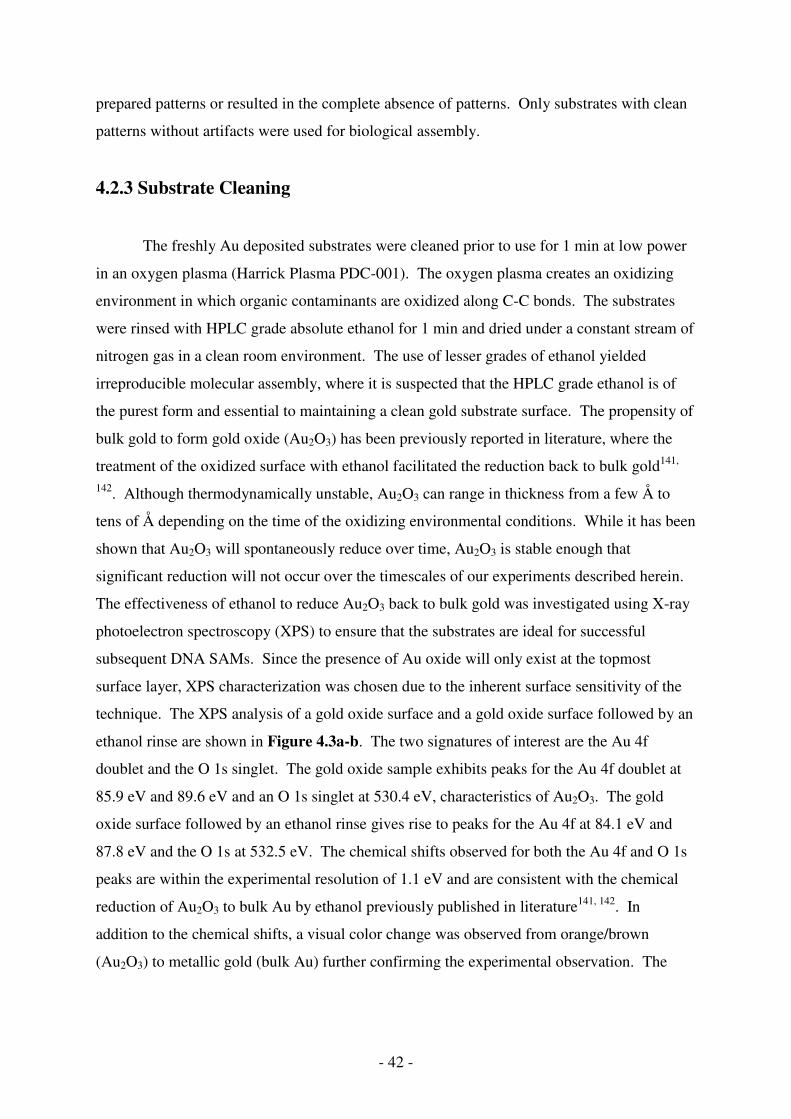
- 42 -
prepared patterns or resulted in the complete absence of patterns. Only substrates with clean
patterns without artifacts were used for biological assembly.
4.2.3 Substrate Cleaning
The freshly Au deposited substrates were cleaned prior to use for 1 min at low power
in an oxygen plasma (Harrick Plasma PDC-001). The oxygen plasma creates an oxidizing
environment in which organic contaminants are oxidized along C-C bonds. The substrates
were rinsed with HPLC grade absolute ethanol for 1 min and dried under a constant stream of
nitrogen gas in a clean room environment. The use of lesser grades of ethanol yielded
irreproducible molecular assembly, where it is suspected that the HPLC grade ethanol is of
the purest form and essential to maintaining a clean gold substrate surface. The propensity of
bulk gold to form gold oxide (Au2O3) has been previously reported in literature, where the
treatment of the oxidized surface with ethanol facilitated the reduction back to bulk gold141,
142. Although thermodynamically unstable, Au2O3 can range in thickness from a few Å to
tens of Å depending on the time of the oxidizing environmental conditions. While it has been
shown that Au2O3 will spontaneously reduce over time, Au2O3 is stable enough that
significant reduction will not occur over the timescales of our experiments described herein.
The effectiveness of ethanol to reduce Au2O3 back to bulk gold was investigated using X-ray
photoelectron spectroscopy (XPS) to ensure that the substrates are ideal for successful
subsequent DNA SAMs. Since the presence of Au oxide will only exist at the topmost
surface layer, XPS characterization was chosen due to the inherent surface sensitivity of the
technique. The XPS analysis of a gold oxide surface and a gold oxide surface followed by an
ethanol rinse are shown in Figure 4.3a-b. The two signatures of interest are the Au 4f
doublet and the O 1s singlet. The gold oxide sample exhibits peaks for the Au 4f doublet at
85.9 eV and 89.6 eV and an O 1s singlet at 530.4 eV, characteristics of Au2O3. The gold
oxide surface followed by an ethanol rinse gives rise to peaks for the Au 4f at 84.1 eV and
87.8 eV and the O 1s at 532.5 eV. The chemical shifts observed for both the Au 4f and O 1s
peaks are within the experimental resolution of 1.1 eV and are consistent with the chemical
reduction of Au2O3 to bulk Au by ethanol previously published in literature141, 142. In
addition to the chemical shifts, a visual color change was observed from orange/brown
(Au2O3) to metallic gold (bulk Au) further confirming the experimental observation. The

- 43 -
XPS data collected provides evidence that an ethanol rinse is essential to ensure for a pristine
bulk gold surface for subsequent molecular self-assembly.
The affect of cleaning methods on the cleanliness of Au films was investigated using
static contact angle measurements. A SiO2 wafer was coated with 5 nm of Ti followed by 20
nm of Au and subjected to a dilute solution of photoresist (1 drop in > 10 mL). The static
contact angle was measured on a KSV contact angle measurement system after substrate
cleaning using three separate methods and after a 15 second dips in a octadecanethiol (ODT)
ethanol solution (3.5 mM). The normal wash method consisted of a 3 minute wash in acetone,
1 minute wash in methanol, and a 1 minute wash in isopropanol. The piranha cleaning
method consisted of a 15 minute wash in freshly prepared piranha solution and copious
amounts of 18.2 mΩ cm-1 water. The final comparative method utilized 1 minute oxygen
plasma under low power, followed by an ethanol rinse. Substrates subjected to all methods
were dried under a constant stream of nitrogen gas. The normal wash resulted in static
contact angles of 52.60° and 71.50° after cleaning and after the ODT dip, respectively. The
piranha cleaned samples resulted in static contact angles of 70.25° and 105.22° after cleaning
and after the ODT dip, respectively. The oxygen plasma cleaned samples resulted in static
contact angles of 91.64° and 111.82° after cleaning and after the ODT dip, respectively. The
data acquired from oxygen plasma cleaned samples followed by an ODT treatment are in
good agreement with literature, validating the cleaning method used142. The effect of the
PEG-silane on the wet ability of the SiO2 surface was also empirically investigated using
static contact angle measurements. It was found that piranha cleaning glass yielded a contact
angle less than 10°, while PEG-silane treatment resulted in a 34° contact angle.
4.2.3 Substrate Passivation
In an effort to reduce the risk of biofouling outside of the deposited Au regions, the
SiO2 surface was passivated by 2-[Methoxy(Polyethyleneoxy)Propyl]-Trimethoxysilane
(PEG-silane) (purchased from Gelest, Inc.)143. 100 µL of PEG-silane was added to 50 mL of
HPLC grade toluene in a clean 50 mL graduated cylinder, followed by 40 µL of concentrated
hydrochloric acid. The cleanliness of the glassware used is critical in the successful
silanization of substrates. All glassware was cleaned with fresh piranha solution (30%
hydrogen peroxide (30% v/v), 70% concentrated sulfuric acid) for at least 10 minutes,
followed by copious amounts of 18.2 mΩ cm-1 water, a final absolute ethanol rinse, and dried

- 44 -
at 115 °C. Caution: Piranha solution is violently reactive and should be handled with
extreme care! Other important notes are as follows: Always add the hydrogen peroxide to the
sulfuric acid when making piranha solution; the solution will become very hot very quickly.
Use piranha solution immediately for best results. Because of the hazards associated with
piranaha solution only make necessary quantities for sufficient substrate cleaning. The PEG-
silane solution was sonicated for 10 minutes and used immediately. It is important to note
that water is produced in the silanization reaction, where a small amount may fall out of the
clear toluene solution since it is denser than toluene. In cases when the silanization solution
was cloudy with a homogenous milky precipitant, the functionalization of samples was
aborted and the preparation of fresh PEG-silane was repeated.
Figure 4.3: X-Ray Photoelectron Spectroscopy (XPS) characterization of the reduction of Au2O3 to bulk Au by an ethanol rinse. The characteristic shifts in the Au 4f (top) and O 1s peaks (bottom) are shown for native Au2O3 and Au2O3 rinsed with ethanol.

- 45 -
Table 4.1: Characteristics of designed synthetic DNA using IDT DNA Oligo Analyzer 3.1.
NAME SEQUENCE1,2 Ɛ,
L∙(mol∙cm)-
1 TM,3 °C
G-C CONTENT, %
∆G Hybridization,
kcal∙mol-1
∆G Homodimer Formation, kcal∙mol-1
Hairpin3 TM, °C
M35BiFAMIII
5'-/5Bio/CGA C/iFLUORdT/G TGA CAA TCT TAG CTG CCG ATA GAG TAG TC-3'
354100 78.6 48.6 -61.46 -6.34 27.6
M35SSIII 5'-RSSR-GAC TAC TCT ATC GGC AGC TAA GAT TGT CAC AGT CG-3'
337500 78.6 48.6 -61.46 -6.34 29
M35SSNon- CompControlIII
5'-RSSR-CGA CTG TGA CAA TCT TAG CTG CCG ATA GAG TAG TC-3'
340400 78.6 48.6 -61.46 -6.34 27.6
M15BiFAMIV 5'-TCA TTC ACA CAC /iFLUORdT/CG /3Bio/-3'
151400 62.9 46.7 -25.19 -3.61 N/A
M20SSIV 5'-/RSSR/ GTC TTG TCT CCT GTC AGC TA-3'
178300 70.6 50.0 -33.29 -6.34 -5.3
M35CompIV 5'-CGA GTG TGT GAA TGA TAG CTG ACA GGA GAC AAG AC-3'
361400 79.1 48.6 -59.96 -6.34 20.5
M35NonCompIV 5'- GTC TAA GAG TGT CCT GGC TAT GAT CCG TGA GTA TG-3'
340800 78.4 48.6 -60.73 -4.62 15.7
1 Modifier Key: /5Bio/ = 5' biotin, /iFLUORdT/ = internal Fluorescein dT, /RSSR/ = 5' C6H12OH disulfide C6H12 Linker 2 AGCT = recognition sequence for ALUI enzyme 3 Based on 20 mM sodium phosphate buffer with 300 mM NaCl at pH 7.0

- 46 -
4.2.4 Synthetic DNA Design
Synthetic DNA oligonucleotides were commercially synthesized (Midland Certified
Reagent Company). The two-strand DNA system consisted of a 5' disulfide modified
complementary receptor sequence 5'- /RSSR/- GAC TAC TCT ATC GGC AGC TAA GAT
TGT CAC AGT CG-3', a 5' disulfide modified non-complementary receptor sequence 5'-
/RSSR/- CGA CTG TGA CAA TCT TAG CTG CCG ATA GAG TAG TC -3', and a 5'
modified biotinlyted probe with an internal fluorescein dT sequence 5'- /BIOTIN/- CGA C -
/iFLUORdT/- G TGA CAA TCT TAG CTG CCG ATA GAG TAG TC -3'. The three-strand
DNA system and consisted of a probe sequence 5'-TCA TTC ACA CAC -/iFLUORdT/- CG -
/3BIOTIN/ -3' labeled with an internal fluorescein dT and biotin, receptor sequence 5'-
/RSSR/- GTC TTG TCT CCT GTC AGC TA -3' with a disulfide modifier, a 35 base pair
unmodified target sequence 5'- CGA GTG TGT GAA TGA TAG CTG ACA GGA GAC
AAG AC -3', and a 35 base pair unmodified non-target control sequence 5'- GTC TAA GAG
TGT CCT GGC TAT GAT CCG TGA GTA TG -3'. The lyophilized DNA was buffer
exchanged using a NAP-V size exclusion column (GE Healthcare) equilibrated with 20 mM
sodium phosphate buffer, 50 mM NaCl pH 7.0. The 5'-/RSSR/- functionality on the receptor
ssDNA consisted of a six carbon spacer, a disulfide, and a hexanol terminus. The 5'-
/BIOTIN/ and the /3BIOTIN/-3' are designed to link with streptavidin coated
superparamagnetic (SPM) nanobeads (350 nm mean size, Bangs Laboratories). The use of
SPM beads allows the beads to remain dispersed in solution due to paramagnetic behavior at
RT until an external magnetic field is applied preserving the native structure and function of
biological targets. The specific linkage of biotin with streptavidin was chosen to conjugate
the DNA to the nanobeads based on its profound binding constant of 1015 M-1 and its high
temperature stability of 112 oC when fully conjugated144. Finally, the -/iFLUORdT/-
modifier is a fluorescein dT on a six carbon spacer internally and covalently bound to a
thymine base. The use of a fluorescent dye was engineered as a component in the device
platform as a redundant optical signature for dual modality readout and serves as a direct
comparator to fluorescent microarray technology. The presence of a fluorophore in the
annealing strategy is completely independent from magnetic transduction based dection and
has no bearing on the measured Hall response. Based on the mean size and binding capacity
of the commercially available SPM nanobeads, each 350 nm magnetic bead contains
approximately 36,000 probe DNA strands, each of which contain a fluorescent marker.

- 47 -
Although it is expected that the dye labeled probe DNA involved in hybridization would not
emit due to energy transfer between the dye and the gold surface, there are tens of thousands
of markers that are outside of the critical distance for energy transfer to occur and are
therefore still observable. The DNA was synthetically designed to base pair to complement
DNA through Watson-Crick base pairing and limit the amount of secondary interactions that
can take place. Sequences were evaluated using IDT DNA Oligo Analyzer 3.1 for molecular
weight, melting temperature (TM), G-C content, extinction coefficient, homo dimer formation,
and hairpin analysis as shown in Table 4.1. Both the two-strand and three-strand DNA
variants were engineered to have a enzyme cut site for ALU1, although it was not utilized for
the experiments described herein. Since enzyme binding sites are palandromic and can
influence homo-dimer formation, the ∆G of each DNA sequence was kept above -9 kJmol-1
during design to minimize the probability of unwanted DNA structures formed at room
temperature.
DNA hybridization was evaluated using a gel shift assay for both three-strand and
two-strand DNA assemblies using native polyacrilamide gel electrophoresis (PAGE) as
shown in Figure 4.4. The change in DNA mobility in the gel caused by sequence length and
structure can be seen for the three-strand (Figure 4.4a) and two-strand (Figure 4.4b)
annealing strategies. The designation of lane contents with numbers for Figure 4.4a are as
follows: (1) visual loading dye not observed under fluorescent excitation, (2) reporter strand
(disulfide 20mer) and complementary target, (3) probe strand (fluorescein labeled 15mer), (4)
reporter and probe strands, (5) probe and complementary target, (6) probe and non-
complementary target, (7) reporter, probe, and complementary target, (8) reporter, probe, and
non-complementary target. The visible bands (3-8) originate from the internal fluorescein
modification on the probe strand and the differences in mobility reflect the assembling of the
three-strand DNA structure. The arrow in (7) signifies the three-strand DNA product, and the
band immediately below is most likely attributed to the probe annealed to the complementary
target. The designation of lane contents with numbers for Figure 4.4b are as follows: (1)
probe strand (fluorescein labeled 35mer), (2) complementary reporter and probe strands, (3)
non-complementary reporter and probe strands. The visible bands (1-3) originate from the
internal fluorescein modification on the probe strand and the differences in mobility reflect
the assembling of the two-strand DNA structure. Figure 4.4 clearly demonstrates the
successful assembly of the two-strand and three-strand DNA architectures at room
temperature. Although annealing does not continue to completion, the presence of a
detectable quantity of product was observed.

- 48 -
Figure 4.4: Native polyacrylamide gel electrophoresis characterization for the three-strand DNA assembly in the absence of nanobeads showing different mobilities of (1) visual loading dye not observed under fluorescent excitation, (2) reporter strand (disulfide 20mer) and complementary target, (3) probe strand (fluorescein labeled 15mer), (4) reporter and probe strands, (5) probe and complementary target, (6) probe and non-complementary target, (7) reporter, probe, and complementary target, (8) reporter, probe, and non-complementary target (a). The visible bands (3-8) originate from the internal fluorescein modification on the probe strand and the differences in mobility reflect the assembling of the three-strand DNA structure (a). The arrow in (7) signifies the three-strand DNA product, and the band immediately below is most likely attributed to the probe annealed to the complementary target (a). Native polyacrylamide gel electrophoresis characterization for the three-strand DNA assembly in the absence of nanobeads showing different mobilities of (1) probe strand (fluorescein labeled 35mer), (2) complementary reporter and probe strands, (3) non-complementary reporter and probe strands (b). The visible bands (1-3) originate from the internal fluorescein modification on the probe strand and the differences in mobility reflect the assembling of the two-strand DNA structure (b).
4.2.5 DNA Immobilization and Hybridization
The receptor DNA (not previously reduced) was incubated on top of the device for 6
hrs, in an enclosed incubation chamber containing a supersatured NaCl solution for humidity
stabilization, in the form of a 50 µL droplet at a DNA concentration of 9 µM. The device

- 49 -
was immersed in 5 mL of 18.2 mΩ cm-1 H2O containing 0.1% Tween-20 (v/v), twice in 5 mL
of 18.2 mΩ cm-1 H2O to rinse and remove unbound sequences of DNA, and dried under a
constant stream of nitrogen gas. It is interesting to note that both not pre-reducing the
disulfide modification before self assembly and later not reacting the surface with 6-
mercaptohexanol did not hinder subsequent DNA hybridization as previously reported in
literature for free thiols96, 145. The subsequent successful DNA hybridization may be
attributed in part to the carbon-carbon packing of the carbon spacer or to the steric hindrance
caused by the hexnanol terminus to effectively separate the immobilized DNA to allow
sufficient space for DNA base pairing. The reporter DNA was bio-conjugated to the SPM
nanobead (350 nm mean size, Bangs Laboratories) through a biotin-streptavidin linkage at 30 C for 1 hr. The DNA-nanobead conjugate was purified away from free DNA using
magnetic separation and washing the sample 5 times with 20 mM sodium phosphate buffer,
300 mM NaCl pH 7.0. The three-strand DNA strategy included a pre-conjugation step of the
target DNA to the probe DNA-SPM conjugate at 80°C and allowed to slowly cool over 1 hr.
Unbound nucleic acids were purified away using magnetic separation. The hybridization
assay was carried out by incubating a 25 µL droplet of target biotinlyted DNA (7 M) bound
to streptavidin coated SPM beads for 2 hrs in an enclosed incubation chamber containing a
super saturated NaCl solution. The device was washed once in 5 mL of 20 mM sodium
phosphate buffer with 300 mM NaCl at pH 7.0 containing 0.1% Tween-20 (v/v), twice in 5
mL of 20 mM sodium phosphate buffer with 300 mM NaCl at pH 7.0, and stored in of 20
mM phosphate buffer with 300 mM NaCl at pH 7.0 and protected from ambient light. The
assembly of two-strand and three-strand ssDNA strategies on GaAs mimics is shown in
Figure 4.5. In both strategies employed, the complementary ssDNA (Figure 4.5a,c)
annealed on the substrates and gives rise to a green fluorescence signature in a patterned
array. In the presence of non-complementary ssDNA (Figure 4.5b,d), no assembly and thus
no pattern occurs. For further scanning electron microscopy (SEM) analysis and Hall
detection the substrates are immersed in a 300 mM sodium acetate solution for 5 minutes and
dried under a constant stream of nitrogen gas over a NdFeB magnet. The use of sodium
acetate is crucial to maintaining clean surfaces deplete of crystalline salts.

- 50 -
4.2.6 Microscopy Details
Fluorescent microscopy was carried out on an inverted Nikon TE2000-E2 Eclipse
microscope (Nikon Instruments Inc.) equipped with a Nikon CFI Plan Apochromat 40X
objective (NA 0.95, 0.14 mm WD). Wide-field imaging of the substrates utilized an EXFO
E-Cite illumination source, a FITC filter (Chroma, ex: 480/30, DCLP: 505, em: 535/40).
Images were acquired on a Photometrics Coolsnap HQ2 CCD camera. Bright-field overlays
utilized differential interference contrast (DIC) to observe the differences in the index of
refraction of the samples. The data were analyzed using Nikon NIS Elements software.
Scanning electron microscopy (SEM) was carried out on a FEI Nova 400 Nano SEM and
utilizing a through-the-lens (TLD) detector. Samples were imaged natively without a
conductive coating. Charging of the samples is evident because the substrates contain
magnetic beads and consist of patterened Au (conductor) on SiO2 (insulator). Artifacts due to
charging were limited by using an excitation of 1 keV. The SEM images were acquired using
a 32 scan average to obtain the clearest data.
Figure 4.5: The assembly of two-strand (a-b) and three-strand (c-d) ssDNA strategies, where green fluorescence indicates the location of the SPM conjugated nanobeads. The complementary sequence (a,c) results in assembly and the non-complementary sequence (b,d) does not result in assembly. Scale bars = 50 m.
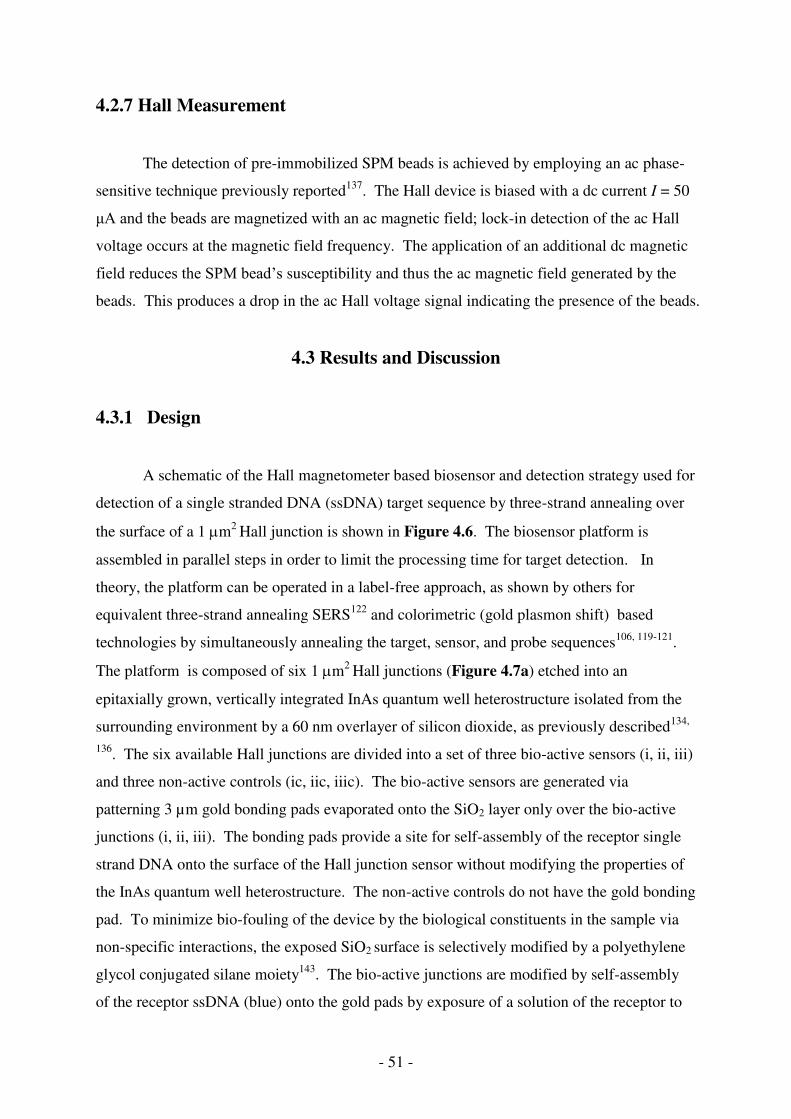
- 51 -
4.2.7 Hall Measurement
The detection of pre-immobilized SPM beads is achieved by employing an ac phase-
sensitive technique previously reported137. The Hall device is biased with a dc current I = 50
μA and the beads are magnetized with an ac magnetic field; lock-in detection of the ac Hall
voltage occurs at the magnetic field frequency. The application of an additional dc magnetic
field reduces the SPM bead’s susceptibility and thus the ac magnetic field generated by the
beads. This produces a drop in the ac Hall voltage signal indicating the presence of the beads.
4.3 Results and Discussion
4.3.1 Design
A schematic of the Hall magnetometer based biosensor and detection strategy used for
detection of a single stranded DNA (ssDNA) target sequence by three-strand annealing over
the surface of a 1 m2 Hall junction is shown in Figure 4.6. The biosensor platform is
assembled in parallel steps in order to limit the processing time for target detection. In
theory, the platform can be operated in a label-free approach, as shown by others for
equivalent three-strand annealing SERS122 and colorimetric (gold plasmon shift) based
technologies by simultaneously annealing the target, sensor, and probe sequences106, 119-121.
The platform is composed of six 1 m2 Hall junctions (Figure 4.7a) etched into an
epitaxially grown, vertically integrated InAs quantum well heterostructure isolated from the
surrounding environment by a 60 nm overlayer of silicon dioxide, as previously described134,
136. The six available Hall junctions are divided into a set of three bio-active sensors (i, ii, iii)
and three non-active controls (ic, iic, iiic). The bio-active sensors are generated via
patterning 3 µm gold bonding pads evaporated onto the SiO2 layer only over the bio-active
junctions (i, ii, iii). The bonding pads provide a site for self-assembly of the receptor single
strand DNA onto the surface of the Hall junction sensor without modifying the properties of
the InAs quantum well heterostructure. The non-active controls do not have the gold bonding
pad. To minimize bio-fouling of the device by the biological constituents in the sample via
non-specific interactions, the exposed SiO2 surface is selectively modified by a polyethylene
glycol conjugated silane moiety143. The bio-active junctions are modified by self-assembly
of the receptor ssDNA (blue) onto the gold pads by exposure of a solution of the receptor to

- 52 -
the Hall junction platform (Figure 4.6-I), and subsequent washing to remove unbound DNA.
The fluorescein labeled probe ssDNA sequence (red) is pre-appended to the SPM bead
platform via streptavidin-biotin conjugation (Figure 4.6-II).
Figure 4.6: Generalized schematic for the detection of label-free target DNA using Hall magnetometry. The label-free target DNA (black) is detected by immobilization at the Hall device via complementary base pairing with receptor DNA (blue) pre-assembled on the Hall device surface to additional complementary probe DNA (red) with an internal fluorescent marker pre-conjugated to the surface of a magnetic nanobead resulting in a detectable Hall signal. Nanobead is not drawn to scale.

- 53 -
Prior to the detection of the target DNA sequence (black), the probe strand and the
target strand are pre-hybridized (Figure 4.6-III). The detection of the target DNA is then
accomplished by annealing the SPM bead-probe-target complex with the receptor sequence
(blue) pre-assembled at the surface of the Hall device platform at room temperature (Figure
4.6-IV). The assembly of the three-strand sequence requires 3 hr, which is equivalent to
standard FRET, plasmonic, GMR and SERS based detection scenarios, but far faster than
optical chip techniques that can require 16-24 hrs to achieve hybridization. Although the
simultaneous addition of all three ssDNA components is experimentally feasible, stepwise
assembly allowed the added benefit that the observed signal is not artificially enhanced by
non-specific, non-DNA bound SPM beads. All unbound nucleic acid species and nucleic
acid labeled SPM beads are removed by magnetic separation prior to final three-strand DNA
assembly and washed prior to Hall detection. The strategy allows the specific binding event
at the electrically isolated gold pad to induce a direct voltage response in the device without
altering the device properties directly, as would be observed in SPR based devices. The
stepwise, parallel strategy allows convenient concentration amplification for the target
ssDNA from extraneous DNA fragments. The overall performance of a biosensor is reflected
in the ability to discriminate binding, the limit of detection of binding, and the fidelity of
binding as described below.
4.3.2 Detection
In Figure 4.7 the detection of the 35-bp target on the dual optical/ Hall device senor is
shown for a 25 L droplet containing 7 µM DNA. The specificity of the assembly of the
three-strand DNA complex onto the gold pad (grey circle) over the Hall junction is clearly
observed in the wide-field fluorescence overlaid with differential interference contrast (DIC)
micrograph (Figure 4.7a). The observed green photoluminescence in Figure 4.7a arises
from the fluorescein label on the probe strand and requires the three strand annealing process
to occur in order for the probe to be optically detectable. The lack of non-specific binding of
the probe to regions outside of the gold pad region confirms the specificity of the three-strand
assembly protocol. The specificity of the assembly on the gold pads is further confirmed by
comparing the optical micrograph (Figure 4.7a) and the scanning electron micrograph
(Figure 4.7b, Figure 4.8). Scanning election microscopy (SEM) imaging of junction (iii)
indicates ~73 beads are present on the 3 µm gold pad. Inspection of the DIC image of

- 54 -
junction (iii) (Figure 4.7a) reveals the registry between the underlying Hall junction in the
SEM image (Figure 4.7b, grey box) and the gold pad on the surface of the Hall
magnetometer results in only ~12 nanobeads being positioned directly or partially over the
active area of the Hall junction.
Figure 4.7: Optical microscopy characterization (wide-field fluorescence and DIC overlay) of three-strand DNA assembly is shown by the presence of green fluorescence indicating the presence of probe DNA (a). SEM was used to evaluate the location and to quantify the number of nanobeads contributing to the Hall response for (iii), where the grey box designates the location of the underlying Hall junction (b). Hall responses for three active junctions (i, ii, iii) and a single control junction (iiic) are plotted as Hall voltage offset versus time; the presence of nanobeads over the active Hall junctions results in a drop in Hall voltage when a dc magnetic field is applied (c). The theoretical device signal stemming from a single 344 nm SPM bead is shown to the right as a function of position over the Hall junction further illustrating the local sensitivity of Hall magnetometry (d). Scale bars = 2 m in panels a,b.

- 55 -
Figure 4.8: SEM micrograph depicting label-free, three-strand DNA assembly of all six junctions of a Hall magnetometer (a). Scale bar (a) = 10 m. SEM micrographs at higher magnification of the three active Hall junctions, where the ratio of beads entirely or partially over the Hall junction versus beads outside of the junction are (b) 8/41, (c)11/68, and (d) 12/73. Scale bars (b-d) = 1 m. Hall responses for three active junctions (i, ii, iii) and three non-active control junction (ic, iic, iiic) are plotted as Hall voltage versus time; the presence of superparamagnetic (SPM) nanobeads over the active Hall junctions results in a drop in Hall voltage when a dc magnetic field is applied (e). When the dc magnetic field is removed the signal returns to baseline (e).

- 56 -
For detection of the DNA annealing event, the presence of the SPM bead is measured
as a change in voltage by the use of both an ac and dc magnetic field. The use of both ac and
dc fields allows for the binding event signal to be cleanly isolated by using lock-in detection.
In the absence of the external dc field, no signal is detectable in the Hall junction. The ac
magnetic field of 3.76 mT at 93 Hz is used to induce magnetization of the SPM nanobeads.
The 70.6 mT dc magnetic field (NdFeB) is applied perpendicular to the Hall junction to shift
the magnetization of the nanobeads to lower susceptibility as given by the expression , where is the change in the ac magnetization before and after the dc field was
applied. The Hall sensor was operated in constant current mode with an applied dc current of
50 A.
The voltage response to binding of the target sequence with the pre-appended probe
and 350 nm magnetic bead to the receptor strand on single active junction and a single
control junction are shown in Figure 4.7c. The voltage response for all junctions and
controls are shown in Figure 4.8. The voltage across the control junction (iiic) is 0 + 0.03
V. The successful assembly of ssDNA over the active Hall junctions (i, ii, iii) results in a
sharp drop in measured Hall voltage for all three active sensor elements. The Hall voltage
measurements are 0.79 V (Signal/Noise (S/N) 40), 0.55 V (S/N 28), and 0.78 V (S/N 39)
for (i, ii, iii), respectively. In Figure 4.7, the observed step function is generated by the
application and removal of the external dc magnetic field in the presence of the small ac field
to allow lock-in detection. The standard deviations in signal or noise levels for all junctions
(i, ic, ii, iic, iii, iiic) is < 0 + 0.04 V on average in the presence and absence of the applied dc
field as shown in Figure 4.8. The standard deviations were calculated from the entire
acquired signal from control junctions and separated signals from active junctions, where the
dc on signal was analyzed separately from the dc off signal acquired before and after the dc
magnetic field was applied.
To analyze the voltage change per binding event, the number of beads per Hall
junction must be assessed. In Figure 4.7b and Figure 4.8, the SEM micrographs indicate the
presence of 41 beads on junction (i), 68 beads on junction (ii) and 73 beads on junction (iii).
In Figure 4.8, the voltage response for the three pads is similar regardless of the number of
beads bound at the center of the Hall junction. The largest expected voltage change in the
Hall magnetometer will occur for beads directly over the Hall junction, falling rapidly for
beads positioned > 0.5 m from the device center (Figure 4.7d). Directly over the Hall
junction (shaded region Figure 4.7b) junction (i) has 8 beads, junction (ii) has 11 beads and

- 57 -
junction (iii) has 12 beads. Calculation of the predicted voltage response as a function of the
distance of the bead from the center of the Hall junction is shown in Figure 4.7d. For a
single 350 nm magnetic bead approximately 272 nm from the Hall device a voltage response
of 0.4 V per bead is expected. The experimental value of ~0.6 – 0.8 V measured in Figure
4.7c following DNA annealing of the target and probe indicates that more than one bead, but
not all of the bound beads contribute to the measured Hall voltage. For junction (iii), the
result suggests the measured voltage is likely dominated by the 12 beads directly over the
center of the Hall junction (southeast corner of the pad in Figure 4.7d). Based on the
theoretical voltage and the observed voltage in response to DNA annealing in Figure 4.7c, a
single bead should be detectable.
Figure 4.9: Sequence-specific two-strand DNA assembly and subsequent Hall detection of a single 344 nm nanobead. (a) Pictorial representation of two-strand DNA assembly, where the probe DNA (red) is complementary to the receptor DNA (blue). Hall response data for the active (iv) and control Hall junction (ivc) plotted as Hall voltage versus time, where the drop in Hall voltage corresponds to the presence of a magnetic nanobead (b). SEM was used to confirm only one nanobead contributed significantly to the signal measured in (iv) (c). Scale bar = 2 m.

- 58 -
Figure 4.9: The theoretical Hall device cross-sectional response for a single 344 nm SPM bead as a function of position from the center of the junction, where red indicates strongest change in voltage, aqua indicates weakest voltage change, and blue indicates a negative voltage readout. The standard deviation of the noise floor for the device is outlined in black for reference.
4.3.3 Sensitivity
Although magnetic transduction devices are remarkably sensitive with the observation
of single bead detection for a < 500 nm magnetic bead reported for an antibody-antigen
sandwich assay based assembly of a magnetic bead on a micron sized Hall device136 and the
multiple bead detection by GMR device128, the report of three-stand DNA target detection at
the single magnetic bead detection by a Hall device has not been reported to date. Single
bead detection is observed for a 35-base pair DNA annealing event onto a Hall device, as
shown in Figure 4.9. The Hall voltage response (Figure 4.9b) and corresponding SEM
image (Figure 4.9c) for the two-strand annealing event (Figure 4.9a) indicates a voltage of
0.34 + 0.03 µV (0 + 0.04 µV for control junction) for the two observed beads near the Hall
junction. The theoretical response for a single bead over the Hall junction in Figure 4.9 can
be calculated by first fitting the voltage data obtained in Figure 4.9b to obtain the following
equation:

- 59 -
∬ ( ) ( ) , (4.1)
where = the measured voltage, and are coordinate distances. Solving the equation
yields 0.34 µV in agreement with experimental. The equation can be modified to predict the
voltage at the origin by the following equation:
∬ ( ) ( ) , (4.2)
where the coordinates are at the origin. Solving the above equation yields a
predicted 0.39 µV at the origin. The above equation can also be solved to predict the voltage
readout as a function -distance away from the origin as shown in Figure 4.10,
where a red color on the third axis represents a SPM particle positioned at the center of the
device, while a blue color represents a SPM outside the detectable range of the Hall junction.
The complete calculations are shown in detail in Appendix C. The measured voltage in
Figure 4.9 is consistent with the theoretical value for a single bead, and therefore it is
believed that the measured Hall voltage reflects only one of the two beads, since only one of
the beads lies within the red zone for the theoretical plot (arrow in Figure 4.9c).
Improvement of the signal to noise can be achieved by operating the Hall device at higher
frequencies; however, it is important to note that the sensitivity of the device can clearly
distinguish a single bead binding event from the noise floor by an order of magnitude at the
external frequency utilized.
4.3.4 Selectivity and Detection Limits
The limit of detection for DNA in a real sample will reflect the length of DNA
(annealing temperature), the sequence of target DNA, and the concentration of DNA present
in a milieu of non-target DNA. In the Hall device platform, similar levels should be
achievable since the technology is identical. Since the sensitivity will be influenced by the
bead size, and the area of the transduction platform, the concentration limit of detection for
target DNA was assessed using optical microscopy analysis of the binding of the target DNA
onto 2 x 4 m patterned GaAs Hall device mimics.
The thermodynamic stability of the three-strand DNA approach has been used for
several sensor approaches, including optical, SERS, and colorimetric platforms. In the
current study the stability of the three strands is experimentally verified using a gel shift

- 60 -
assay (Figure 4.4). In Figure 4.11a-b, the binding of the 35-base pair 3-strand target with
the appended fluorescently labeled probe sequence and 350 nm magnetic bead to the optical
mimic is shown. Inspection of a line-scan for the fluorescence intensity from the probe
sequence shows good correlation with the Hall mimic patterns (Figure 4.11b). The signal
fluctuations do not indicate single bead response as the fluorescein intensity depends on the
particle size, number of DNA, labeling efficiency, and focal plane of the microscopy image.
Little intensity is observed over the control PEGylated regions surrounding gold pads
(identified with black arrows). The discrimination level approaches 10,000 counts above
background for selective target DNA binding at the gold pads in buffered solution (Figure
4.5, Figure 4.11a).
Figure 4.11: Three-strand DNA assembly on a mimic array (patterned on a GaAs substrate) for (a) complementary target only and (c) 10 ppm target in non-target DNA. The inlays in the lower left of (a) and (c) are an enlarged portion of (a) and (c), respectively. Scale bars = 50 m. A line-scan of the wide-field fluorescence microscopy image in (a) showing fluorescein-labeled probe DNA (green) and DIC (black) intensity correlates fluorescence intensity with nanobeads located primarily over gold pads, where the black arrows signify the presence of a small number of non-specifically bound nanobeads (b).
An important measure of device performance is the ability to discriminate target
ssDNA in the presence of extraneous (non-complementary) sequences in solution,
particularly at low levels of target DNA. The ability to discriminate target DNA in the
presence of non-target sequences was analyzed by optical microscopy on 3 m patterned
GaAs Hall device mimics in a buffered solution. Since the sensitivity of the device was

- 61 -
demonstrated to achieve a single bead detection limit (0.34 V vs. 0 + 0.04 V noise floor) ,
the choice of an optical mimic to only probe fidelity over a Hall junction allows analysis of
the limit of detection for the three-strand annealing process. The presence of fluorescently
tagged nanobeads was observed at a concentration of 364 pM target DNA, which corresponds
to less than two complementary target DNA sequence per 350 nm nanobead (Figure 4.11c),
in a solution containing 36 M non-target DNA. The measurements equate to detection at
the 10 ppm level target. Comparison to a mimic array in which the receptor strand is non-
complementary to the target strand indicates non-specific DNA binding is not observed
(Figure 4.5). Although no real biological sample was analyzed, the sensitivity of the device
has demonstrated for the first time the detection of a single SPM nanobead specifically
assembled via complementary DNA base pairing over a Hall junction suggesting the
technology holds substantial promise.
4.4. Conclusions and Future Directions
The device strategy utilizing three-strand DNA assembly on a Hall magnetometer
provides a detection platform with high specificity, low limit of detection (single bead), and
very high fidelity. Sensitivity of the Hall biosensor is attributable to the properties of the Hall
junction and is dependent on the size of the Hall junction, the frequency of the ac field
oscillation, the moment of the SPM bead, and the distance of the SPM bead from the Hall
junction. In the nanotechnology device, the use of a SPM nanobead does not hinder the
specificity of Watson-Crick base pairing for the target nucleic acid as evidenced by sequence-
specific DNA hybridization (Figure 4.5, Figure 4.11). At the frequency detection employed
for the Hall device, the 3-D plot in Figure 4.10 indicates sensitivity towards longer DNA or
more complex architectures is achievable even up to distances approaching 0.9 m when the
SPM bead is located directly over the center of the Hall junction. Higher frequency
measurements will decrease the noise levels and therefore increase the sensitivity of the
device to the magnetic bead position.
We have demonstrated the successful use of Hall magnetometry to detect a 35-base
pair target DNA at the single magnetic nanobead level. Additional studies reaching single
nucleotide polymorphism (SNP) detection limits are currently under investigation. Reduction
of the dimension of the gold pad and improved registry, as well as bead homogeneity, will
improve the overall device performance allowing Hall magnetometry to improve POC

- 62 -
diagnostics. Although the demonstrated Hall platform exhibits single 350 nm bead
sensitivity, further optimizing the minimum bead concentration necessary for assembly will
ultimately reduce the overall target ssDNA detection limit. Extrapolation of the device to a
microarray of selectively labeled Hall sensors could represent a transformative biosensor
platform. The parallel Hall device strategy could allow multiple DNA sequences to be
simultaneously detected in a biological matrix since each magnetic bead and probe strand can
be bar-coded by dye photoluminescence115 and SPM bead size, since the response will be
proportional to the SPM moment. Alternatively, the receptor DNA on the Hall junction can
be selectively dip-penned for multi-sequence analysis146. By eliminating concerns associated
with sample amplification92 such an array would allow screening for nucleic acid targets of
biomedical interest such as pathogens, or disease-related mutations147, 148.

- 63 -
CHAPTER 5
LIVE-CELL OPTICAL TRACKING OF A NOVEL DYE-LABELED
MATRIX METALLOPROTEINASE INHIBITOR (MMPI)
IN LNCAP AND LNCAP-MT1-GFP CELL LINES
Portions of this chapter have been formatted for publication as follows:
Hira, S.M., Jin, Y., Roycik, M.D., Bosco, D.B., Cao, J., Schwartz, M.A., Strouse, G.F., Sang,
Q.X.A. Live-cell optical tracking of a novel dye-labeled matrix metalloproteinase
inhibitor (MMPI) in prostate cancer cells. Manuscript in preparation.
5.1 Introduction
The mystery surrounding both the physiological and pathological roles of matrix
metalloproteinases (MMPs) remains a focus of active research149. MMPs are a class of zinc
containing endopeptidases which play a predominant role in remodeling the extracellular
matrix (ECM) needed for cellular migration150. Additional roles of MMPs have been linked
to cell proliferation, apoptosis, and wound healing, as well as intracellular functions
involving cleavage of centrosomes and chromosomal instability151-154. Although normal
levels of MMPs are needed for healthy, thriving cells, the overproduction of MMPs have
been linked to a number of disease states and types of invasive cancers149, 155-158. Since cell
migration is one of the most fundamental aspects of the development and maintenance of
multicellular organisms, MMPs are an obvious target to further understand the intricate web
of fundamental cellular structure and function.
There are currently 24 identified MMPs, of which subsets include but are not limited
to the matrilysins, collagenases, stromelysins, gelatinases, and membrane-type bound
MMPs155, 159. Of the 24 MMPs identified, only 23 are relevant to humans159. All MMPs
contain three conserved regions including a signal sequence, pro-domain, and a catalytic
domain. The signal sequence, also known as the pre-domain, consists of 17-20 amino acids
largely hydrophobic in nature found at the N-terminus of the protein160. The pre-domain
directs translation and is cleaved before further enzyme activation. The pro-domain

- 64 -
immediately follows the pre-domain and becomes the new N-terminus after cleavage
containing about 80 amino acids160. The pro-domain serves as the major regulator of MMP
function via a conserved peptide sequence of PRCGXPD known as the “cysteine switch”161.
The cysteine (C) in the middle of the sequence can coordinate a single Zn2+ ion located in the
catalytic domain maintaining the enzyme in a zymogen state. The catalytic domain consists
of 160-170 residues containing three histidine residues that fill the remaining coordination of
zinc (4-coordinate)162. In addition to these conserved domains found in all MMPs, there are
two semi-conserved regions found in all MMPs except MMP-7, MMP-23, and MMP-26
which are a hinge region with a variable peptide sequence rich in proline and a C-terminal
hemopexin-like domain160. The hinge region contains up to 75 amino acid residues and due
to the variability in sequence most likely allows flexibility in the protein structure160. The
hemopexin-like domain is typically 200 residues and serves an assortment of functions such
as substrate recognition and MMP activation160. There are also recognition sequences and
specific regions found throughout the protein that can be characteristic of particular
subclasses of MMPs. The specific regions serve vital roles in the function of MMPs as well
as the recycling of MMPs from their designated target location in cellular environments. In
the case of gelatinases (i.e. MMP-2, MMP-9), an additional fibronectin (FN) recognition site
is found within the catalytic domain to allow for the interaction with particular substrates158.
Membrane-type MMPs (MT1-MMP, also known as MMP-14) also contain a furin
recognition sequence for activation, a trans-membrane tether for plasma membrane targeting,
and a cytoplasmic domain coding for intracellular signaling sequence responsible for MMP
recycling163, 164. Besides the conserved domains and specific recognition regions,
synthetically modified MMPs containing the chimeric expression of green fluorescent protein
(GFP) have been demonstrated157, 165. The addition of GFP was appended to the C-terminal
end of the protein after the termination of the cytoplasmic tail. A pictorial description of the
conserved and varying domains and recognition sequences is summarized in Figure 5.1. It is
important to note that although the various domains of MMPs are depicted in a linear
arrangement, the secondary and tertiary structure of these proteins is composed of a complex
three-dimensional (3-D) structure. An example of the 3-D structure necessary for proper
protein function is illustrated through the function of the “cysteine switch” to coordinate a
zinc metal ion resulting in the prevention of a cascade of reactive steps leading to MMP
activation.
Two MMPs (MT1-MMP and MMP-2) are of particular interest and have become the
focus of the experiments performed later in this chapter. MT1-MMP is one of the few MMPs

- 65 -
that is tethered to the plasma membrane and serves roles in ECM remodeling and activation
of other MMPs, particularly MMP-2. The latent form of the MT1-MMP is activated by furin
in the trans-golgi164. Once activated, MT1-MMP is translocated to the plasma membrane to
cleave the extracellular matrix and serve its many functions. It has been shown to degrade
type I, II, and III collagen, as well as fibronectin substrates159. Roles of cleaving centrosomes
in the nucleus and even the association with sub-cellular integrins have also been reported in
literature166, 167. MMP-2 is predominately activated by MT1-MMP and serves a major role in
gelatin cleavage in ECM remodeling158. Additional activation pathways via other
membrane–tethered MMPs (MT2-MMP) and plasmin assisted activation have been
reported159, 168-170. Due to the intimate connection between MT1-MMP and MMP-2 the two
proteins are frequently identified in similar extracellular and intracellular environments.
Figure 5.1: A pictorial description of the varying domains pertinent to MMPs. Subclassifications of MMPs are shown as follows: Matrilysins (a), Collagenases (b), Stromelysins (c), Gelatinases (d), MT-MMPs (e), and synthetically modified MMPS (f).

- 66 -
Since MMPs serve such a critical role in cellular function through either direct
substrate cleavage needed for migration or in multiple signaling processes, natural regulatory
molecules are needed to adjust their concentration. There are four tissue inhibitors of
metalloproteinases (TIMP) that are naturally found in biological systems with affinities in the
pM concentration range that can bind various structural domains and regulate MMP
function158, 159, 162. The most important and relevant TIMP related to the studies herein is
TIMP-2. This natural MMP inhibitor plays a role in conjunction with MT1-MMP in the
predominant activation pathway of MMP-2158, 171, 172. In particular, TIMP-2 binds the N-
terminus of MT1-MMP, which is tethered to the surface of the plasma membrane. The
immobilized TIMP-2 is free to bind the hemopexin domain of pro-MMP-2. A second MT1-
MMP protein is now able to cleave the pro-domain of MMP-2 and cause activation. After
activation Uekita has reported that the MT1-MMP/TIMP-2 complex may be internalized and
proposed that endocytosis may aid in the regulation of and promote fully active MMPs at the
cell interface173. Jiang et al. have shown that the cytoplasmic tail sequence directly affects
the amount of active MT1-MMP on the plasma membrane surface available for its membrane
bound functions163. Even more recently, it has been shown that MT1-MMP is internalized
through clatherin mediated endocytosis and can be recycled back to the plasma membrane174-
178. Although these studies have produced new insights into the function and regulation of
MMPs, more research needs to be completed to understand the global view of MMP substrate
interactions.
In an effort to regulate MMP activity, a series of synthetic MMP Inhibitors (MMPIs)
were developed over the last 30 years for application in the treatment of cardiac diseases and
a variety of cancers179. In the midst of the forceful push to get potential drugs approved for
clinical use, many of the clinical trials were designed poorly and rushed yielding even poorer
outcomes. Unfortunately, most have failed clinical trials due to a myriad of toxic and painful
side effects or a lack of decreasing MMP overall function180-183. A leading candidate in the
late 1990’s and early 2000’s, Marimastat, failed phase III clinical trials due in part to toxic
side effects and ineffective treatments when compared to a placebo. The phase III clinical
trial report cites muscoskeletal toxicity and associated inferior patient survivability as a
possible explanation for the failed clinical trials targeting breast cancer patients184. The end
results of the report determined that MMPIs and their associated biological effects need to be
better understood before additional drug candidates enter clinical trials. Many of the MMPI
drug candidates were comprised of hydroxamate functional groups to coordinate the zinc in a
bidentate fashion in the heart of the catalytic domain. The strong and potent properties of this

- 67 -
functionality are thought to be behind some of the failed clinical trials where many of these
drug candidates did not have any MMP specificity, as well as displayed the propensity to
scavenge metal ions in the surrounding biological matrix. The only MMPI approved for
clinical use is Periostat, a dental drug administered after scaling and root planning procedures
for the treatment of gum disease155.
Despite the vast interest in MMPIs as a therapeutic tool, little is known about how
MMPIs interact with MMPs in a cellular environment and influence MMP function real-time.
Evaluation of inhibitor function has traditionally been accomplished using an enzyme
cleavage assay185. A multitude of methods have been used to probe MMP function including
fluorescence beacons and energy transfer based assays, magnetic resonance imaging (MRI),
positron emission tomography (PET), and quantum dot based techniques186-191.
Unfortunately these techniques suffer from data acquired from ensemble measurements or do
not probe MMPI interactions with MMPs. The use of fluorescently labeled peptide substrates
to monitor MMP-2 inhibition by MMPIs in vivo was first reported by Bremer et al. in 2001192.
While the in vivo animal study yielded unprecedented optical imaging of active MMPs
functioning around tumors, the details of MMPI interactions with MMPs were not probed.
Seven years later Faust et al. appended a fluorophore to a barbiturate based MMPI as a
photoprobe for imaging MMPs in vitro193. The published results conclude that the selective
labeling of the surface of A-673 cells by the dye labeled MMPI was due to the interaction of
the MMPI with MMP-2 and MMP-9 secreted by the cells. In depth optical analysis of the
association of MMPIs with MMPs in a cellular environment were not performed. More
recently in 2009, Faust et al. probed the labeling of MMP-2 and MMP-9 in cryostat tumor
sections with a dye labeled commercially available hydroxamate based MMPI showing
selective association to tumors, but did not probe cellular interactions194. Finally a study
accomplished by auf dem Keller et al. in 2010 modified Marimastat with 18F for PET
analysis195. Also described within this study was the appendage of a fluorescent marker to
the target inhibitor to confirm association of the modified Marimastat with the plasma
membrane. The FITC labeled Marimastat was incubated with MDA-MB-231 cells stably
expressing MT1-MMP at a concentration of 10 µM for 12 hours cells, washed, and were
fixed prior to imaging. Similar to Faust et al, auf dem Keller et al. report the surface labeling
of the cancerous cells193-195. It is important to note that none of the aforementioned literature
references observed or suggested inhibitor internalization into cells. To date, an in depth
analysis of the interaction of MMPIs with MMPs under real-time conditions immediately
after the addition of an MMPI has not been reported.

- 68 -
The design of novel MMPIs are still being explored for potential therapeutic
applications196-201. In an effort to identify and curb some of the apparent issues associated
with previous MMPI targets, the design of YHJ-8-91 based off of YHJ-7-52 revolved around
multiple criteria to enhance binding of the MMPI to the catalytic domain of MT1-MMP201.
First, the implementation of a thiol-based zinc binding group was thought to decrease the
binding affinity towards erroneous metal ions because it is not a bidentate chelator, while still
maintaining a significant binding affinity for specific interactions199. Second, the use of a
sulfonamide in the target inhibitor has been shown to be critical in MMPI drug design, as this
functionality can hydrogen bond with the enzyme substrate and add stability to the catalytic
interaction199. Third, the additional use of a diphenyl ether to interact with the S1´ binding
pocket should allow for enhanced individual MMP specificity. It has been previously shown
that the molecular compounds interaction with the depth of the S1´ pocket can result in
specificity202. Combining all of these criteria may result in an MMPI that can target a
relatively small subset of MMPs in an effort to surpass the previous clinical trial failures. To
visualize the activity of MMPIs in a cellular environment, the appendage of a fluorophore on
a flexible linker outside of the molecular binding pocket was undertaken. The fluorescent
dye was chosen based on the ability to efficiently excite with a 561 nm laser source and emit
photons in the red region of the color spectrum in an attempt to limit spectral bleed-through
on our instrumental microscope platform. Also, the dye was chosen to exhibit favorable
spectroscopic properties of quantum yield and stability while increasing molecular solubility
of the target MMPI203. In addition to the target MMPI design, the use of a MMPI control that
retains the S1´ specificity, but lacks a thiol for zinc coordination and instead utilizes a
hydroxyl functionality provides a sophisticated control for precise validation of molecular
specificity (YHJ-7-82). It has previously been shown that YHJ-7-52 has a Ki of 2.1 nM for
MT1-MMP and 2.2 nM for MMP-2 as shown through a fluorescent enzyme cleavage assay201.
The YHJ-7-82 control exhibited a Ki of 10 µM for MMP-2 and was offscale for MT1-
MMP201. A final control rendering the Lissamine rhodamine B sulfonyl chloride unreactive
by reacting the dye with propyl amine will be used to probe the possibility of dye enhanced
cellular interactions. The chemical structures of the target inhibitor and the two controls are
shown in Figure 5.2. The target inhibitor design and subsequent controls will be
predominately evaluated on LNCaP-MT1-GFP cells165. This stably, over-MT1-MMP-
expressing cell line was chosen as a model cell line due to the nature of this epithelial cell
line to be present on the very onset of cancerous activity and the MT1-GFP chimera provides
a convenient way to monitor the enzyme real-time in its native environment.
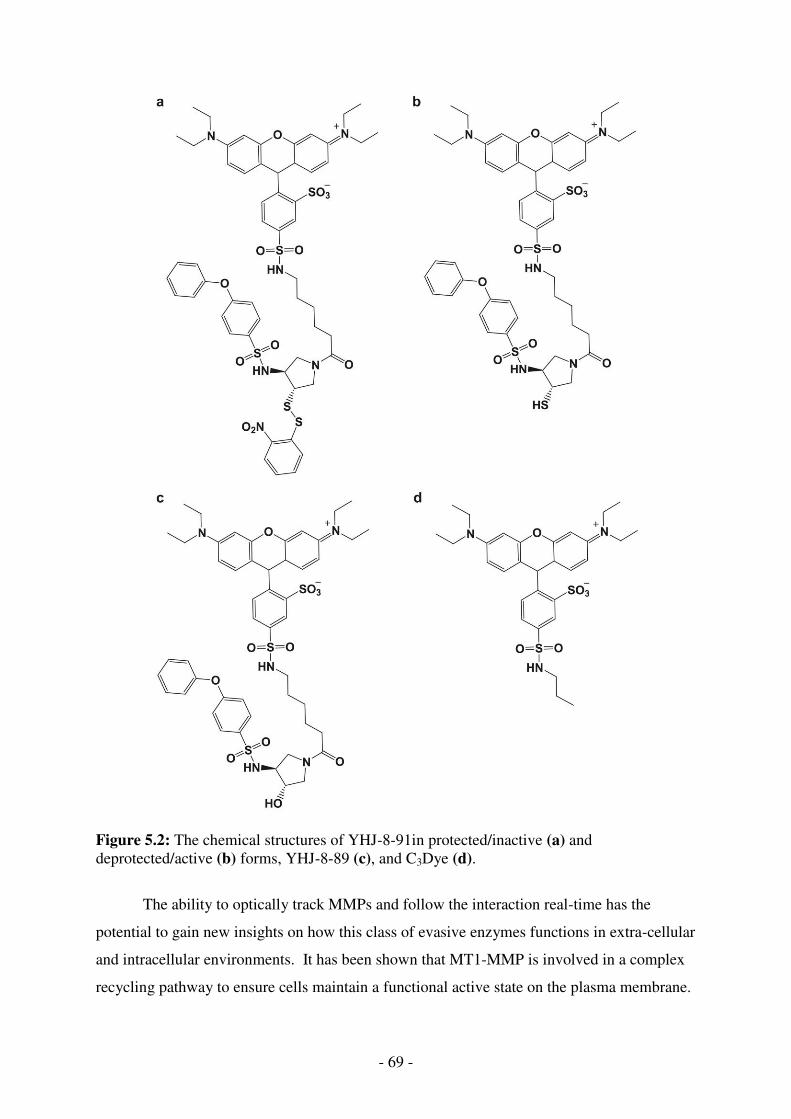
- 69 -
Figure 5.2: The chemical structures of YHJ-8-91in protected/inactive (a) and deprotected/active (b) forms, YHJ-8-89 (c), and C3Dye (d).
The ability to optically track MMPs and follow the interaction real-time has the
potential to gain new insights on how this class of evasive enzymes functions in extra-cellular
and intracellular environments. It has been shown that MT1-MMP is involved in a complex
recycling pathway to ensure cells maintain a functional active state on the plasma membrane.

- 70 -
We hypothesize that the use of dye-labeled MMPIs may be used to track the activity of
MMPs within their respective environment. The experiments and subsequent results
described herein are the first attempt at gaining new insights on how MMPIs interact with
MMPs at the cellular level under real-time conditions using a dye-labeled inhibitor.
5.2 Syntheses of Dye Labeled Target MMPI and Controls
5.2.1 Synthesis of Disulfide Protected Dye Labeled Target MMPI
YHJ-7-52, previously synthesized in the research laboratory of Martin A. Schwartz by
Yonghao Jin, was coupled to an amine reactive dye through a sulfonamide coupling reaction
as shown in Figure 5.3. YHJ-7-52 was reacted with 6.26 mg of Lissamine rhodamine B
sulfonyl chloride and triethylamine (TEA) in a 1.2:1:6 mole ratio in dry DMF under nitrogen
for 2 days. The TEA and DMF were evaporated under hard vacuum leaving the product and
unreacted dye behind. Thin layer chromatography (TLC) was carried out on reverse phase
silica plates in a 10% methanol/ 90% methlyene chloride solution as shown in Figure 5.4.
The mobility shifts from left to right are Lissamine rhodamine B, reaction mixture, YHJ-7-
52/ TEA, YHJ-7-52, Lissamine rhodamine B incubated in a 50:50 DMF/H2O solution for 24
hours. The TLC plates were pumped down under hard vacuum to limit smearing caused from
DMF. A clean, isolated product band can be easily separated on reverse phase silica gel
plates. The incubation of Lissamine rhodamine B sulfonyl chloride in 50:50 DMF/H2O was
to determine if a chromatographic shift occurred resulting from the reaction of the sulfonyl
chloride with water. The inhibitor-dye conjugate was isolated using reverse phase column
chromatography using 10% methanol/ 90% methylene chloride. The separation of the
inhibitor-dye complex from free dye was not as clean as TLC. Only a very small amount of
crude mixture (< 1 mg) was able to be loaded at any one time, where ~150 µg was isolated.
Excess loading of crude material resulted in little to no mobility shift between the product
and side-products or reactants making column chromatography difficult. Due to the
difficulty in column purification loading, wet addition and dry loading were attempted,
yielding no difference in separation outcomes. Characterization of the product was
accomplished using nuclear magnetic resonance (NMR) and mass spectrometry analysis,
where the mass spectrogram is shown in Appendix D. The mass spectrometry analysis
confirmed a dominate peak at 1157.4 g∙mol-1. The Ki of the dye-labeled thiolated (active)
inhibitor was experimentally determined to be 60 nM by a fluorescent enzyme cleavage assay.

- 71 -
All subsequent synthesis of the dye-labeled disulfide protected inhibitor was performed by
Yonghao Jin in the research laboratory of Martin A. Schwartz (designated YHJ-8-91) and
was purified using reverse phase high performance liquid chromatography (HPLC). Purified
samples were evaporated to dryness and stored in the absence of light at -30 °C until cellular
studies were performed.
Figure 5.3: The reaction scheme for the synthesis of disulfide protected inhibitor.

- 72 -
Figure 5.4: Thin Layer Chromatography results showing the difference in mobility between disulfide protected inhibitor and unreacted Lissamine rhodamine B under white light and UV illumination (bottom). The spotted reactants and reaction mixture are shown before solvent elution (top).
5.2.2 Syntheses of YHJ-8-89 and C3Dye Controls
Additional disulfide protected inhibitor (designated YHJ-8-91) and two controls
(YHJ-8-89, C3Dye) were synthesized by Yonghao Jin in the research laboratory of Martin A.
Schwartz to determine the molecular specificity of the inhibitor compounds. Lissamine
rhodamine B sulfonyl chloride was purchased from Invitrogen and reacted with YHJ-7-82 in
a similar fashion as the disulfide protected inhibitor, YHJ-8-91, to synthesize YHJ-8-89, a
hydroxide control lacking the zinc binding group (ZBG). In addition, Lissamine rhodamine
B sulfonyl chloride was reacted with propyl amine to determine if the MMPI-cell interactions
were driven by the properties of the fluorescent dye. Additional YHJ-8-91, as well as YHJ-8-
89 and C3Dye controls were purified via reverse phase HPLC and characterized using mass
spectrometry and NMR (NMR shown in Appendix E). Samples were stored as a solid in the
absence of light at -30 °C until cellular studies were performed.
5.3 Quantification of Target MMPI and Controls
The amount of inhibitor target or controls for subsequent cellular studies was
quantified using absorption and the application of Beer’s Law (A = Ɛbc). The chemical
structures of the target MMPI and controls with corresponding offset absorption spectra are
shown in Figure 5.5. A stock solution of the target molecule (or one of the two controls) was
made using HPLC grade methanol and absorption was taken using a Carey 50 Bio UV-
Visible spectrophotometer. 5 µL of stock solution was added to 50 µL of methanol in a

- 73 -
quartz cuvette (baseline corrected). The concentration was determined using a published
extinction coefficient, Ɛ, of 88,000 M-1cm-1 at 568 nm204 for the fluorescent dye and a path
length of 0.3 cm. The same Ɛ was used for the dye labeled MMPI and controls because any
modification to the original dye molecule did not involve the conjugated ring system
responsible for fluorescence. The appropriate amount of material for cellular studies was
aliquoted from the stock solution and allowed to evaporate at RT. In the case of 10 nM
samples used in the following studies a second dilution was performed to obtain the
appropriate quantities for dilute cellular experiments. The aliquoted sample was stored in the
absence of light at RT and used within days of obtaining the concentration to limit any
possible degradation.
Figure 5.5: The normalized offset absorption spectra of YHJ-8-91, YHJ-8-89, and C3Dye.
5.4 Microscopy Details
Optical microscopy characterization was used to optically track the selective uptake of
MMPI’s into LNCaP cells, provided by the research laboratory of Jin Cao and cultured in the
laboratory of Q.X. Amy Sang by M. Dru Roycik, and follow the time dependent uptake.
LNCaP epithelial cells were chosen as a model cell line for the following studies focused on
MMP-2, MMP-9, and MT1-MMP because that is where the MMPs originate. The use of the
over-expressing MT1-GFP chimera cell line variant allows the membrane bound MT1-MMP
to provide a natural plasma membrane stain to monitor molecular uptake and probe
colocalization of inhibitors with MT1-MMP165. The inhibitor and controls were dissolved in

- 74 -
20 µL of neat ethanol and deprotected at RT for 75 minutes with 1 mM tris(2-
carboxyethyl)phosphine (TCEP) and 3 mM sodium hydroxide solutions. Laser Scanning
Confocal Microscopy (LSCM) characterization of the target MMPI and controls were
acquired with an inverted Nikon TE2000-E2 Eclipse C2Si spectral confocal microscope
(Nikon Instruments Inc., Melville, NY, USA) equipped with a Nikon CFI Plan Apochromat
40X objective (NA 0.95, 0.14 mm WD), condenser (NA 0.52), differential interference
contrast (DIC), and a transmitted light detector (TLD). A 488 nm argon ion laser was used to
excite GFP and MT1-GFP chimera contructs (emission filter 515/30), a 561 nm diode
pumped solid-state laser was used to excite Lissamine rhodamine B (emission filter: 605/75),
and a 404 nm diode laser was used to excite Hoechst 34580, a minor groove intercalating
fluorescent dye to observe the location of DNA (emission filter: 450/35). Imaging was
generally acquired at a rate of 18.96 µs using a 33.3 m pinhole. Spectral confocal at 5 nm
resolution was used to verify that the observed fluorescence was attributed to the spectral
profile of Lissamine rhodamine B and not due to any spectral or scattering artifacts. Laser
powers were kept constant during the duration of an experiment and kept the same when
comparing between experiments. The cells were plated in either glass bottom dishes or glass
bottom 6-well plates and placed into a Pathology Devices live cell stage-top incubator at 37
°C, 5% CO2, and 75% humidity for the duration of an experiment. The data were analyzed
using Nikon NIS Elements software. Multi-channel data acquisition utilized a frame lambda
technique in which individual laser passes were made to image in respective channels to limit
microscopic artifacts stemming from fluorescence bleed-through. Although spectral-bleed
through is eliminated, slight x-y-z spacial shifts were observed from the time lag involved in
multiple scans. This shift makes spectral colocalization studies qualitative. Attempts at
normal LSCM were made to limit x-y-z spacial shift at the expense of spectral bleed through
between GFP largely localized in the green channel into the red channel.
5.5 Cellular Uptake of Target MMPI into LNCaP-MT1-GFP
and LNCaP-GFP Cell Lines
The cellular uptake of MMPIs into LNCaP-MT1-GFP and LNCaP-GFP expressing
cells was investigated. The initial study focused on monitoring the interaction and uptake of
10 µg of deprotected dye-labeled thiolated inhibitor into LNCaP-MT1-GFP cells over the
span of 24 hours under live cell microscopy conditions in an optical dish. The observed
uptake of the dye-labeled thiolated inhibitor over time as shown in Figure 5.6 was originally
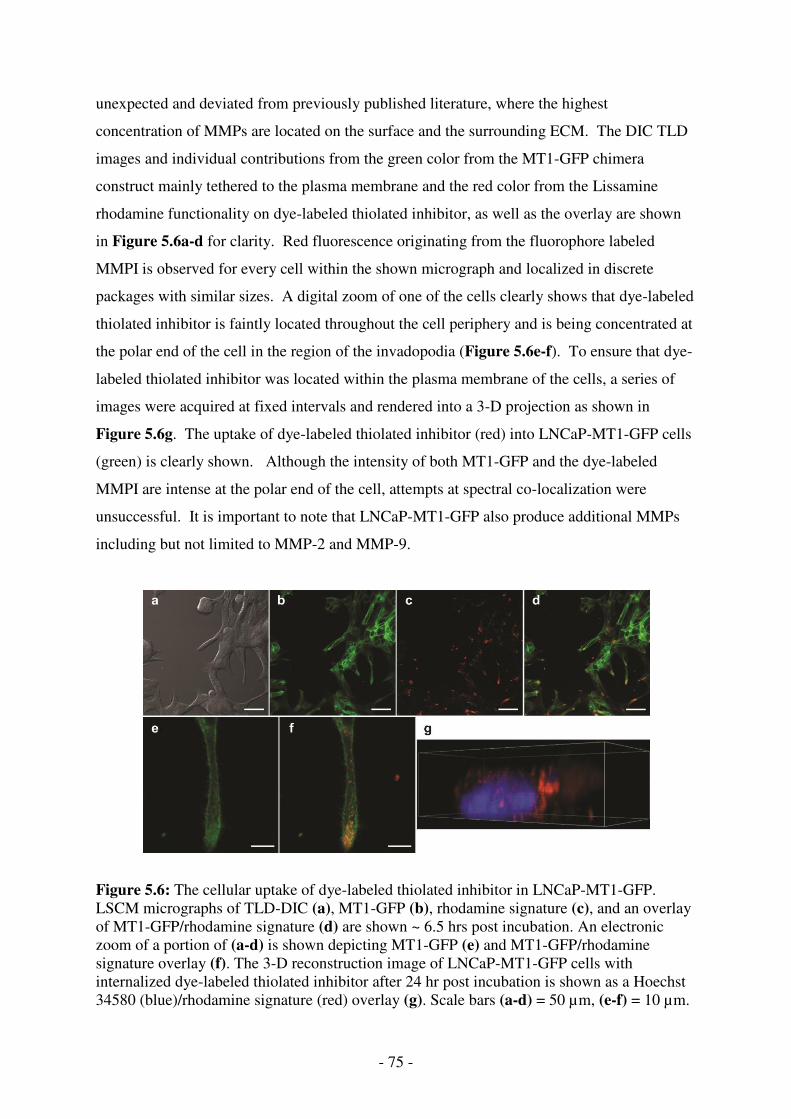
- 75 -
unexpected and deviated from previously published literature, where the highest
concentration of MMPs are located on the surface and the surrounding ECM. The DIC TLD
images and individual contributions from the green color from the MT1-GFP chimera
construct mainly tethered to the plasma membrane and the red color from the Lissamine
rhodamine functionality on dye-labeled thiolated inhibitor, as well as the overlay are shown
in Figure 5.6a-d for clarity. Red fluorescence originating from the fluorophore labeled
MMPI is observed for every cell within the shown micrograph and localized in discrete
packages with similar sizes. A digital zoom of one of the cells clearly shows that dye-labeled
thiolated inhibitor is faintly located throughout the cell periphery and is being concentrated at
the polar end of the cell in the region of the invadopodia (Figure 5.6e-f). To ensure that dye-
labeled thiolated inhibitor was located within the plasma membrane of the cells, a series of
images were acquired at fixed intervals and rendered into a 3-D projection as shown in
Figure 5.6g. The uptake of dye-labeled thiolated inhibitor (red) into LNCaP-MT1-GFP cells
(green) is clearly shown. Although the intensity of both MT1-GFP and the dye-labeled
MMPI are intense at the polar end of the cell, attempts at spectral co-localization were
unsuccessful. It is important to note that LNCaP-MT1-GFP also produce additional MMPs
including but not limited to MMP-2 and MMP-9.
Figure 5.6: The cellular uptake of dye-labeled thiolated inhibitor in LNCaP-MT1-GFP. LSCM micrographs of TLD-DIC (a), MT1-GFP (b), rhodamine signature (c), and an overlay of MT1-GFP/rhodamine signature (d) are shown ~ 6.5 hrs post incubation. An electronic zoom of a portion of (a-d) is shown depicting MT1-GFP (e) and MT1-GFP/rhodamine signature overlay (f). The 3-D reconstruction image of LNCaP-MT1-GFP cells with internalized dye-labeled thiolated inhibitor after 24 hr post incubation is shown as a Hoechst 34580 (blue)/rhodamine signature (red) overlay (g). Scale bars (a-d) = 50 µm, (e-f) = 10 µm.
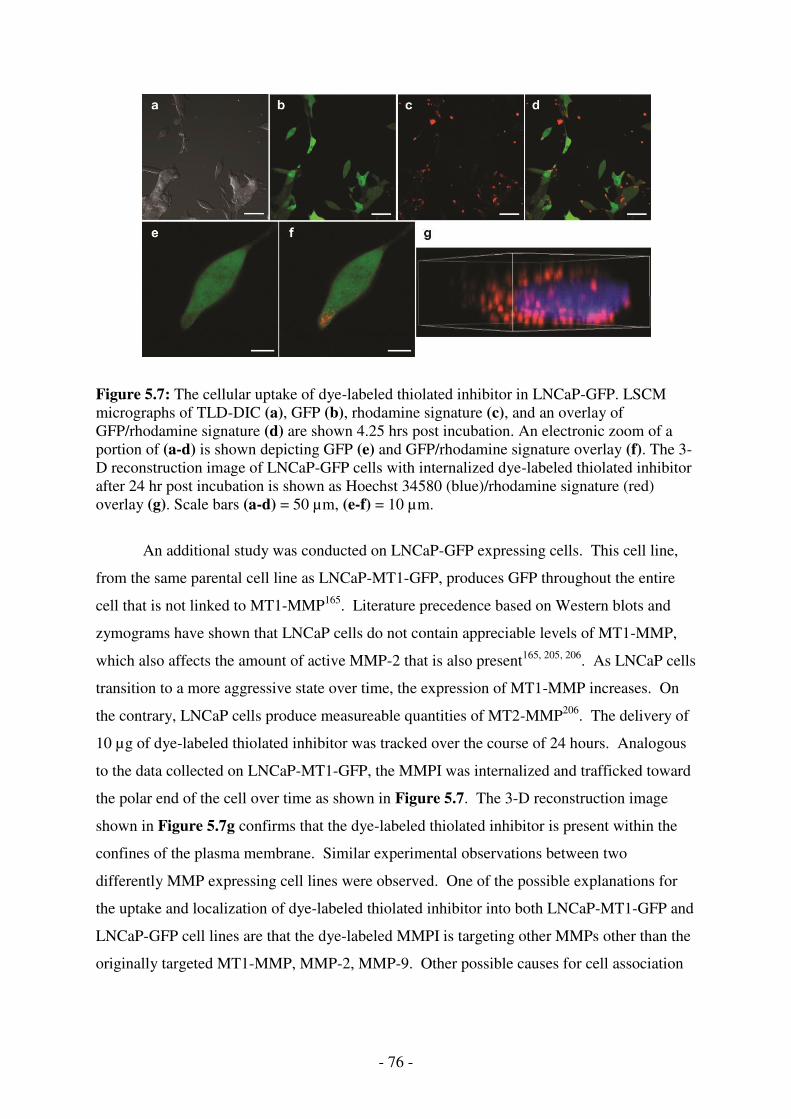
- 76 -
Figure 5.7: The cellular uptake of dye-labeled thiolated inhibitor in LNCaP-GFP. LSCM micrographs of TLD-DIC (a), GFP (b), rhodamine signature (c), and an overlay of GFP/rhodamine signature (d) are shown 4.25 hrs post incubation. An electronic zoom of a portion of (a-d) is shown depicting GFP (e) and GFP/rhodamine signature overlay (f). The 3-D reconstruction image of LNCaP-GFP cells with internalized dye-labeled thiolated inhibitor after 24 hr post incubation is shown as Hoechst 34580 (blue)/rhodamine signature (red) overlay (g). Scale bars (a-d) = 50 µm, (e-f) = 10 µm.
An additional study was conducted on LNCaP-GFP expressing cells. This cell line,
from the same parental cell line as LNCaP-MT1-GFP, produces GFP throughout the entire
cell that is not linked to MT1-MMP165. Literature precedence based on Western blots and
zymograms have shown that LNCaP cells do not contain appreciable levels of MT1-MMP,
which also affects the amount of active MMP-2 that is also present165, 205, 206. As LNCaP cells
transition to a more aggressive state over time, the expression of MT1-MMP increases. On
the contrary, LNCaP cells produce measureable quantities of MT2-MMP206. The delivery of
10 µg of dye-labeled thiolated inhibitor was tracked over the course of 24 hours. Analogous
to the data collected on LNCaP-MT1-GFP, the MMPI was internalized and trafficked toward
the polar end of the cell over time as shown in Figure 5.7. The 3-D reconstruction image
shown in Figure 5.7g confirms that the dye-labeled thiolated inhibitor is present within the
confines of the plasma membrane. Similar experimental observations between two
differently MMP expressing cell lines were observed. One of the possible explanations for
the uptake and localization of dye-labeled thiolated inhibitor into both LNCaP-MT1-GFP and
LNCaP-GFP cell lines are that the dye-labeled MMPI is targeting other MMPs other than the
originally targeted MT1-MMP, MMP-2, MMP-9. Other possible causes for cell association

- 77 -
may stem from the Lissamine rhodamine B dye functionality causing non-specific uptake,
unusually high concentration effects, MMPs from media, or a non-MMP related mechanism.
Figure 5.8: The qualitative cellular uptake of YHJ-8-91 (a-c), YHJ-8-89 (d-f), and C3Dye (g-
i) at 1 hr (a,d,g), 2 hr (b,e,h), and 3 hr (c,f,i) post material incubation. Scale bars = 50 µm.
5.6 Cellular Uptake of YHJ-8-91, YHJ-8-89, and C3Dye into LNCaP-MT1-
GFP on a Static Region
The qualitative comparison of cellular uptake of YHJ-8-91 (10 µg), YHJ-8-89 (10 µg),
and C3Dye (~7 µg) into LNCaP-MT1-GFP expressing cells was investigated on a static
region to determine if the Lissamine rhodamine B dye is responsible for aiding cellular
uptake. The following studies were conducted using live-cell microscopy analysis on a static
region of the optical dish over a 4 hour time span. Images were acquired at 15 min intervals.
Since varying amounts of material were added, concentrations between all three compounds

- 78 -
are not equal; therefore, a direct comparison of the amount of material uptaken by cells can
not drawn. Qualitatively, the outcome of positive internalization under the current
microscopy conditions, as well as the translocalization of material after uptake can still be
assessed at the concentration used for each compound. The qualitative uptake for YHJ-8-91,
YHJ-8-89, and C3Dye into LNCaP MT1-GFP cells at 1, 2, and 3 hrs post incubation is shown
in Figure 5.8. Both YHJ-8-89 and YHJ-8-91 were clearly internalized within 3 hours post
incubation. In addition, the C3Dye was observed to be associated with LNCaP-MT1-GFP,
albeit at a lower observed intensity. The microscopy results from this study resulted in the
need for a much lower concentration (nM) of MMPI and controls to be investigated to
exclude artifacts from high concentrations (µM).
5.7 Quantification of the Cellular Uptake YHJ-8-91, YHJ-8-89, and C3Dye
into LNCaP-MT1-GFP after 6 Hours of Incubation at 10 nM
The direct quantitative comparison of cellular uptake between YHJ-8-91, YHJ-8-89,
and C3Dye into LNCaP-MT1-GFP expressing cells was investigated after 6 hours of
incubation. The compounds were aliquoted from a single stock solution using Beer’s Law
and deprotected as described in Section 5.3 to achieve a final cellular concentration of 10 nM
in the imaging environment. The experiments were conducted using 6-well uncoated glass
plates from Mat-Tek, where each well contained ~300,000 cells. All three compounds were
probed in duplicate within a single experiment and repeated three times over three
consecutive days. The incubation of compounds were staggered within an individual
experiment by 10 minutes to allow enough time to image each compound at the same time
point. The LSCM settings were identical over the time course of this study to allow for direct
comparison between compounds. Although the focal plane had to be adjusted for each well,
the chosen focal plane of interest was close to the bottom of the cell. Micrographs were taken
at two time points, 4 and 6 hours post compound incubation. Unlike other microscopy
analysis shown thus far, the media containing the compound was removed at 5.5 hours and
the cells were stained with Hoechst 34580 in an effort to identify the number of cells within
an individual image to address concerns from previous studies. To minimize cell detachment
from the glass surface, Hoechst 34580 was not removed from solution after staining (Hoechst
34580 exhibits a 2-4 fold increase in fluorescence intensity upon intercalation allowing
background signal to be minimized). The 6 hour time point was imaged in PBS buffer to

- 79 -
allow for the staining of nuclear DNA. Representative micrographs for YHJ-8-91, YHJ-8-89,
and C3Dye are shown in Figure 5.9. For clarity, the individual channels for DIC acquired
with a TLD, the blue channel staining for the nucleus of the cells, the green channel
containing signal from MT1-GFP, and the red channel containing signal from the Lissamine
rhodamine B contained within YHJ-8-91, YHJ-8-89, and C3Dye, as well as overlays for
comparison. The images shown in Figure 5.9 clearly show a difference in cellular uptake
between the three different compounds, where cells treated with YHJ-8-91 dominates in total
amount of Lissamine rhodamine B signal. Both YHJ-8-91 and YHJ-8-89 show varying
degrees of uptake. No appreciable localized C3Dye signal indicates that C3Dye does not
transverse the plasma membrane at 10 nM under the current microscopy conditions.
Quantitative analysis of cellular uptake was accomplished by applying a threshold of
125 counts to the red channel and excluding all counts below the set threshold. The threshold
was determined based on eliminating random counts outside of cells in the surrounding
media. The total fluorescence intensity for an individual micrograph was calculated by
dividing by the total number of cells partially or entirely contained within an image. A
combination of the TLD-DIC image, blue channel, green channel, and red channel was
utilized to assess the total number of cells within a micrograph. Contributions from
compounds outside of the cell were not observed under these conditions, where the measured
signal intensity is representative of cellular uptake. The data was pooled together (n ≥ 20)
and evaluated for each compound at the 6 hour time point. A graph of the three compounds
efficacy for uptake is shown in Figure 5.10. It is clearly shown that YHJ-8-91 was
endocytosed at 348.9 fold higher than the C3Dye control and 6.6 fold higher than the YHJ-8-
89, which lacks an efficient zinc binding group. It is important to emphasize that the only
difference between the target C3Dye-labeled thiolated inhibitor and the dye labeled hydroxide
control is a single functional group. The use of a molecular control of this specificity
depicting a 6.6 fold increase for the target MMPI over a control in a biological matrix is
remarkable. The observation that the dye control did not efficiently cross the plasma
membrane eliminates concerns that the dye enhances uptake at relatively low concentrations.
This characteristic may not hold at high cellular concentrations. The statistical difference
between the amount of activated thiol and the hydroxide control uptaken into LNCaP-MT1-
GFP cells suggests good selectively since the difference between molecules can be attributed
to a single chemical functional group. The measureable uptake of YHJ-8-89 may be
attributed to S1´ interactions or some other non-specific molecular interaction with the
enzyme substrate. The statistical analysis of Figure 5.10 is shown in Appendix F. The 3-D

- 80 -
Figure 5.9: LSCM micrographs showing cellular uptake of YHJ-8-91 (a-e), YHJ-8-89 (f-j), and C3Dye (k-o) into LNCaP-MT1-GFP cells 6 hrs post incubation. The individual channels for TLD-DIC (a,f,k), Hoechst 34580 (b,g,l), MT1-GFP (c,h,m), YHJ-8-91 (d), YHJ-8-89 (i), C3Dye (n), and overlay TLD-DIC, Hoechst 34580, MT1-GFP, and respective compound (e,j,o). Scale bars = 50 µm.

- 81 -
Figure 5.10: A graph of the quantitative uptake of YHJ-8-91, YHJ-8-89, and C3Dye in LNCaP-MT1-GFP cells 6 hours post incubation. Error bars represent standard error.
Figure 5.11: LSCM micrographs showing the cellular uptake of YHJ-8-91 6 hours post incubation. (a) The TLD-DIC image overlaid with Hoechst 34580 (blue), MT1-GFP (green) and YHJ-8-91 (red). (b) Hoechst 34580 (blue) and YHJ-8-91 (red) fluorescence overlaid image. (c) The 3-D reconstruction image of Hoechst 34580 (blue), MT1-GFP (green), and YHJ-8-91cell membrane stain (red) overlay. Scale bars = 5 µm.

- 82 -
reconstruction image is shown in Figure 5.11 confirming internalization of YHJ-8-91.
5.8 Qualitative Time-Dependant Cellular Uptake of YHJ-8-91
The qualitative cellular uptake of YHJ-8-91 (10 nM) was probed over a 48 hour
incubation time. CLSM was utilized to determine the presence of red emission originating
from YHJ-8-91 inside of LNCaP-MT1-GFP cells. Figure 5.12 shows an increase in the
presence of red emission at 6, 24, and 48 hr time points. The acquired data in Figure 5.12
has not been corrected for cell number. The large presence of internalized YHJ-8-91 at 24-48
hours at a concentration of 10 nM suggests that the LNCaP-MT1-GFP cells are not
expunging the discrete packages from the cell in substantial quantities. The majority of
discrete packages are localized at the invadopodia with some distribution throughout the cell.
It has been recently shown that LNCaP cells overexpress myosin VI207, 208. To date, myosin
VI is the only motor protein that delivers endocytotic packages to the negative end actin
found at the invadopodia209. The microscopy data shown throughout this chapter suggests
that the target MMPI is internalized via an endocytotic pathway and later trafficked toward
the invadopodia. Live-cell microscopy imaging allowed the visualization of endocytotic
internalization over the entire cell periphery before translocation of the packages elsewhere in
the cell. Time-lapse images shown in Figure 5.12 also suggest that the internalized packages
are largely unsorted and remain at the polar end of the cell.
Figure 5.12: LSCM micrographs depicting cellular uptake of YHJ-8-91 (red) at 6, 24, and 48 hrs post incubation.

- 83 -
5.9 Probing MMPI-MMP Activity using Zymography
Zymography was used to determine if YHJ-8-91 has any effect on the ability of
gelatinase A or B (MMP-2 or MMP-9, respectively) to cleave gelatin210. LNCaP-MT1-GFP
cells were grown in media and media exchanged immediately prior to the addition of the
target MMPI (YHJ-8-91) or controls (YHJ-8-89, C3Dye) at a concentration of 10 µM and
incubated for 6 hours. In addition to the two molecular controls, cells were incubated with a
EtOH/TCEP/NaOH solution to monitor any adverse side effects of the solution on gelatin
digestion. The cell media was removed from each well (2 mL) and aliquoted into 200 µL
vials, 29 µL of a 70% glycerol stock was added to each vial, and the contents frozen at -80 °C
until further use. Gelatin zymography was performed by Dale B. Bosco in the research
laboratory of Q. X. Amy Sang as described by literature210. The cell media was thawed and
the total protein of each fraction was determined by a bicinchoninic assay (BCA, Pierce).
The same amount of protein was loaded in each lane, run on a SDS PAGE gel, renatured with
Trition-X, allowed to digest gelatin for 60 hours in an incubator, and finally stained with
coomassie brilliant blue. The results of the zymogram are shown in Figure 5.13. The white
bands in the presence of the dark background are caused from the digestion of gelatin.
Although the presence of both MMP-9 and MMP-2 can be visualized, only MMP-2 is clearly
found in activated form. Quantification of the discernable pro-MMP-9, pro-MMP-2, and
activated MMP-2 gelatin digestion was performed by M. Dru Roycik in the research
laboratory of Q. X. Amy Sang as shown in Figure 5.13b-d. The percentage of active MMP-
2 relative to pro-MMP-2 resulted in an increase of 2.6 fold when cells were treated with YHJ-
8-91 when compared to an EtOH/TCEP/NaOH treatment. Bar graphs depicting gelatin
digestion for MMP-2 and MMP-9 are shown in Figure 5.13c-d. The total amount of MMP-2
stays relatively constant and independent of the addition of YHJ-8-91 or the controls. The
increase in gelatin digestion for cells incubated with YHJ-8-91 may be attributed to enzyme
stabilization of the inhibitor interacting with the catalytic domain to reduce auto-degradation
during the incubation stage of the experiment. The level of active MMP-2 in cells treated
with YHJ-8-91 is similar to LNCaP-MT1-GFP cells not treated with anything in the absence
of a media change. The zymogram results suggest that MMP-2 activity is being impacted by
the addition of YHJ-8-91. Additional functional assays probing cellular migration may aide
in supporting or discrediting this observation.

- 84 -
Figure 5.13: The gelatin zymogram of conditioned spent media from LNCaP-MT1-GFP cells incubated with C3Dye, YHJ-8-89, YHJ-8-91, and controls are shown, where white bands indicate gelatin digestion (a). The percentage of active MMP-2 to pro-MMP-2 from (a) shown in (b). Bar graphs indicating the level of gelatin digestion caused from MMP-2 (c) and MMP-9 (d).
5.10 Conclusions and Future Directions
The design of a novel MMPI (YHJ-8-91) containing a fluorescent marker was
incubated with both LNCaP-MT1-GFP and LNCaP-GFP cell lines and found to be
internalized over time. LNCaP-MT1-GFP cells produce active MMP-2 and MT1-MMP,
while LNCaP-GFP cells do not produce measureable protein quantities of MMP-2 and MT1-
MMP. The endocytotic packages are internalized all over the cell periphery and translocate
to the polar end of the cell with time. The internalized MMPI is present in LNCaP-MT1-GFP

- 85 -
cells 48 hrs post incubation. Attempts at direct spectral co-localization of MT1-GFP with
YHJ-8-91 under live-microscopy conditions were unsuccessful. Additional fixed-cell studies
may alleviate some of the observed spacial artifacts. The zymogram data suggests that the
addition of YHJ-8-91 to LNCaP-MT1-GFP cells causes an effect on MMP activity. With that
said, one can not exclude other possibilities of either the involvement of non targeted MMPs
or a non-MMP related cellular uptake mechanism from this data. Although a high degree of
molecular specificity is responsible for cellular uptake of YHJ-8-91 demonstrated by YHJ-8-
89 and C3Dye controls, more experimentation is needed to pin-point the mechanism and
molecules responsible for this unusual phenomenon. Additional experiments using
fluorescently labeled commercial MMPIs or nanoparticle platforms as optical trackers may
help elucidate the role of YHJ-8-91 on MMP structure and function in LNCaP cells.
Regardless of the cellular uptake mechanism, the internalization of MMPIs may influence
their efficiency and applicability as realistic drug candidates as MMP targeted therapeutics.

- 86 -
APPENDIX A
A. KHӦLER ILLUMINATION ALIGNMENT PROTOCOL
Khӧler illumination is specific for a specific objective at a specific magnification.
Alignment Protocol:
1. For general alignment use a low magnification objective such as 10X (if possible)
2. Loosen Set Screw, Remove DIC Polarizer and DIC Condenser Prism from Light Path,
Open the condenser diaphragm, Close Field Diapragm
3. Bring specimen (stained for Bright-field microscopy applications) into focus
4. Adjust the condenser height so the field diaphragm is in the same focal plane
5. Center the field diaphragm using the two centering screws
6. Adjust the aperture diaphragm by opening or closing the slider until the image
transitions from light to dark or remove the eyepiece and adjust until ~75% of the
field of view should appear light while ~25% of the field of view should appear dark
7. Tighten Set Screw
Figure A1: Labeled microscope components necessary for alignment for Khӧler illumination.

- 87 -
APPENDIX B
B. NMR SPECTRA OF FITC-ACETYLENE
Figure B1: NMR spectrum of FITC-Acetylene.
Figure B2: NMR spectrum of FITC-Acetylene.

- 88 -
Figure B3: NMR spectrum of FITC-Acetylene.
Figure B4: NMR spectrum of FITC-Acetylene.

- 89 -
Figure B5: NMR spectrum of FITC-Acetylene.
Figure B6: NMR spectrum of FITC-Acetylene.

- 90 -
Figure B7: NMR spectrum of FITC-Acetylene.
Figure B8: NMR spectrum of FITC-Acetylene.

- 91 -
APPENDIX C
C. THEORETICAL HALL SENSITIVITY CALCULATIONS
Figure C1: Maple v13 theoretical Hall sensitivity calculations.

- 92 -
APPENDIX D
D. MASS SPECTROGRAM OF TARGET MMPI
Figure D1: Mass spectrogram of target MMPI.

- 93 -
APPENDIX E
E. NMR spectra for YHJ-8-91, YHJ-8-89, and C3Dye
Figure E1: NMR spectrum of YHJ-8-91.
Figure E2: NMR spectrum of YHJ-8-91.

- 94 -
Figure E3: NMR spectrum of YHJ-8-91.
Figure E4: NMR spectrum of YHJ-8-91.

- 95 -
Figure E5: NMR spectrum of YHJ-8-89.
Figure E6: NMR spectrum of YHJ-8-89.

- 96 -
Figure E7: NMR spectrum of YHJ-8-89.
Figure E8: NMR spectrum of YHJ-8-89.
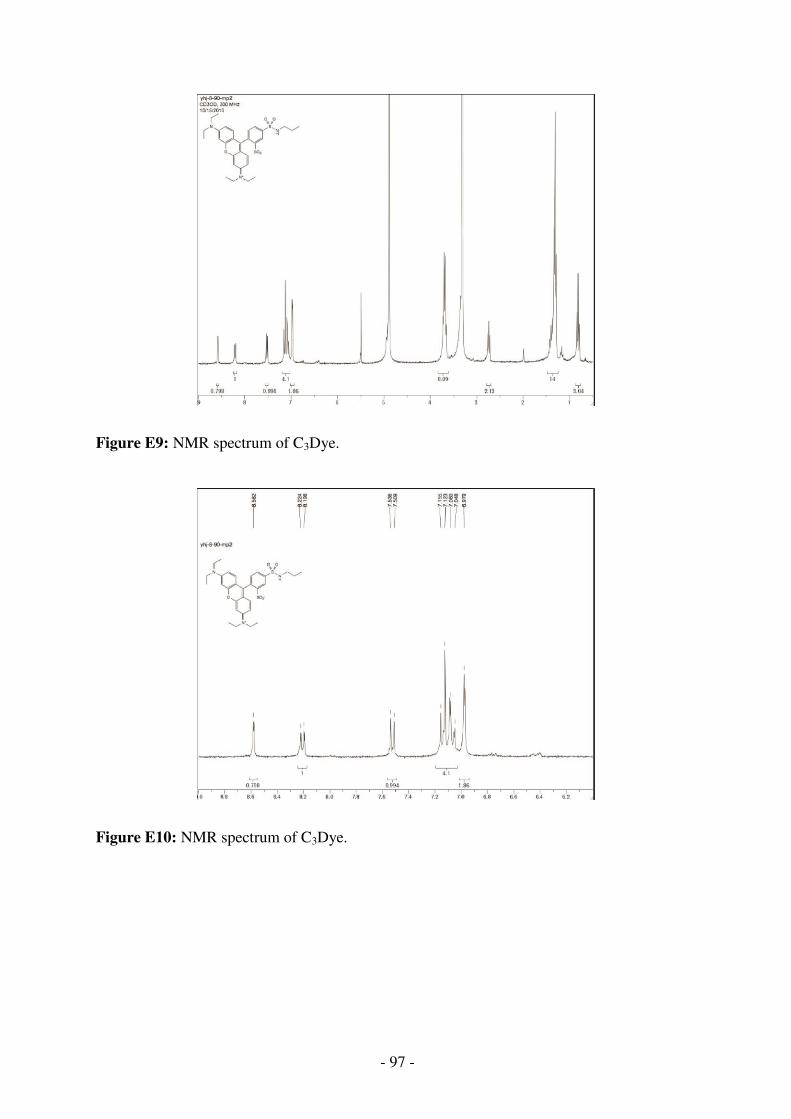
- 97 -
Figure E9: NMR spectrum of C3Dye.
Figure E10: NMR spectrum of C3Dye.

- 98 -
Figure E11: NMR spectrum of C3Dye.

- 99 -
APPENDIX F
F1. ANOVA STATISTICS ON THE CELLULAR UPTAKE OF THE
MMPI AND CONTROLS
Table F1: ANOVA statistics on the quantification of the cellular uptake of YHJ-8-91, YHJ-8-89, and C3Dye 6 hours post incubation.

- 100 -
APPENDIX G
G. COPYRIGHT RELEASE FORMS
Figure G1: American Chemical Society copyright release.

- 101 -
Figure G2: Royal Society of Chemistry copyright release.

- 102 -
REFERENCES
1. Zhang, J., Campbell, R.E., Ting, A.Y. & Tsien, R.Y. Creating new fluorescent probes for cell biology. Nature Reviews Molecular Cell Biology 3, 906-918 (2002).
2. Yildiz, A. et al. Myosin V walks hand-over-hand: Single fluorophore imaging with 1.5-
nm localization. Science 300, 2061-2065 (2003). 3. Baumgart, T., Hess, S.T. & Webb, W.W. Imaging coexisting fluid domains in
biomembrane models coupling curvature and line tension. Nature 425, 821-824 (2003). 4. Fara, P. A microscopic reality tale. Nature 459, 642-644 (2009). 5. Giepmans, B.N.G., Adams, S.R., Ellisman, M.H. & Tsien, R.Y. Review - The fluorescent
toolbox for assessing protein location and function. Science 312, 217-224 (2006). 6. Shaner, N.C. et al. Improved monomeric red, orange and yellow fluorescent proteins
derived from Discosoma sp red fluorescent protein. Nature Biotechnology 22, 1567-1572 (2004).
7. Bradbury, S., Evennett, P.J. Contrast techniques in light microscopy. (Bios Scientific
Publishers, Oxford; 1996). 8. Spector, D.L., Goldman, R.D. (ed.) Basic methods in microscopy: Protocols and concepts
from cells: A laboratory manual. (Cold Spring Harbor Press, Cold Spring Harbor; 2006). 9. Hibbs, A.R. Confocal micrscopy for biologists. (Kluwer, New York; 2004). 10. Pawley, J.B. (ed.) Handbook of biological confocal microscopy, Edn. 3rd. (Springer,
New York; 2006). 11. Sheppard, C.J.R., Shotton, D.M. Confocal laser scanning microscopy. (Bios Scientific
Publishers, Oxford; 1997). 12. Alberts, B.J., A.; Lewis, J.; Raff, M.; Roberts, K.; Walter, P. Molecular Biology of the
Cell, Edn. 4. (Garland Science, New York; 2002). 13. Yuan, J., Hira, S.M., Strouse, G.F. & Hirst, L.S. Lipid bilayer discs and banded tubules:
Photoinduced lipid sorting in ternary mixtures. Journal of the American Chemical Society 130, 2067-2072 (2008).
14. Mason, B.P., Hira, S.M., Strouse, G.F. & McQuade, D.T. Microcapsules with Three
Orthogonal Reactive Sites. Organic Letters 11, 1479-1482 (2009).
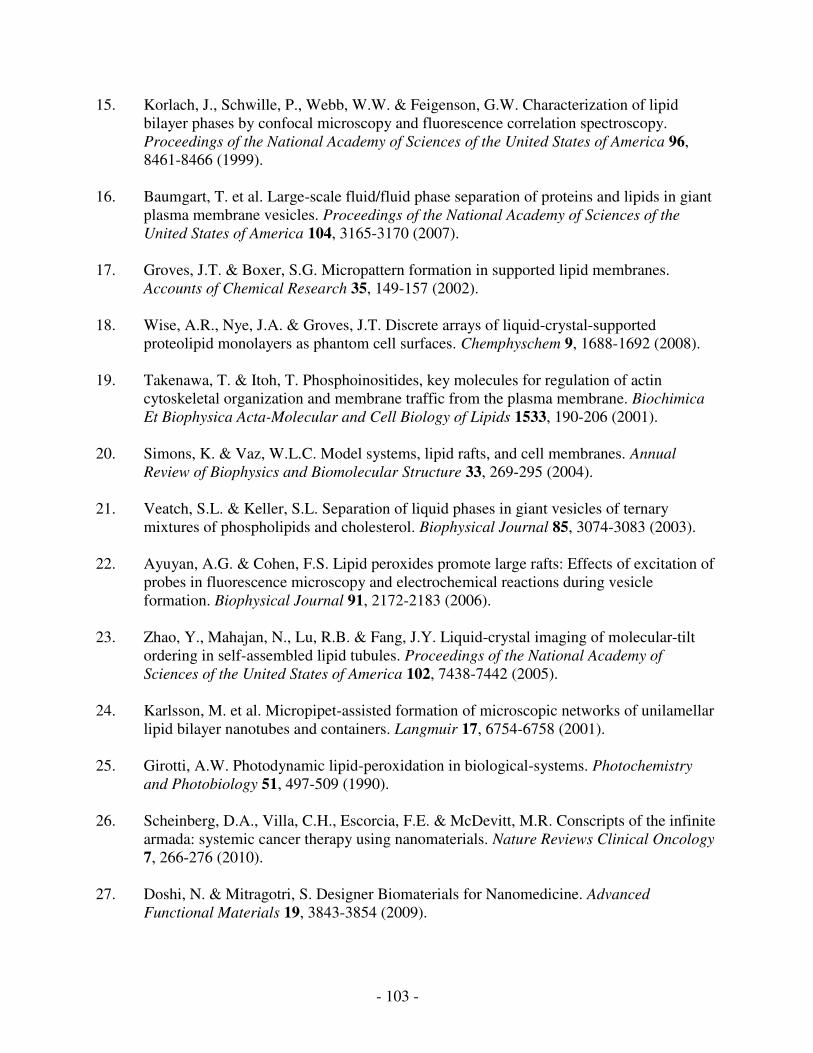
- 103 -
15. Korlach, J., Schwille, P., Webb, W.W. & Feigenson, G.W. Characterization of lipid bilayer phases by confocal microscopy and fluorescence correlation spectroscopy. Proceedings of the National Academy of Sciences of the United States of America 96, 8461-8466 (1999).
16. Baumgart, T. et al. Large-scale fluid/fluid phase separation of proteins and lipids in giant
plasma membrane vesicles. Proceedings of the National Academy of Sciences of the
United States of America 104, 3165-3170 (2007). 17. Groves, J.T. & Boxer, S.G. Micropattern formation in supported lipid membranes.
Accounts of Chemical Research 35, 149-157 (2002). 18. Wise, A.R., Nye, J.A. & Groves, J.T. Discrete arrays of liquid-crystal-supported
proteolipid monolayers as phantom cell surfaces. Chemphyschem 9, 1688-1692 (2008). 19. Takenawa, T. & Itoh, T. Phosphoinositides, key molecules for regulation of actin
cytoskeletal organization and membrane traffic from the plasma membrane. Biochimica
Et Biophysica Acta-Molecular and Cell Biology of Lipids 1533, 190-206 (2001). 20. Simons, K. & Vaz, W.L.C. Model systems, lipid rafts, and cell membranes. Annual
Review of Biophysics and Biomolecular Structure 33, 269-295 (2004). 21. Veatch, S.L. & Keller, S.L. Separation of liquid phases in giant vesicles of ternary
mixtures of phospholipids and cholesterol. Biophysical Journal 85, 3074-3083 (2003). 22. Ayuyan, A.G. & Cohen, F.S. Lipid peroxides promote large rafts: Effects of excitation of
probes in fluorescence microscopy and electrochemical reactions during vesicle formation. Biophysical Journal 91, 2172-2183 (2006).
23. Zhao, Y., Mahajan, N., Lu, R.B. & Fang, J.Y. Liquid-crystal imaging of molecular-tilt
ordering in self-assembled lipid tubules. Proceedings of the National Academy of
Sciences of the United States of America 102, 7438-7442 (2005). 24. Karlsson, M. et al. Micropipet-assisted formation of microscopic networks of unilamellar
lipid bilayer nanotubes and containers. Langmuir 17, 6754-6758 (2001). 25. Girotti, A.W. Photodynamic lipid-peroxidation in biological-systems. Photochemistry
and Photobiology 51, 497-509 (1990). 26. Scheinberg, D.A., Villa, C.H., Escorcia, F.E. & McDevitt, M.R. Conscripts of the infinite
armada: systemic cancer therapy using nanomaterials. Nature Reviews Clinical Oncology 7, 266-276 (2010).
27. Doshi, N. & Mitragotri, S. Designer Biomaterials for Nanomedicine. Advanced
Functional Materials 19, 3843-3854 (2009).

- 104 -
28. Kotov, N.A. et al. Nanomaterials for Neural Interfaces. Advanced Materials 21, 3970-4004 (2009).
29. Kim, J., Piao, Y. & Hyeon, T. Multifunctional nanostructured materials for multimodal
imaging, and simultaneous imaging and therapy. Chemical Society Reviews 38, 372-390 (2009).
30. Huang, X.H., Jain, P.K., El-Sayed, I.H. & El-Sayed, M.A. Gold nanoparticles: interesting
optical properties and recent applications in cancer diagnostic and therapy. Nanomedicine 2, 681-693 (2007).
31. Ruoslahti, E., Bhatia, S.N. & Sailor, M.J. Targeting of drugs and nanoparticles to tumors.
Journal of Cell Biology 188, 759-768 (2010). 32. Larson, D.R. et al. Water-soluble quantum dots for multiphoton fluorescence imaging in
vivo. Science 300, 1434-1436 (2003). 33. Delehanty, J.B., Mattoussi, H. & Medintz, I.L. Delivering quantum dots into cells:
strategies, progress and remaining issues. Analytical and Bioanalytical Chemistry 393, 1091-1105 (2009).
34. Delehanty, J.B., Boeneman, K., Bradburne, C.E., Robertson, K. & Medintz, I.L.
Quantum dots: a powerful tool for understanding the intricacies of nanoparticle-mediated drug delivery. Expert Opinion on Drug Delivery 6, 1091-1112 (2009).
35. Gao, X.H. et al. In vivo molecular and cellular imaging with quantum dots. Current
Opinion in Biotechnology 16, 63-72 (2005). 36. Nie, S.M., Xing, Y., Kim, G.J. & Simons, J.W. Nanotechnology applications in cancer.
Annual Review of Biomedical Engineering 9, 257-288 (2007). 37. Smith, A.M., Duan, H.W., Mohs, A.M. & Nie, S.M. Bioconjugated quantum dots for in
vivo molecular and cellular imaging. Advanced Drug Delivery Reviews 60, 1226-1240 (2008).
38. Rosenberg, J.T., Kogot, J.M., Lovingood, D.D., Strouse, G.F. & Grant, S.C. Intracellular
Bimodal Nanoparticles Based on Quantum Dots for High-Field MRI at 21.1 T. Magnetic
Resonance in Medicine 64, 871-882 (2010). 39. Cumberland, S.L. et al. Inorganic clusters as single-source precursors for preparation of
CdSe, ZnSe, and CdSe/ZnS nanomaterials. Chemistry of Materials 14, 1576-1584 (2002). 40. Gerbec, J.A., Magana, D., Washington, A. & Strouse, G.F. Microwave-enhanced reaction
rates for nanoparticle synthesis. Journal of the American Chemical Society 127, 15791-15800 (2005).

- 105 -
41. Lovingood, D.D. & Strouse, G.F. Microwave Induced In-Situ Active Ion Etching of Growing InP Nanocrystals. Nano Letters 8, 3394-3397 (2008).
42. Uemura, T. et al. Effects of intratracheally administered indium phosphide on male
Fischer 344 rats. Journal of Occupational Health 39, 205-210 (1997). 43. Yamazaki, K. et al. Long term pulmonary toxicity of indium arsenide and indium
phosphide instilled intratracheally in hamsters. Journal of Occupational Health 42, 169-178 (2000).
44. Jain, P.K., Huang, X., El-Sayed, I.H. & El-Sayad, M.A. Review of some interesting
surface plasmon resonance-enhanced properties of noble metal nanoparticles and their applications to biosystems. Plasmonics 2, 107-118 (2007).
45. Liu, G.L. et al. A nanoplasmonic molecular ruler for measuring nuclease activity and
DNA footprinting. Nature Nanotechnology 1, 47-52 (2006). 46. Yun, C.S. et al. Nanometal surface energy transfer in optical rulers, breaking the FRET
barrier. Journal of the American Chemical Society 127, 3115-3119 (2005). 47. Jennings, T.L., Singh, M.P. & Strouse, G.F. Fluorescent lifetime quenching near d=1.5
nm gold nanoparticles: Probing NSET validity. Journal of the American Chemical
Society 128, 5462-5467 (2006). 48. Jennings, T.L., Schlatterer, J.C., Singh, M.P., Greenbaum, N.L. & Strouse, G.F. NSET
molecular beacon analysis of hammerhead RNA substrate binding and catalysis. Nano
Letters 6, 1318-1324 (2006). 49. Singh, M.P. & Strouse, G.F. Involvement of the LSPR Spectral Overlap for Energy
Transfer between a Dye and Au Nanoparticle. Journal of the American Chemical Society 132, 9383-9391 (2010).
50. Kim, C.K. et al. Entrapment of Hydrophobic Drugs in Nanoparticle Monolayers with
Efficient Release into Cancer Cells. Journal of the American Chemical Society 131, 1360-1361 (2009).
51. Hong, R. et al. Glutathione-mediated delivery and release using monolayer protected
nanoparticle carriers. Journal of the American Chemical Society 128, 1078-1079 (2006). 52. Prigodich, A.E. et al. Nano-flares for mRNA Regulation and Detection. Acs Nano 3,
2147-2152 (2009). 53. Mason, B.P.S., J.L.; McQuade, D.T. in Molecular Recognition and Polymers: Control of
Polymer Structure and Self-Assembly. (ed. V.T. Rotello, S.) 179-206 (Wiley, Hoboken; 2008).

- 106 -
54. Kreft, O., Javier, A.M., Sukhorukov, G.B. & Parak, W.J. Polymer microcapsules as mobile local pH-sensors. Journal of Materials Chemistry 17, 4471-4476 (2007).
55. Rivera-Gil, P., De Koker, S., De Geest, B.G. & Parak, W.J. Intracellular processing of
proteins mediated by biodegradable polyelectrolyte capsules. Nano Lett 9, 4398-4402 (2009).
56. De Geest, B.G. et al. Polyelectrolyte microcapsules for biomedical applications. Soft
Matter 5, 282-291 (2009). 57. Kobaslija, M. & McQuade, D.T. Polyurea microcapsules from oil-in-oil emulsions via
interfacial polymerization. Macromolecules 39, 6371-6375 (2006). 58. Poe, S.L., Kobaslija, M. & McQuade, D.T. Microcapsule enabled multicatalyst system.
Journal of the American Chemical Society 128, 15586-15587 (2006). 59. Price, K.E. et al. Microencapsulated linear polymers: "Soluble" heterogeneous catalysts.
Journal of the American Chemical Society 128, 10376-10377 (2006). 60. Poe, S.L., Kobaslija, M. & McQuade, D.T. Mechanism and application of a microcapsule
enabled multicatalyst reaction. Journal of the American Chemical Society 129, 9216-9221 (2007).
61. del Mercato, L.L. et al. LbL multilayer capsules: recent progress and future outlook for
their use in life sciences. Nanoscale 2, 458-467 (2010). 62. van Meer, G. Membrane curvature sorts lipids - Stabilized lipid rafts in membrane
transport. Embo Reports 6, 418-419 (2005). 63. Kolb, H.C., Finn, M.G. & Sharpless, K.B. Click chemistry: Diverse chemical function
from a few good reactions. Angewandte Chemie-International Edition 40, 2004-2021 (2001).
64. Wang, Q., Chittaboina, S. & Barnhill, H.N. Advances in 1,3-dipolar cycloaddition
reaction of azides and alkynes - A prototype of "click" chemistry. Letters in Organic
Chemistry 2, 293-301 (2005). 65. Zhan, W.H., Barnhill, H.N., Sivakumar, K., Tian, T. & Wang, Q. Synthesis of
hemicyanine dyes for 'click' bioconjugation. Tetrahedron Letters 46, 1691-1695 (2005). 66. Ikeda, M. et al. Complex formation between cationic beta-1,3-glucan and hetero-
sequence oligodeoxynucleotide and its delivery into macrophage-like cells to induce cytokine secretion. Organic & Biomolecular Chemistry 5, 2219-2224 (2007).
67. Levy-Nissenbaum, E., Radovic-Moreno, A.F., Wang, A.Z., Langer, R. & Farokhzad,
O.C. Nanotechnology and aptamers: applications in drug delivery. Trends in
Biotechnology 26, 442-449 (2008).

- 107 -
68. Hassane, F.S., Saleh, A.F., Abes, R., Gait, M.J. & Lebleu, B. Cell penetrating peptides: overview and applications to the delivery of oligonucleotides. Cellular and Molecular
Life Sciences 67, 715-726 (2010). 69. Lerman, L.S. Structure of DNA-acridine complex. Proceedings of the National Academy
of Sciences of the United States of America 49, 94-& (1963). 70. Teipel, U. (ed.) Energetic Materials: Processing and Characterization of Particles.
(Wiley-VCH, Weinheim; 2005). 71. Choi, C.S. & Prince, E. Crystal-Structure of Cyclotrimethylene-Trinitramine. Acta
Crystallographica Section B-Structural Crystallography and Crystal Chemistry B 28, 2857-& (1972).
72. Unknown in NIMIC/NATO(2004). 73. A. Freche, J.A., L. Donnio, and C. Spyckerelle in Insensitive Munitions and Energetic
Materials Symposium, San Antonio, Texas, USA; (2000). 74. van der Heijden, A. et al. Energetic materials: Crystallization, characterization and
insensitive plastic bonded explosives. Propellants Explosives Pyrotechnics 33, 25-32 (2008).
75. L. Borne, A.B. in 12th International Detonation Symposium, San Diego, California,
USA; (2002). 76. I. J. Lochert, M.D.F., and B.L. Hamshere in DSTO Systems Sciences Laboratory,
Edinburgh, Australia; (2003). 77. Armstrong, R.W. & Elban, W.L. Materials science and technology aspects of energetic
(explosive) materials. Materials Science and Technology 22, 381-395 (2006). 78. van der Heijden, A., Bouma, R.H.B. & van der Steen, A.C. Physicochemical parameters
of nitramines influencing shock sensitivity. Propellants Explosives Pyrotechnics 29, 304-313 (2004).
79. McGrane, S.D., Grieco, A., Ramos, K.J., Hooks, D.E. & Moore, D.S. Femtosecond
micromachining of internal voids in high explosive crystals for studies of hot spot initiation. Journal of Applied Physics 105 (2009).
80. Armstrong, R.W. Dislocation Mechanics Aspects of Energetic Material Composites.
Reviews on Advanced Materials Science 19, 13-40 (2009). 81. Armstrong, R.W. Dislocation Mechanisms for Shock-Induced Hot-Spots. Journal De
Physique Iv 5, 89-102 (1995).

- 108 -
82. Stoltz, C.A., Mason, B.P. & Hooper, J. Neutron scattering study of internal void structure in RDX. Journal of Applied Physics 107 (2010).
83. Kim, D.Y. & Kim, K.J. Semi-quantitative Study on the Inclusion in Cooling
Crystallization of RDX Using Various Solvents. Propellants Explosives Pyrotechnics 35, 38-45 (2010).
84. Patil, M.N., Gore, G.M. & Pandit, A.B. Ultrasonically controlled particle size distribution
of explosives: A safe method. Ultrasonics Sonochemistry 15, 177-187 (2008). 85. W. H. M. Veltmans, A.E.D.M.v.d.H. in Proceedings of 14th International Symposium on
Industrial Crystallisation (IChemE), Cambridge, UK; (1995). 86. Elwenspoek, M., Bennema, P. & Vandereerden, J.P. Orientational Order in Naphthalene
Crystal Solution Interfaces. Journal of Crystal Growth 83, 297-305 (1987). 87. Roberts, C.W., Hira, S.M., Mason, B.P., Strouse, G.F. & Stoltz, C.A. Controlling RDX
explosive crystallite morphology and inclusion content via simple ultrasonic agitation and solvent evaporation. CrystEngComm 13, 1074-1076 (2011).
88. A. E. D. M. van der Heijde, W.D., C. J. M. van der Wulp in Proceedings of the 30th
International Annual Conference of ICT, Karlsruhe, Germany; (1999). 89. van der Heijden, A. & Bouma, R.H.B. Crystallization and characterization of RDX,
HMX, and CL-20. Crystal Growth & Design 4, 999-1007 (2004). 90. Lim, D.V., Simpson, J.M., Kearns, E.A. & Kramer, M.F. Current and developing
technologies for monitoring agents of bioterrorism and biowarfare. Clinical Microbiology
Reviews 18, 583-607 (2005). 91. Ivnitski, D. et al. Nucleic acid approaches for detection and identification of biological
warfare and infectious disease agents. Biotechniques 35, 862-869 (2003). 92. Ince, J. & McNally, A. Development of rapid, automated diagnostics for infectious
disease: advances and challenges. Expert Review of Medical Devices 6, 641-651 (2009). 93. Giljohann, D.A. & Mirkin, C.A. Drivers of biodiagnostic development. Nature 462, 461-
464 (2009). 94. Lazcka, O., Del Campo, F.J. & Munoz, F.X. Pathogen detection: A perspective of
traditional methods and biosensors. Biosensors & Bioelectronics 22, 1205-1217 (2007). 95. Wang, J. Electrochemical biosensors: Towards point-of-care cancer diagnostics.
Biosensors & Bioelectronics 21, 1887-1892 (2006).
- 109 -
96. Plutowski, U., Jester, S.S., Lenhert, S., Kappes, M.M. & Richert, C. DNA-based self-sorting of nanoparticles on gold surfaces. Advanced Materials 19, 1951-1956 (2007).
97. Gabureac, M., Bernau, L., Utke, I. & Boero, G. Granular Co-C nano-Hall sensors by
focused-beam-induced deposition. Nanotechnology 21. 98. Bain, C.D. et al. Formation of monolayer films by the spontaneous assembly of organic
thiols from solution onto gold. Journal of the American Chemical Society 111, 321-335 (1989).
99. Herne, T.M. & Tarlov, M.J. Characterization of DNA probes immobilized on gold
surfaces. Journal of the American Chemical Society 119, 8916-8920 (1997). 100. Wink, T., vanZuilen, S.J., Bult, A. & vanBennekom, W.P. Self-assembled monolayers
for biosensors. Analyst 122, R43-R50 (1997). 101. Festag, G. et al. Optimization of gold nanoparticle-based DNA detection for microarrays.
Journal of Fluorescence 15, 161-170 (2005). 102. Song, X.D., Shi, J. & Swanson, B. Flow cytometry-based biosensor for detection of
multivalent proteins. Anal. Biochem. 284, 35-41 (2000). 103. Shi, L.M. et al. The MicroArray Quality Control (MAQC) project shows inter- and
intraplatform reproducibility of gene expression measurements. Nature Biotechnology 24, 1151-1161 (2006).
104. Cao, Y.W.C., Jin, R.C. & Mirkin, C.A. Nanoparticles with Raman spectroscopic
fingerprints for DNA and RNA detection. Science 297, 1536-1540 (2002). 105. Campbell, C.T. & Kim, G. SPR microscopy and its applications to high-throughput
analyses of biomolecular binding events and their kinetics. Biomaterials 28, 2380-2392 (2007).
106. Taton, T.A., Mirkin, C.A. & Letsinger, R.L. Scanometric DNA array detection with
nanoparticle probes. Science 289, 1757-1760 (2000). 107. Dubertret, B., Calame, M. & Libchaber, A.J. Single-mismatch detection using gold-
quenched fluorescent oligonucleotides. Nature Biotechnology 19, 365-370 (2001). 108. Algar, W.R., Massey, M. & Krull, U.J. The application of quantum dots, gold
nanoparticles and molecular switches to optical nucleic-acid diagnostics. Trac-Trends in
Analytical Chemistry 28, 292-306 (2009). 109. Husale, S., Persson, H.H.J. & Sahin, O. DNA nanomechanics allows direct digital
detection of complementary DNA and microRNA targets. Nature 462, 1075-1078 (2009).

- 110 -
110. Clack, N.G., Salaita, K. & Groves, J.T. Electrostatic readout of DNA microarrays with charged microspheres. Nature Biotechnology 26, 825-830 (2008).
111. Johnson, D.S. et al. Systematic evaluation of variability in ChIP-chip experiments using
predefined DNA targets. Genome Research 18, 393-403 (2008). 112. Algar, W.R. & Krull, U.J. Toward A Multiplexed Solid-Phase Nucleic Acid
Hybridization Assay Using Quantum Dots as Donors in Fluorescence Resonance Energy Transfer. Analytical Chemistry 81, 4113-4120 (2009).
113. Gaylord, B.S., Heeger, A.J. & Bazan, G.C. DNA detection using water-soluble
conjugated polymers and peptide nucleic acid probes. Proceedings of the National
Academy of Sciences of the United States of America 99, 10954-10957 (2002). 114. Zhang, J., Ting, B.P., Jana, N.R., Gao, Z.Q. & Ying, J.Y. Ultrasensitive Electrochemical
DNA Biosensors Based on the Detection of a Highly Characteristic Solid-State Process. Small 5, 1414-1417 (2009).
115. Li, Y.G., Cu, Y.T.H. & Luo, D. Multiplexed detection of pathogen DNA with DNA-
based fluorescence nanobarcodes. Nature Biotechnology 23, 885-889 (2005). 116. Qin, W.J., Yim, O.S., Lai, P.S. & Yung, L.Y.L. Dimeric gold nanoparticle assembly for
detection and discrimination of single nucleotide mutation in Duchenne muscular dystrophy. Biosensors & Bioelectronics 25, 2021-2025.
117. Peterson, A.W., Heaton, R.J. & Georgiadis, R.M. The effect of surface probe density on
DNA hybridization. Nucleic Acids Research 29, 5163-5168 (2001). 118. Martins, V.C. et al. Femtomolar limit of detection with a magnetoresistive biochip.
Biosensors & Bioelectronics 24, 2690-2695 (2009). 119. Mirkin, C.A., Letsinger, R.L., Mucic, R.C. & Storhoff, J.J. A DNA-based method for
rationally assembling nanoparticles into macroscopic materials. Nature 382, 607-609 (1996).
120. Storhoff, J.J. et al. Gold nanoparticle-based detection of genomic DNA targets on
microarrays using a novel optical detection system. Biosensors & Bioelectronics 19, 875-883 (2004).
121. Storhoff, J.J., Lucas, A.D., Garimella, V., Bao, Y.P. & Muller, U.R. Homogeneous
detection of unamplified genomic DNA sequences based on colorimetric scatter of gold nanoparticle probes. Nature Biotechnology 22, 883-887 (2004).
122. Braun, G. et al. Surface-enhanced Raman spectroscopy for DNA detection by
nanoparticle assembly onto smooth metal films. Journal of the American Chemical
Society 129, 6378-6379 (2007).

- 111 -
123. Arruda, D.L. et al. Microelectrical sensors as emerging platforms for protein biomarker detection in point-of-care diagnostics. Expert Review of Molecular Diagnostics 9, 749-755 (2009).
124. Schotter, J. et al. Comparison of a prototype magnetoresistive biosensor to standard
fluorescent DNA detection. Biosensors & Bioelectronics 19, 1149-1156 (2004). 125. Germano, J. et al. A portable and autonomous magnetic detection platform for
biosensing. Sensors 9, 4119-4137 (2009). 126. Graham, D.L. et al. Magnetic field-assisted DNA hybridisation and simultaneous
detection using micron-sized spin-valve sensors and magnetic nanoparticles. Sensors and
Actuators B-Chemical 107, 936-944 (2005). 127. Ferreira, H.A. et al. Detection of cystic fibrosis related DNA targets using AC field
focusing of magnetic labels and spin-valve sensors. Ieee Transactions on Magnetics 41, 4140-4142 (2005).
128. Hall, D.A. et al. GMR biosensor arrays: A system perspective. Biosensors &
Bioelectronics 25, 2051-2057 (2010). 129. Osterfeld, S.J. et al. Multiplex protein assays based on real-time magnetic nanotag
sensing. Proceedings of the National Academy of Sciences of the United States of
America 105, 20637-20640 (2008). 130. Baselt, D.R. et al. A biosensor based on magnetoresistance technology. Biosensors &
Bioelectronics 13, 731-739 (1998). 131. Edelstein, R.L. et al. The BARC biosensor applied to the detection of biological warfare
agents. Biosensors & Bioelectronics 14, 805-813 (2000). 132. Li, Y.Q. et al. Hall magnetometry on a single iron nanoparticle. Applied Physics Letters
80, 4644-4646 (2002). 133. Sandhu, A. et al. High efficiency Hall effect micro-biosensor platform for detection of
magnetically labeled biomolecules. Biosensors & Bioelectronics 22, 2115-2120 (2007). 134. Mihajlovic, G. et al. Detection of single magnetic bead for biological applications using
an InAs quantum-well micro-Hall sensor. Applied Physics Letters 87, 112502 (2005). 135. Mihajlovic, G., Xiong, P., von Molnar, S., Field, M. & Sullivan, G.J. InAs quantum well
Hall devices for room-temperature detection of single magnetic biomolecular labels. Journal of Applied Physics 102, 034506 (2007).
136. Manandhar, P. et al. The detection of specific biomolecular interactions with micro-Hall
magnetic sensors. Nanotechnology 20, 35501 (2009).

- 112 -
137. Besse, P.A., Boero, G., Demierre, M., Pott, V. & Popovic, R. Detection of a single magnetic microbead using a miniaturized silicon Hall sensor. Applied Physics Letters 80, 4199-4201 (2002).
138. Gaster, R.S. et al. Matrix-insensitive protein assays push the limits of biosensors in
medicine. Nature Medicine 15, 1327-1332 (2009). 139. Mihajlovic, G., von Molnar, S in Nanoscale Magnetic Materials and Applications. (ed.
J.P. Liu, Fullerton, E., Gutfleisch, O., Sellmyer, D.J.) 685-710 (Springer, New York; 2009).
140. Behet, M., Bekaert, J., De Boeck, J. & Borghs, G. InAs/Al0.2Ga0.8Sb quantum well Hall
effect sensors. Sensors and Actuators a-Physical 81, 13-17 (2000). 141. Ron, H. & Rubinstein, I. Alkanethiol monolayers on preoxidized gold-encapsulation of
gold oxide under an organic monolayer. Langmuir 10, 4566-4573 (1994). 142. Tsai, M.Y. & Lin, J.C. Preconditioning gold substrates influences organothiol self-
assembled monolayer (SAM) formation. Journal of Colloid and Interface Science 238, 259-266 (2001).
143. Kannan, B., Kulkarni, R.P. & Majumdar, A. DNA-based programmed assembly of gold
nanoparticles on lithographic patterns with extraordinary specificity. Nano Letters 4, 1521-1524 (2004).
144. Gonzalez, M., Argarana, C.E. & Fidelio, G.D. Extremely high thermal stability of
streptavidin and avidin upon biotin binding. Biomolecular Engineering 16, 67-72 (1999). 145. Lee, C.Y. et al. Surface coverage and structure of mixed DNA/alkylthiol monolayers on
gold: Characterization by XPS, NEXAFS, and fluorescence intensity measurements. Analytical Chemistry 78, 3316-3325 (2006).
146. Demers, L.M. et al. Direct patterning of modified oligonucleotides on metals and
insulators by dip-pen nanolithography. Science 296, 1836-1838 (2002). 147. Kohler, J. et al. Familial hypertrophic cardiomyopathy mutations in troponin I (K183
Delta, G203S, K206Q) enhance filament sliding. Physiological Genomics 14, 117-128 (2003).
148. Parmacek, M.S. & Solaro, R.J. Biology of the troponin complex in cardiac myocytes.
Progress in Cardiovascular Diseases 47, 159-176 (2004). 149. Sang, Q.X.A. et al. Matrix metalloproteinase inhibitors as prospective agents for the
prevention and treatment of cardiovascular and neoplastic diseases. Current Topics in
Medicinal Chemistry 6, 289-316 (2006).

- 113 -
150. Rodriguez, D., Morrison, C.J. & Overall, C.M. Matrix metalloproteinases: What do they not do? New substrates and biological roles identified by murine models and proteomics. Biochimica Et Biophysica Acta-Molecular Cell Research 1803, 39-54 (2010).
151. Golubkov, V.S. et al. Membrane type-1 matrix metalloproteinase (MT1-MMP) exhibits
an important intracellular cleavage function and causes chromosome instability. Journal
of Biological Chemistry 280, 25079-25086 (2005). 152. Mazzone, M. et al. Intracellular processing and activation of membrane type 1 matrix
metalloprotease depends on its partitioning into lipid domains. Journal of Cell Science 117, 6275-6287 (2004).
153. Wysocki, A.B., Staianocoico, L. & Grinnell, F. Wound fluid from chronic leg ulcers
contains elevated levels of metalloproteinases MMP-2 and MMP-9. Journal of
Investigative Dermatology 101, 64-68 (1993). 154. Golubkov, V.S. & Strongin, A.Y. Proteolysis-driven oncogenesis. Cell Cycle 6, 147-150
(2007). 155. Hu, J.L., Van den Steen, P.E., Sang, Q.X.A. & Opdenakker, G. Matrix metalloproteinase
inhibitors as therapy for inflammatory and vascular diseases. Nature Reviews Drug
Discovery 6, 480-498 (2007). 156. Wolf, K. et al. Multi-step pericellular proteolysis controls the transition from individual
to collective cancer cell invasion. Nature Cell Biology 9, 893-U839 (2007). 157. Cao, J. et al. Membrane type 1 matrix metalloproteinase induces epithelial-to-
mesenchymal transition in prostate cancer. Journal of Biological Chemistry 283, 6232-6240 (2008).
158. Nagase, H., Visse, R. & Murphy, G. Structure and function of matrix metalloproteinases
and TIMPs. Cardiovascular Research 69, 562-573 (2006). 159. Visse, R. & Nagase, H. Matrix metalloproteinases and tissue inhibitors of
metalloproteinases - Structure, function, and biochemistry. Circulation Research 92, 827-839 (2003).
160. Crocker, J. in The Biology of Disease, Edn. 2nd. (ed. J. Philips, Murray, P., Kish, P.R.)
(Blackwell Science Ltd., Malden, MA, USA; 2001). 161. Vanwart, H.E. & Birkedalhansen, H. The cysteine switch - a principle of regulation of
metalloproteinase activity with potential applicability to the entire matrix metalloproteinase gene family. Proceedings of the National Academy of Sciences of the
United States of America 87, 5578-5582 (1990).

- 114 -
162. Zitka, O. et al. Matrix Metalloproteinases. Current Medicinal Chemistry 17, 3751-3768 (2010).
163. Jiang, A.X. et al. Regulation of membrane-type matrix metalloproteinase 1 activity by
dynamin-mediated endocytosis. Proceedings of the National Academy of Sciences of the
United States of America 98, 13693-13698 (2001). 164. Remacle, A.G., Rozanov, D.V., Fugere, M., Day, R. & Strongin, A.Y. Furin regulates the
intracellular activation and the uptake rate of cell surface-associated MT1-MMP. Oncogene 25, 5648-5655 (2006).
165. Cao, J., Chiarelli, C., Kozarekar, P. & Adler, H.L. Membrane type I-matrix
metalloproteinase promotes human prostate cancer invasion and metastasis. Thrombosis
and Haemostasis 93, 770-778 (2005). 166. Gonzalo, P., Moreno, V., Galvez, B.G. & Arroyo, A.G. MT1-MMP and integrins: Hand-
to-hand in cell communication. Biofactors 36, 248-254 (2010). 167. Cauwe, B. & Opdenakker, G. Intracellular substrate cleavage: a novel dimension in the
biochemistry, biology and pathology of matrix metalloproteinases. Critical Reviews in
Biochemistry and Molecular Biology 45, 351-423 (2010). 168. Nagase, H. & Woessner, J.F. Matrix metalloproteinases. Journal of Biological Chemistry
274, 21491-21494 (1999). 169. Mazzieri, R. et al. Control of type IV collagenase activity by components of the
urokinase-plasmin system: A regulatory mechanism with cell-bound reactants. Embo
Journal 16, 2319-2332 (1997). 170. Morrison, C.J. & Overall, C.M. TIMP independence of matrix metalloproteinase (MMP)-
2 activation by membrane type 2 (MT2)-MMP is determined by contributions of both the MT2-MMP catalytic and hemopexin C domains. Journal of Biological Chemistry 281, 26528-26539 (2006).
171. Zucker, S. et al. Tissue inhibitor of metalloproteinase-2 (TIMP-2) binds to the catalytic
domain of the cell surface receptor, membrane type 1 matrix metalloproteinase 1 (MT1-MMP). Journal of Biological Chemistry 273, 1216-1222 (1998).
172. Zucker, S., Hymowitz, M., Conner, C., DeClerck, Y. & Cao, J. TIMP-2 is released as an
intact molecule following binding to MT1-MMP on the cell surface. Experimental Cell
Research 293, 164-174 (2004). 173. Uekita, T. et al. Membrane-type 1 matrix metalloproteinase cytoplasmic tail-binding
protein-1 is a new member of the Cupin superfamily - A possible multifunctional protein acting as an invasion suppressor down-regulated in tumors. Journal of Biological
Chemistry 279, 12734-12743 (2004).
- 115 -
174. Itoh, Y. & Seiki, M. MT1-MMP: an enzyme with multidimensional regulation. Trends in
Biochemical Sciences 29, 285-289 (2004). 175. Frittoli, E., Palamidessi, A., Disanza, A., Scita, G. Secretory and endo/exocytic
trafficking in invadopodia formation: The MT1-MMP paradigm. European Journal of
Cell Biology 90, 108-114 (2011). 176. Wu, Y.I. et al. Activation-coupled membrane-type 1 matrix metalloproteinase membrane
trafficking. Biochemical Journal 407, 171-177 (2007). 177. Bravo-Cordero, J.J. et al. MT1-MMP proinvasive activity is regulated by a novel Rab8-
dependent exocytic pathway. Embo Journal 26, 1499-1510 (2007). 178. Osenkowski, P., Toth, M. & Fridman, R. Processing, shedding, and endocytosis of
membrane type 1-matrix metalloproteinase (MT1-MMP). Journal of Cellular Physiology 200, 2-10 (2004).
179. Coussens, L.M., Fingleton, B. & Matrisian, L.M. Cancer therapy - Matrix
metalloproteinase inhibitors and cancer: Trials and tribulations. Science 295, 2387-2392 (2002).
180. Zucker, S. & Cao, J. Selective matrix metalloproteinase (MMP) inhibitors in cancer
therapy Ready for prime time? Cancer Biology & Therapy 8, 2371-2373 (2009). 181. Turk, B. Targeting proteases: successes, failures and future prospects. Nature Reviews
Drug Discovery 5, 785-799 (2006). 182. Drag, M. & Salvesen, G.S. Emerging principles in protease-based drug discovery. Nature
Reviews Drug Discovery 9, 690-701 (2010). 183. Pavlaki, M. & Zucker, S. Matrix metalloproteinase inhibitors (MMPIs): The beginning of
phase I or the termination of phase III clinical trials. Cancer and Metastasis Reviews 22, 177-203 (2003).
184. Sparano, J.A. et al. Randomized phase III trial of marimastat versus placebo in patients
with metastatic breast cancer who have responding or stable disease after first-line chemotherapy: Eastern Cooperative Oncology Group Trial E2196. Journal of Clinical
Oncology 22, 4683-4690 (2004). 185. Knight, C.G., Willenbrock, F. & Murphy, G. A novel coumarin-labeled peptide for
sensitive continuous assays of the matrix matalloproteinases. Febs Letters 296, 263-266 (1992).
186. Cobos-Correa, A., Trojanek, J.B., Diemer, S., Mall, M.A. & Schultz, C. Membrane-
bound FRET probe visualizes MMP12 activity in pulmonary inflammation. Nature
Chemical Biology 5, 628-630 (2009).
- 116 -
187. Ouyang, M.X. et al. Simultaneous Visualization of Protumorigenic Src and MT1-MMP Activities with Fluorescence Resonance Energy Transfer. Cancer Research 70, 2204-2212 (2010).
188. Ouyang, M.X. et al. Visualization of polarized membrane type 1 matrix
metalloproteinase activity in live cells by fluorescence resonance energy transfer imaging. Journal of Biological Chemistry 283, 17740-17748 (2008).
189. Zhao, T. et al. A novel strategy to tag matrix metalloproteinases-positive cells for in vivo
imaging of invasive and metastatic activity of tumor cells. Journal of Controlled Release 144, 109-114 (2010).
190. Zhang, Y., So, M.K. & Rao, J.H. Protease-modulated cellular uptake of quantum dots.
Nano Letters 6, 1988-1992 (2006). 191. Scherer, R.L., McIntyre, J.O. & Matrisian, L.M. Imaging matrix metalloproteinases in
cancer. Cancer and Metastasis Reviews 27, 679-690 (2008). 192. Bremer, C., Tung, C.H. & Weissleder, R. In vivo molecular target assessment of matrix
metalloproteinase inhibition. Nature Medicine 7, 743-748 (2001). 193. Faust, A. et al. Synthesis and evaluation of a novel fluorescent photoprobe for imaging
matrix metalloproteinases. Bioconjugate Chemistry 19, 1001-1008 (2008). 194. Faust, A. et al. Synthesis and Evaluation of a Novel Hydroxamate Based Fluorescent
Photoprobe for Imaging of Matrix Metalloproteinases. Bioconjugate Chemistry 20, 904-912 (2009).
195. Keller, U.A.D. et al. Novel Matrix Metalloproteinase Inhibitor [F-18]Marimastat-
Aryltrifluoroborate as a Probe for In vivo Positron Emission Tomography Imaging in Cancer. Cancer Research 70, 7562-7569 (2010).
196. Rouffet, M. et al. From Sensors to Silencers: Quinoline-and Benzimidazole-Sulfonamides
as Inhibitors for Zinc Proteases. Journal of the American Chemical Society 132, 8232-8233 (2010).
197. Park, H.I. et al. The intermediate S1 ' pocket of the endometase/matrilysin-2 active site
revealed by enzyme inhibition kinetic studies, protein sequence analyses, and homology modeling. Journal of Biological Chemistry 278, 51646-51653 (2003).
198. Hurst, D.R. et al. Catalytic- and ecto-domains of membrane type 1-matrix
metalloproteinase have similar inhibition profiles but distinct endopeptidase activities. Biochemical Journal 377, 775-779 (2004).

- 117 -
199. Hurst, D.R. et al. Inhibition of enzyme activity of and cell-mediated substrate cleavage by membrane type 1 matrix metalloproteinase by newly developed mercaptosulphide inhibitors. Biochemical Journal 392, 527-536 (2005).
200. Schwartz, M.A., Jin, Y., Hurst, D.R., Sang, Q.-X.A. “Substituted heterocyclic
mercaptosulfide inhibitors” ((Florida State University Research Foundation, Inc., USA). Application: WO/2005/032541; 2005).
201. Schwartz, M.A., Jin, Y., Sang, Q.-X.A. “Substituted heterocyclic mercaptosulfonamide
metalloprotease inhibitors” ((Florida State University Research Foundation, Inc., USA). Application: WO/2010/028051; 2010).
202. Grams, F. et al. Pyrimidine-2,4,6-triones: A new effective and selective class of matrix
metalloproteinase inhibitors. Biological Chemistry 382, 1277-1285 (2001). 203. Smith, S.N. & Steer, R.P. The photophysics of Lissamine rhodamine-B sulphonyl
chloride in aqueous solution: implications for fluorescent protein-dye conjugates. Journal
of Photochemistry and Photobiology a-Chemistry 139, 151-156 (2001). 204. Haugland, R.P. The handbook: A guide to fluorescent probes and labeling technologies,
Edn. 10th. (Invitrogen Corp., 2005). 205. Nagakawa, O. et al. Expression of membrane-type 1 matrix metalloproteinase (MT1-
MMP) on prostate cancer cell lines. Cancer Letters 155, 173-179 (2000). 206. Daja, M.M., Niu, X., Zhao, Z., Brown, J.M. & Russell, P.J. Characterization of
expression of matrix metalloproteinases and tissue inhibitors of metalloproteinases in prostate cancer cell lines. Prostate Cancer and Prostatic Diseases 6, 15-26 (2003).
207. Puri, C. et al. Overexpression of myosin VI in prostate cancer cells enhances PSA and
VEGF secretion, but has no effect on endocytosis. Oncogene 29, 188-200 (2010). 208. Dunn, T.A. et al. A novel role of myosin VI in human prostate cancer. American Journal
of Pathology 169, 1843-1854 (2006). 209. Soldati, T. & Schliwa, M. Powering membrane traffic in endocytosis and recycling.
Nature Reviews Molecular Cell Biology 7, 897-908 (2006). 210. Clark, I.M. Matrix metalloproteinase protocols (methods in molecular biology), Edn. 1st.
(Humana Press, 2001).

- 118 -
BIOGRAPHICAL SKETCH
STEVEN M. HIRA EDUCATION
Florida State University, Tallahassee, Florida, August 2004 - April 2011 Ph.D. in Inorganic Chemistry Advisor: Prof. Geoffrey F. Strouse
Dissertation Title: Targeted dye labeling as a tool for imaging material
and biomaterial microenvironments
Roger Williams University, Bristol, Rhode Island, September 1999 - December 2003 B.S in Chemistry, Marine Biology
PUBLICATIONS
1. Hira, S.M., Jin, Y., Roycik, M.D., Bosco, D.B., Cao, J., Schwartz, M.A., Strouse, G.F., Sang, Q.X.A. Live-cell optical tracking of a novel dye labeled matrix metalloproteinase inhibitor (MMPI) in prostate cancer cells. Manuscript in preparation.
2. Hira, S.M., Aledealat, K., Chen, K., Field, M., Sullivan, G.J., Chase, P.B., Xiong, P., von
Molnár, S., Strouse, G.F. Detection of target single stranded DNA using a micro-fabricated Hall magnetometer with correlated optical readout. Manuscript submitted.
3. Roberts, C.W., Hira, S.M., Mason, B.P., Strouse, G.F., Stoltz, C.A. Controlling RDX
explosive crystallite morphology and inclusion content via simple ultrasonic agitation and solvent evaporation. CrystEngComm 13, 1074-1076 (2011).
4. Mason, B.P., Hira, S.M., Strouse, G.F., McQuade, D.T. Microcapsules with three orthogonal reactive sites. Organic Letters 11(7), 1479-1482 (2009).
5. Yuan, J., Hira, S.M., Strouse, G.F., Hirst, L.S. Lipid Bilayer Discs and Banded Tubules: Photoinduced lipid sorting in ternary mixtures. Journal of the American Chemical Society 130(6), 2067-2072 (2008).
6. Sarno, D.M., Martin, J.J., Hira, S.M., Timpson, C.J., Gaffney, J.P., Jones, W.E., Jr. Enhanced conductivity of thin film polyaniline by self-assembled transition metal complexes. Langmuir 23(2), 879-884 (2007).
7. Yun, C.S., Javier, A., Jennings, T., Fisher, M.; Hira, S., Peterson, S., Hopkins, B., Reich,
N.O., Strouse, G.F. Nanometal surface energy transfer in optical rulers, breaking the FRET barrier. Journal of the American Chemical Society 127(9), 3115-3119 (2005).

- 119 -
PATENTS
1. U.S. Provisionary Patent Application No. 61/393,981 - (2010) “Devices and Methods for Detection of Biomolecular Interactions”
CONFERENCE PRESENTATIONS (presented, co-authored)
2010 - 54th Biophysical Society National Meeting, San Francisco, CA - Poster - 2107- POS. Hira, S.M., Aledealat, K., Chen, K., Xiong, P., von Molnár, S., Chase, P.B., Strouse, G.F. “Magnetic and fluorescence detection of hybridized DNA assemblies immobilized onto a Hall device“ 2008 - American Physical Society March Meeting, New Orleans, LA. Aledealat, K., Hira, S.M., Chen, K., Mihajlovic, G., Xiong, P., Strouse, G.F., Chase, P.B., Field, M., Sullivan, G.J. “InAs quantum well µ-Hall sensors for magnetic biosensing“ 2008 - 52nd Biophysical Society National Meeting, Long Beach, CA - Poster - 1666-POS. Hira, S.M., Aledealat, K., Xiong, P., von Molnár, S., Strouse, G.F., Chase, P.B. “Fluorescence and magnetic detection of hybridized DNA assemblies on a micro-Hall device“ 2007 - 234th American Chemical Society National Meeting, Boston, MA - Poster - ANYL-140. Hira, S.M., Strouse, G.F., Chase, P.B., Xiong, P., von Molnár, S. “Fluorescent and magnetic detection of controlled DNA assemblies on Au patterned SiO2 devices“ 2007 - Materials Research Society National Meeting, Boston, MA - Oral - PP8.5. Hira, S.M., Xiong, P., von Molnár, S., Chase, P.B., Strouse, G.F. “Fluorescent and magnetic detection of hybridized DNA assemblies on a Au patterned SiO2 device“ 2006 - Materials Research Society National Meeting, Boston, MA - Oral - D17.4. Hira, S., Manandhar, P., Xiong, P., Chase, P.B., von Molnár, S., Strouse, G. “Optical and magnetic mismatch detection of controlled DNA assemblies onto Au patterned SiO2 devices“ 2004 - 228th American Chemical Society National Meeting, Philadelphia, PA – PMSE-207. Martin, J.J., Hira, S.M., Ochanda, F., Gaffney, J.P., Sarno, D.M., Jones, W.E. “Modification of conducting polymer thin films by self-assembled transition metal surfaces“ 2003 - 225th American Chemical Society National Meeting, New Orleans, LA - Poster - CHED-699. Hira, S.M., Minnella, J.E., , Timpson, C.J. “Spectroelectrochemical investigations of ligand-bridged ruthenium complexes based on trans-trans-[Cl(pyridine)(4)Ru-(L)-Ru(pyridine)(4)Cl]“

- 120 -
2001 - 221st American Chemical Society National Meeting, San Diego, CA - Poster - CHED-40. Hira, S.M., Petrichko, R.J., Kuber, A.L., Nandor, H., Von Riesen, D.D., Timpson, C.J. “Synthesis and characterization of novel ligand-bridged ruthenium complexes“ 2001 - 221st American Chemical Society National Meeting, San Diego, CA - CHED-362 Kuber, A., Nandor, H., Hira, S., Petrichko, R., Von Riesen, D.D., Timpson, C. “In-situ generation of trans-[Ru(pyridine)(4)(L)(solvent)](2+) obtained by Cl- abstraction from trans-[Ru(pyridine)(4)(L)(Cl)](+)“
2000 - 219th American Chemical Society National Meeting, San Franscisco, CA - CHED-716. Calvo, D.R., Koehler, E.O., Grant, B.A., Kuber, A.L., Shah, N.K., Hira, S.M., Von Riesen, D.D., Timpson, C.J. “Synthesis and characterization of novel ligand-bridged ruthenium compounds“
AWARDS AND FUNDING Navy Surface Warfare Center (NSWC) - Indian Head Division (2010)
- $10,000 Subcontract for microscopy characterization development and analysis of energetic materials
Hoffman Merit Award - Florida State University (2004)
- $3,000 award to first year Teaching Assistants for previous academic achievements Nation Science Foundation Research Experience for Undergraduates (NSF-REU) - (2003) MEMBERSHIPS/AFFILIATIONS American Chemical Society (ACS) Materials Research Society (MRS) Biophysical Society
EXPERIENCE Graduate Research Assistant
Florida State University, August 2004 - April 2011 Advisor: Prof. Geoffrey F. Strouse Research involved:
The use of optical probes for material and biomaterial imaging and detection Bio-functionalization and interfacing of condensed matter surfaces for bio-
sensor applications
Design and Syntheses of materials for optical detection (dye-labeling, Au nanoparticles)
Synthetic DNA design and nanoparticle surface and bio-functionalization

- 121 -
Material delivery into cells (CHO, HEK, HEKu, hMSC, LNCaP, LNCaP-GFP, LNCaP-MT1-GFP)
Microscopy characterization included: Bright-field, Wide-field, Total Internal Reflectance Fluorescence (TIRF), Laser Scanning Confocal Microscopy (LCSM), Spectral Confocal Microscopy, Live-cell imaging, Atomic Force Microscopy (AFM), Scanning Electron Microscopy (SEM)
Other skills/techniques included: Absorption (UV-Vis), Photoluminescence, Gel Electrophoresis, Chromatography (HPLC, FPLC, Ion Exchange, Size Exclusion), cell culture (BSL1, BSL2)
Graduate Teaching Assistant - Florida State University, 2004 - 2006, 2010 Courses Taught: - General Chemistry I Lab, CHM 1045 (majors) - General Chemistry II Recitation, CHM 1046 (majors) Duties included: - Prepared and provided lectures and quizzes - Graded exams, quizzes and lab reports - Encouraged and held office hours for one-on-one student consultations - Demonstrated proper lab technique and safety
Undergraduate Research Assistant
Roger Williams University, September 1999 - December 2003
Advisor: Prof. Cliff J. Timpson Research involved:
Synthesized and characterized ruthenium polypyridyl complexes for alternative energy applications
Analytical techniques included: Absorption (UV-Vis), infra-red (IR), Electrochemistry (cyclic voltammetry, bulk electrolysis, spectrophotometric studies)
Undergraduate Research Assistant State University of New York (SUNY) at Binghamton,
NSF-REU, May 2003 - August 2003 Advisor: Prof. Wayne E. Jones, Jr. Research involved:
Synthesized and characterized polymer thin films for inorganic hybrid materials for electronics packaging applications
Analytical techniques included: Absorption (UV-Vis), IR, AFM, 4-probe conductivity

- 122 -
Gordon Research Conference (GRC)
Site Manager - Roger Williams University, May-August 2000 - 2002
Administrative duties involved: Organized and maintained GRC conference site Direct contact time with conference chair, conferees, RWU personnel Managed 3 GRC staff
ADDITIONAL SKILLS Proficient with the following software: Adobe Suite, Microsoft Office, Origin, Igor, Chem Office, Maple