florida - ocps.net€¦ · 15-01-2020 · liberty county-29.7% greatest percentage decline 8....
TRANSCRIPT

The Florida Legislature
Office of Economic and
Demographic Research
850.487.1402
http://edr.state.fl.us
Presented by:
Florida:An Economic Overview
January 15, 2020
Revisions to the version released January 8, 2020 recognize the
General Revenue Conference results from January 15, 2020.
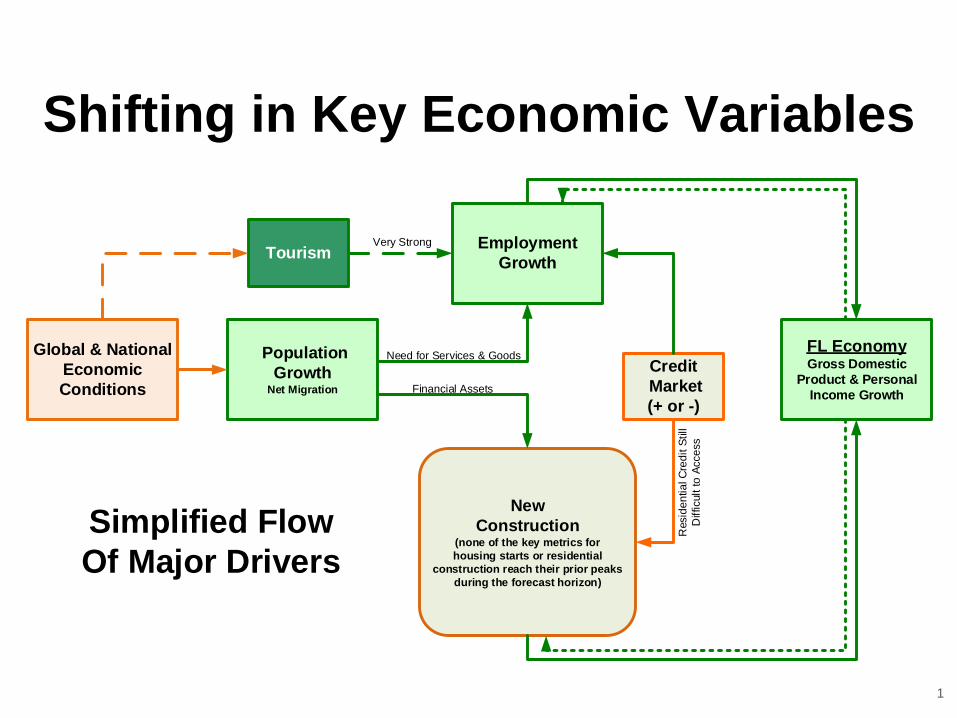
Shifting in Key Economic Variables
1
New
Construction(none of the key metrics for
housing starts or residential
construction reach their prior peaks
during the forecast horizon)
Population
GrowthNet Migration
Employment
Growth
FL EconomyGross Domestic
Product & Personal
Income Growth
Credit
Market
(+ or -)
Global & National
Economic
Conditions Financial Assets
Need for Services & Goods
Simplified Flow
Of Major Drivers
Tourism
Resid
en
tia
l C
red
it S
till
Difficult t
o A
cce
ss
Very Strong

Economy Has Continued Growth...
In the latest revised data for the 2018 calendar year, the state’s growth slowed slightly, but remained above the national average (3.2 percent versus 2.9 percent). The Economic Estimating Conference projects that Florida’s Real Gross Domestic Product (GDP) will slow to growth of 2.5 percent in Fiscal Year 2019-20 and continue slowing in the near term to 1.6 percent in Fiscal Years 2022-23 and 2023-24. In the longer term, growth is expected to average 2.0 percent per year.
For the second quarter of the 2019 calendar
year, Florida posted growth of 2.0 percent,
matching the national average, and ranking
the state 17th in the country for real growth.
Unlike the US as a whole, Florida’s largest
contributor to its growth was real estate and
rental & leasing.
2
2.9%
6.5%
-5.6%
3.2%
-8.0%
-6.0%
-4.0%
-2.0%
0.0%
2.0%
4.0%
6.0%
8.0%
19
98
19
99
20
00
20
01
20
02
20
03
20
04
20
05
20
06
20
07
20
08
20
09
20
10
20
11
20
12
20
13
20
14
20
15
20
16
20
17
20
18
Year-Over-Year Growth in FL and US Real GDP
US Growth FL Growth

FL Personal Income Growth Is Strong, Driven in
Part by Robust Population Growth...
In the latest revised data for State Personal Income for the 2016 calendar year, Florida’s personal income
growth slowed to 2.9%; however, this was still above the national average of 2.6%. For 2017, Florida’s
growth increased to 6.5% over the prior year, compared to national growth of 4.7%. For 2018, Florida’s
growth slowed slightly to 6.2% compared to the national average of 5.6%. In the near term, the annual
growth rates for the state are expected to drift from 5.1% (FY 2019-20) down to 4.1% (FY 2020-21 and FY
2022-23). In the longer term, growth is expected to average 4.3 percent per year.
In spite of the robust year-over-year growth, Florida’s per capita personal income growth trailed the nation in
performance in 2018, growing only 4.6% in 2018 compared to the national average of 4.9%.
The third quarter results for
the 2019 calendar year
indicated that Florida ranked
29th in the country with 3.5
percent growth over the
prior quarter. The state was
below the United States as
a whole, which had 3.8
percent growth. Healthcare
and social assistance was
the leading contributor to the
earnings increase.
3

Florida’s average annual wage has typically been below the US average. The most recent data for the 2018
calendar year showed that Florida’s average wage, relative to the US average, continued to fall from 2016
when it was 87.7% to 87.4% in 2018. The ratio in 2014 (87.2%) was Florida’s lowest percentage since 2001.
In part, the lower than average wage gains have to do with the mix of jobs that have been growing the
fastest in Florida and their average wages. For example, the Accommodation & Food Services employment
sector is large, has the lowest average annual wage and had until recently been growing faster than overall
employment in the state. This industry sector is closely related to the health of Florida’s tourism industry that
had a record 130.0 million visitors in FY 2018-19, an increase of 7.0% over FY 2017-18. Effectively, these
visitors were equivalent to 1.8 million additional people being added to Florida’s resident population.
Wage Gap Increased in 2018…
4

Average Annual Wage by County…
Source: Bureau of Labor Statistics, Quarterly Census of Employment and Wages
5
There are two possible
reasons for lower than
average wages in Florida,
and they have different
economic interpretations. As
described previously, the first
has to do with the mix of jobs
that have been growing the
fastest. The second has to
do with the range and
distribution of wages across
a community: a narrow band
typically has more to do with
opportunity and poverty.
Urban workers generally
have a higher return to
education through higher
wages.
Miami-Dade County $54,786
Holmes County $31,561

Current Employment Conditions Strong…
November Nonfarm Jobs (YOY)
US 1.5%
FL 2.5%
YR: 217,400 jobs
Peak: +1,034,300 jobs
[Prior Employment Peak passed in May 2015]
November Unemployment Rate
US 3.5%
FL 3.1% (322,500 jobless persons)
The Revenue Estimating Conference assumes
Florida has fallen below the “full employment”
unemployment rate (about 4 percent).
Highest Monthly Rate
11.3% (January 2010)
Lowest Monthly Rate
3.1% (March 2006)
6

The still noteworthy size and composition of the long-term unemployed group (87,200 persons or
25.9% of all unemployed in November) may be confounding some of the trend results. The equivalent
percentage for the United States as a whole was only 20.8%. Even though the share of the long term
unemployed is still relatively elevated compared to historical levels for this stage in the business cycle,
prior to the past six months, the rate had been steadily declining when compared to levels from the
same month a year ago.
But, Florida’s Participation Rate Low…
7
Florida’s labor force
participation rate peaked
during the Housing Boom at
64.1% from December 2006
to February 2007. While the
unemployment rate is now
similar to that time at 3.1%,
the labor force participation
rate is not. Florida’s rate was
59.5% in November 2019,
while the US rate was 63.2%.
A higher state participation
rate would imply a higher
unemployment rate, at least
in the short run.

Across the State, Employment Picture Is
Improving, but Polarized…
• Comparing March data over the year, it took Florida nine years to finally
surpass its March 2007 level of employment.
• Like last year, almost two-thirds (42) of Florida’s counties have gained
employment relative to their levels in March 2007.
Area March 2007 to
March 2019
Sumter
County
54.6% Greatest
Percentage
Increase
Florida 9.9%
Liberty
County
-29.7% Greatest
Percentage
Decline
8

Population Growth Slowing Slightly...
Population growth is the state’s primary engine of economic growth, fueling
both employment and income growth.
Florida’s population grew by 1.77% between April 1, 2018 and April 1, 2019
to 21,208,589, adding 368,021 residents. Over the next five years, Florida’s
population growth is expected to continually slow to 1.34%, but still average
1.5% for the entire period (2019 through 2024).
Almost all of Florida’s population growth through 2030 will be from net
migration.
Nationally, average annual growth will be about 0.66% between 2019 and
2030.
The future will be different than the past; Florida’s long-term growth rate
between 1970 and 1995 was over 3%.
Florida is currently the third most populous state, behind California and
Texas.
9
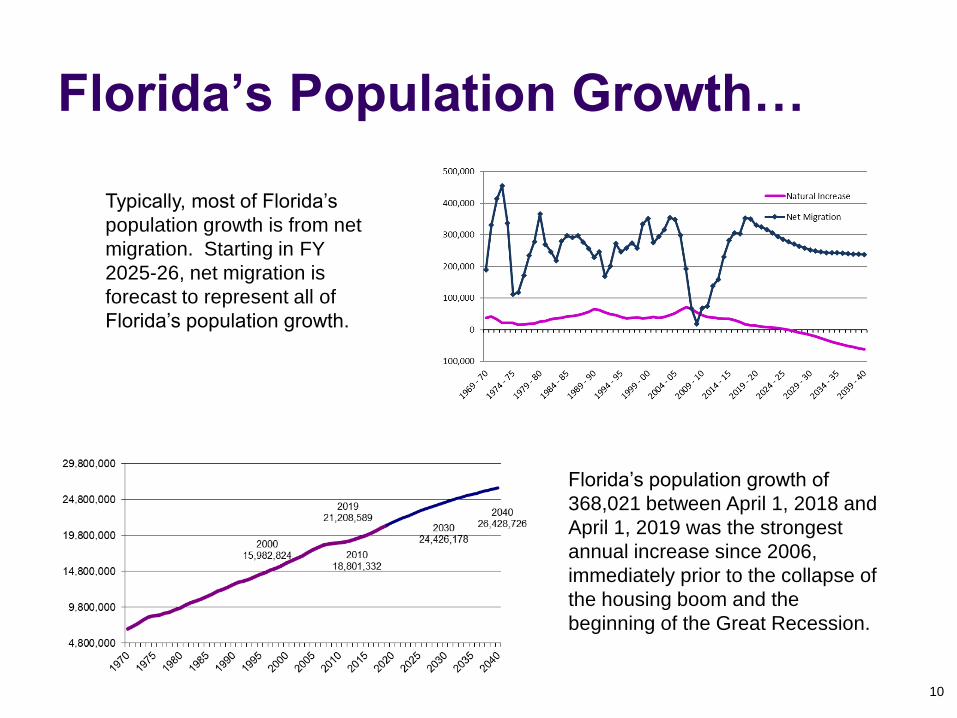
Florida’s Population Growth…
Florida’s population growth of
368,021 between April 1, 2018 and
April 1, 2019 was the strongest
annual increase since 2006,
immediately prior to the collapse of
the housing boom and the
beginning of the Great Recession.
Typically, most of Florida’s
population growth is from net
migration. Starting in FY
2025-26, net migration is
forecast to represent all of
Florida’s population growth.
10

Baby Boomers in Florida Today...
The first cohort of Baby Boomers became eligible for retirement (turned age 65) in 2011. Nine
cohorts have entered the retirement phase: 2011, 2012, 2013, 2014, 2015, 2106, 2017, 2018
and 2019. This represents almost 44 percent of Florida’s Baby Boomers.
In 2000, Florida’s prime working age population (ages 25-54) represented 41.5 percent of the
total population. With the aging Baby Boom generation, this population now represents 37.2
percent of Florida’s total population and is expected to represent only 35.9 percent by 2030.11

Population Growth by Age Group…
Between 2010 and 2030, as a result of net migration and natural increase, Florida is
forecast to grow by 5.6 million persons.
Growth by age group depends upon this overall growth and the aging of resident
population, resulting in 53.2 percent of those gains in the older population (age 60 and
older).
Florida’s younger population (age 0-17) will account for 15.5 percent of the gains, while
the younger working age group (25-39) will account for 18.6 percent of the growth.
Distribution of Growth by Age Group
between April 1, 2010 to April 1, 2030
53.2%
12

Florida Housing Continues to Improve...
Documentary Stamp Tax collections saw 5.6% growth in FY 2018-19 over FY 2017-18.13
4,058.3
2,651.1
0.0
500.0
1,000.0
1,500.0
2,000.0
2,500.0
3,000.0
3,500.0
4,000.0
4,500.0
1994 1995 1996 1997 1998 1999 2000 2001 2002 2003 2004 2005 2006 2007 2008 2009 2010 2011 2012 2013 2014 2015 2016 2017 2018
Total Documentary Stamp Tax Collections (FY Beginning)
After declining four years in a row, FY 2009-10 was only26.6% of the 2005-06 peak collection year. Since then, each year has seen steady improvement. FY 2018-19 came in at 65.3%, almost two-thirds of the prior peak.

Homeownership Rate Still Below Normal...
Since 2013, Florida has been below its long-run average homeownership rate. Final data
for 2018 shows a small improvement from 2017’s 64.1% lowest recorded point to 65.5%.
Data through the third quarter of the 2019 calendar year indicates that 2019 will show no
detectable improvement.14
64.4
72.4
65.5
55.0
57.0
59.0
61.0
63.0
65.0
67.0
69.0
71.0
73.0
75.0
Florida Homeownership Rate Through 2018
Long-Run Average = 66.3%

Home Financing Still Challenging...
Data from LPS / Black Knight
Within the total of all sales, the shares of “Distressed Sales” and “Cash Sales” continue to drop as the
percentage of “Financed Sales” steadily climbs.
While most areas of commercial and consumer credit have significantly strengthened – residential
credit for home purchases still remains somewhat difficult for consumers to access with a weighted
average credit score of 736 and a LTV (loan to value) of 77 percent on all closed loans in November
(the combination is stronger than one year earlier). Almost 89 percent of all conventional home
purchase lending in November had credit scores that were 700 or above. Student loans and auto
debts appear to be affecting the ability to qualify for residential credit. Even so, the percent of all home
sales that are financed is almost 63 percent in Florida (September 2019), up from 58 percent in
September 2018. 15
11.21% 10.26%
59.57% 62.81%
29.22%26.93%
0.00%
10.00%
20.00%
30.00%
40.00%
50.00%
60.00%
70.00%
Dec-18 Jan-19 Feb-19 Mar-19 Apr-19 May-19 Jun-19 Jul-19 Aug-19 Sep-19
Homes Sales Trend - Distribution by Sales Type
Distressed Sales as % of Total Sales Financed Sales as % of Total Cash Sales as % of Total Sales

Permits Are Still Well Below Historic Norms…
Single-Family building permit activity, an indicator of new construction, remains in positive territory,
beginning with strong back-to-back growth in both the 2012 and 2013 calendar years (over 30% in
each year). The final data for the 2014 calendar year revealed significantly slowing (but still
positive) activity—posting only 1.6% growth over the prior year. However, annual activity for the
past four calendar years ran well above their individual periods a year prior; single family data was
higher than the prior year by 20.3% in 2015, 11.1% in 2016, 13.5% in 2017, and 13.8% in 2018.
Despite the strong percentage growth rates in six of the last seven calendar years, the level is still
low by historic standards – just over 63% of the long-run per capita level. The year-to-date data for
the 2019 calendar year is showing marginal growth (4.1%) compared to the recent past. 16
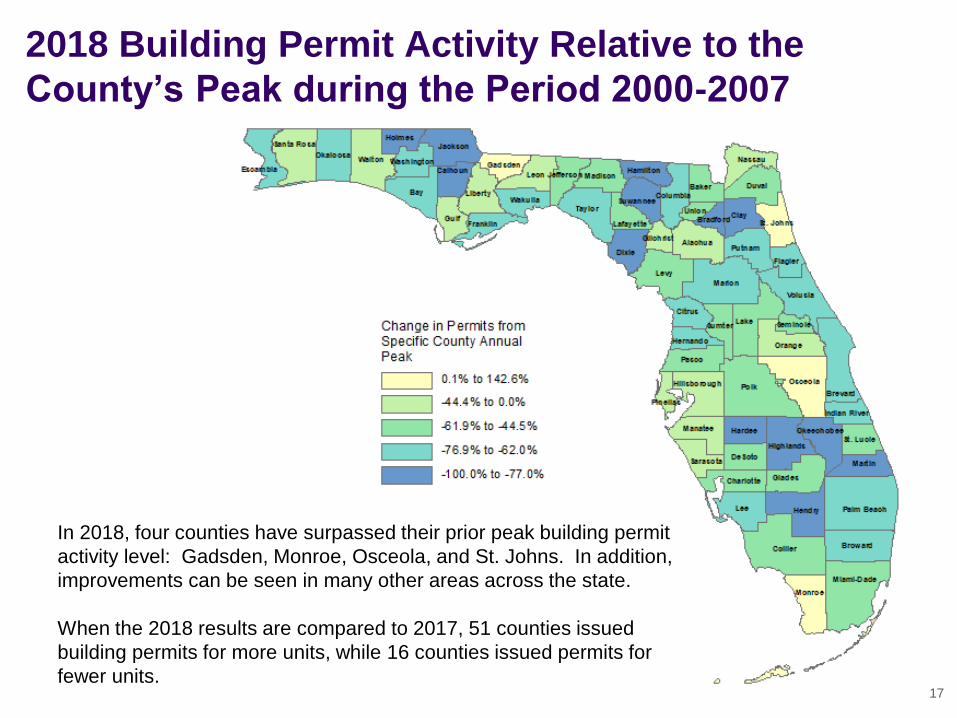
2018 Building Permit Activity Relative to the
County’s Peak during the Period 2000-2007
In 2018, four counties have surpassed their prior peak building permit
activity level: Gadsden, Monroe, Osceola, and St. Johns. In addition,
improvements can be seen in many other areas across the state.
When the 2018 results are compared to 2017, 51 counties issued
building permits for more units, while 16 counties issued permits for
fewer units.17

Existing home sales volume in
each of the last five calendar years
(2014, 2015, 2016, 2017 and 2018)
exceeded the 2005 peak year. This
year (2019) is on course to do the
same.
Data through November 2019
While Florida’s existing home price
gains have roughly tracked national
gains over the last four years, the
state’s median home price for
single family homes has generally
stayed upwardly steady as the
national median peaks and dips.
As Florida’s median price has been
increasing, the national median has
increased even more; Florida has
only exceeded the national median
one time since October 2008 (over
11 years ago). The state’s median
price in November was 96.7% of
the national median price, which is
high for Florida. 18
150,000
170,000
190,000
210,000
230,000
250,000
270,000
290,000
310,000
June 15 Oct 15 Feb 16 June16 Oct 16 Feb 17 June 17 Oct 17 Feb 18 June 18 Oct 18 Feb 19 June 19 Oct 19
Median Prices for Existing Single-Family Homes
National Florida
Florida’s Peak Price was $257,800 (June 2006); now $265,000.
-8.6%
-24.8%
1.6%
-3.3%
-30.0%
-25.0%
-20.0%
-15.0%
-10.0%
-5.0%
0.0%
5.0%
Oct
08
Feb
09
Jun
e 0
9
Oct
09
Feb
10
Jun
e 1
0
Oct
10
Feb
11
Jun
e 1
1
Oct
11
Feb
12
Jun
e 1
2
Oct
12
Feb
13
Jun
e 1
3
Oct
13
Feb
14
Jun
e 1
4
Oct
14
Feb
15
Jun
e 1
5
Oct
15
Feb
16
Jun
e1
6
Oct
16
Feb
17
Jun
e 1
7
Oct
17
Feb
18
Jun
e 1
8
Oct
18
Feb
19
Jun
e 1
9
Oct
19
Florida Median Price Relative to Nation

Challenging housing costs and
shifting preferences among
Millennials have caused residential
rental vacancies to tighten strongly
over the last five years (2015
through 2019); price pressure
continues to build.
Zillow Rental Data: Median Rent List Price, 2-bedroom ( through 11/2019)
19
6.9
8.2
0.0
2.0
4.0
6.0
8.0
10.0
12.0
14.0
16.0
18.0
20.0
19
86
19
87
19
88
19
89\r
1
19
90
19
91
19
92
19
93\r
2
19
94
19
95
19
96
19
97
19
98
19
99
20
00
20
01
20
02\r
3
20
03
20
04
20
05
20
06
20
07
20
08
20
09
20
10
20
11
20
12
20
13
20
14
20
15
20
16
20
17
20
18
Rental Vacancy RatesLong-run Average Percent: US---8.2; FL---10.5
United States Florida
FL 2019 Projection (Three-Quarter Average): 8.2
United
StatesFlorida
Florida
relative to
United
States
United
StatesFlorida
Florida
relative to
United
States
2005 728 809 111% 803 863 107%
2006 763 872 114% 844 932 110%
2007 789 925 117% 878 991 113%
2008 824 947 115% 919 1,015 110%
2009 842 952 113% 938 1,024 109%
2010 855 947 111% 954 1,017 107%
2011 871 949 109% 973 1,027 106%
2012 884 954 108% 990 1,037 105%
2013 905 972 107% 1,016 1,050 103%
2014 934 1,003 107% 1,047 1,087 104%
2015 959 1,046 109% 1,077 1,129 105%
2016 981 1,086 111% 1,105 1,161 105%
2017 1,012 1,128 111% 1,138 1,203 106%
2018 1,058 1,182 112% 1,182 1,251 106%
Source: U.S. Census Bureau, American Community Survey, 1-Year, 2005-2018.
Median Gross Rent Average Gross Rent
Florida and U.S. Median Gross Rent
(in Current Dollars)
Year
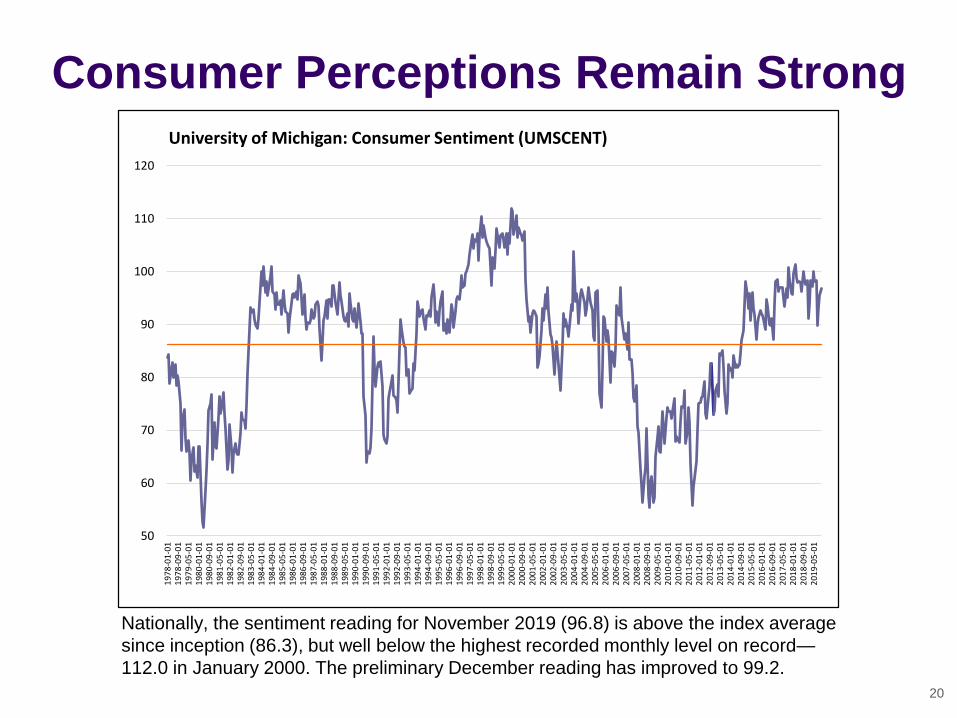
Consumer Perceptions Remain Strong
Nationally, the sentiment reading for November 2019 (96.8) is above the index average
since inception (86.3), but well below the highest recorded monthly level on record—
112.0 in January 2000. The preliminary December reading has improved to 99.2.
20
50
60
70
80
90
100
110
1201
978-
01-
01
197
8-0
9-0
11
979-
05-
01
198
0-0
1-0
11
980-
09-
01
198
1-0
5-0
11
982-
01-
01
198
2-0
9-0
11
983-
05-
01
198
4-0
1-0
11
984-
09-
01
198
5-0
5-0
11
986-
01-
01
198
6-0
9-0
11
987-
05-
01
198
8-0
1-0
11
988-
09-
01
198
9-0
5-0
11
990-
01-
01
199
0-0
9-0
11
991-
05-
01
199
2-0
1-0
11
992-
09-
01
199
3-0
5-0
11
994-
01-
01
199
4-0
9-0
11
995-
05-
01
199
6-0
1-0
11
996-
09-
01
199
7-0
5-0
11
998-
01-
01
199
8-0
9-0
11
999-
05-
01
200
0-0
1-0
12
000-
09-
01
200
1-0
5-0
12
002-
01-
01
200
2-0
9-0
12
003-
05-
01
200
4-0
1-0
12
004-
09-
01
200
5-0
5-0
12
006-
01-
01
200
6-0
9-0
12
007-
05-
01
200
8-0
1-0
12
008-
09-
01
200
9-0
5-0
12
010-
01-
01
201
0-0
9-0
12
011-
05-
01
201
2-0
1-0
12
012-
09-
01
201
3-0
5-0
12
014-
01-
01
201
4-0
9-0
12
015-
05-
01
201
6-0
1-0
12
016-
09-
01
201
7-0
5-0
12
018-
01-
01
201
8-0
9-0
12
019-
05-
01
University of Michigan: Consumer Sentiment (UMSCENT)
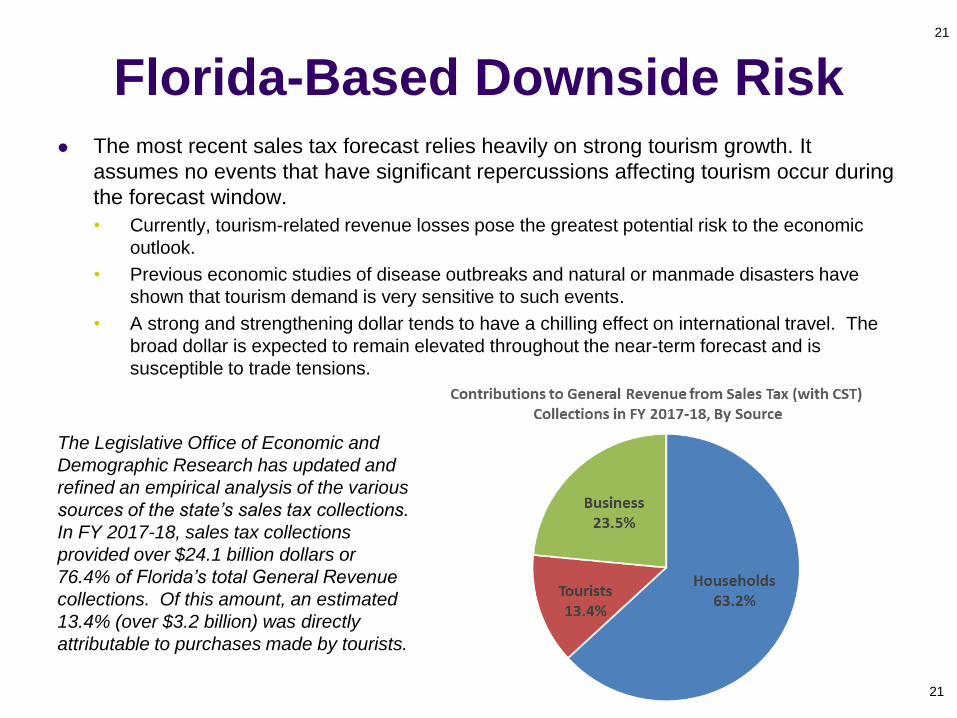
Florida-Based Downside Risk The most recent sales tax forecast relies heavily on strong tourism growth. It
assumes no events that have significant repercussions affecting tourism occur during
the forecast window.
• Currently, tourism-related revenue losses pose the greatest potential risk to the economic
outlook.
• Previous economic studies of disease outbreaks and natural or manmade disasters have
shown that tourism demand is very sensitive to such events.
• A strong and strengthening dollar tends to have a chilling effect on international travel. The
broad dollar is expected to remain elevated throughout the near-term forecast and is
susceptible to trade tensions.
The Legislative Office of Economic and
Demographic Research has updated and
refined an empirical analysis of the various
sources of the state’s sales tax collections.
In FY 2017-18, sales tax collections
provided over $24.1 billion dollars or
76.4% of Florida’s total General Revenue
collections. Of this amount, an estimated
13.4% (over $3.2 billion) was directly
attributable to purchases made by tourists.
21
21

Economy Largely Recovered...
Florida growth rates are generally returning to more typical levels and continue to show
progress. The drags—particularly construction—are more persistent than past events, but
the strength in tourism is compensating for this. In the various forecasts, normalcy was
largely achieved by the end of FY 2016-17. Overall...
The national economy has been back to normal on nearly all measures; however, financial conditions are
increasingly volatile as uncertainty over tariffs and rising concerns regarding growth abroad buffet expectations.
By the close of the 2018-19 fiscal year, most measures of the Florida economy had returned to or surpassed their
prior peaks.
All personal income metrics, nearly 60 percent of the employment measures, and the total tourism and domestic visitor
counts had exceeded their prior peaks.
Other measures were posting solid year-over-year improvements, even if they were not yet back to peak performance
levels.
Private nonresidential construction expenditures first passed their prior peak in FY 2016-17, but none of the key
residential construction measures pass their prior peaks in the forecast horizon, an anticipated slowdown that has been
built into all of the recent forecasts.
As July 2019 ended, the economy had been in expansion for more than a decade, marking the longest economic
expansion in U.S. history. The current REC forecasts do not anticipate an outright recession, but turning points are
notoriously difficult to project. IHS Markit currently places the risk of a recession at 35 percent in 2020, and the New
York Fed’s recession probability model just dropped to a 25 percent probability for the same time period (lower than
projected through the Fall). Moody’s Analytics matches IHS’ risk analysis; however, writing in late-December, Mark
Zandi of Moody’s placed the odds “uncomfortably high”.
The National Association for Business Economics’ current forecast places the recession risk at 21% during the first
half of 2020 and as much as 43% by the end of 2020. Their current odds rise to 66% for a recession to begin by
mid-2021.
22
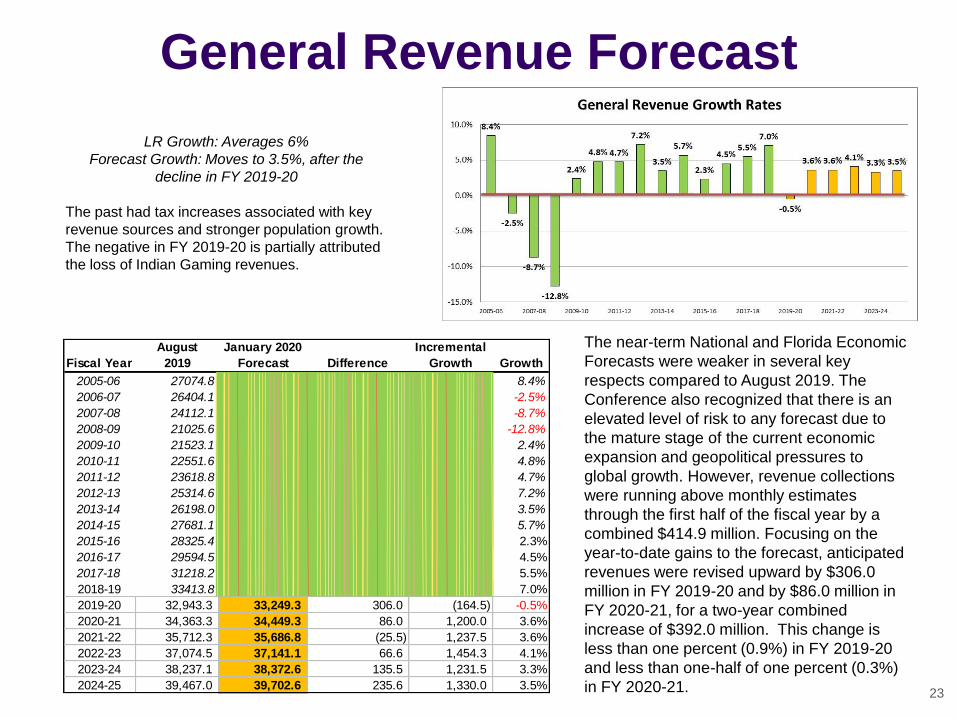
General Revenue Forecast
The near-term National and Florida Economic
Forecasts were weaker in several key
respects compared to August 2019. The
Conference also recognized that there is an
elevated level of risk to any forecast due to
the mature stage of the current economic
expansion and geopolitical pressures to
global growth. However, revenue collections
were running above monthly estimates
through the first half of the fiscal year by a
combined $414.9 million. Focusing on the
year-to-date gains to the forecast, anticipated
revenues were revised upward by $306.0
million in FY 2019-20 and by $86.0 million in
FY 2020-21, for a two-year combined
increase of $392.0 million. This change is
less than one percent (0.9%) in FY 2019-20
and less than one-half of one percent (0.3%)
in FY 2020-21.
LR Growth: Averages 6%
Forecast Growth: Moves to 3.5%, after the
decline in FY 2019-20
The past had tax increases associated with key
revenue sources and stronger population growth.
The negative in FY 2019-20 is partially attributed
the loss of Indian Gaming revenues.
23
Fiscal Year
August
2019
January 2020
Forecast Difference
Incremental
Growth Growth
2005-06 27074.8 27074.8 0 8.4%
2006-07 26404.1 26404.1 0 -670.7 -2.5%
2007-08 24112.1 24112.1 0 -2292.0 -8.7%
2008-09 21025.6 21025.6 0.0 -3086.5 -12.8%
2009-10 21523.1 21523.1 0.0 497.5 2.4%
2010-11 22551.6 22551.6 0.0 1028.5 4.8%
2011-12 23618.8 23618.8 0.0 1067.2 4.7%
2012-13 25314.6 25314.6 0.0 1695.8 7.2%
2013-14 26198.0 26198.0 0.0 883.4 3.5%
2014-15 27681.1 27485.9 (195.2) 1287.9 5.7%
2015-16 28325.4 28325.4 0.0 644.3 2.3%
2016-17 29594.5 29,594.5 0.0 1269.1 4.5%
2017-18 31218.2 31,218.2 0.0 1623.7 5.5%
2018-19 33413.8 33,413.8 - 7.0%
2019-20 32,943.3 33,249.3 306.0 (164.5) -0.5%
2020-21 34,363.3 34,449.3 86.0 1,200.0 3.6%
2021-22 35,712.3 35,686.8 (25.5) 1,237.5 3.6%
2022-23 37,074.5 37,141.1 66.6 1,454.3 4.1%
2023-24 38,237.1 38,372.6 135.5 1,231.5 3.3%
2024-25 39,467.0 39,702.6 235.6 1,330.0 3.5%

US Retail Sales
& Florida
Taxable Sales
The change over the same month in the prior year
as shown on the national S&P Retail Select Industry
Index has been mostly negative since the beginning
of the 2019 calendar year. Florida’s taxable sales
exhibit an overall pattern similar to the national
index; however, the relationship became more
tenuous beginning in February 2014, with Florida
proving to be more resilient.
Florida’s in-state volatility over the prior year has
been significant since Hurricane Irma in 2017, but
really started a year earlier in FY 2016-17. Only in
the past year has it become more stable. October
2018 was a notable exception as it looked back to
the prior year’s hurricane-affected low point and
showed exceptionally robust growth, year over year.24
-4.0%
-2.0%
0.0%
2.0%
4.0%
6.0%
8.0%
10.0%
12.0%
14.0%
0 20 40 60 80 100 120
FL Taxable Sales Tax Growth Over the Same Month, Prior Year
Poly. (FL Taxable Sales Tax Growth Over the Same Month, Prior Year)