florida department of transportation reports/2001... · florida department of transportation ......
TRANSCRIPT

Florida Department of Transportation
JEB BUSH GOVERNOR
605 Suwannee Street Tallahassee, FL 32399-0450
DENVER J. STUTLER, JR. SECRETARY
June 22, 2006
To: William N. Nickas, Robert Robertson From: Marc Ansley, Assistant State Structures Design Engineer, Structures Research Center Subject: ICP Piles I have looked over our report and the ICP rebuttal to our report. They have three areas of concern. Below is my response to each of these areas.
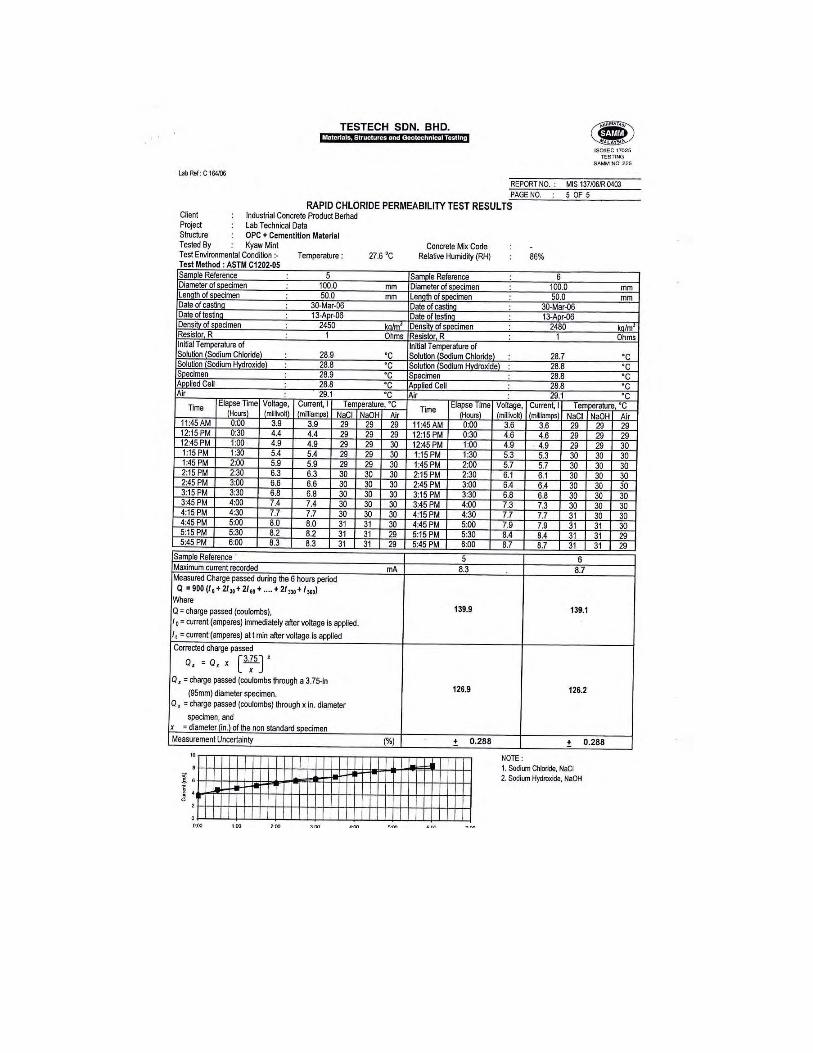
1) Lack of Concrete Cover Our report notes that the cover requirements current with FDOT are not met by the standard ICP piles. The appropriateness of this requirement for spun cast piles is for the Materials Office and others to decide. We would concur that spun casting produces a less permeable concrete.
2) Effect of Spot Weld on prestressing bars
We stand by our results that show the spot welding on occasion impacted the ductility and the fatigue resistance of the prestressing bars. However, not all structural applications may need fatigue resistance or require significant flexural ductility. The Department’s report is a valid statement on how this reinforcing differs from the standard prestressing strand we currently use. How critical this is will depend on the intended use.
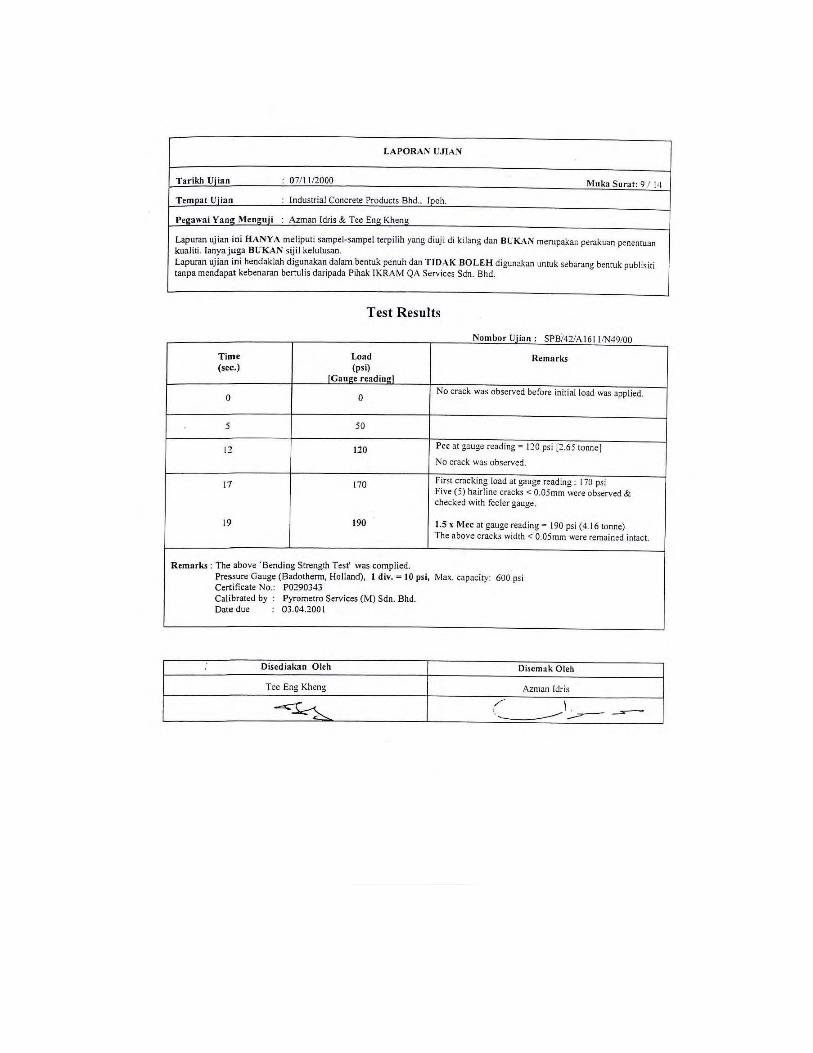
3) Crack width measurements of more than 0.005 inches during flexural testing
The reported values are what they are. We concur with the rebuttal that this is for one test and may be a statistical aberration. However, only additional testing would allow us to modify our results.
In general, I can not find a major point of conflict between our report and their assertions. When the facts are examined in detail there are few points of disagreement. All structural elements have strengths and weaknesses. It was not that long ago we were using wood piles. Our report focused on the potential problems with these piles assuming that their strengths were obvious and well advertised. I believe our report did solid job of this allowing the Department to make an informed decision as to the appropriateness of using these piles. Except for the crack width issue their rebuttal does not dispute the fundamentals of our report.
www.dot.state.fl.us


Structures Research Group Structures Design Office
Florida Department of Transportation

Structural Performance of ICP PHC Piles September, 2001
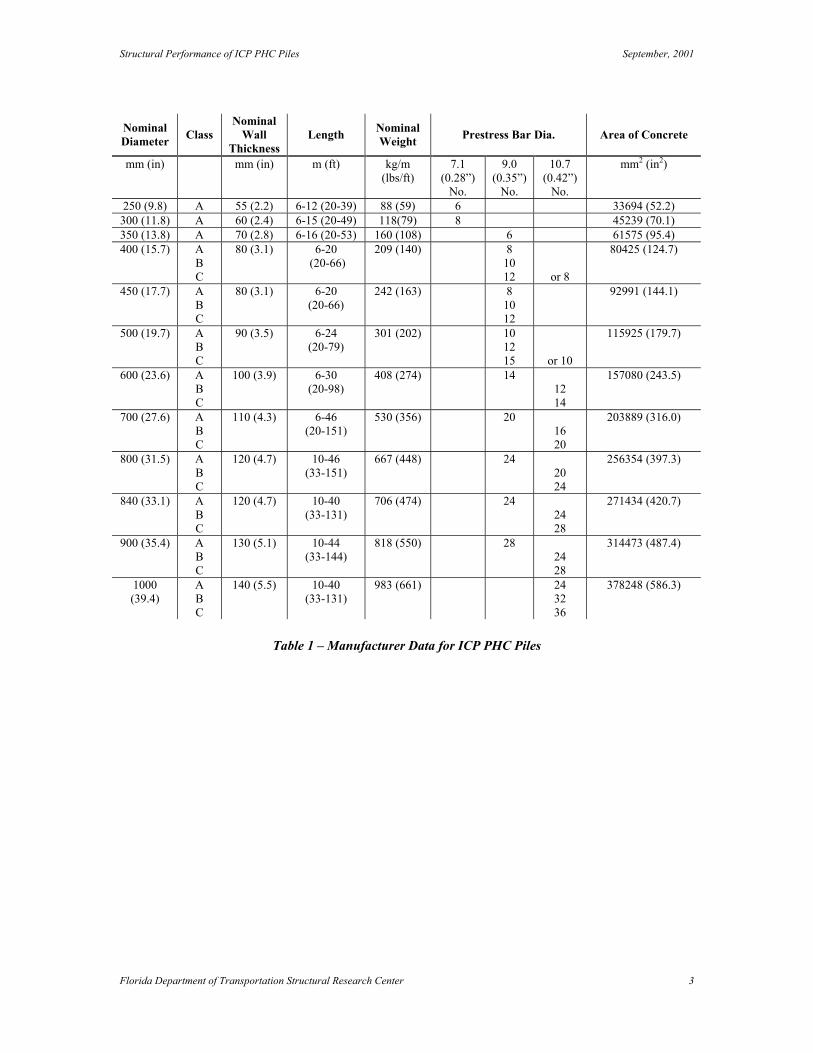
Introduction/Background During the first half of 2001, an innovative product was brought to the attention of the Florida Department of Transportation. The product is a “spin-cast” prestressed concrete pile section distributed by “Pipe and Piling Concrete Products Corp.,” and produced in Malaysia. This product, herein referred to as “ICP-PHC” piles is claimed by the manufacturer to be superior and cost competitive with standard domestically produced pile sections. These claims are primarily through their application of a high strength prestressing bar as opposed to the 7-wire prestressing strand commonly used. These bars, which are not used domestically, are produced to meet the Japanese equivalent of ASTM, and according to which, are spot weldable without degradation of properties. The bars are stressed between two steel plates prior to the application of concrete, and left in place such that the plates become an integral portion of the pile system. These plates serve two purposes, first, to act as an anchorage plate for the bars, second, to serve as the splicing system. Leaving the anchor blocks in place after the concrete cures creates the situation where the pile is stressed uniformly along the entire length, as opposed to standard practice where loss of prestress occurs at the ends. The splicing procedure consists of butting two of the anchorage plates together and performing a full penetration groove weld, a procedure that is extremely rapid and simple to perform. Further benefits to the fabrication process involve the welding of the spiral reinforcement to the prestressing bars prior to the stressing operation. The distributor, “Pipe & Piling Concrete Products Corp.,” sought acceptance of this product for use in Florida Department of Transportation bridge structures. However, due to unknowns that primarily have to do with the mechanical properties of the prestressing bars, and the welding of the spiral reinforcement cage to these bars, full scale testing was performed. Material Properties The ICP Piles are manufactured in a wide variety of sizes and lengths with design criteria shown in Table 17. Concrete strength is reported by the manufacturer as f`
c = 10 ksi (70 MPa) and a cube strength of 11.7 ksi (80 MPa).
Florida Department of Transportation Structural Research Center 2
Structural Performance of ICP PHC Piles September, 2001
Nominal Diameter Class
Nominal Wall
Thickness Length Nominal
Weight Prestress Bar Dia. Area of Concrete
mm (in) mm (in) m (ft) kg/m (lbs/ft)
7.1 (0.28”)
No.
9.0 (0.35”)
No.
10.7 (0.42”)
No.
mm2 (in2)
250 (9.8) A 55 (2.2) 6-12 (20-39) 88 (59) 6 33694 (52.2) 300 (11.8) A 60 (2.4) 6-15 (20-49) 118(79) 8 45239 (70.1) 350 (13.8) A 70 (2.8) 6-16 (20-53) 160 (108) 6 61575 (95.4) 400 (15.7) A
B C
80 (3.1) 6-20 (20-66)
209 (140) 8 10 12
or 8
80425 (124.7)
450 (17.7) A B C
80 (3.1) 6-20 (20-66)
242 (163) 8 10 12
92991 (144.1)
500 (19.7) A B C
90 (3.5) 6-24 (20-79)
301 (202) 10 12 15
or 10
115925 (179.7)
600 (23.6) A B C
100 (3.9) 6-30 (20-98)
408 (274) 14 12 14
157080 (243.5)
700 (27.6) A B C
110 (4.3) 6-46 (20-151)
530 (356) 20 16 20
203889 (316.0)
800 (31.5) A B C
120 (4.7) 10-46 (33-151)
667 (448) 24 20 24
256354 (397.3)
840 (33.1) A B C
120 (4.7) 10-40 (33-131)
706 (474) 24 24 28
271434 (420.7)
900 (35.4) A B C
130 (5.1) 10-44 (33-144)
818 (550) 28 24 28
314473 (487.4)
1000 (39.4)
A B C
140 (5.5) 10-40 (33-131)
983 (661) 24 32 36
378248 (586.3)
Table 1 – Manufacturer Data for ICP PHC Piles
Florida Department of Transportation Structural Research Center 3

Structural Performance of ICP PHC Piles September, 2001
Nominal Diameter Class Effective
Prestress Cracking Moment
Capacity
Nominal Moment Capacity
Serivce Axial Load
Nominal Axial Load
mm (in) N/mm2 (psi)
kN-m (k-ft) kN-m (k-ft) kN (kips) kN (kips)
250 (9.8) A 6.3 (914) 15 (11) 30 (22) 724 (163) 1226 (276) 300 (11.8) A 6.3 (914) 26 (19) 47 (35) 972 (219) 1647 (370 350 (13.8) A 5.7 (827) 38 (28) 69 (51) 1334 (300) 2252 (506 400 (15.7) A
B C
5.8 (841) 6.9 (1001) 7.6 (1102)
58 (43) 65 (48) 91 (67)
103 (76) 126 (93) 171 (126)
1741 (391) 1711 (385) 1972 (443)
2939 (661) 2912 (655) 3361 (756)
450 (17.7) A B C
5.1 (740) 6.0 (870) 7.2 (1044)
73 (54) 81 (60) 91 (67)
122 (90) 146 (108) 171 (126)
2031 (457) 2002 (450) 1972 (443)
3416 (768) 3388 (762) 3361 (756)
500 (19.7) A B C
5.1 (740) 6.0 (870) 7.1 (1030)
100 (74) 111 (82) 121 (89)
167 (123) 197 (145) 226 (167)
2531 (569) 2502 (562) 2471 (556)
4258 (957) 4230 (951) 4201 (944)
600 (23.6) A B C
5.2 (754) 6.2 (899) 7.1 (1030)
171 (126) 188 (139) 205 (151)
282 (208) 335 (247) 381 (281)
3423 (770) 3380 (760) 3339 (751)
5764 (1296) 5723 (1287) 5684 (1278)
700 (27.6) A B C
5.7 (827) 6.3 (914) 7.5 (1088)
277 (204) 294 (217) 334 (246)
469 (346) 522 (385) 635 (468)
4417 (993) 4379 (984) 4296 (966)
7456 (1676) 7420 (1668) 7341 (1650)
800 (31.5) A B C
5.5 (798) 6.3 (914) 7.3 (1059)
393 (290) 427 (315) 473 (349)
649 (479) 751 (554) 880 (649)
5570 (1252) 5508 (1238) 5425 (1220)
9390 (2111) 9331 (2098) 9253 (2080)
840 (33.1) A B C
5.2 6.0 (870) 7.0 (1015)
431 (318) 468 (345) 515 (380)
690 (509) 797 (588) 937 (691)
5918 (1330) 5856 (1316) 5773 (1298)
9962 (2240) 9903 (2226) 9825 (2209)
900 (35.4) A B C
5.2 (754) 6.1 (885) 7.1 (1030)
534 (394) 588 (434) 641 (473)
860 (634) 1021 (753) 1169 (862)
6854 (1541) 6767 (1521) 6685 (1503)
11539 (2594) 11457 (2576) 11379 (2558)
1000 (39.4) A B C
5.2 (754) 6.7 (972) 7.4 (1073)
723 (533) 839 (619) 898 (662)
1112 (820) 1501 (1107) 1662 (1226)
8241 (1853) 8075 (1815) 7992 (1797)
13876 (3119) 13719 (3084) 13641 (3067)
Table 1 (cont.) – Manufacturer Data for ICP PHC Piles
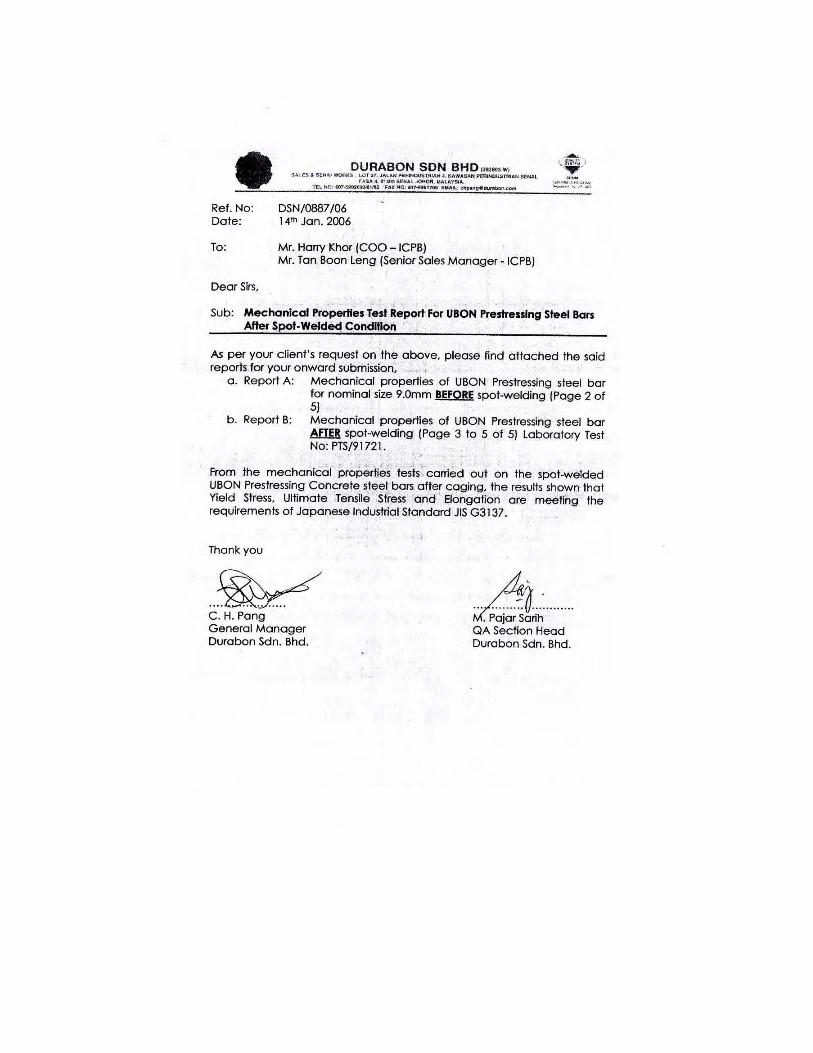
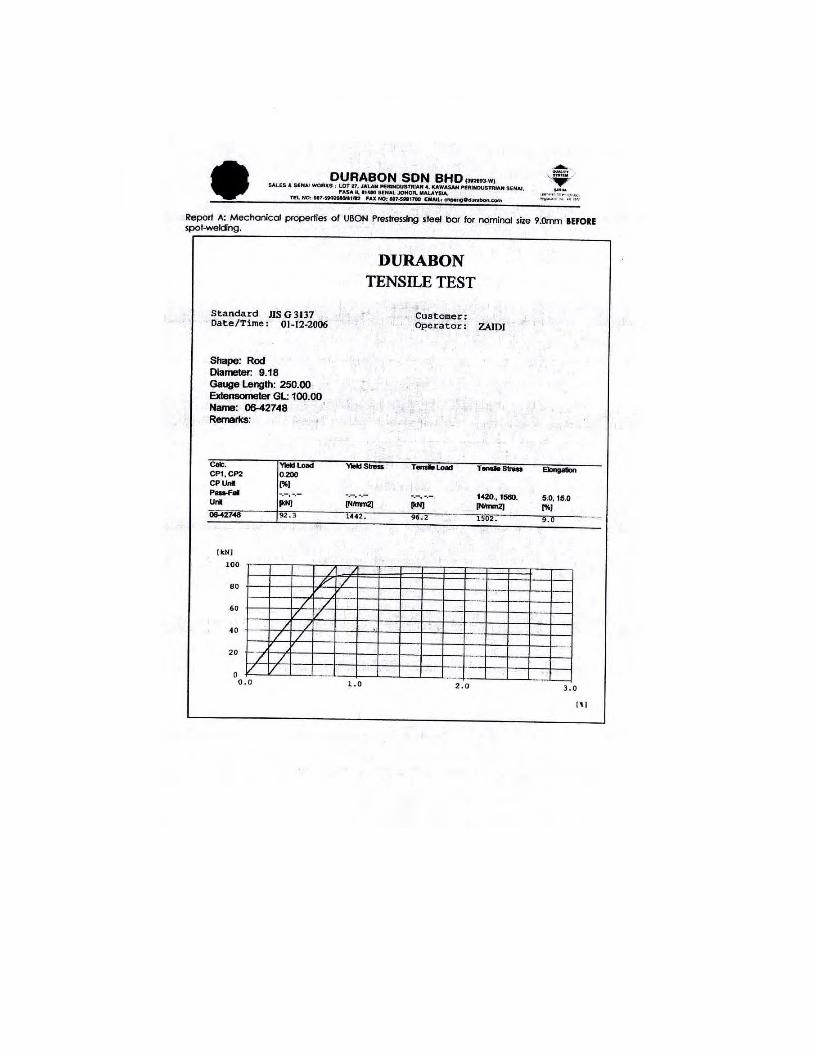
The bars are fabricated under the trade name “ULBON” and manufactured in accordance with Japanese Industrial Standard JIS G 3137 (Small size-deformed steel bars for prestressed concrete). The steel is classified as a low carbon steel and with the “…application of an induction heat treatment process,…”, ULBON is reported to have low relaxation characteristics similar to that of low relaxation prestressing strands, and is reported to be spot weldable with minimal change in mechanical properties. Minimum tensile strength of the bars is reported to be 205.9 ksi (1,420 MPa) and yield strength of 184.9 ksi (1,275 MPa) measured at a 0.2% offset. Test results from the manufacturer report tensile and yield strengths greater than the specified design value, as shown in Table 2. Table 2 also shows the results of spot welding tests on the bars, as well as a discrepancy in the JIS Specification, where the value reported for Yield Strength exceeds that for the Tensile Strength.
Florida Department of Transportation Structural Research Center 4

Structural Performance of ICP PHC Piles September, 2001
Specimen No. Tensile Strength Yield Point Breaking Portion*
N/mm2 (ksi) N/mm2 (ksi) 1 1.470 (213.2) 1.441 (209.0) N 2 1.480 (214.7) 1.451 (210.5) S 3 1.470 (213.2) 1.441 (209.0) N 4 1.480 (214.7) 1.451 (210.5) N 5 1.470 (213.2) 1.441 (209.0) S 6 1.470 (213.2) 1.441 (209.0) N
JIS Spec. 1.420 (206.0) 1.425 (206.7) - * - N = Not in Welded Portion, - S = At Spot Weld
Table 2 – Tension Test With Spot-Welding Results For ULBON as Reported By Bar Manufacturer. One note regarding the tensile strength of the bars lies in the ultimate tensile strength reported by the distributor. There appears to be an inadvertent error in the conversion of the ultimate tensile strength of 1,420 MPa to 220.4 ksi, in that the U.S. conversion should have been listed as 205.9 ksi. Experimental Investigation Structural evaluation of the ICP-PHC pile system yields several areas of concern that must be addressed before acceptance for use by the FDOT. The amount of concrete provided as cover for the main reinforcement is, on average, 1” for the samples sent to the Structures Research Center. The minimum FDOT requirement however is 3”. Also, the steel load plates were provided to the Structural Research Center without any protective coating. The primary concern however, is in the structural performance of the section and the material characteristics of the prestressing bars. The structural evaluation was performed on sample 14” diameter sections and bar samples provided to the Structural Research Center by the manufacturer. Cross section details are shown in Figure 1.
13.79” - 350 mm
8.18”
6 - 0.35”prestressed bars
1.15”
Figure 1 – Cross Section Details
Florida Department of Transportation Structural Research Center 5

Structural Performance of ICP PHC Piles September, 2001
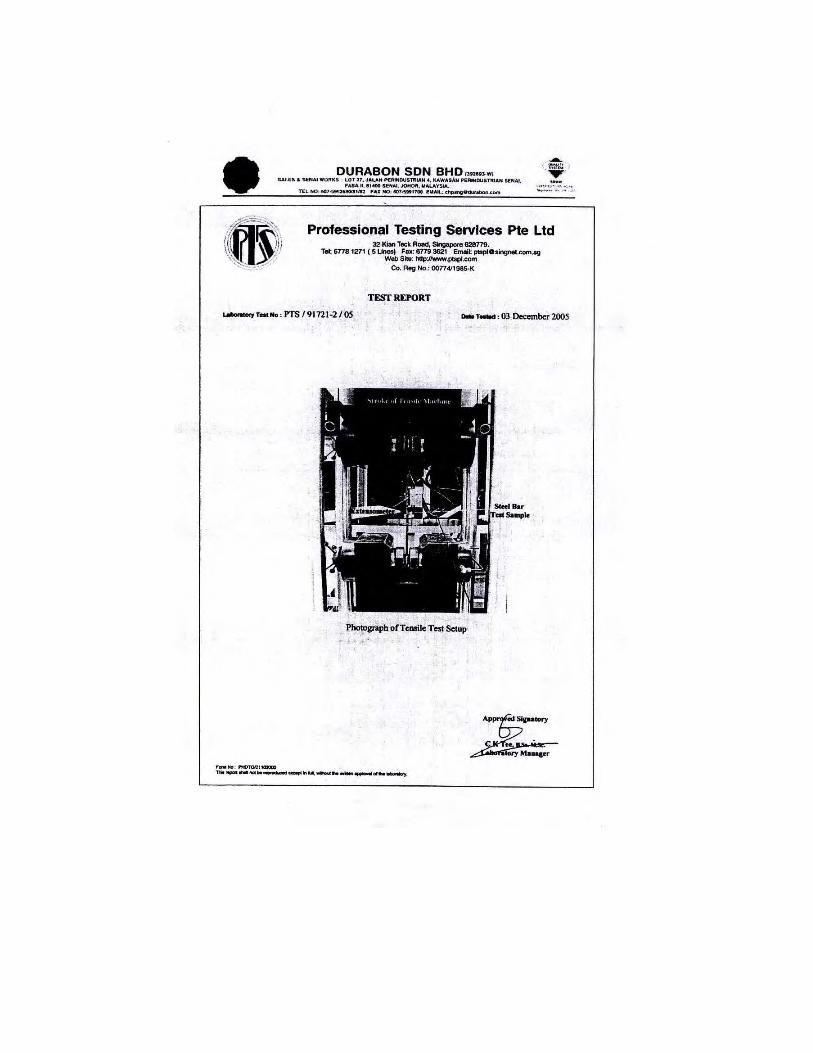
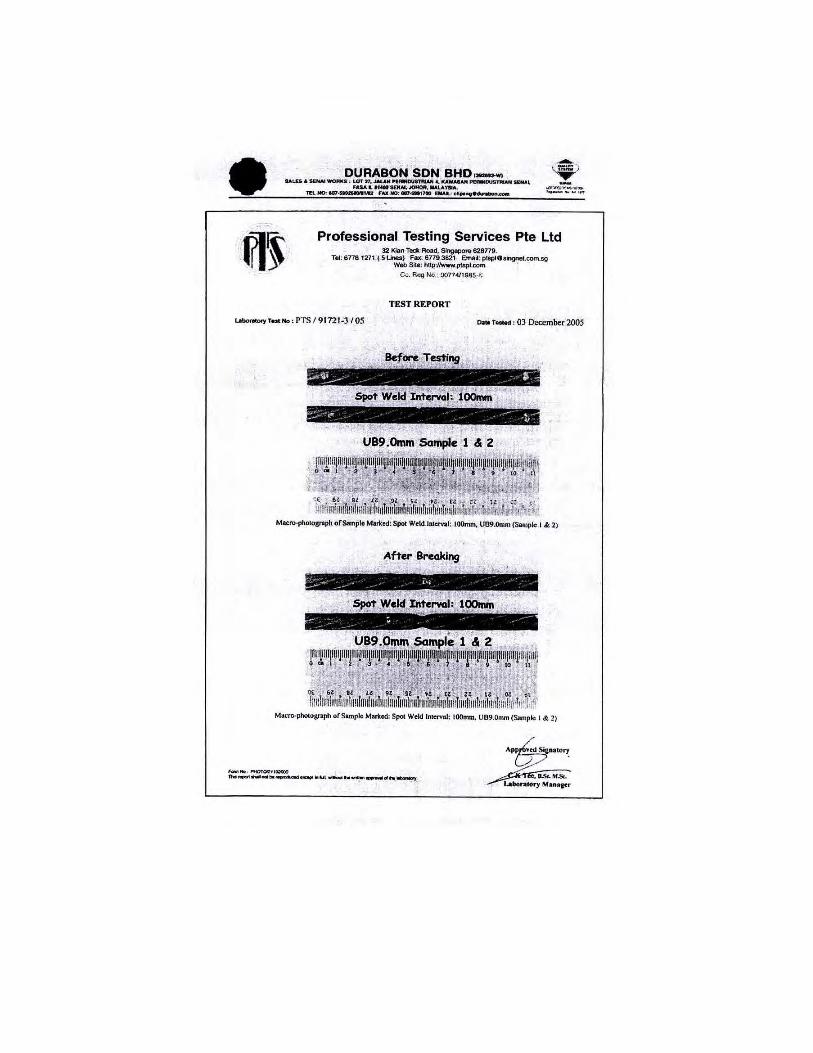
Since the prestressing bars are not produced in the United States, it is necessary to perform standard tension tests to establish the validity of the manufacturer reported material properties. Test samples consisted of both virgin bars and bars that had received welding to establish whether any detrimental effects from the welding process occur as evidenced by hardening or crystallization of the metal. The sample pile sections were subjected to static flexural and flexural fatigue loading. As has been documented and researched, it is known that American prestressing steels are detrimentally affected if they are welded1. This effect manifests itself in both fatigue performance and ductility of the section where premature fatigue failure occurs and/or ductility of the section is either limited or the section becomes classified as “brittle”. Additional testing to evaluate the effectiveness of the splicing system was performed, using specimens fabricated from the remains of test specimens that had previously been tested under static loading. Test Methods Tension Testing – The AASHTO Standard Method of Test for “Mechanical Testing of Steel Products,” designation T 244-92 (ASTM designation A 370-92) was followed to determine the tensile properties of the bars. Bars were provided in 48” lengths and gripped using a hydraulic “V” grip wedge system. The combination of wedges at both ends of the bars leaves a 36” gauge length, which satisfies the 24” minimum requirement of AASHTO. Four electrical resistance strain gauges were used to instrument each specimen, with instrumentation applied at the center of the gauge length. The entire assembly is placed in the gripping portion of an MTS-550 universal material testing system load frame (see Figure 2). This load frame is capable of applying a force of 550 kips in tension or compression and is fully controllable in terms of load rate, whether through displacement or load control, to satisfy the requirements of the testing procedure. Following the AASHTO test procedure, each bar was loaded to approximately 10 percent of the expected minimum breaking strength of the specimen, which was assumed to be 5 kips, prior to beginning the test. The load rate was set at 125 µε/second and proceeded until rupture of the specimen. The load, stress and strain were all monitored using a high speed data acquisition system with readings being taken twice every second throughout the duration of the test. The instrumentation used was as follows:
1 – A minimum of four electrical resistance strain gauges with an accuracy of ±5 µε and a maximum elongation of 20,000 µε.
2 – The test frame load cell with an accuracy of ±50 lbs with the most recent
calibration occurring in April 2001.
Florida Department of Transportation Structural Research Center 6

Structural Performance of ICP PHC Piles September, 2001
Figure 2 - Bars Placed in Tension Testing Apparatus
Static Flexural Testing – Full bridge electrical resistance strain gauges capable of measuring both strain and crack width were mounted at regular intervals along the length of the specimen. Deflection measurements were taken at mid-span, load points and both supports using Linear Voltage Displacement Transducers (LVDTs). Load was measured using a 55 kip capacity load cell mounted on the load distribution frame. All gauges were connected and monitored by a data acquisition system. Test setup and instrumentation details are shown in Figure 3. The test combination of test span and point of load application were selected such that the largest reasonable region of constant moment was available, while the load points are not within the shear critical region.
20’ 8’8’
Roller
Load Distribution Frame
Hydraulic Actuator
ICP Pile
17 crack gauges @ 24” on center
LVDT
Figure 3 – Test Setup and Instrumentation Details For Static Test
Florida Department of Transportation Structural Research Center 7
Structural Performance of ICP PHC Piles September, 2001
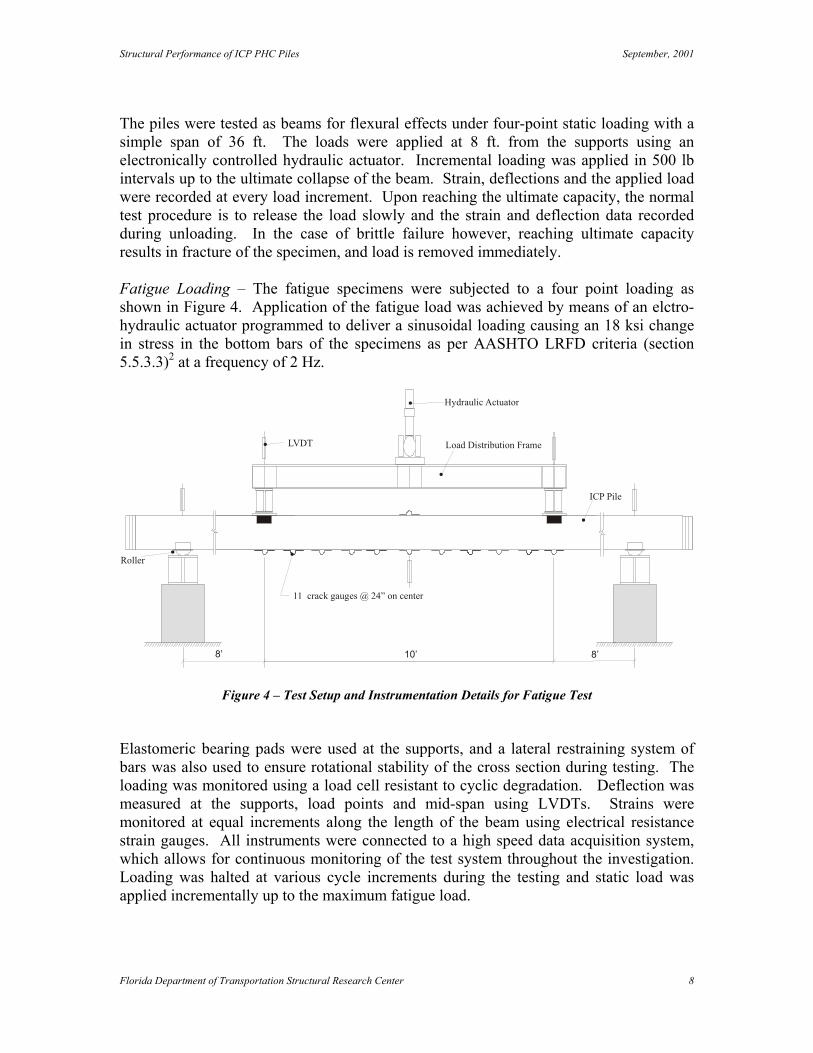
The piles were tested as beams for flexural effects under four-point static loading with a simple span of 36 ft. The loads were applied at 8 ft. from the supports using an electronically controlled hydraulic actuator. Incremental loading was applied in 500 lb intervals up to the ultimate collapse of the beam. Strain, deflections and the applied load were recorded at every load increment. Upon reaching the ultimate capacity, the normal test procedure is to release the load slowly and the strain and deflection data recorded during unloading. In the case of brittle failure however, reaching ultimate capacity results in fracture of the specimen, and load is removed immediately. Fatigue Loading – The fatigue specimens were subjected to a four point loading as shown in Figure 4. Application of the fatigue load was achieved by means of an elctro-hydraulic actuator programmed to deliver a sinusoidal loading causing an 18 ksi change in stress in the bottom bars of the specimens as per AASHTO LRFD criteria (section 5.5.3.3)2 at a frequency of 2 Hz.
10’ 8’8’
Roller
Load Distribution Frame
Hydraulic Actuator
ICP Pile
11 crack gauges @ 24” on center
LVDT
Figure 4 – Test Setup and Instrumentation Details for Fatigue Test Elastomeric bearing pads were used at the supports, and a lateral restraining system of bars was also used to ensure rotational stability of the cross section during testing. The loading was monitored using a load cell resistant to cyclic degradation. Deflection was measured at the supports, load points and mid-span using LVDTs. Strains were monitored at equal increments along the length of the beam using electrical resistance strain gauges. All instruments were connected to a high speed data acquisition system, which allows for continuous monitoring of the test system throughout the investigation. Loading was halted at various cycle increments during the testing and static load was applied incrementally up to the maximum fatigue load.
Florida Department of Transportation Structural Research Center 8
Structural Performance of ICP PHC Piles September, 2001
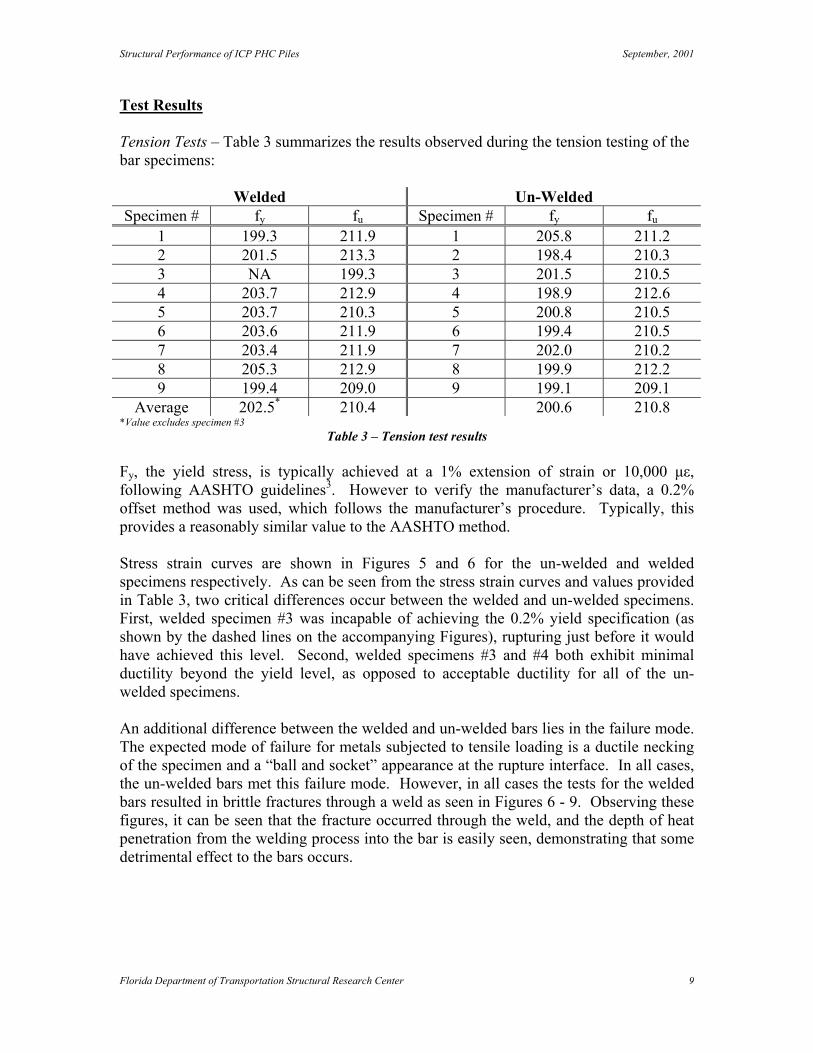
Test Results Tension Tests – Table 3 summarizes the results observed during the tension testing of the bar specimens:
Welded Un-Welded Specimen # fy fu Specimen # fy fu
1 199.3 211.9 1 205.8 211.2 2 201.5 213.3 2 198.4 210.3 3 NA 199.3 3 201.5 210.5 4 203.7 212.9 4 198.9 212.6 5 203.7 210.3 5 200.8 210.5 6 203.6 211.9 6 199.4 210.5 7 203.4 211.9 7 202.0 210.2 8 205.3 212.9 8 199.9 212.2 9 199.4 209.0 9 199.1 209.1
Average 202.5* 210.4 200.6 210.8 *Value excludes specimen #3
Table 3 – Tension test results Fy, the yield stress, is typically achieved at a 1% extension of strain or 10,000 µε, following AASHTO guidelines3. However to verify the manufacturer’s data, a 0.2% offset method was used, which follows the manufacturer’s procedure. Typically, this provides a reasonably similar value to the AASHTO method. Stress strain curves are shown in Figures 5 and 6 for the un-welded and welded specimens respectively. As can be seen from the stress strain curves and values provided in Table 3, two critical differences occur between the welded and un-welded specimens. First, welded specimen #3 was incapable of achieving the 0.2% yield specification (as shown by the dashed lines on the accompanying Figures), rupturing just before it would have achieved this level. Second, welded specimens #3 and #4 both exhibit minimal ductility beyond the yield level, as opposed to acceptable ductility for all of the un-welded specimens. An additional difference between the welded and un-welded bars lies in the failure mode. The expected mode of failure for metals subjected to tensile loading is a ductile necking of the specimen and a “ball and socket” appearance at the rupture interface. In all cases, the un-welded bars met this failure mode. However, in all cases the tests for the welded bars resulted in brittle fractures through a weld as seen in Figures 6 - 9. Observing these figures, it can be seen that the fracture occurred through the weld, and the depth of heat penetration from the welding process into the bar is easily seen, demonstrating that some detrimental effect to the bars occurs.
Florida Department of Transportation Structural Research Center 9

Structural Performance of ICP PHC Piles September, 2001
0
50
100
150
200
250
0 4000 8000 12000 16000 20000Microstrain
Specimen 1fu = 211.2 ksi
fy = 205.8 ksi
E = 29500 ksi
0
50
100
150
200
250
0 4000 8000 12000 16000 20000Microstrain
Specimen 2fu = 210.3 ksi
fy = 198.4 ksi
E = 29600 ksi
0
50
100
150
200
250
0 4000 8000 12000 16000 20000Microstrain
Specimen 3fu = 210.5 ksi
fy = 201.5 ksi
E = 29700 ksi0
50
100
150
200
250
0 4000 8000 12000 16000 20000Microstrain
Specimen 4fu = 212.6 ksi
fy = 198.9 ksi
E = 29700 ksi
0
50
100
150
200
250
0 4000 8000 12000 16000 20000Microstrain
Specimen 5fu = 210.5 ksi
fy = 200.8 ksi
E = 29900 ksi
0
50
100
150
200
250
0 4000 8000 12000 16000 20000Microstrain
Specimen 6fu = 210.5 ksi
fy = 199.4 ksi
E = 29100 ksi
Figure 5 – Stress vs. Strain Results – Un-Welded Specimens
Florida Department of Transportation Structural Research Center 10
Structural Performance of ICP PHC Piles September, 2001
0
50
100
150
200
250
0 4000 8000 12000 16000 20000Microstrain
0
50
100
150
200
250
0 4000 8000 12000 16000 20000Microstrain
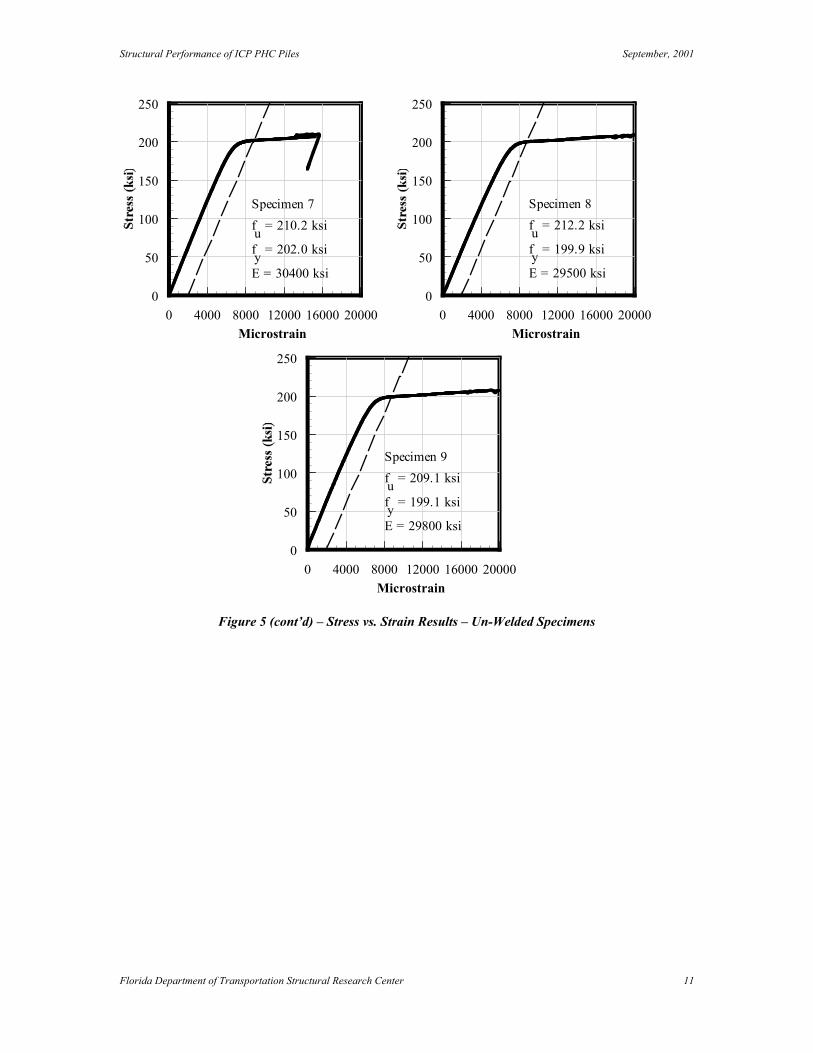
Specimen 7fu = 210.2 ksi
fy = 202.0 ksi
E = 30400 ksi
0
50
100
150
200
250
0 4000 8000 12000 16000 20000Microstrain
Specimen 8fu = 212.2 ksi
fy = 199.9 ksi
E = 29500 ksi
Specimen 9fu = 209.1 ksi
fy = 199.1 ksi
E = 29800 ksi
Figure 5 (cont’d) – Stress vs. Strain Results – Un-Welded Specimens
Florida Department of Transportation Structural Research Center 11

Structural Performance of ICP PHC Piles September, 2001
0
50
100
150
200
250
0 4000 8000 12000 16000 20000Microstrain
Specimen 1fu = 211.9 ksi
fy = 199.3 ksi
E = 30800 ksi
0
50
100
150
200
250
0 4000 8000 12000 16000 20000Microstrain
Specimen 2fu = 213.3ksi
fy = 201.5 ksi
E = 29300 ksi
0
50
100
150
200
250
0 4000 8000 12000 16000 20000Microstrain
Specimen 5fu = 210.3 ksi
fy = 203.7 ksi
E = 29600 ksi
0
50
100
150
200
250
0 4000 8000 12000 16000 20000Microstrain
Specimen 6fu = 211.9 ksi
fy = 203.6 ksi
E = 29700 ksi
0
50
100
150
200
250
0 4000 8000 12000 16000 20000Microstrain
Specimen 4fu = 212.9 ksi
fy = 203.7 ksi
E = 32000 ksi0
50
100
150
200
250
0 4000 8000 12000 16000 20000Microstrain
Specimen 3fu = 199.3 ksi
fy = NA
E = 29600 ksi
Figure 6 – Stress vs. Strain Results – Welded Specimens
Florida Department of Transportation Structural Research Center 12

Structural Performance of ICP PHC Piles September, 2001
0
50
100
150
200
250
0 4000 8000 12000 16000 20000Microstrain
Specimen 7fu = 211.9 ksi
fy = 203.4 ksi
E = 30400 ksi
0
50
100
150
200
250
0 4000 8000 12000 16000 20000Microstrain
Specimen 8fu = 212.9 ksi
fy = 205.3 ksi
E = 31500 ksi
0
50
100
150
200
250
0 4000 8000 12000 16000 20000Microstrain
Specimen 9fu = 209.0 ksi
fy = 199.4 ksi
E = 29100 ksi
Figure 6 (cont’d) – Stress vs. Strain Results – Welded Specimens
Figure 7 – Fracture Through Weld
Figure 8 – Fracture Through Weld With Spiral Reinforcement Shown
Florida Department of Transportation Structural Research Center 13

Structural Performance of ICP PHC Piles September, 2001
Figure 9 – Close-up View of Failure Plane Showing Depth of Heat Penetration
Figure 10 – Angled Fracture of Bar
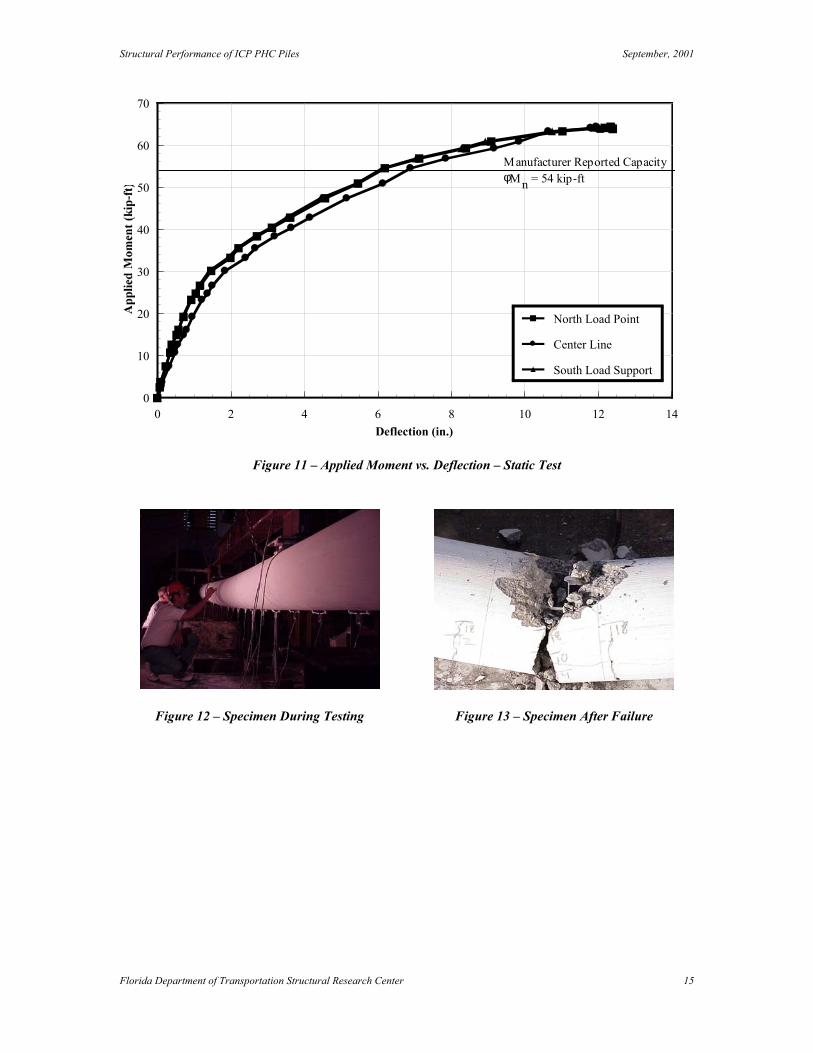
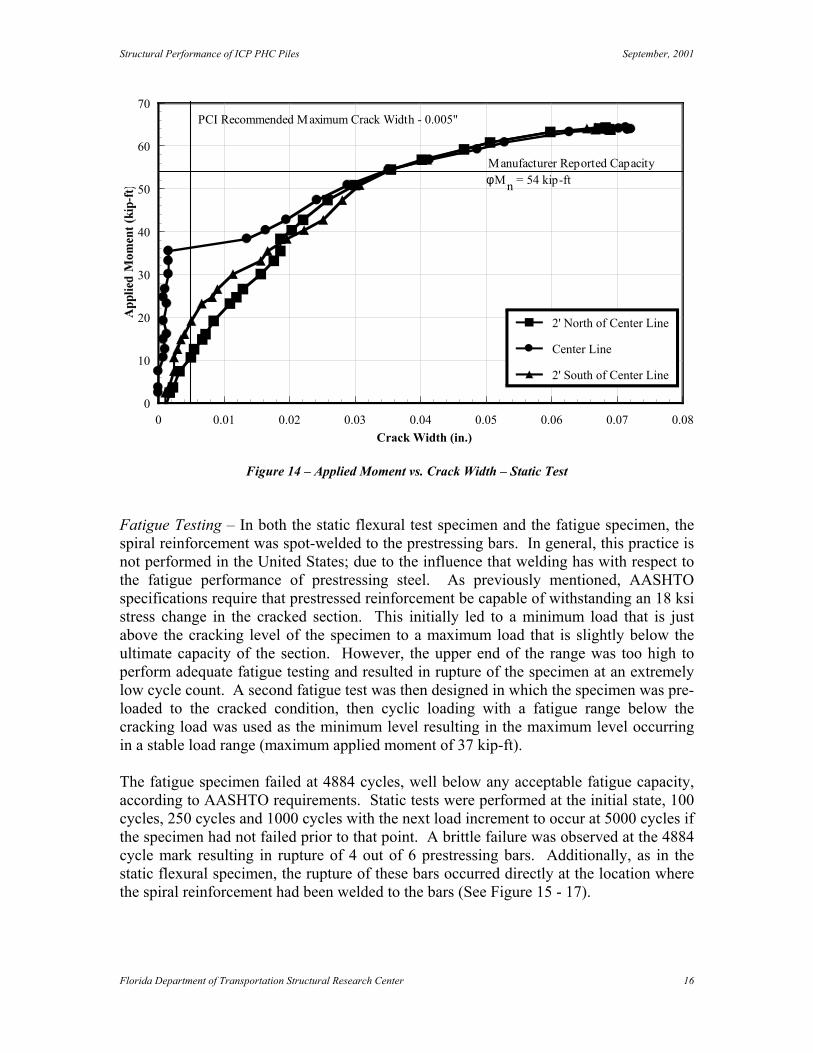
Static Flexural Test – The comparison of the applied moment versus deflection for the statically tested specimen is presented in Figure 11. The ultimate load achieved for this specimen was 64.3 kip-ft, which is well above the manufacturer’s specification of 54 kip-ft design capacity, and in close agreement with a calculated capacity of 60.0 kip-ft (achieved using a non-linear analysis). At the ultimate condition, a brittle failure was observed in which the specimen ruptured into two pieces. Close visual examination showed that despite the crushing in the concrete that was evident, four bars had ruptured. Additionally, the rupture of these bars occurred directly at the location where the spiral reinforcement had been welded to the bars (see Figures 12-13). The crack width that occurred in the maximum moment region was uncharacteristically large however (See Figure 14). PCI (The Prestressed Concrete Institute) recommends a maximum crack width of 0.005” be allowed during handling for members exposed to the weather. The ICP-PHC piling exceeded the 0.005” threshold at 12 kip-ft of load application which is approximately 22% of the reported ΦMn, and 68% of the dead load moment for a 14” section being lifted with supports at 36’. That is, the 0.005” criteria can be exceeded during transportation.
Florida Department of Transportation Structural Research Center 14
Structural Performance of ICP PHC Piles September, 2001
0
10
20
30
40
50
60
70
0 2 4 6 8 10 12 14Deflection (in.)
North Load Point
Center Line
South Load Support
Manufacturer Reported Capacity Mn = 54 kip-ftφ
Figure 11 – Applied Moment vs. Deflection – Static Test
Figure 12 – Specimen During Testing
Figure 13 – Specimen After Failure
Florida Department of Transportation Structural Research Center 15
Structural Performance of ICP PHC Piles September, 2001
0
10
20
30
40
50
60
70
0 0.01 0.02 0.03 0.04 0.05 0.06 0.07 0.08Crack Width (in.)
2' North of Center Line
Center Line
2' South of Center Line
PCI Recommended Maximum Crack Width - 0.005"
Manufacturer Reported Capacity Mn = 54 kip-ftφ
Figure 14 – Applied Moment vs. Crack Width – Static Test
Fatigue Testing – In both the static flexural test specimen and the fatigue specimen, the spiral reinforcement was spot-welded to the prestressing bars. In general, this practice is not performed in the United States; due to the influence that welding has with respect to the fatigue performance of prestressing steel. As previously mentioned, AASHTO specifications require that prestressed reinforcement be capable of withstanding an 18 ksi stress change in the cracked section. This initially led to a minimum load that is just above the cracking level of the specimen to a maximum load that is slightly below the ultimate capacity of the section. However, the upper end of the range was too high to perform adequate fatigue testing and resulted in rupture of the specimen at an extremely low cycle count. A second fatigue test was then designed in which the specimen was pre-loaded to the cracked condition, then cyclic loading with a fatigue range below the cracking load was used as the minimum level resulting in the maximum level occurring in a stable load range (maximum applied moment of 37 kip-ft). The fatigue specimen failed at 4884 cycles, well below any acceptable fatigue capacity, according to AASHTO requirements. Static tests were performed at the initial state, 100 cycles, 250 cycles and 1000 cycles with the next load increment to occur at 5000 cycles if the specimen had not failed prior to that point. A brittle failure was observed at the 4884 cycle mark resulting in rupture of 4 out of 6 prestressing bars. Additionally, as in the static flexural specimen, the rupture of these bars occurred directly at the location where the spiral reinforcement had been welded to the bars (See Figure 15 - 17).
Florida Department of Transportation Structural Research Center 16

Structural Performance of ICP PHC Piles September, 2001
0.00
5.00
10.00
15.00
20.00
25.00
30.00
35.00
40.00
0.00 0.20 0.40 0.60 0.80 1.00 1.20 1.40Deflection (in.)
Initial Test
100 Cycles
500 Cycles
Figure 15 – Applied Moment vs Deflection – Fatigue Test
Figure 16 – Fatigue Specimen at Failure
Figure 17 – Ruptured Bar
Splice Testing – Using the remaining portions of the IPC-PHC piles, personnel at the Structural Research Center performed the splice procedure that is used for the section. The new specimen was then tested in a four-point static flexural test setup similar to the static test detailed above. Failure occurred at a value of 62 kip-ft, which is greater than the manufacturer’s specifications, and the failure occurred through the concrete, not the steel splice (See Figures 17-18). Again the failure mode was brittle with 4 out of 6 prestressing bars rupturing at failure, all at the location where the spiral reinforcement had been welded to the bars.
Florida Department of Transportation Structural Research Center 17

Structural Performance of ICP PHC Piles September, 2001
Figure 17 – Splice Test Specimen Under Load
Figure 18 – Failure Crack Conclusions/Recommendations The primary objective of this test program was to determine the feasibility of using the IPC-PHC piling system in Florida Department of Transportation projects. Of primary concern and focus for the test program was the spot-welding that is performed for attaching the spiral reinforcement to the primary reinforcement, especially as relevant to fatigue. Testing, performed by the Structures Research Center, lead to the following conclusions and recommendations:
1 – The static flexural response of the ICP-PHC pile was found to acceptable in terms of actual capacity compared to design capacity. However use around areas of high moisture should not be considered unless additional design considerations are made with respect to the crack widths that would be achieved under design loads. The combination of large crack widths with the minimal amount of concrete cover, would provide a direct path for a corrosive agent.
2 – Following the AASHTO requirements for fatigue resistance leads to the
conclusion that the IPC-PHC system is unacceptable in fatigue critical applications. However, it is extremely important to note that flexural fatigue is not a normally considered condition for piles, and some questions regarding the applicability of the specification toward fatigue testing of such sections arise. Typically, the design conditions for a prestressed concrete pile would result in a significantly lower cyclic load range, and inherently a lower stress range in the reinforcement than the range specified by AASHTO. It is recommended we revisit the AASHTO guidelines if flexural fatigue of prestressed concrete piles does become an issue in the future.
3 – The failure mode for all test specimens results in a brittle ultimate situation,
where fracture occurs simultaneously with rupture of the prestressing bars. While the section behavior is acceptable up to the ultimate condition, the lack of ductility at failure makes the IPC-PHC piles unacceptable in conditions where ship impact is a concern.
Florida Department of Transportation Structural Research Center 18

Structural Performance of ICP PHC Piles September, 2001
4 – Both the splicing detail and splicing procedure for the IPC-PHC piles result in a splice that is fully satisfactory and capable of consistently exceeding the required capacity for the section tested. Further testing however is recommended for larger sections to insure that the change in member scale has no effect.
5 – Further study should be performed regarding the detailing aspects of the
section, especially as to the amount of concrete cover provided. This note is provided in light of the unknown characteristics of the high-strength, high-performance concrete used in the system, and may result in a different allowance being made for detailing precast prestressed pile sections that utilize such materials and casting methods similar to IPC-PHC piles.
6 – Due to the problems with the amount of concrete cover and performance of
the welded bars, it is recommended that the IPC-PHC piles not be used in coastal areas. However, if tied steel spirals and an increase in the concrete cover to FDOT requirements were implemented, the IPC-PHC pile system could be acceptable for all conditions.
Acknowledgements The author wishes to express his appreciation to Steven Kert for donation of the test specimens and technical data for the IPC-PHC piles, and to the staff of the Florida Department of Transportation Structures Research Center for their help in the testing phase of this project, especially to Paul Tighe, for all his work. References 1 - “Manual of Concrete Practice,” American Concrete Institute 215R-3, 1987. 2 - “LRFD Bridge Design Specifications,” AASHTO, 1994. 3 - “Standard Specifications for Transportation Materials and Methods of Sampling and Testing,” AASHTO, Seventeenth Edition, 1995. 4 - Naaman, A., “Prestressed Concrete Analysis and Design – Fundamentals,” McGraw-Hill Book Company, 1982. 5 - Shahawy, M., Beitelman, T., “Fatigue Performance of RC Beams Strengthened with CFRP Laminates,” First International Conference on Durability of (FRP) Composites for Construction (CDCC’98), Sherbrooke, Quebec, Canada, August 5-7, 1998. 6 - “Standard Specifications for Highway Bridges,” AASHTO, 1993.
Florida Department of Transportation Structural Research Center 19
Structural Performance of ICP PHC Piles September, 2001
Florida Department of Transportation Structural Research Center 20
7 - Technical Information on “ULBON” bars, provided by Steven Kert of Pipe & Piling Concrete U.S.A. Co.