florida department of transportation · florida department of transportation state materials office...
TRANSCRIPT

FLORIDA DEPARTMENT OF
TRANSPORTATION
STATE MATERIALS OFFICE
FLEXIBLE PAVEMENT CONDITION SURVEY
HANDBOOK
March 2012


Table of Contents
Title Page
List of Tables .................................................................................................................... i
List of Figures .................................................................................................................. ii
Executive Summary ........................................................................................................ iii
I. Introduction ........................................................................................................... 1
II. Pavement Section Selection and Identification ..................................................... 3
III. Evaluation Methods ............................................................................................ 11
Crack Rating .................................................................................................. 11
Rut Rating ...................................................................................................... 28
Ride Rating .................................................................................................... 32
IV. Flexible Pavement Condition Survey Field Workbook ........................................ 35
Appendix A – Computer Use for Flexible Pavement Condition Survey Data ................. 39
Appendix B – Ride-Rating Re-run Procedure…….………………………………………...41 Appendix C – Profiler Calibration Instructions ............................................................... 43

i
List of Tables
Table Page
1 Roadway Direction Code ................................................................................. 4
2 Standard Remarks ........................................................................................ 10
3 Raveling Codes ............................................................................................. 12
4 Patching Codes ............................................................................................. 13
5 Numerical Deductions for Cracking Method .................................................. 15
6 Numerical Deductions for Rutting Methods ................................................... 29


ii
List of Figures
Figure Page
1 Wheel Path Designation ................................................................................. 16
2 Class 1B Cracking Estimates ......................................................................... 17
3 Class II Cracking Estimates ........................................................................... 18
4 Class III Cracking Estimates .......................................................................... 19
5 Class 1B Cracking Classification .................................................................... 20
6 Class II Cracking Classification ...................................................................... 21
7 Class III Cracking Classification ..................................................................... 22
8 Class 1B Cracking Photograph ...................................................................... 23
9 Class II Cracking Photograph ......................................................................... 24
10 Class III Cracking Photograph ........................................................................ 25
11 Patching Photograph ...................................................................................... 26
12 Raveling Photograph ...................................................................................... 27
13-14 Rut Depth Methods ........................................................................................ 30
15 Manual Rut Depth Photograph ....................................................................... 31
16 Inertial Profiler Photograph ............................................................................. 34


iii
Executive Summary
This handbook has been developed as a guide for personnel responsible for conducting
the Florida Department of Transportation Pavement Condition Survey (PCS) on flexible
pavements and to ensure consistency among raters. It also serves as a reference to
staff in each district involved in the PCS data verification process. This reference
describes the procedures for conducting a visual, mechanical and automated condition
evaluation of the Department’s flexible pavement system. Items evaluated in the survey
include:
1. Class IB Cracking
2. Class II Cracking
3. Class III Cracking
4. Raveling
5. Patching
6. Profiler Rut Depth (automated)
7. Manual Rut Depth
8. Ride Quality (roughness)
The data collected during the PCS is used as input into the pavement management
system and for project prioritization purposes.
Keywords: Crack Rating, Ride Rating, Rut Rating, International Roughness Index (IRI),
Ride Number (RN), Pavement Evaluation, Flexible Pavement Condition Survey, Profiler,
Roadway Characteristics Inventory (RCI), Straight Line Diagram (SLD)

Flexible Pavement Condition Survey Handbook, March 2012 Page 1
I. Introduction
The present condition of Florida’s flexible pavement system is of interest to Pavement
Management, Design, Planning, Maintenance, consultants, and other groups within the
Florida Department of Transportation.
The information provided in this handbook describes the methods used to evaluate
surface distresses and determine the ride quality and the rut depth of the flexible
pavement. Any mention of rigid pavement is only discussed when necessary for the
completion of the Flexible Pavement Condition Survey. For information relating to the
evaluation of rigid pavements, please refer to the Rigid Pavement Condition Survey
Handbook.
The results of this evaluation provide information that is used in conjunction with other
data for the following purposes:
1. Determine the present condition of the State Highway System
2. Compare present with past condition
3. Predict future deterioration rates
4. Estimate rehabilitation funding needs
5. Provide justification for annual pavement rehabilitation budget
6. Provide justification for prioritizing rehabilitation projects
7. Provide justification for distribution of rehabilitation funds to Districts
The various changes and enhancements that have been implemented with each survey
are recorded. The “History of Florida Pavement Condition Survey” is located at the
following web address:
http://www.dot.state.fl.us/statematerialsoffice/pavement/performance/pcs/pcshistory.pdf

Page 2 Flexible Pavement Condition Survey Handbook, March 2012

Flexible Pavement Condition Survey Handbook, March 2012 Page 3
II. Pavement Section Selection and Identification
The length of pavement to be evaluated will vary depending upon a number of factors.
Typical factors that create section limits (rated sections) include the following:
1. County line
2. County section or subsection
3. Construction Limits
4. Significant changes in pavement condition.
5. Structures in excess of 0.25 mile.
6. Rigid Pavement in excess of 0.50 mile within a Flexible Pavement section.
7. Changes in the number of lanes (2 to 3 lanes, etc.)
As implied by the list above, a certain amount of office preparation is required prior to
the field evaluation. The Rater should have access to Construction Plans, Straight Line
Diagrams (SLD), Video-logs, Maps, Roadway Characteristics Inventory (RCI) data, and
historical PCS Data for those highways to be evaluated.
Construction Limits
Section limits should be based initially upon construction project limits. The section may
deteriorate at different rates, requiring additional “breaks” within the overall section, but
the beginning and ending mileposts must not be modified. To preserve the history of
PCS data, section limits must only be changed if the limits of a new construction project
extend into previously existing project limits. For new construction projects equal to or
greater than one mile in length, provide a financial project number (FIN), if possible.
Section Length
Pavement sections less than 0.50 miles should not be rated separately. Combine any
sections shorter than 0.50 miles with the adjacent section having the most similar
condition.
Roadway Direction
The direction a section is rated depends on the following criteria:

Page 4 Flexible Pavement Condition Survey Handbook, March 2012
Divided
Any pavement section 0.50 miles or greater that has a physical median or
permanent barrier wall separating traffic traveling in different directions. One lane in
each direction must be rated for divided roadways.
Composite (Undivided)
Pavement sections without dividers or sections where any consecutive divided
segment is less than 0.50 miles are considered composite. Composite pavement
sections include areas with paved center turn lanes. One lane in only one direction
must be rated. Rate these sections in the same direction each year, unless an
obvious difference exists based upon visual observation of the pavement condition.
In this case, the rater must rate the direction having the greatest amount of
distresses.
The direction rated is coded in the Roadway column of the Field Workbook. See Table
1 below.
TABLE 1
ROADWAY DIRECTION
Note 1: A limited number of sections have mileposts that are descending in the North or East direction or are
ascending in the South or West direction. For example, the PCS Roadway designation of a 1 or 3 could be
South or West. Refer to the construction plans or SLD’s for clarification if needed. Regardless of these
exceptions to the rule, a roadway code of 1 or 3 is always evaluated in the ascending direction and a code of 2
or 4 is always evaluated in the descending direction.
ROADWAY
CODE
PAVEMENT
DIVISION
MILEPOST
DIRECTION
DIRECTION
(NOTE1)
1 Composite Ascending North or East
4 Composite Descending South or West
2 Divided Descending South or West
3 Divided Ascending North or East

Flexible Pavement Condition Survey Handbook, March 2012 Page 5
Pavement Type (Type)
The Type column of the Field Workbook is used to denote the surface type of the
roadway as well as other conditions the rater observes while performing the survey.
The following is a list of all Type codes used:
Exceptions (Type 0)
Exceptions include pavement sections that are not state-maintained or sections that
overlap other sections that have been surveyed and are state-maintained. Only
code Remarks for sections having Type 0.
Asphalt Pavement (Type 1)
Type 1 is for standard asphalt pavement sections that do not fall under any of the
other pavement Type codes.
Section Improvement (Type 2)
Type 2 is for sections that have been partially rehabilitated. This includes but is not
limited to: overlaid intersections, wheel path leveling, resurfacing in one lane only,
area resurfacing or manhole adjustments. This code is used to note that changes
to the pavement surface were made that influence the Crack, Rut or Ride ratings.
This can result in either positive or negative changes to the ratings. Unless
additional improvements are made this type must change in the following year. This
new type will be assigned by rater. Normally this will be type 1.
Skin Patch (Type 3)
Type 3 is for sections that have large areas covered by a thin overlay or skin patch
(often applied as maintenance overlay). These areas are considered patching.
Combine estimates of patching with Class III cracking and include in rating for entire
section.
Rigid Pavement (Type 4)
Type 4 is for rigid pavement sections. No ratings should be recorded in the Flexible
PCS for these sections.

Page 6 Flexible Pavement Condition Survey Handbook, March 2012
New Construction (Type 5)
Type 5 is for a newly constructed section of roadway. As an example, when a
composite roadway has new construction that changes it to a divided roadway, the
lanes added in the new direction are coded as Type 5 and the existing composite
lanes that were resurfaced are coded as a Type 7. The following year this type
must change to a different code assigned by the rater, usually type 1. Provide a
financial project number (FIN), for projects equal to or greater than one mile in
length, if possible.
No Ride (Type 6)
Type 6 is for sections where the profiler is unable to achieve a repeatable ride
rating. These are normally sections that are too short, but sometimes other longer
sections have characteristics that the profiler is unable to repeat. These sections
are usually in urban areas and have features such as cross streets with signalized
intersections and radical intersecting profiles. Do not provide a Ride Number for
these sections, only collect a value for rut depth and crack rating. Rut depth should
be collected with the profiler, but if a reliable rut depth cannot be achieved, manual
rut depth (page 29) must be taken. This decision is left to the discretion of the rater.
If a section that is New Pavement (Type 7) is also a No Ride (Type 6), code as New
Pavement (Type 7) and do not enter any values for Ride Number (RN) or
International Roughness Index (IRI). Include comments for New Pavement (NP)
and No Ride (NR) in the remarks.
New Pavement (Type 7)
Type 7 is for newly overlaid asphalt pavement. Provide a financial project number
(FIN) for projects equal to or greater than one mile in length, if possible. The
following year this type must change to a different code assigned by the rater,
usually type 1.
Under Construction (Type 8)
Type 8 is for areas that are under construction during the survey. Areas that are
signed as under construction can be rated providing the original surface is

Flexible Pavement Condition Survey Handbook, March 2012 Page 7
undisturbed and no lane shifts or other deviations from the previously surveyed
roadway exists. This code can be used for more than one year. Typically, the
following year, the section will change to a Type 7. Upon returning the next year it
is determined that no rehabilitation took place, the section must be coded Type 1
and Not New Pavement (Not NP) coded in the remarks.
Structures (Type 9)
Type 9 is for Structures including bridges, box culverts and other permanent objects
that are equal to or greater than 0.25 miles. These structures should be
represented by separate pavement section limits and coded as Type 9. Any
structure less than 0.25 miles must remain combined with the larger section and
profiler roughness turned off. Crack, Rut or Ride rating data must not be reported
for any structure.
Mileposts recorded for structures (bridges, box culverts and other permanent
objects) as well as exceptions must come from SLD’s or RCI whenever possible,
not from distance-measuring instrument. This allows for data cross checks with
Department RCI (feature code 258).
If a structure is located between a flexible and rigid pavement section, coding as
Type 9 in the flexible pavement survey adds the structure to the flexible pavement
system. If coded as Type 0 the structure is excluded from the flexible pavement
system. It is important to ensure any structures coded as Type 9 in the flexible
pavement survey are coded as Type 0 in the rigid pavement survey. Not doing so
would add the mileage for the structure to both surveys.
Mileage from sections coded Type 9 is also used to denote pavement sections that
have been added to the state-maintained system since the PCS was completed.
This allows the mileage to be added to the survey and also serves as a reminder for
the rater to rate the section the next year. Always code number of Travel Lanes
and Remarks for sections listed as Type 9.
Lanes
For composite roadways, this is the total number of through travel lanes. For divided

Page 8 Flexible Pavement Condition Survey Handbook, March 2012
roadways, this is the number of through lanes in the direction of travel. Do not include
turn lanes, parking lanes or emergency lanes in the number of Lanes. The value used
for Lane must be in agreement with RCI feature code 212 (Thru Lanes). Include the
total number of lanes in the Lanes column of the Field Workbook.
Rated Lane
The lane having the worst pavement condition shall be rated for the direction being
tested. It is coded in the Rated Lane column of the Field Workbook. This value is noted
by ascending (R) or descending (L) followed by the count of through lanes starting from
the inside lane. For example, a road with 3 lanes in each direction, the middle lane in
the ascending direction is named R2, and the inside lane in the descending direction is
named L1.
Verification
The Verification (Ver) column is used to denote results of the verifications done per
district request and to record the status of any re-runs due to ride data not matching
previous year’s data.
When a district requests verification of a particular rated section, it is re-evaluated for
Crack Rating only. If the results of this re-evaluation determine that the original crack
rating was correct, an “A” is placed in the Verification column to denote that the re-
evaluation agreed with the original rating. If the results determine the original crack
rating was incorrect, the change(s) are made and a “C” is placed in the Verification
column. This value remains in the next version of the workbook (next year) so the rater
is aware that the verification was performed.
If a Ride re-run was performed (according to Appendix B) by the operator and the
previously collected ride data was replaced by the ride data collected during the re-run,
a “U” is placed in the Verification column to denote that the re-run was used. If ride data
collected during the re-run is not used, an “N” is placed in the Verification column to
denote that the re-run was not used. The re-run information is eliminated prior to the
creation of the workbook each year.

Flexible Pavement Condition Survey Handbook, March 2012 Page 9
Remarks
The Remarks column is used to record information regarding the condition of the
section being rated. See Table 2 for a detailed listing of all standard remarks.
TABLE 2
STANDARD REMARKS
REMARKS STANDARD CODE New Pavement (A) (see note1) NP
New Construction (A) NC
Under Construction (A) UC
Not New Pavement (A) NOT NP
Bridge Number BR ###### (County Number and Bridge Number)
Rigid Pavement (A) Rigid Pavt
No Ride (A) NR
Patching (A) PT
Raveling (A) RAV
Off RCI (A) Off RCI
Survey Next Year Add in XX (XX = Survey Year)
Lane Realignment RAL
Brick Crosswalks BW
Manholes in wheel path MH
Rippling RIP
Depressions DEP
Bleeding BLD
Shoving SHV
Delamination DEL
Spalling SPL
Pot Holes PH
Corrugations COR
Sealed Cracks SLDCK
Crowning CRN
Transverse Cracking TRVCK
Scaring SCR
Speed Reduction Device (i.e. Rumble Strips) RS
Note1: An (A) after the remark in the REMARKS above column indicates an automated remark (based upon an entry
in another field).

Page 10 Flexible Pavement Condition Survey Handbook, March 2012
Comments
The Comments column is used to record information specific to the section that will
assist rater in future surveys. Examples include County section numbers for exceptions
and any other non-standard remarks that will help identify the section. This column can
also contain standardized remarks that exceed the seventeen character limit of the
Remarks column.

Flexible Pavement Condition Survey Handbook, March 2012 Page 11
III. Evaluation Methods
Data collection is accomplished by visually estimating distresses present within each
roadway section and through use of an inertial profiler to collect Rut and Ride data at
highway speeds.
Crack Rating
Consideration is given to three types of cracking in flexible pavements. The classes of
cracks are described as follows:
Class IB - Hairline cracks that are less than or equal to ⅛ inch (3.18 mm) wide in
either the longitudinal or transverse direction. These may have slight
spalling and slight to moderate branching. These cracks are estimated
individually for the total linear length of the cracks. The width of the
affected area is considered one (1) foot (0.30 m). See Figures 2, 5 and 8
(pages 17, 20 and 23).
Class II - Cracks greater than ⅛ inch (3.18 mm) and less than ¼ inch (6.35 mm)
wide in either the longitudinal or transverse direction. These may have
moderate spalling or severe branching. Also includes all cracks less than
¼ inch (6.35 mm) wide that have formed cells less than 2 feet (0.61 m) on
the longest side, also known as alligator cracking. Class II cracks are
considered rectangular, and the total affected area in square feet is
counted. See Figures 3, 6 and 9 (pages 18, 21 and 24).
Class III (including Raveling and Patching) - Cracks greater than ¼ inch (6.35
mm) wide that extend in a longitudinal or transverse direction and cracks
that are opened to the base or underlying material. Also includes
progressive Class II cracking resulting in severe spalling with chunks of
pavement breaking out. Class III cracks are considered rectangular, and
the total affected area in square feet is counted. See Figures 4, 7 and 10
(pages 19, 22 and 25).

Page 12 Flexible Pavement Condition Survey Handbook, March 2012
Raveling - Raveling is the wearing away of the pavement surface caused by the
dislodging of aggregate particles. See Figure 12 (page 27). Only
significant areas of raveling are considered. Do not count an isolated
area in a long section if it’s not representative of the rated section.
The severity levels used to describe raveling are as follows:
Light - The aggregate and/or binder has begun to wear away but has not
progressed significantly, with some loss of aggregate.
Moderate - The aggregate and/or binder has worn away and the surface texture is
becoming rough and pitted; loose particles generally exist; loss of
aggregate has progressed.
Severe - The aggregate and/or binder has worn away and the surface texture is
very rough and pitted, loss of aggregate very noticeable.
Record the predominant severity level and percent affected area of raveling in the
Raveling column of the field workbook using the codes shown in Table 3.
TABLE 3
RAVELING CODES
PERCENT OF PAVEMENT AREA
AFFECTED BY RAVELING
RAVELING SEVERITY LEVEL AND CODE
LIGHT MODERATE SEVERE
01 -- 05 1 1 1
06 -- 25 2 2 2
26 -- 50 3 3 3
51+ 4 4 4
Note: Code the Predominant severity level only

Flexible Pavement Condition Survey Handbook, March 2012 Page 13
Patching - A patch is an area of the pavement that has been replaced with a newer
material after the time of original construction. Patching should reflect a
defect in the pavement that has been repaired. (See Figure 11 on page
26) Only significant areas of patching should be considered. Record the
percent of pavement area affected by patching by using the codes
shown in Table 4.
TABLE 4
PATCHING CODES
Calculating Crack Rating
To calculate the total area affected by cracking, combine the percent area affected
estimations as follows:
Class 1B + Class II + Class III + Raveling + Patching = Total Percent Affected Area
To determine the predominant class of cracking, first combine values for percent
affected area for Raveling and Patching with Class III cracking estimates. Next,
compare the percent affected area from the three classes of cracking (with Class III
cracking now including Patching and Raveling). The predominant crack class has the
highest percent affected area value.
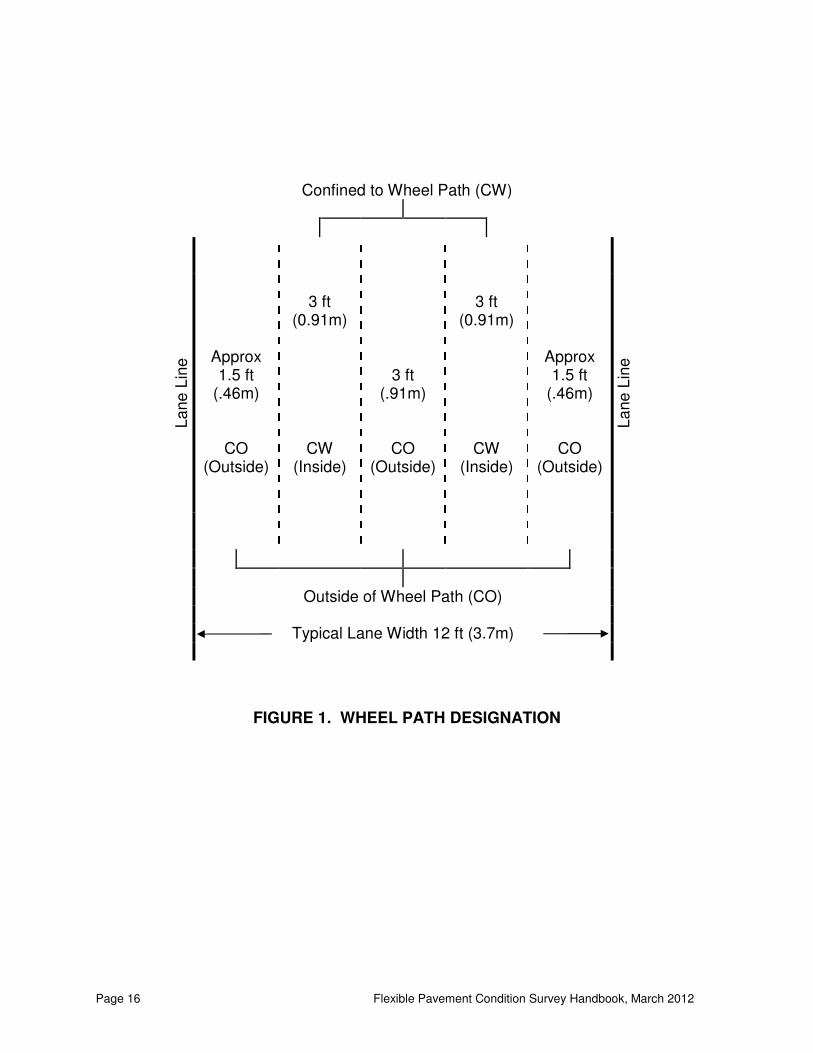
The above values must be determined for cracking confined to the wheel path (CW) and
cracking outside of the wheel path (CO), each representing 100 percent of their
respective areas. See Figure 1 (page 16) for a diagram of this wheel path designation.
PERCENT OF PAVEMENT AREA AFFECTED BY PATCHING
PERCENT CODE
01 -- 05 1
06 -- 25 2
26 -- 50 3
51+ 4

Page 14 Flexible Pavement Condition Survey Handbook, March 2012
Table 5 (page 15) explains how to determine the final crack rating from the above
values.
Crack Type
The Crack Type is denoted when the presence of specific types of cracks are
predominant. These Crack Types are used to help determine the underlying cause of
cracks. Crack Type codes are as follows: Alligator (A), Block (B) and Combination (C).

Flexible Pavement Condition Survey Handbook, March 2012 Page 15
TABLE 5
NUMERICAL DEDUCTIONS FOR CRACKING METHOD
PERCENT OF PAVEMENT AREA
AFFECTED BY CRACKING
CONFINED TO WHEEL PATHS (CW) PREDOMINANT CRACKING CLASS
1B CRACKING II CRACKING III CRACKING
(Including RAV & PT)
CODE DEDUCT CODE DEDUCT CODE DEDUCT
00 -- 05 A 0.0 E 0.5 I 1.0
06 -- 25 B 1.0 F 2.0 J 2.5
26 -- 50 C 2.0 G 3.0 K 4.5
51+ D 3.5 H 5.0 L 7.0
PERCENT OF PAVEMENT AREA
AFFECTED BY CRACKING
OUTSIDE OF WHEEL PATHS (CO) PREDOMINANT CRACKING CLASS
1B CRACKING II CRACKING III CRACKING
(Including RAV & PT)
CODE DEDUCT CODE DEDUCT CODE DEDUCT
00 -- 05 A 0.0 E 0.0 I 0.0
06 -- 25 B 0.5 F 1.0 J 1.0
26 -- 50 C 1.0 G 1.5 K 2.0
51+ D 1.5 H 2.0 L 3.0
Notes: - Total percent of cracking is determined by combining Class 1B, Class II, Class III, Raveling and Patching).
Percentages for CW and CO are estimated separately, each representing 100% of its respective area.
Only the predominant cracking class will be recorded for CW and CO. When determining which crack type is predominant, combine percentages for Class III cracking with Raveling and Patching, then compare this value to percentages for Class 1B and Class II. The larger of these values is considered predominant.
CW Example: 1B = 10%, II = 12%, III =6% Total = 28%
Predominant is Class II in the 26-50% category (code G – deduct 3.0)
CO Example: 1B = 10%, II = 6%, III =6% Total = 22%
Predominant is Class 1B in the 6-25% category (code B – deduct 0.5)
Given the formula below:
CRACK RATING = 10 - (CW + CO). CRACK RATING =10-(3.0+0.5)
CRACK RATING=6.5
Page 16 Flexible Pavement Condition Survey Handbook, March 2012
Confined to Wheel Path (CW)
La
ne
Lin
e
Approx 1.5 ft
(.46m)
CO (Outside)
3 ft
(0.91m)
CW (Inside)
3 ft (.91m)
CO (Outside)
3 ft
(0.91m)
CW (Inside)
Approx 1.5 ft
(.46m)
CO (Outside)
La
ne
Lin
e
Outside of Wheel Path (CO) Typical Lane Width 12 ft (3.7m)
FIGURE 1. WHEEL PATH DESIGNATION

Flexible Pavement Condition Survey Handbook, March 2012 Page 17
AREA DIMENSIONS
CW = 56 ft. (17.07m) x 1 ft. (0.30m) = 56 ft2 (5.20m2) ÷ 600 ft2 (55.74m2) = 9% CO = 30 ft. (9.14m) x 1 ft. (0.30m) = 30 ft2 (2.79m2) ÷ 600 ft2 (55.74m2) = 5% NOTE: CW = Confined to Wheel Paths CO = Outside of Wheel Paths Single Cracks considered 1 ft. (0.30m) in width Alligator Cracks considered as affected area Block Cracks considered 1 ft (0.30m) in width
FIGURE 2. CLASS 1B CRACKING ESTIMATES