flood information management system … 3_mr bambang...pesisir waduk/situ hujan di hulu banjir kanal...
TRANSCRIPT

FLOOD INFORMATION MANAGEMENT SYSTEM
DURING 2014 FLOOD
Bambang Surya Putra, M. Com

Flood
• Influenced by Climate / precipitation , Sea level, Land Terrain Contour, River Conditions
• Mostly Predictable
• More times to prepare more lives can be safed

Floods In Jakarta
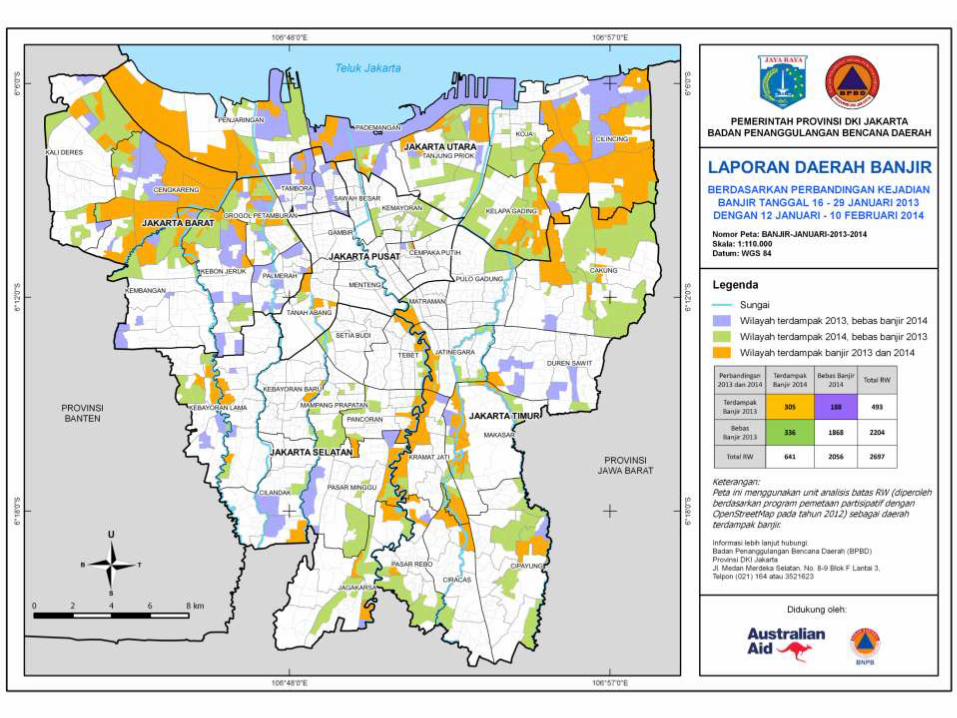
Floods in Jakarta through very long experience, based on geography, geology, meteorology and climatology with a combination of demographic that is so dense and vulnerable make this disaster so complex.
Flood Happened Since 1621
Pased by 13 Rivers 40 % USL + Sea
Level Raise + High Tide
Precipitation 1.500 – 4500 /
year
Land Subsidence 0,5-17 cm / y
Density < 16.000 / km2
Low Awareness (garbage,..)
Minimum Green Open Space


Urgency
• Need accurate and timely information available before (early warning and monitoring), during, and after disasters.
• Citizen
• Volunteer
• NGO/INGO
• Rescue team
• Disaster Agency
• Related Deptmnts

Penggunaan Data
Yang Lebih Detail

Hierarchy
• Governance, measures, information distributions refers to this Level of Authority

Data Exercise Using Village Level Data
This figure is much bigger than reality
How to fix it ?

Data Exercise Using RW Level Data

. . . .
UPSTREAM
(HULU)
(Puncak-Bogor) MIDDLESTREAM
(Bogor-Depok-Jaksel) DOWNSTREAM
(HILIR)
(Jaksel-Jakut)
.
Pesisir
Waduk/situ
Hujan di hulu
Banjir kanal
Gravitasi Polder
Hujan di hilir Sungai makro
meluap akibat
hujan di hulu =
BANJIR..!! Saluran meluap
akibat hujan di
hilir = BANJIR..!! Air laut masuk ke
darat akibat
pasang air laut
(ROB) = BANJIR..!!
Upstream Sea Tide
Local Rain

Water Level Monitoring Post
The Distance between post needs to be more closer

Automatic Sensor Information

Hourly Water Level Information
- Manually informed by Radio Communication from Monitoring Post - Traditional but most reliable and proven - Now combine digital sensor (AWLR), CCTV and manual report

Flood Information Management
Flood information management involves coordination, delivery of relief assistance, beneficiary involvement, marketing and external relations, monitoring and evaluation
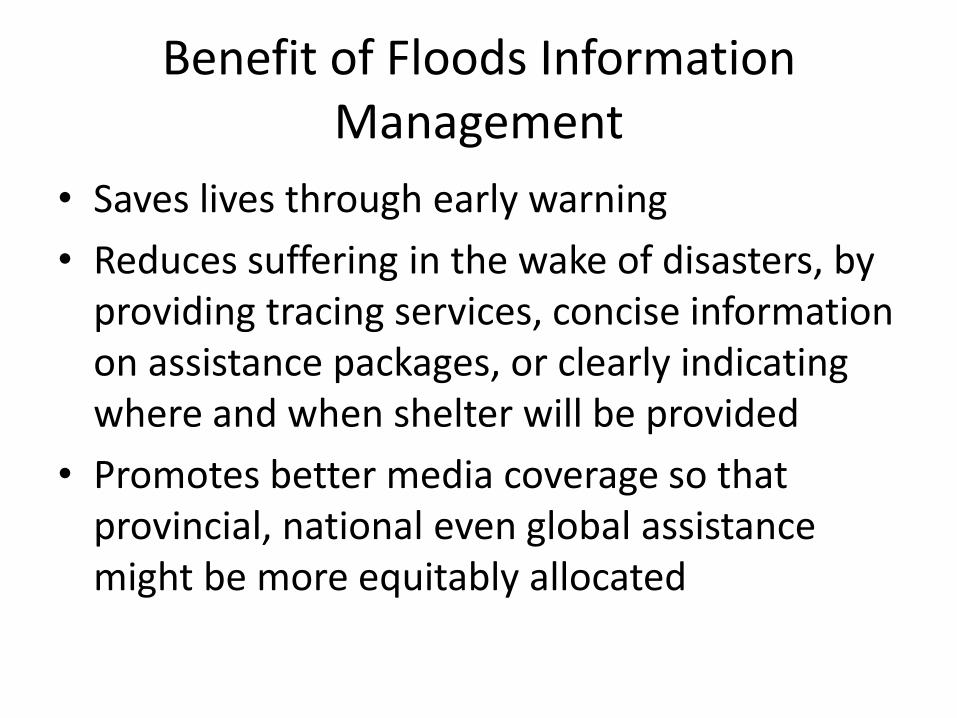
Benefit of Floods Information Management
• Saves lives through early warning
• Reduces suffering in the wake of disasters, by providing tracing services, concise information on assistance packages, or clearly indicating where and when shelter will be provided
• Promotes better media coverage so that provincial, national even global assistance might be more equitably allocated

Disaster Victims
0
5
10
15
20
25
30
35
40
Illness Drowned Electric Shock Total
21
11
6
38
12
8 5
25
2013
2014
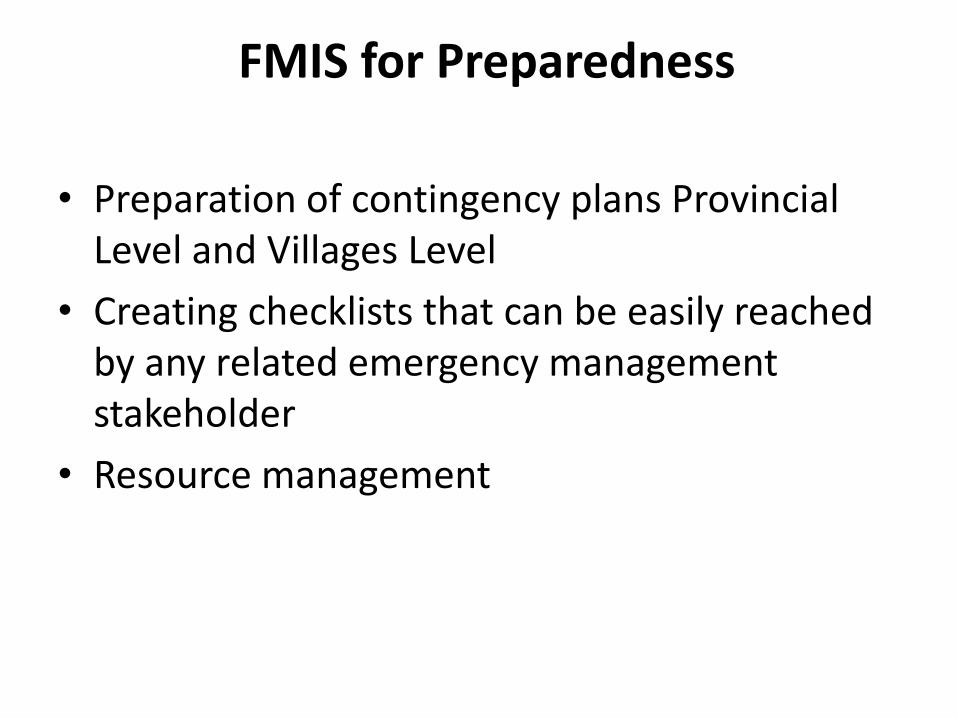
FMIS for Preparedness
• Preparation of contingency plans Provincial Level and Villages Level
• Creating checklists that can be easily reached by any related emergency management stakeholder
• Resource management

Evacuation Places

FMIS for Risk Mitigation • Determine possible flood risk areas
• Jakarta use JFEWS, DIMS
• Supported by GIS Application
JFEWS DIMS InaSAFE


Media Monitoring

FMIS for Response • Executing and tracking the contingency plan
• DIMS manage :
– Inundated (+potencially) Area
– IDP
– Evacuation Area Management
– Resource Mobilization (Man, Equipment, Logistic)
– Update Field Conditions
• Disaster Reporting Apps with Android

FMIS for Recovery
• DALA Calculations (use OSM participatory map to collect building data)
• Cost calculation of the emergency
• Rehablititation Works
• Reports – for Monitoring and Evaluation

Key Success Factor
- More detail GIS more accurate information (RT Mapping on schedule)
- Let stakeholder participate for data feeding (Contigency Planning Village Level)
- Activate emergency call centre
- Organized data with the most critical
- Uptodate data that really needed by related org
- Leaders commitment.

Possibility of Fail
The impact of the tech and social media response possibly blunted by 3 key factors: ◦ large-scale power blackouts and the disabling of
telecommunications networks which limited access to the internet and mobile phone systems;
◦ Do not have Disaster Recovery Planing ◦ the demographics of the disaster. Deomographic; unaccustomed
to accessing information online, unfamiliar with social media networks and unaware, therefore, of the relief resources available to them.
If there is no information after a disaster, people become even more stressed and anxious.


