flood fatalities in the united states - walker lee …chubasco.niu.edu/pubs/ashley and ashley 2008...
TRANSCRIPT
Flood Fatalities in the United States
SHARON T. ASHLEY AND WALKER S. ASHLEY
Meteorology Program, Department of Geography, Northern Illinois University, DeKalb, Illinois
(Manuscript received 4 October 2006, in final form 5 July 2007)
ABSTRACT
This study compiles a nationwide database of flood fatalities for the contiguous United States from 1959to 2005. Assembled data include the location of fatalities, age and gender of victims, activity and/or settingof fatalities, and the type of flood events responsible for each fatality report. Because of uncertainties in thenumber of flood deaths in Louisiana from Hurricane Katrina, these data are not included in the study.Analysis of these data reveals that a majority of fatalities are caused by flash floods. People between theages of 10 and 29 and �60 yr of age are found to be more vulnerable to floods. Findings reveal that humanbehavior contributes to flood fatality occurrences. These results also suggest that future structural modifi-cations of flood control designs (e.g., culverts and bridges) may not reduce the number of fatalities nation-wide. Spatially, flood fatalities are distributed across the United States, with high-fatality regions observedalong the northeast Interstate-95 corridor, the Ohio River valley, and near the Balcones Escarpment insouth-central Texas. The unique distributions found are likely driven by both physical vulnerabilities forflooding as well as the social vulnerabilities.
1. Introduction
According to a recent National Weather Service(NWS) assessment examining 10 yr of weather-relatedfatality data (http://www.weather.gov/os/hazstats.shtml),floods—whether originating because of heavy rain,snowmelt, structural failure, or a combination of thesefactors—are the second deadliest (in comparison withheat) of all weather-related hazards in the UnitedStates. Kunkel et al. (1999) found that fatalities in theUnited States have generally increased during the past25 yr in comparison with the early and middle part ofthe twentieth century. Moreover, flood damage costsfor the United States steadily increased through thetwentieth century (Pielke and Downton 2000; Pielke etal. 2002; Downton et al. 2005). Floods that significantlydisrupt or incapacitate a society by causing a large num-ber of fatalities and costly damage have primarily beenassociated with developing countries, for example, Ban-gladesh (Wisner et al. 2004). However, in recent de-cades, some of the most extensive, damaging, and costlyfloods have occurred in wealthy countries. A prime ex-
ample of this occurred in 1993 in the United Statesalong the Mississippi River basin and its major tribu-taries, where cities and towns located in the floodplainwere devastated or entirely destroyed. More advancedeconomies, like the United States, quickly discoveredthat they were not immune to such natural phenomenadespite governmental attempts to control natural pro-cesses through levees, concrete abutments, and the like(Smith and Ward 1998).
Floods are naturally occurring events that are depen-dent not only on rainfall amounts and rates, but also onthe topography of the area, land use of the region, soiltype of the watershed, and antecedent moisture condi-tions (Funk 2006). These periodic events are detrimen-tal to a society when people are located in their path-ways. In general terms, vulnerability means a potentialfor loss dictated by both a society’s resilience and po-tential exposure to the hazard (Cutter 1996; Cutter etal. 2000). However, since the early 1980s there havebeen many variations of this definition since this termmeans different things to different people (Cutter1996). Wisner et al. (2004) state that a combination offactors including the physical environment (e.g., houselocated on erodible or low-lying land), the localeconomy (e.g., low-income neighborhoods), and theperformance of public actions (e.g., driving through aflooded street) and institutions (e.g., inadequate warn-
Corresponding author address: Sharon Ashley, Department ofGeography, Davis Hall Rm. 118, Northern Illinois University, De-Kalb, IL 60115.E-mail: [email protected]
MARCH 2008 A S H L E Y A N D A S H L E Y 805
DOI: 10.1175/2007JAMC1611.1
© 2008 American Meteorological Society
JAMC1611
ing dissemination) may contribute to unsafe conditionsfor the population. They add that specific social char-acteristics, such as economic class and/or gender, alsoenhance a person’s vulnerability.
Flooding can be separated into three main catego-ries: flash flooding, river flooding, and coastal flooding(French and Holt 1989). Flash flooding is defined bythe NWS as “a flood that rises and falls quite rapidly,usually as a result of intense rainfall over a small area,in a short amount of time, usually under 6 hours,” riverflooding is defined as “the rise of a river to an elevationsuch that the river overflows its natural banks causingor threatening damage,” and coastal flooding pertainsto “flooding which occurs from storms where water isdriven onto land from an adjacent body of water”(http://www.srh.noaa.gov/fwd/glossarynation.html).Coastal flooding can be generated from storms on avariety of scales, including a local thunderstorm to largemidlatitude cyclones such as northeasters or tropicalsystems such as hurricanes.
Several past investigations have examined U.S.flood-related fatalities (French et al. 1983; Mooney1983; Dittman 1994; Coates 1999; Rappaport 2000;Thomas and Mitchell 2001; Jonkman and Kelman 2005;Jonkman 2005). Examining fatalities by state for 1959–91, Dittman (1994) found that, on average, there were119 flood deaths per year in the United States. Frenchet al. (1983) determined that a majority of the flashfloods during 1969–81 occurred during the warm seasonspanning July–September, with September represent-ing the peak fatality month. French et al. (1983) alsofound that 93% of flash flood fatalities were due todrowning and 42% of these were vehicle-related.
Mooney (1983) examined fatalities during a rela-tively short time frame (1977–81) and found that 60%of the deaths in the United States occurred in eitherurban or suburban areas, with nearly 75% of the fatali-ties taking place in the evening or overnight hours. Ofthe fatality reports that included information on howand where they occurred, nearly one-half occurred invehicles. Accordingly, Zevin (1994) reports that 80%–90% of annual flood deaths are caused by flash floods,with approximately 40% of these fatalities associatedwith pedestrian stream crossings or vehicles. Jonkmanand Kelman (2005) investigated the causes of Europeanand U.S. flood disaster deaths (1989–2002) as well ascircumstances surrounding those fatalities. All of theabove studies found that fatalities are highest amongmales, and that there is an enhanced vulnerability forthose �21 yr old and �60 yr old. However, Jonkmanand Kelman (2005) could not confirm these previousfindings of an age-related vulnerability to floods.
Other studies have examined loss of life associated
with tropical cyclone flooding (Rappaport 2000; Cer-veny and Newman 2000). Rappaport (2000) compiled adatabase of tropical cyclone fatalities using newspapersand NWS publications and found a higher percentageof male deaths. Vehicle-related deaths only accountedfor 23% of the resulting tropical cyclone fatalities. Thisis a lower percentage than that found by Mooney(1983), Zevin (1994), and Coates (1999) in their re-search of flood-related deaths. Disparities in the recentliterature may be due to fundamental differences be-tween the studies. For example, the periods of recorddiffer from each study, varying from just 5 yr (Mooney1983) to 33 yr (Dittman 1994). Moreover, the studies donot encompass all flood-related deaths but instead fo-cus specifically on flash floods or tropical cyclonefloods. In the case of Jonkman and Kelman (2005),their study is explicit to flood disasters (i.e., more than10 people killed, more than 100 people affected, state ofemergency declared, or call for international assis-tance).
From this limited body of research on flood-relateddeaths in the United States, no study has presented acomprehensive spatial and temporal analysis of flood-related deaths. Past studies are restricted by the num-ber of years analyzed or by a limited focus on particularflood types. This study is the first to construct a data-base of fatalities associated with all flooding events inthe United States (with related demographic informa-tion) from 1959 to 2005. Results highlight the specificvulnerabilities associated with floods in the UnitedStates, including social vulnerabilities (i.e., gender, age)and physical vulnerabilities (i.e., activity leading to fa-tality, structure where fatality occurred). These data areexamined spatially so that regions of the United Statesthat are most vulnerable to flood events may be de-fined. The underlying objective is to improve awarenessand education of this hazard to emergency managers,forecasters, and, ultimately, the people of the UnitedStates.
2. Data and methodology
a. Fatality database compilation
The database of 1959–2005 flood-related fatalitieswas compiled using monthly reports from volumes 1–47of the National Climatic Data Center’s (NCDC) StormData. Storm Data includes such information as stormoccurrences or other weather phenomena that causesignificant loss of life, injuries, property damage, and/ordisruption to commerce. Although Storm Data (underthe title of Climatological Data) was first issued in 1950,the information gathered was restricted to tornadicstorms, although by 1955 hail and thunderstorm wind
806 J O U R N A L O F A P P L I E D M E T E O R O L O G Y A N D C L I M A T O L O G Y VOLUME 47
data were included. In 1959 the publication officiallybecame known as Storm Data and incorporated allstorm and weather data as available in the publicationtoday. Storm Data is currently the primary source ofsevere weather event data used by atmospheric andhazard scientists for determining storm location and re-sulting casualties. Information is gathered predomi-nantly through the NWS, although other sources maybe used including media, law enforcement agencies,and governmental agencies as well as private compa-nies and individuals.
For this study, any inaccuracies of fatality data foundin Storm Data are assumed to be that of underreport-ing. For example, Curran et al. (2000) found that for“smaller impact” events, such as lightning, Storm Datatypically underreports the number of casualties becausethese events draw less attention in comparison with“larger impact” events (e.g., tornadoes). Thus, larger-impact flood events (e.g., the Rapid City, South Da-kota, 1972 flood event) should be reported more accu-rately in Storm Data because of the considerable num-ber of people that were affected and the high-profilenature of the event. However, 85% (94%) of the floodfatality dataset is made up of smaller-impact floodevents that attract little public or media attention sincethey only affect a small stream or single town and con-sequently kill one or two (�five) people. Nevertheless,Storm Data comprises the nation’s best estimate of haz-ard-event casualty information; however, it is likely thatthe tallies reported in Storm Data and within any analy-sis of the dataset will produce a conservative estimateof human fatalities due to flooding.
In some instances, Storm Data did not indicatewhether a fatality report from a tropical system (i.e., atropical depression, tropical storm, or hurricane) wasdue directly to flooding or another aspect (e.g., wind) ofthe cyclone. Rappaport (2000) examined the inlandthreat to life from Atlantic Ocean tropical systems from1970 to 1999 and found that 80% of all deaths were dueto drowning. Of these drowning deaths, 72% (or almost60% of all tropical system deaths in his database) weredue to freshwater flooding and storm surge. Because hefound that inland flooding caused a large majority ofthe tropical system deaths, the decision was made toinclude all tropical system fatalities that were unclearon the direct cause of death (e.g., wind or flooding).Because of this inclusion, it is expected that tropicalsystem fatalities are inflated, but the exclusion wouldsubstantially underestimate the influence of tropicalsystem flood-related fatalities in the United States.
Data from Rappaport (2000) were used to verifywhether the deaths from 1970 to 1999 were due to in-land flooding. Therefore, any report from Storm Data
in which the cause of death was not determined [eitherthrough verification from the Rappaport (2000) datasetor through a detailed entry in Storm Data] was includedin the dataset, although they were kept as a separatecategory for analysis. This separation can be identifiedin later figures and are labeled “unidentifiable tropicalsystem” deaths. These fatalities may include deaths dueto inland flooding, storm surge, rough seas, tornadoes,or wind.
The flood fatality database constructed for this studyincludes all deaths that are contributable directly to theflood event (e.g., death due to drowning or death due tophysical trauma within water). Indirect, or secondary,flood fatalities (e.g., death due to electrocution or deathdue to rain-slicked roads from heavy rain) were notincluded in this analysis. Each report in the databaseconsists of the following variables:
1) state, county, and city (if provided) of the fatalityreport,
2) date and time (local standard time) of incident,3) flood event type,4) activity/location surrounding the incident, that is,
what the person was doing or where the person waslocated when he/she encountered the flood waters(if provided), and
5) demographic information of report (e.g., age andgender; if provided).
In general, Storm Data classifies the flood-related fa-talities either as “flash floods” or “river floods”; there-fore, each fatality was subdivided by flood type. A re-port was categorized as “unknown” if the description inStorm Data was specific enough to know that floodingwas occurring, but not detailed enough to know wheth-er it was a flash flood or river flood. This typicallyoccurred in the 1960–1970s before standardized meth-ods for report entry were instituted for Storm Data. Notincluded in this database were fatalities occurring incoastal waters or along a shoreline.
Storm Data is not a flawless source for casualty re-ports; however, the publication is unique and the onlykind of dataset of its type and thus must be used for thistype of analysis. The decision on inclusion/exclusion ofcases in this study was made as judiciously as possible.Despite this inherent subjectivity, the results should notbe altered significantly based on the inclusion or exclu-sion of a minimal number of reports relative to the totalnumber within the database.
The exclusion of fatality estimates from HurricaneKatrina from the state of Louisiana was purposeful.Currently, these values have not been provided by theNWS, NCDC, or reported in Storm Data. This is be-cause these tallies are still unknown. A Tropical Pre-
MARCH 2008 A S H L E Y A N D A S H L E Y 807
diction Center (TPC) report indicated that the numberof known fatalities in Louisiana is 1090 (Knabb et al.2005). The report states that the fatalities may havebeen directly or indirectly related to Katrina, but statethat there were roughly 1000 directly related deaths dueto Katrina. Additionally, the report indicates these fa-tality numbers are estimates and are “highly uncertain”and the true number “may never be known.” This un-certainty arises because complete statistics on causes ofdeath are not available from all counties affected by thestorm. At the time the TPC report was written, not allthe dead had been recovered, many more were stillreported missing, and the causes of death were stillbeing investigated. The report does speculate that amajority of the deaths in Louisiana were directly causedby the widespread surge-induced flooding and its after-math.
In June 2006, the NWS released a service assessmenton Hurricane Katrina estimating that direct deathsfrom Katrina are approximately 1353 (Johnson 2006).This estimate includes fatalities from all states impactedby Katrina. Until an accurate fatality estimate can beestablished, the inclusion of these estimates would adda substantial component of uncertainty to the analysisand are, therefore, not employed.
b. Geographic analysis
The flood-related fatalities were classified by eachvariable in the dataset (i.e., state, year, month, floodtype, activity, gender, and age). Additionally, the fatali-ties were aggregated by event report and classified inaddition to the raw fatality numbers. These classifica-tions reveal the temporal distribution of floods in theUnited States, the most dangerous type of flood in theUnited States, the activities (or structures) that aremost vulnerable to flood-related fatalities (vehicle ver-sus home), as well as the demographic characteristics ofthose most vulnerable to floods in the United States.
Fatality data are mapped in a geographic informationsystem (GIS) on a 40 km � 40 km grid using the lati-tude and longitude of the location of the report. A40-km grid was chosen to best represent the size of atypical county or parish. Generally, a town or city isprovided as the location of the report, although, attimes, the data are provided by county only. In cases inwhich only the county is reported, the latitude and lon-gitude of the county seat was utilized. From these maps,the geography of flood-related fatalities can be de-scribed and any regions with high or low numbers offatalities can be determined. For many tropical systemfatality reports, only a state (or multiple counties) wasprovided because of the large number of fatalities as-sociated with the event. Therefore, fatalities by state
are mapped (standardized by population) to includethese reports. The state fatalities (standardized bypopulation) are mapped separately by flood event typeincluding flash flood, river flood, tropical system flood.
3. Results: Flood fatality statistics
During the 47 yr of the study, a total of 4586 fatalitiesoccurred in the contiguous United States. On average,there are approximately 97.6 fatalities per year. Com-paratively, the NWS computes the average number offatalities (from a 30-yr period) as 107 (http://www.weather.gov/os/hazstats.shtml), while Jonkman (2005)found the average to be 100 over a 28-yr period. Thediscrepancy in totals reported is due to the differingperiods of records examined. The median value for re-ported fatalities is 81 yr�1. The median is more repre-sentative because extreme values inflate the average.Ranking the data by state illustrates that Texas has themost fatalities for the United States, while Pennsylva-nia and South Dakota follow in ranking (Table 1).When the data are ranked by fatalities per flood event,it is evident that flash floods (especially those from damfailures) and floods associated with tropical storms arethe flood types most typically associated with large fa-tality numbers (Table 2).
a. Frequency by year
The number of flood fatalities per year is highly vari-able, from a low of 23 in 1962 to a high of 451 in 1972(Fig. 1). Moreover, no statistically significant trend infatalities is evident over the period of record. Relativeto other weather-related hazards the lack of a decreas-ing trend is unique. Both lightning and tornado fatali-ties were found to be decreasing over the second half ofthe twentieth century (López and Holle 1996; Brooksand Doswell 2002; Boruff et al. 2003). Curran et al.(2000) state that the reduction in lightning deaths maybe due to improved medical care as well as emergencycommunication and transportation, while recent im-provements in the watch–warning system and detectionhas decreased the threat to life from tornadoes(Doswell et al. 1999; Brooks and Doswell 2002). De-spite these technological advancements, there has beenno significant decrease for flood risk. Deadly floodevents are also variable over the 47 yr, although noextreme years are evident.
Of the five anomalously high years, two of the yearsare characterized by a single large flash flood event. In1972, a dam near Rapid City, South Dakota, failed,which flooded the entire downtown during the night(Maddox et al. 1978; Carter et al. 2002; Bryant 2005).
808 J O U R N A L O F A P P L I E D M E T E O R O L O G Y A N D C L I M A T O L O G Y VOLUME 47
This event killed 237 and injured 2932. Of all single-county flood events in the dataset, this flash flood killedthe most people. This event coincided with a year thatwas already experiencing a large number of fatalities,primarily from tropical storm Agnes. In 1976, the large
number of fatalities occurred because of a flash flood inthe Big Thompson Canyon, Colorado, which killed 156and injured at least 250 (Henz et al. 1976; Maddox et al.1977; Albertson et al. 1978; Caracena et al. 1979). Inthis unique orographic-induced thunderstorm case, ex-
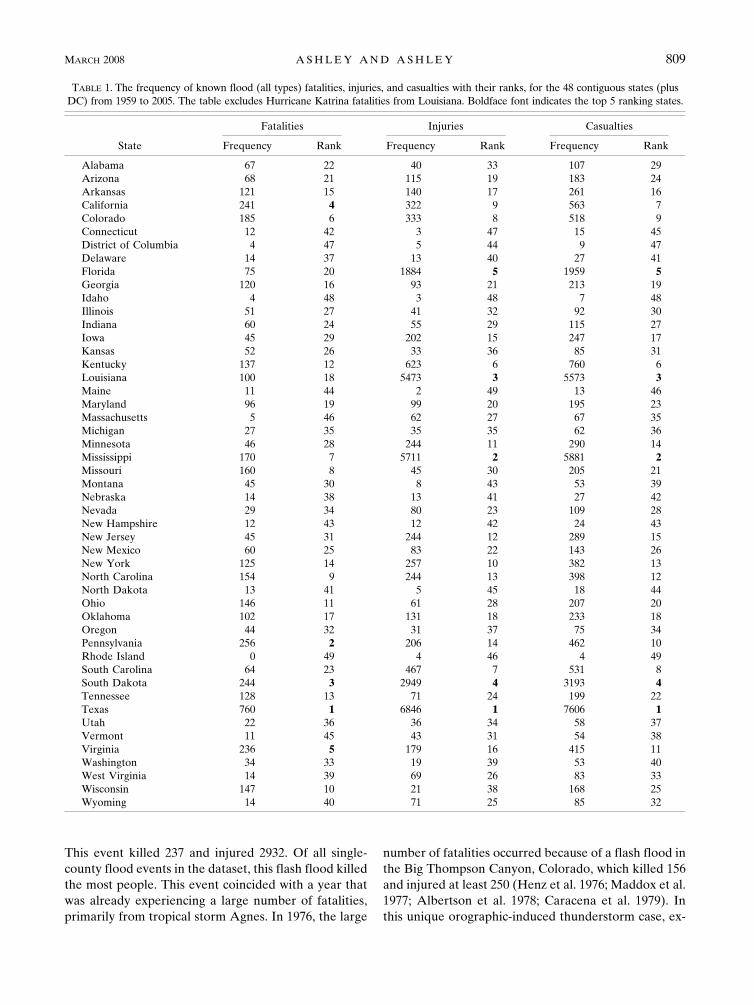
TABLE 1. The frequency of known flood (all types) fatalities, injuries, and casualties with their ranks, for the 48 contiguous states (plusDC) from 1959 to 2005. The table excludes Hurricane Katrina fatalities from Louisiana. Boldface font indicates the top 5 ranking states.
State
Fatalities Injuries Casualties
Frequency Rank Frequency Rank Frequency Rank
Alabama 67 22 40 33 107 29Arizona 68 21 115 19 183 24Arkansas 121 15 140 17 261 16California 241 4 322 9 563 7Colorado 185 6 333 8 518 9Connecticut 12 42 3 47 15 45District of Columbia 4 47 5 44 9 47Delaware 14 37 13 40 27 41Florida 75 20 1884 5 1959 5Georgia 120 16 93 21 213 19Idaho 4 48 3 48 7 48Illinois 51 27 41 32 92 30Indiana 60 24 55 29 115 27Iowa 45 29 202 15 247 17Kansas 52 26 33 36 85 31Kentucky 137 12 623 6 760 6Louisiana 100 18 5473 3 5573 3Maine 11 44 2 49 13 46Maryland 96 19 99 20 195 23Massachusetts 5 46 62 27 67 35Michigan 27 35 35 35 62 36Minnesota 46 28 244 11 290 14Mississippi 170 7 5711 2 5881 2Missouri 160 8 45 30 205 21Montana 45 30 8 43 53 39Nebraska 14 38 13 41 27 42Nevada 29 34 80 23 109 28New Hampshire 12 43 12 42 24 43New Jersey 45 31 244 12 289 15New Mexico 60 25 83 22 143 26New York 125 14 257 10 382 13North Carolina 154 9 244 13 398 12North Dakota 13 41 5 45 18 44Ohio 146 11 61 28 207 20Oklahoma 102 17 131 18 233 18Oregon 44 32 31 37 75 34Pennsylvania 256 2 206 14 462 10Rhode Island 0 49 4 46 4 49South Carolina 64 23 467 7 531 8South Dakota 244 3 2949 4 3193 4Tennessee 128 13 71 24 199 22Texas 760 1 6846 1 7606 1Utah 22 36 36 34 58 37Vermont 11 45 43 31 54 38Virginia 236 5 179 16 415 11Washington 34 33 19 39 53 40West Virginia 14 39 69 26 83 33Wisconsin 147 10 21 38 168 25Wyoming 14 40 71 25 85 32
MARCH 2008 A S H L E Y A N D A S H L E Y 809

treme elevation relief and a narrow canyon played animportant role in the strength of the current as it moveddown slope.
Furthermore, 1977 experienced several high-fatalityevents across the United States. The largest fatalityevent during this year occurred in Cambria County,Pennsylvania, with 74 deaths due to a flash flood event.Heavy rain and overtopping or bursting dams were theleading causes of this deadly event (Bosart and Sanders1981). Additionally, there were 39 deaths (45 injuries)
due to a dam failure and resulting flash flood in ToccoaFalls, Georgia (Sanders and Sauer 1979; Land 1980).The dam broke at night and the floodwaters washedthrough downtown Toccoa Falls, the Toccoa Bible Col-lege, and a mobile home park. A smaller-scale event inJackson County, Missouri, added to this deadly year bykilling 25 people during a September flash flood eventin the Kansas City metropolitan area (NOAA 1977).
The other two years with high-fatality reports were1969 and 1973. During 1969, category-5 Hurricane Ca-
FIG. 1. The frequency of flood fatalities and fatality events (excluding indirect) from 1959 to 2005. Black barsrepresent deaths due strictly to flooding for all event types in the study. Gray bars represent deaths due to tropicalsystems but not to flooding alone. Light gray bars represent deadly events. The dashed horizontal line representsyearly fatality median, and the nondashed horizontal line represents yearly fatality event median. The asteriskindicates that 2005 data are preliminary and do not include Hurricane Katrina fatalities from Louisiana.
TABLE 2. Top 10 deadliest multiple county flood events from 1959 to 2005 in the United States. The table excludes HurricaneKatrina fatalities from Louisiana.
Rank Year State Month Type of Flood Fatalities
1 1972 South Dakota June Dam failure 2372 1976 Colorado July Flash flood 1563 1969 Mississippi August Hurricane Camille 1324 1969 Virginia August Remnants of Camille 1095 1977 Pennsylvania July Flash flood 746 1972 Pennsylvania June Tropical Storm Agnes 507 1969 California January Flood and mudslides 418 1977 Georgia November Dam failure 399 1985 West Virginia November Remnants of Juan 39
10 1964 Montana June Flood 36
810 J O U R N A L O F A P P L I E D M E T E O R O L O G Y A N D C L I M A T O L O G Y VOLUME 47
mille impacted the Gulf Coast, causing a large numberof deaths as it came ashore. Additionally, heavy rain,flooding, and landslides were widespread across Ca-mille’s inland path: especially hard hit were the westernand central portions of Virginia where more than 82 cmof rain fell in Nelson County in 24 h (NOAA 1999). InVirginia, 109 people were killed from the combinationof flooding and landslides from the remnants of thishurricane. During 1973 there was no single event re-sponsible for a large fatality frequency, but the year wascharacterized by numerous instances of heavy rain-induced floods and flash floods. A majority of thesehigh-fatality years can be attributed to either a damfailure or flash flood that occurred at night.
b. Frequency by month
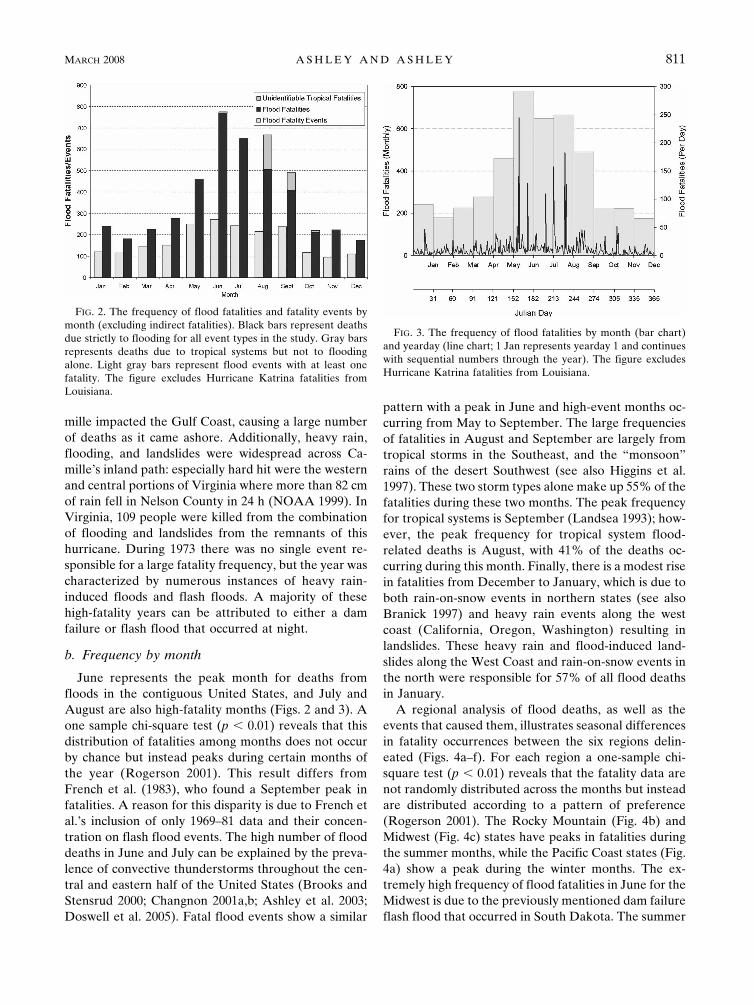
June represents the peak month for deaths fromfloods in the contiguous United States, and July andAugust are also high-fatality months (Figs. 2 and 3). Aone sample chi-square test (p � 0.01) reveals that thisdistribution of fatalities among months does not occurby chance but instead peaks during certain months ofthe year (Rogerson 2001). This result differs fromFrench et al. (1983), who found a September peak infatalities. A reason for this disparity is due to French etal.’s inclusion of only 1969–81 data and their concen-tration on flash flood events. The high number of flooddeaths in June and July can be explained by the preva-lence of convective thunderstorms throughout the cen-tral and eastern half of the United States (Brooks andStensrud 2000; Changnon 2001a,b; Ashley et al. 2003;Doswell et al. 2005). Fatal flood events show a similar
pattern with a peak in June and high-event months oc-curring from May to September. The large frequenciesof fatalities in August and September are largely fromtropical storms in the Southeast, and the “monsoon”rains of the desert Southwest (see also Higgins et al.1997). These two storm types alone make up 55% of thefatalities during these two months. The peak frequencyfor tropical systems is September (Landsea 1993); how-ever, the peak frequency for tropical system flood-related deaths is August, with 41% of the deaths oc-curring during this month. Finally, there is a modest risein fatalities from December to January, which is due toboth rain-on-snow events in northern states (see alsoBranick 1997) and heavy rain events along the westcoast (California, Oregon, Washington) resulting inlandslides. These heavy rain and flood-induced land-slides along the West Coast and rain-on-snow events inthe north were responsible for 57% of all flood deathsin January.
A regional analysis of flood deaths, as well as theevents that caused them, illustrates seasonal differencesin fatality occurrences between the six regions delin-eated (Figs. 4a–f). For each region a one-sample chi-square test (p � 0.01) reveals that the fatality data arenot randomly distributed across the months but insteadare distributed according to a pattern of preference(Rogerson 2001). The Rocky Mountain (Fig. 4b) andMidwest (Fig. 4c) states have peaks in fatalities duringthe summer months, while the Pacific Coast states (Fig.4a) show a peak during the winter months. The ex-tremely high frequency of flood fatalities in June for theMidwest is due to the previously mentioned dam failureflash flood that occurred in South Dakota. The summer
FIG. 2. The frequency of flood fatalities and fatality events bymonth (excluding indirect fatalities). Black bars represent deathsdue strictly to flooding for all event types in the study. Gray barsrepresents deaths due to tropical systems but not to floodingalone. Light gray bars represent flood events with at least onefatality. The figure excludes Hurricane Katrina fatalities fromLouisiana.
FIG. 3. The frequency of flood fatalities by month (bar chart)and yearday (line chart; 1 Jan represents yearday 1 and continueswith sequential numbers through the year). The figure excludesHurricane Katrina fatalities from Louisiana.
MARCH 2008 A S H L E Y A N D A S H L E Y 811
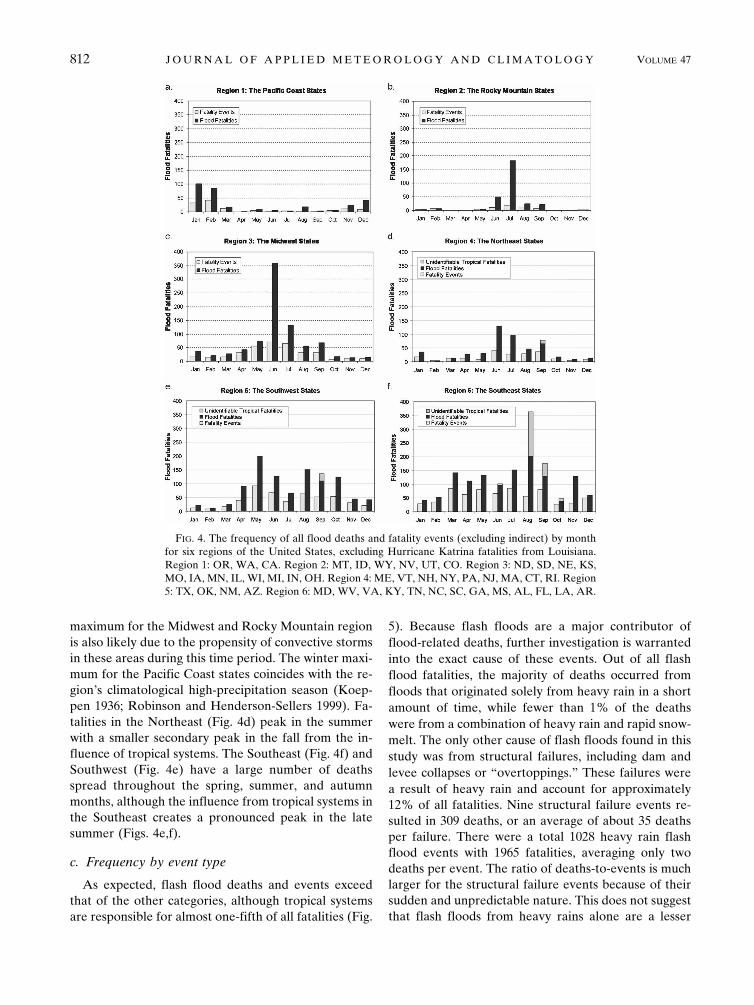
maximum for the Midwest and Rocky Mountain regionis also likely due to the propensity of convective stormsin these areas during this time period. The winter maxi-mum for the Pacific Coast states coincides with the re-gion’s climatological high-precipitation season (Koep-pen 1936; Robinson and Henderson-Sellers 1999). Fa-talities in the Northeast (Fig. 4d) peak in the summerwith a smaller secondary peak in the fall from the in-fluence of tropical systems. The Southeast (Fig. 4f) andSouthwest (Fig. 4e) have a large number of deathsspread throughout the spring, summer, and autumnmonths, although the influence from tropical systems inthe Southeast creates a pronounced peak in the latesummer (Figs. 4e,f).
c. Frequency by event type
As expected, flash flood deaths and events exceedthat of the other categories, although tropical systemsare responsible for almost one-fifth of all fatalities (Fig.
5). Because flash floods are a major contributor offlood-related deaths, further investigation is warrantedinto the exact cause of these events. Out of all flashflood fatalities, the majority of deaths occurred fromfloods that originated solely from heavy rain in a shortamount of time, while fewer than 1% of the deathswere from a combination of heavy rain and rapid snow-melt. The only other cause of flash floods found in thisstudy was from structural failures, including dam andlevee collapses or “overtoppings.” These failures werea result of heavy rain and account for approximately12% of all fatalities. Nine structural failure events re-sulted in 309 deaths, or an average of about 35 deathsper failure. There were a total 1028 heavy rain flashflood events with 1965 fatalities, averaging only twodeaths per event. The ratio of deaths-to-events is muchlarger for the structural failure events because of theirsudden and unpredictable nature. This does not suggestthat flash floods from heavy rains alone are a lesser
FIG. 4. The frequency of all flood deaths and fatality events (excluding indirect) by monthfor six regions of the United States, excluding Hurricane Katrina fatalities from Louisiana.Region 1: OR, WA, CA. Region 2: MT, ID, WY, NV, UT, CO. Region 3: ND, SD, NE, KS,MO, IA, MN, IL, WI, MI, IN, OH. Region 4: ME, VT, NH, NY, PA, NJ, MA, CT, RI. Region5: TX, OK, NM, AZ. Region 6: MD, WV, VA, KY, TN, NC, SC, GA, MS, AL, FL, LA, AR.
812 J O U R N A L O F A P P L I E D M E T E O R O L O G Y A N D C L I M A T O L O G Y VOLUME 47

threat, but instead signifies that one structural failureevent can impact more people in a single instance. Non-structural events, although typically only affecting oneor two people an event, are en masse the primary flashflood killer.
d. Frequency by activity or setting of occurrence
Out of all deaths reported, 64% have a known activ-ity or setting of occurrence (e.g., vehicle or permanentstructure). These data illustrate that 63% of fatalitieswith known activities or locations occurred in vehicles(Fig. 6). This is a much higher percentage than the 42%and 40% found previously by French et al. (1983) andZevin (1994), respectively, as well as the 50% found byMooney (1983). Other locations with relatively highpercentages of fatalities include permanent structuresand “outside” (e.g., standing on the banks of a floodedstream), which together made up about 19% of flood-related fatalities with known activities/locations.
After vehicle-related fatalities, deaths occurring out-side (14%) and in water (9%) were the leading activi-ties/locations. When a person accidentally fell or wasswept into the flood waters the location was labeled“outside,” while “in water” denotes people who inten-tionally walked through the floodwaters. Out of all ofthe deaths where people purposely walked throughfloodwaters, only 16% of them entered the waters inorder to evacuate or to rescue someone else. Another43% walked through the high water to reach some des-tination (e.g., a house or a car) in the floodwaters. Allof these victims were over the age of 12. Therefore,
almost one-half of these “in water” deaths could havebeen avoided because they were not going in the waterfor evacuation purposes or rescue. The remainingdeaths (with age data) in the “in water” category weremostly children (�12 yr old) who may not have under-stood the dangers of the waters and either walked intoor were playing in the floodwaters. These findings il-lustrate further that people often do not perceive flood-ing situations as life threatening (Drobot et al. 2007).This misguided perception or complacency leads tothese unfortunate, and often preventable, deaths.
e. Frequency by gender and age
Unfortunately, gender and age characteristics of re-ports were less frequently reported than that of activity.A majority (63%) of fatalities had unknown age, whilenearly one-half (49%) had unknown gender. The per-centage of flood fatalities with known ages stratified byage category shows that young adults (age 10–19), thosein their twenties, and those � than 60 yr of age have ahigher vulnerability to flooding (Fig. 7). Each of theseage categories shows a statistically greater percent offatalities relative to the percent of the U.S. population(United States Census Bureau 2000) in that categoryusing a one-sample test for proportions (95% confi-dence interval), revealing vulnerability in these age cat-egories. This specific age vulnerability is similar to find-ings reported by Coates (1999), French et al. (1983),and Mooney (1983). Each of these studies found anincreased vulnerability in both the young (�21 yr old)and those �60 yr old. Moreover, the three age catego-ries between 30 and 59 show a statistically lower per-cent of fatalities relative to the percent of the U.S.
FIG. 5. The frequency of fatalities and fatal events by floodevent type. Black bars represent deaths due strictly to flooding forall event types in the study. The gray bar represents the deathsdue to tropical systems but not to flooding alone. Light gray barsrepresent flood fatality events. The figure excludes Hurricane Ka-trina fatalities from Louisiana.
FIG. 6. The frequency of flood fatality events (black bars) andflood fatalities (gray bars) by activity/location, excluding Hurri-cane Katrina fatalities from Louisiana.
MARCH 2008 A S H L E Y A N D A S H L E Y 813
population (95% confidence interval), revealing alower vulnerability to flood events. Supporting previ-ous findings (Mooney 1983; French et al. 1983; Coates1999; Jonkman and Kelman 2005), the majority of flooddeaths with known gender were men. Moreover, 35%of the male fatality victims were between the ages of 10and 29 (Fig. 8).
4. Results: Spatial analysis
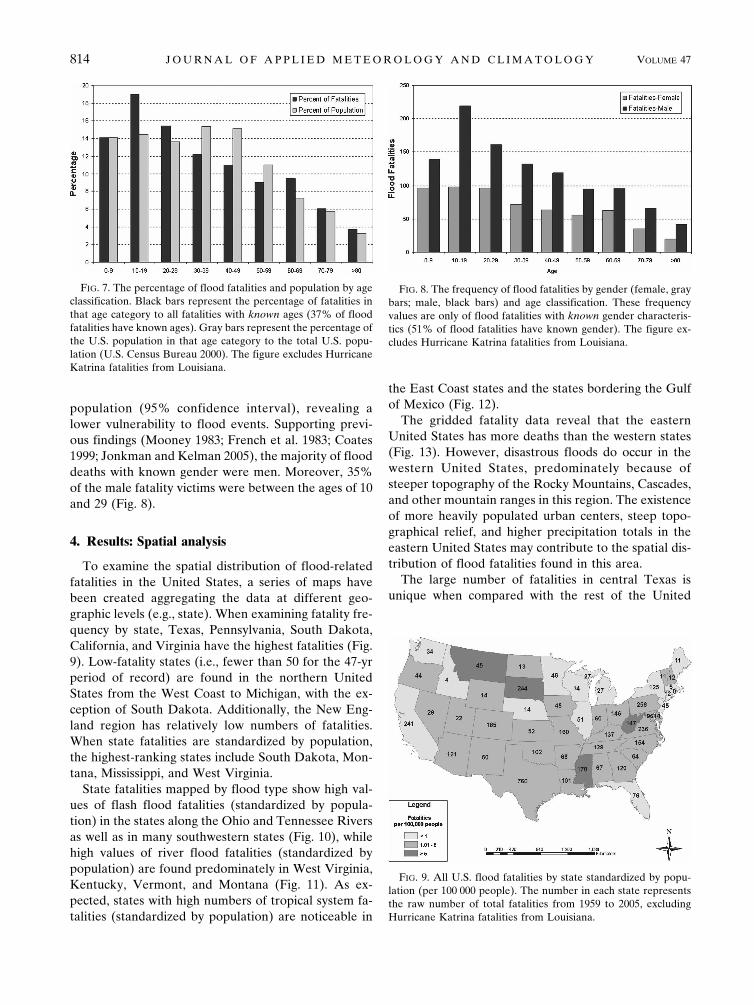
To examine the spatial distribution of flood-relatedfatalities in the United States, a series of maps havebeen created aggregating the data at different geo-graphic levels (e.g., state). When examining fatality fre-quency by state, Texas, Pennsylvania, South Dakota,California, and Virginia have the highest fatalities (Fig.9). Low-fatality states (i.e., fewer than 50 for the 47-yrperiod of record) are found in the northern UnitedStates from the West Coast to Michigan, with the ex-ception of South Dakota. Additionally, the New Eng-land region has relatively low numbers of fatalities.When state fatalities are standardized by population,the highest-ranking states include South Dakota, Mon-tana, Mississippi, and West Virginia.
State fatalities mapped by flood type show high val-ues of flash flood fatalities (standardized by popula-tion) in the states along the Ohio and Tennessee Riversas well as in many southwestern states (Fig. 10), whilehigh values of river flood fatalities (standardized bypopulation) are found predominately in West Virginia,Kentucky, Vermont, and Montana (Fig. 11). As ex-pected, states with high numbers of tropical system fa-talities (standardized by population) are noticeable in
the East Coast states and the states bordering the Gulfof Mexico (Fig. 12).
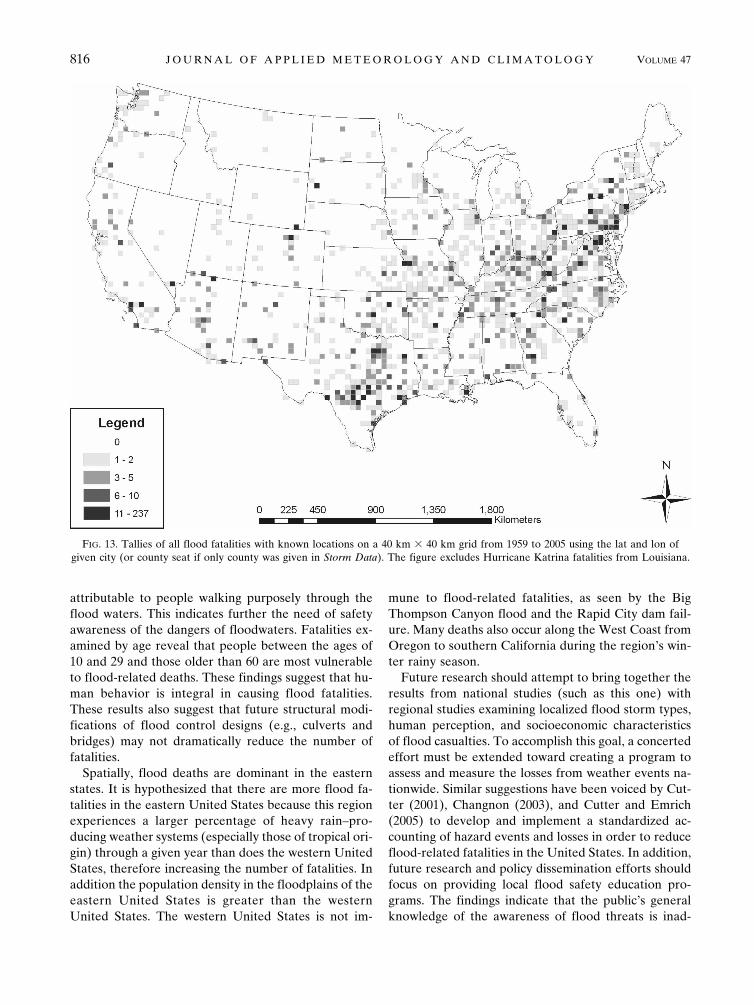
The gridded fatality data reveal that the easternUnited States has more deaths than the western states(Fig. 13). However, disastrous floods do occur in thewestern United States, predominately because ofsteeper topography of the Rocky Mountains, Cascades,and other mountain ranges in this region. The existenceof more heavily populated urban centers, steep topo-graphical relief, and higher precipitation totals in theeastern United States may contribute to the spatial dis-tribution of flood fatalities found in this area.
The large number of fatalities in central Texas isunique when compared with the rest of the United
FIG. 9. All U.S. flood fatalities by state standardized by popu-lation (per 100 000 people). The number in each state representsthe raw number of total fatalities from 1959 to 2005, excludingHurricane Katrina fatalities from Louisiana.
FIG. 7. The percentage of flood fatalities and population by ageclassification. Black bars represent the percentage of fatalities inthat age category to all fatalities with known ages (37% of floodfatalities have known ages). Gray bars represent the percentage ofthe U.S. population in that age category to the total U.S. popu-lation (U.S. Census Bureau 2000). The figure excludes HurricaneKatrina fatalities from Louisiana.
FIG. 8. The frequency of flood fatalities by gender (female, graybars; male, black bars) and age classification. These frequencyvalues are only of flood fatalities with known gender characteris-tics (51% of flood fatalities have known gender). The figure ex-cludes Hurricane Katrina fatalities from Louisiana.
814 J O U R N A L O F A P P L I E D M E T E O R O L O G Y A N D C L I M A T O L O G Y VOLUME 47

States. Although no extremely large flood fatality eventoccurred during the study period, many events withfewer than 20 fatalities occurred regularly. Coincidingwith this region of high fatalities is the edge of theBalcones Escarpment, where elevated topography de-scends dramatically to the flat lands of the coastal plain.Many of the deaths in this region are found along thisescarpment from its northern extent near the Dallas–Fort Worth area south to Austin and west towardMexico. Floods in the region have shorter lag timesbetween peak discharge and the time centroid of basin-average rainfall (i.e., the time that equally divides therainfall amount in half) and require much less rainfalland runoff to reach similar peak discharges as floodsoccurring in the neighboring coastal plains of Texas(Leopold 1991; Smith et al. 2000).
Two additional regions with high numbers of floodfatalities include 1) the Ohio River valley along theeastern and southern border of Ohio and 2) the coun-ties along the heavily populated I-95 corridor fromsouthern New England south to Washington D.C. Be-cause of lack of county and/or city information pro-vided by Storm Data, tropical systems are not well rep-resented in Fig. 13. A majority of the tropical systemfatalities did not have spatially explicit information onthe cities or counties where the deaths occurred andtherefore could not be mapped at this scale.
5. Summary and conclusions
Floods are the second-deadliest U.S. weather-relatedhazard. Therefore, a detailed examination that answerswhere, how, and why these deaths are occurring is im-
perative. By constructing a new, comprehensive flooddataset for 1959–2005, some of these questions wereanswered both quantitatively and spatially. For the 47yr of the study, 4586 reported fatalities occurred acrossthe contiguous United States. The number of fatalitiesvaried from year to year, with anomalously high yearscoinciding with either tropical system–produced floodsor sudden flash floods, often associated with structuralfailures of dams or levees. Flash floods from structuralfailure caused over 300 fatalities from only nine damand levee failures. Despite these large fatality events,the database is dominated by single- and two-personevents, similar to that found by Curran et al. (2000) forlightning casualties.
For all flood types, a majority of fatalities occurred invehicles (63%). An interesting result found during thisanalysis was the percent of “in water” deaths that are
FIG. 11. As in Fig. 10, but for river floods.
FIG. 12. As in Fig. 10, but for tropical system floods, excludingHurricane Katrina fatalities from Louisiana.
FIG. 10. All flash flood fatalities by state standardized by popu-lation (per 100 000 people). The number in each state representsthe raw number of total fatalities from 1959 to 2005.
MARCH 2008 A S H L E Y A N D A S H L E Y 815
attributable to people walking purposely through theflood waters. This indicates further the need of safetyawareness of the dangers of floodwaters. Fatalities ex-amined by age reveal that people between the ages of10 and 29 and those older than 60 are most vulnerableto flood-related deaths. These findings suggest that hu-man behavior is integral in causing flood fatalities.These results also suggest that future structural modi-fications of flood control designs (e.g., culverts andbridges) may not dramatically reduce the number offatalities.
Spatially, flood deaths are dominant in the easternstates. It is hypothesized that there are more flood fa-talities in the eastern United States because this regionexperiences a larger percentage of heavy rain–pro-ducing weather systems (especially those of tropical ori-gin) through a given year than does the western UnitedStates, therefore increasing the number of fatalities. Inaddition the population density in the floodplains of theeastern United States is greater than the westernUnited States. The western United States is not im-
mune to flood-related fatalities, as seen by the BigThompson Canyon flood and the Rapid City dam fail-ure. Many deaths also occur along the West Coast fromOregon to southern California during the region’s win-ter rainy season.
Future research should attempt to bring together theresults from national studies (such as this one) withregional studies examining localized flood storm types,human perception, and socioeconomic characteristicsof flood casualties. To accomplish this goal, a concertedeffort must be extended toward creating a program toassess and measure the losses from weather events na-tionwide. Similar suggestions have been voiced by Cut-ter (2001), Changnon (2003), and Cutter and Emrich(2005) to develop and implement a standardized ac-counting of hazard events and losses in order to reduceflood-related fatalities in the United States. In addition,future research and policy dissemination efforts shouldfocus on providing local flood safety education pro-grams. The findings indicate that the public’s generalknowledge of the awareness of flood threats is inad-
FIG. 13. Tallies of all flood fatalities with known locations on a 40 km � 40 km grid from 1959 to 2005 using the lat and lon ofgiven city (or county seat if only county was given in Storm Data). The figure excludes Hurricane Katrina fatalities from Louisiana.
816 J O U R N A L O F A P P L I E D M E T E O R O L O G Y A N D C L I M A T O L O G Y VOLUME 47
equate; therefore, the following recommendations toflood policy makers are suggested:
• Target specific groups, especially those that may bemore vulnerable to flood events than others, withflood safety awareness programs to include local citi-zen involvement. 1) Educate parents on flood dan-gers through the parent–teacher groups. Highlightthe fact that many children are killed by floods whenthey are driven into floods by a parent or guardian. 2)Provide flood safety programs to children within kin-dergarten–grade 12 schools that illustrate the hazardsof playing in and around culverts and floodwaters. 3)Target the specific vulnerabilities of the elderly sec-tor of the population through organizations such asthe Association for the Advancement of Retired Per-sons. This information may be disseminated throughtheir newsletter or via their Web site (http://www.aarp.org/).
Ultimately, the results of this study suggest that theU.S. population is still largely unaware of the life-threatening powers of floodwater. Therefore, theseaforementioned proactive preparedness programs willbe useful in reducing flood fatalities (American Meteo-rological Society 2000).
Acknowledgments. The authors thank Drs. AndrewGrundstein, Thomas Mote, Vernon Meentemeyer,John Dowd, Marshall Shepherd, and Mace Bentley forcomments and suggestions on previous versions of thismanuscript and Dr. Edward Rappaport for the use ofhis tropical system fatality dataset. We also appreciatethe comments and suggestions provided by threeanonymous reviewers.
REFERENCES
Albertson, M. L., M. Poreh, and G. A. Hurst, 1978: Big Thompsonflood damage was severe, but some could have been pre-vented. Civ. Eng.—ASCE, 48, 74–77.
American Meteorological Society, 2000: Policy statement: Predic-tion and mitigation of flash floods. Bull. Amer. Meteor. Soc.,81, 1338–1340.
Ashley, W. A., T. L. Mote, P. G. Dixon, S. L. Trotter, E. J. Powell,J. D. Durkee, and A. J. Grundstein, 2003: Distribution of me-soscale convective complex rainfall in the United States.Mon. Wea. Rev., 131, 3003–3017.
Boruff, B. J., J. A. Easoz, S. D. Jones, H. R. Landry, J. D.Mitchem, and S. L. Cutter, 2003: Tornado hazards in theUnited States. Climate Res., 24, 103–117.
Bosart, L. F., and F. Sanders, 1981: The Johnstown flood of July1977: A long-lived convective system. J. Atmos. Sci., 38,1616–1642.
Branick, M. L., 1997: A climatology of significant winter-typeweather events in the contiguous United States, 1982–94.Wea. Forecasting, 12, 193–207.
Brooks, H. E., and D. J. Stensrud, 2000: Climatology of heavy rainevents in the United States from hourly precipitation obser-vations. Mon. Wea. Rev., 128, 1194–1201.
——, and C. A. Doswell III, 2002: Deaths in the 3 May 1999Oklahoma City tornado from a historical perspective. Wea.Forecasting, 17, 354–361.
Bryant, E., 2005: Natural Hazards. Cambridge University Press,312 pp.
Caracena, F., R. A. Maddox, L. R. Hoxit, and C. F. Chappell,1979: Mesoanalysis of the Big Thompson storm. Mon. Wea.Rev., 107, 1–17.
Carter, J. M., J. E. Williamson, and R. W. Teller, 2002: The 1972Black Hills–Rapid City flood revisited. USGS Fact Sheet FS-037-02, U.S. Geological Survey, 17 pp.
Cerveny, R. S., and L. E. Newman, 2000: Climatological relation-ships between tropical cyclones and rainfall. Mon. Wea. Rev.,128, 3329–3336.
Changnon, S. A., 2001a: Damaging thunderstorm activity in theUnited States. Bull. Amer. Meteor. Soc., 82, 597–608.
——, 2001b: Thunderstorm rainfall in the conterminous UnitedStates. Bull. Amer. Meteor. Soc., 82, 1925–1940.
——, 2003: Measures of economic impacts of weather extremes.Bull. Amer. Meteor. Soc., 84, 1231–1235.
Coates, L., 1999: Flood fatalities in Australia, 1788–1996. Aust.Geogr., 30, 391–408.
Curran, E. B., R. L. Holle, and R. E. López, 2000: Lightning ca-sualties and damages in the United States from 1959 to 1994.J. Climate, 13, 3448–3464.
Cutter, S. L., 1996: Vulnerability to environmental hazards. Prog.Hum. Geogr., 20, 529–539.
——, Ed., 2001: American Hazardscapes: The Regionalization ofHazards and Disasters. Joseph Henry, 211 pp.
——, and C. Emrich, 2005: Are natural hazards and disaster lossesin the U.S. increasing? Eos, Trans. Amer. Geophys. Union,86, 381–388.
——, J. T. Mitchell, and M. S. Scott, 2000: Revealing the vulner-ability of people and places: A case study of GeorgetownCounty, South Carolina. Ann. Assoc. Amer. Geogr., 90, 713–737.
Dittman, R. H., 1994: Annual flood death statistics per state percapita for the United States and Puerto Rico during the pe-riod 1959–1991. NOAA Tech. Memo. NWS SR-153, 11 pp.
Doswell, C. A., III, A. R. Moller, and H. E. Brooks, 1999: Stormspotting and public awareness since the first tornado fore-casts of 1948. Wea. Forecasting, 14, 544–557.
——, H. E. Brooks, and M. P. Kay, 2005: Climatological estimatesof daily local nontornadic severe thunderstorm probabilityfor the United States. Wea. Forecasting, 20, 577–595.
Downton, M. W., J. Z. B. Miller, and R. A. Pielke Jr., 2005: Re-analysis of U.S. National Weather Service flood loss data-base. Nat. Hazards Rev., 6, 13–22.
Drobot, S. D., C. Benight, and E. C. Gruntfest, 2007: Risk factorsassociated with driving through flooded roads. Environ. Haz-ards, 7, 227–234.
French, J. G., and K. W. Holt, 1989: Floods. The Public HealthConsequences of Disasters. M. B. Greg, Ed., U.S. Departmentof Health and Human Services, 69–78.
——, R. Ing, S. Von Allmen, and R. Wood, 1983: Mortality fromflash floods: A review of the National Weather Service re-ports, 1969–1981. Public Health Rep., 98, 584–588.
Funk, T., 2006: Heavy convective rainfall forecasting: A look atelevated convection, propagation, and precipitation effi-
MARCH 2008 A S H L E Y A N D A S H L E Y 817
ciency. Proc. 10th Severe Storm and Doppler Radar Conf.,Des Moines, IA, National Weather Association.
Henz, J. F., V. R. Scheetz, and D. O. Doehring, 1976: The BigThompson flood of 1976 in Colorado. Weatherwise, 29, 278–285.
Higgins, R. W., Y. Yao, and X. L. Wang, 1997: Influence of theNorth American monsoon system on the U.S. summer pre-cipitation regime. J. Climate, 10, 2600–2622.
Johnson, D. L., 2006: Service Asssessment, Hurricane KatrinaAugust 23–31, 2005. National Weather Service, 38 pp. [Avail-able online at http://www.weather.gov/om/assessments/pdfs/Katrina.pdf.]
Jonkman, S. N., 2005: Global perspectives on loss of human lifecaused by floods. Nat. Hazards, 34, 151–175.
——, and I. Kelman, 2005: An analysis of the causes and circum-stances of flood disaster deaths. Disasters, 29, 75–97.
Knabb, R. D., J. R. Rhome, and D. P. Brown, 2005: HurricaneKatrina 23–30 August 2005. Tropical Cyclone Rep., NationalHurricane Center, 42 pp. [Available online at http://www.nhc.noaa.gov/pdf/TCR-AL122005_Katrina.pdf.]
Koeppen, W., 1936: Das geographische System der Klimate.Handbuch der Klimatologie, W. Koeppen and R. Geiger,Eds., Gebruder Borntraeger, 1–46.
Kunkel, K. E., R. A. Pielke Jr., and S. A. Changnon, 1999: Tem-poral fluctuations in weather and climate extremes that causeeconomic and human health impacts: A review. Bull. Amer.Meteor. Soc., 80, 1077–1098.
Land, L. F., 1980: Mathematical simulations of the Toccoa Falls,Georgia, dam-break flood. J. Amer. Water Resour. Assoc., 16,1041–1048.
Landsea, C. W., 1993: A climatology of intense (or major) Atlan-tic hurricanes. Mon. Wea. Rev., 121, 1703–1713.
Leopold, L. B., 1991: Lag times for small drainage basins. Catena,18, 157–171.
López, R. E., and R. L. Holle, 1996: Fluctuations of lightning ca-sualties in the United States: 1959–1990. J. Climate, 9, 608–615.
Maddox, R. A., F. Caracean, L. R. Hoxit, and C. F. Chappell,1977: Meteorological aspects of the Big Thompson flashflood of 31 July 1976. NOAA Tech. Rep. NOAA-TR-ERL388 APCL 41, 87 pp.
——, L. R. Hoxit, C. F. Chappell, and F. Caracena, 1978: Com-parison of meteorological aspects of the Big Thompson andRapid City flash floods. Mon. Wea. Rev., 106, 375–389.
Mooney, L. E., 1983: Applications and implications of fatality sta-tistics to the flash flood problem. Preprints, Fifth Conf. onHydrometeorology, Tulsa, OK, Amer. Meteor. Soc., 127–129.
NOAA, 1977: Kansas City flash flood of September 12–13, 1977.Natural Disaster Survey Rep. NOAA-NDSR-77-277-2, Na-tional Oceanic and Atmospheric Administration, 49 pp.
——, 1999: Hurricane Camille’s 30th birthday brings weather ser-vice reminder. NOAA Rep. 99-R237, National Oceanic andAtmospheric Administration, 3 pp.
Pielke, R. A., Jr., and M. W. Downton, 2000: Precipitation anddamaging floods: Trends in the United States, 1932–97. J.Climate, 13, 3625–3637.
——, ——, and J. Z. B. Miller, 2002: Flood damage in the UnitedStates, 1926–2000: A reanalysis of National Weather Serviceestimates. National Center for Atmospheric Research, 96 pp.
Rappaport, E. N., 2000: Loss of life in the United States associ-ated with recent Atlantic tropical cyclones. Bull. Amer. Me-teor. Soc., 81, 2065–2073.
Robinson, P. J., and A. Henderson-Sellers, 1999: ContemporaryClimatology. 2nd ed. Longman, 317 pp.
Rogerson, P. A., 2001: Statistical Methods for Geography. SAGEPublications, 236 pp.
Sanders, C. L., and V. B. Sauer, 1979: Kelly Barnes dam flood ofNovember 6, 1977, near Toccoa, Georgia. U.S. GeologicalSurvey Hydrologic Investigations Atlas HA-613, 23 pp.
Smith, J. A., M. Baeck, J. E. Morrison, and P. Sturdevant-Rees,2000: Catastrophic rainfall and flooding in Texas. J. Hydro-meteor., 1, 5–25.
Smith, K., and R. Ward, 1998: Floods: Physical Processes andHuman Impacts. Wiley, 382 pp.
Thomas, D. S. K., and J. T. Mitchell, 2001: Which are the mosthazardous states? American Hazardscapes: The Regionaliza-tion of Hazards and Disasters, S. L. Cutter, Ed., JosephHenry Press, 115–155.
U.S. Census Bureau, cited 2000: U.S. Census Bureau Factfinder.[Available online at http://factfinder.census.gov/servlet/QTTable?_bm�y&-geo_id�01000US&-qr_name�DEC_2000_SF1_U_QTP1&-ds_name�DEC_2000_SF1_U.]
Wisner, B., P. Blaikie, T. Cannon, and I. Davis, 2004: At Risk:Natural Hazards, People’s Vulnerability and Disaster. Rout-ledge, 447 pp.
Zevin, S. F., 1994: Steps toward an integrated approach to hydro-meteorological forecasting services. Bull. Amer. Meteor. Soc.,75, 1267–1276.
818 J O U R N A L O F A P P L I E D M E T E O R O L O G Y A N D C L I M A T O L O G Y VOLUME 47