flood and drought assessment of...
TRANSCRIPT

Flood and Drought Assessment of BrazilimplicAtions For locAl insurers
By James rohman | october 2013

1 Flood and Drought Assessment of Brazil | TransRe White Paper
1
Figure 1: The regions of Brazil, for reference

1 Flood and Drought Assessment of Brazil | TransRe White Paper
1
Executive Summary • Weather has become increasingly extreme and destructive over the past
15 years in Brazil.
• This has occurred at the same time as Brazil has experienced rapid socio-economic development.
• The combination of increased risk with increased insured values makes it even more important to understand likely future trends and developments.
• It is becoming clear that flooding in the Southeast and drought in the Northeast are linked events.
• Most flooding in São Paulo and Rio de Janeiro occurs during the rainy season and during the El Niño phase of El Niño Southern Oscillation (ENSO).
• Extreme rainfall is also linked to the presence of a strong Madden-Julian Oscillation (MJO) interacting with an already established South American Convergence Zone (SACZ).
• ENSO can interact with the South American Monsoon System (SAMS) and South American Convergence Zone (SACZ) to heighten rainfall in São Paulo and Rio de Janeiro.
• SAMS and ENSO collectively account for 85% of extreme rainfall events in São Paulo.
• São Paulo and Rio de Janeiro are both large urban heat islands, increasing rainfall potential over the city centers, and immediately downwind of urbanized areas.
• Predictive measures of ENSO, SACZ, SAMS and MJO can assist when considering catastrophe mitigation techniques and products.
• Weather patterns associated with changes in the global climate are affecting flooding and droughts in Brazil. For example, above average sea surface temperatures (SSTs) are linked to creating the SACZ.
• These changes will continue to increase extreme rainfall events in South and Southeast Brazil, and increase the frequency of dry spells and high heat in North, Northeast and Central-West Brazil.
• If those affects continue, then Brazil can expect an increased frequency and severity of extreme weather events.
• TransRe has the capability to support Brazilian insurers to better understand the implications of these developments.

2 Flood and Drought Assessment of Brazil | TransRe White Paper
2
Introduction In the next few years Brazil will celebrate its emergence as a global economic power with two enormous sporting festivals, the World Cup and the Olympics. These events will showcase Brazil’s rapid economic advances to the world. There is also a risk that extreme weather may disrupt the preparations for the events, or the events themselves. This would be an extremely visible example of the changes taking place in the weather patterns of Brazil in general, and Southeast Brazil in particular. Brazil has always been vulnerable to the patterns and rhythms of the weather. Heavy rainfall causes floods in the Southeast, while droughts reduce crop yields in the Northeast. To understand the causes, the first section of this paper summarizes the science behind them.
In recent years Brazil has suffered a rise in the frequency and the severity of extreme weather events. This has been due to the developing economy and population distribution, which increases the impact of extreme events on life and property. At the same time, the documented impact of climate change has been to make the flooding and droughts more severe. The second section of this paper summarizes the consequences of these developments.
More is likely to follow. Extrapolating from current observations, floods in the Southeast and droughts in the Northeast are likely to become more severe and more frequent in the future. The third section of this paper summarizes the best available current projections.
Public perception of the risks is changing. Combined with increasing private wealth, this will lead to increased insurance purchases. Brazilian insurers must understand the impact of the changing risk profile to their exposures. The final section of this paper highlights developments in this area.
Extreme weather can cause extreme disruption and loss, but the science of climatology is still evolving, and the correlations are not fully understood. However, we are in the business of risk management, protecting insurance buyers from their exposures. It is our job to understand the linkages as best we can, and to quantify them. While society (and we) may hope for the best, we must also prepare for the worst. This paper will seek to highlight general issues around extreme weather, including climate change, and to inform industry audiences of the specific exposures to flood and drought in Brazil.

3 Flood and Drought Assessment of Brazil | TransRe White Paper
3
The Science of Brazilian Weather A number of inter-related factors drive Brazil’s weather patterns. Major flooding in the SE occurs during the ‘rainy season’ and is more severe when El Niño occurs. Extreme rainfall is linked to El Niño’s interaction with the South American Monsoon System and to the interaction of the South American Convergence Zone with a strong Madden-Julian Oscillation. Finally, major conurbations, such as São Paulo and Rio de Janeiro, are large ‘heat islands’. This increases the potential for localized increased rainfall over city centers and immediately downwind of city-centers.
The South American Monsoon System (SAMS)
Monsoon systems are characterized by reversals in low-level wind direction between summer and winter months and by distinct wet and dry seasons. The changes in wind direction are prompted by heat differences between the oceans and the continents. During summer, the air over continents is warmer and more convectively unstable than air over adjacent oceanic regions. Consequently, there are low pressure systems over land and high pressure systems over water. This pressure pushes low-level moisture towards land, resulting in summer precipitation. During the winter, conditions reverse and dry conditions prevail.
This pattern of seasonal monsoons is found in eastern South America, southwest United States/Mexico, Indian subcontinent, southern China/Korea/Japan, western Sub-Saharan Africa and Northern Australia. In these regions, monsoons account for a significant proportion of the local extreme weather events.
The SAMS shows considerable variation on both daily and inter-annual timescales, which creates prolonged effects on precipitation and drought. Because of the accentuated topography near Brazil’s Southeast coast, heavy rainfall often results in disastrous flooding, loss of life, and damage to property and infrastructure. This is important to note because both Rio de Janeiro and São Paulo are under the influence of SAMS. SAMS is arguably the most important climactic feature in South America, as it is characterized by pronounced seasonality in precipitation. The main feature of SAMS is enhanced convective activity in tropical South America, which typically starts in October-November, is fully developed during December-February and retreats in late April or early May. In effect, SAMS acts as a massive conveyor belt to drop precipitation from the southern Amazon all the way southeast to the South Atlantic. This extreme low pressure system helps define austral precipitation patterns.

4 Flood and Drought Assessment of Brazil | TransRe White Paper
4
The El Niño Southern Oscillation (ENSO)
The oscillation between El Niño and La Niña conditions is now well known to the general public. In cycles of 2-5 years, El Niño delivers increased rainfall to Southeast Brazil during spring and summer. If the Intertropical Convergence Zone (ITCZ) is present, the effects are heightened beyond March and April. Southernmost Brazil experiences excessive rains. This is important because of the location of São Paulo and Rio de Janeiro. In the North, El Niño has the opposite effect, delivering extreme high temperatures and more consecutive dry days that lead to drought and fire. Northeast Brazil will continue to experience severe drought in the otherwise rainy season. The CW area will also experience drought-like weather. Figure 2 displays the different climate impacts of the El Niño phenomenon.
The South American Convergence Zone (SACZ)
SACZ is an elongated string of clouds, precipitation and convergent winds oriented in a northwest/southeast line that stretches from southeast Brazil to the Atlantic Ocean. SACZ is a monsoon trough. Right along its axis, heavy rain patterns can be found, helping form rain forests and extreme precipitation zones. SACZ is a transient system, and may not always be present during the summer. It manifests itself in alternating features in wind and precipitation (think: seesaw) between the tropics and subtropics. When it is present and highly convective, the SACZ tends to anchor between Minas Gerais and Rio de Janeiro, affecting São Paulo and Curitiba too. Being under the influence of a monsoon means that moisture and precipitation should increase during the summer. However, we find that even when SACZ is not present, SE Brazil can experience convective precipitation due to increases in moisture and heat in the atmosphere. This can be due to Madden-Julian Oscillation and South Atlantic Dipole.
Madden-Julian Oscillation (MJO)
MJO is a band of low-pressure that develops in the Indian Ocean, east of Somalia and south of India. This highly convective system travels east, dumping rain over Sri Lanka, Singapore, Malaysia, SE Asia, the Philippines and Australia before slowly dying off in the western Pacific Ocean. MJO affects weather in Brazil in two ways. First, the presence of a low pressure system elsewhere in the atmosphere can have the effect of pulling dry air into Brazil, leading to drought. Secondly, the wave can continue to travel east towards South America, but in a diminished form. This will have the effect of bringing low pressure and rainfall to Brazil. Extreme flooding events, such as the 2011 Rio de Janeiro floods, have been linked to a strong MJO interacting with an already established SACZ.

5 Flood and Drought Assessment of Brazil | TransRe White Paper
5
Figure 2: The climatological impacts of the El Niño phenomenon in South America

6 Flood and Drought Assessment of Brazil | TransRe White Paper
6
South American Dipole (SAD)
One final influencer of Brazilian weather conditions is the SAD. The term ‘dipole’ refers to the differential warming in a body of water. In this instance, it refers to the difference in sea surface temperatures (SST) between waters off western Africa and eastern South America. A ‘negative’ SAD event (negative SST anomalies along the African coast, positive SST anomalies along eastern South America) is associated with extreme precipitation patterns over eastern South America and particularly heavy rainfall over Southeastern Brazil. A ‘positive’ SAD event results in lower precipitation over Southeastern Brazil and increased precipitation over North/Northeast Brazil.
Figure 3: A Positive SAD event, showing warmer than average SSTs off Africa, and
colder than average SSTs off South America. This results in greater than average
rainfall over Africa, and less than average rainfall over Southeastern Brazil.
7 Flood and Drought Assessment of Brazil | TransRe White Paper
7
Floods and the SACZ/ENSO
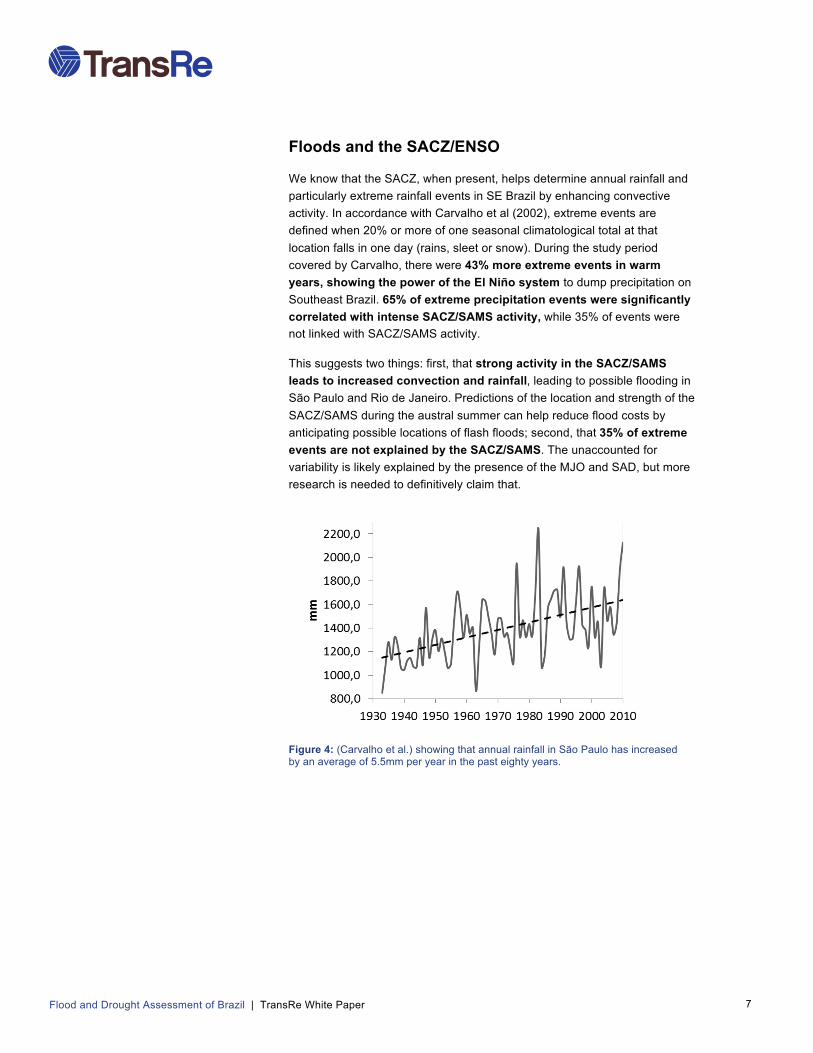
We know that the SACZ, when present, helps determine annual rainfall and particularly extreme rainfall events in SE Brazil by enhancing convective activity. In accordance with Carvalho et al (2002), extreme events are defined when 20% or more of one seasonal climatological total at that location falls in one day (rains, sleet or snow). During the study period covered by Carvalho, there were 43% more extreme events in warm years, showing the power of the El Niño system to dump precipitation on Southeast Brazil. 65% of extreme precipitation events were significantly correlated with intense SACZ/SAMS activity, while 35% of events were not linked with SACZ/SAMS activity.
This suggests two things: first, that strong activity in the SACZ/SAMS leads to increased convection and rainfall, leading to possible flooding in São Paulo and Rio de Janeiro. Predictions of the location and strength of the SACZ/SAMS during the austral summer can help reduce flood costs by anticipating possible locations of flash floods; second, that 35% of extreme events are not explained by the SACZ/SAMS. The unaccounted for variability is likely explained by the presence of the MJO and SAD, but more research is needed to definitively claim that.
Figure 4: (Carvalho et al.) showing that annual rainfall in São Paulo has increased by an average of 5.5mm per year in the past eighty years.
8 Flood and Drought Assessment of Brazil | TransRe White Paper
8
The Impact Of Climate Variation To Date Significant climate variations from the mean occur daily, weekly, monthly or annually. For human activity, the important ones are short term (day-to-day) and medium term (i.e. impact of average temperatures on growing season). Such variations from the mean occur naturally (i.e. El Niño/La Niña). They are also affected by human activity. Locally, deforestation near cities can accelerate water flow and increase flashfloods during heavy rains. Construction in flood plains magnifies economic losses. A global increase in atmospheric carbon dioxide is raising recorded earth temperatures, even if exact quantification of the correlation is still to be established.
However caused, climate variation/climate extremes are becoming more destructive. In addition to flooding and drought (see below) extreme events such as high winds, hurricanes, and storm tides are affecting Brazil in previously unforeseen ways and show climate change is not just an issue of rising temperatures: it is about intense, anomalous weather of all kinds.
Extreme Events
The table opposite summarizes the extreme weather events that have affected Brazil since 2000 and the social and economic impact of each.
Droughts - Northeast Brazil
Northeast Brazil’s dry interior (the Sertao), is tied to El Niño - rising SSTs off Peru affect atmospheric circulation to prevent precipitation, extending the dry season into a prolonged drought.
2005’s drought was considered a 1-in-100 event at the time, but 2010’s was significantly worse: the Amazon river hit 50 year lows, and 20 municipalities in Amazonas state declared states of emergency as tributaries ran dry. The Rio Negro dropped to its lowest level since records began in 1902. Wildfires spread through the rainforest. The El Niño of early summer was intensified by La Niña and reduced crop production by 30% (US$9B), damaged pastures and water supplies. 2005’s drought is now considered a 1-in-20.
Floods - Northeast Brazil
2009’s floods and mudslides were the worst in 20 years. Unusually intense rainfall was linked to a La Niña event and high SSTs in the South Atlantic that favored the formation of a low pressure belt convective belt, the Intertropical Convergence Zone (ITCZ). Hot, humid winds brought cloud masses that caused heavier than normal rainfall. The ITCZ that usually leaves the region in March persisted until May, allowing the humid low pressure system to dump rain on NE Brazil.

9 Flood and Drought Assessment of Brazil | TransRe White Paper
9
Groisman et al (2005) and Marengo et al (2009)) found increases of heavy precipitation and increases in the frequency of extreme rainfall events. Varvalho et al (2004) identified the link between extreme rainfall events and drought and the inter-annual El Niño Southern Oscillation (ENSO) in NE and SE Brazil. Changing rainfall patterns mean NE Brazil is likely to become dryer, increasing the risk of fires and reducing water resources and ultimately agriculture yields.
Other Weather Extremes – 2004 Hurricane Catarina
Hurricane Catarina was the first recorded tropical cyclone to hit Brazil and caused economic loss of US $425 million in Santa Catarina, where it made landfall. The development and landfall of Catarina surprised both forecasters and researchers alike. While large convective clusters have infrequently been identified over the South Atlantic, no satellite-era hurricane strength system had been recorded in the region. Catarina developed out of unusually favorable South Atlantic conditions: the normal high levels of vertical wind shear that inhibit the formation of such systems in the South Atlantic were not present.
Table 1: Recent Extreme flood and drought events in Brazil
10 Flood and Drought Assessment of Brazil | TransRe White Paper
10
Future Impact of Climate Variation (Projections and Predictions) Brazil will likely be subject to significant climate alterations in future, which will likely exacerbate both the frequency and severity of extreme events. A 2008 study that included 2005’s drought revised it from a 1-in-100 event to 1-in-20 and went on to project increased extreme weather frequency with rising atmospheric CO2 conditions, resulting in the same event becoming a 1-in-2 event by 2025, and then a 9-in-10 year event by 2060. Such frequent extreme droughts will severely impact agricultural production. It is important to stress that there is currently no consensus among models to show developing trends for rainfall extremes in Brazil’s various regions. Therefore we can only lay-out the potential impacts for each region:
North/Amazon Region More frequent dry spells in eastern Amazonia (conditions for increased spread of forest fires) and intense rainfalls in western Amazonia. One measure, the Standard Precipitation Index (SPI), used by Li et al (2008) showed a drop of 0.32 per decade between 1970 and 1999 for Para, Maranhao, Amazonas, Tocantins, Mato, Goias, Grosso, Rondonia states. The observed negative trend was explained by anthropogenic external forcings, rather than natural variability. This means human emissions are a contributing factor to increased dry spells, and if they continue, then the SPI will likely become more negative. If so, the Amazon region can expect more frequent and/or more intense dry events, leading to forest fires, and worsening conditions for agricultural production.
Northeast Brazil More frequent dry spells, high evaporation/low soil moisture levels to affect river and reservoir levels – possible aridification/desertification of the semiarid region. Future droughts are linked to lower precipitation in Amazon region.
Central West Brazil Higher frequency of intense rainfall events and dry spells. High evaporation rates and lower soil moisture will adversely affect agriculture and hydroelectric generation. Soil erosion due to high temperature, intense dry spells and heavy rainfall could lead to more landslides.
Southeast Brazil Higher frequency of intense rainfall events. This is significant due to Brazil’s two largest metropolitan areas, Rio de Janeiro and São Paulo. Both have multi-million populations that are growing by ~1.1% per annum. Both cities have high levels of urbanization on the mountains surrounding them. With water no longer absorbed by soils, it washes over concrete, cement and gravel to flood lower elevations, resulting in more frequent flash floods during extreme rainfall events.

11 Flood and Drought Assessment of Brazil | TransRe White Paper
11
This explains the mudslides and flooding during the 2011 São Paulo floods and the 2012 Rio floods. Flash floods are particularly destructive in São Paulo, when the Tiete River overflows and floods the surrounding areas.
Localized rain patterns in the two cities are partially explained by the ‘heat island effect’, a term used to describe how built-up areas are hotter than nearby rural areas. Urban regions form ‘islands’ of higher temperature than the surrounding areas, often 13o-16o F higher. NASA has discovered this can cause greater summer rainfall over and downwind of such heat islands, explaining extreme rain in cities but not in nearby areas.
Southern Brazil Higher frequency of intense rainfall events. Increases in rainfall and high evaporation due to dry spells can affect agriculture.
Figure 5: Projected change in precipitation by 2020, blue being dryer conditions and red being wetter conditions.
Figure 5 shows that Southern Brazil and western Amazonia are expected to see increased rainfall by 2020, while rainfall reductions are expected in southern and central Amazonia, Central West Brazil, and most of Northeast Brazil. We should see increases in the frequency of dry spells in eastern Amazonia and parts of Northeast Brazil, while the number of consecutive wet days tends to decrease in most of Northeast Brazil, Central West Brazil, and western and southern Amazonia. The frequency and intensity of extreme rainfall events should increase in Southern and Southeastern Brazil, and to a slightly lesser degree in western Amazonia and the coastal region of eastern Amazonia and northern Northeast region.

12 Flood and Drought Assessment of Brazil | TransRe White Paper
12
This suggests potential, but sporadic, flooding in these areas. Projections for 2020 show that rainfall extremes and totals tend to increase in western Amazonia and Southern and Southeastern Brazil, and every other region shows decreases in rainfall extremes. 2030 projections show reductions in total rainfall and number of wet days in tropical South America, with a tendency to the increase in rainfall extremes in western Amazonia and Southern and Southeastern Brazil. The projected reduction in rainfall extremes is consistent with the increase in projected number of consecutive dry days.
Near-term Weather Prediction (2013-2014)
The latest projections for ENSO, from the Climate Prediction Center at NOAA/NWS on September 23, 2013, suggest that we should expect ENSO-neutral conditions through to Spring 2014. From July to October 2012, above-average SSTs were evident across most of the equatorial Pacific Ocean. During January-February 2013, below-average SSTs were observed over the eastern half of the Pacific. Recently, equatorial SSTs have been near average across central/western Pacific and below average in the eastern Pacific. Across the equatorial Pacific, the low-level winds remained near average, while weak upper-level westerly anomalies persisted in the central Pacific. Convection remained high over Indonesia, and was weakly suppressed near the International Date Line. Collectively, all these atmospheric and oceanic conditions are consistent with ENSO-neutral.
Given the ENSO-neutral prediction, we can expect little to no ENSO-like effects on Brazilian weather patterns over the next few months.
Climate Indices
It is clear that the El Niño Southern Oscillation can both precipitate extreme weather events and augment the pre-existing climate to accentuate conditions. The presence of El Niño is indisputably linked to drought and forest fires in Northeast Brazil, and linked to heavy precipitation in South/Southeast Brazil.
The variability of the South American summer rainfall is an integral part of the global climate response to ENSO. Enhanced climate change shown in climate models tends to show more active hydrological activity with more precipitation on average. ENSO can act to intensify this.
A distinct monsoon system accounts for the region of rainfall from the Amazon southeast towards Rio de Janeiro and São Paulo. The MJO is also linked to drought and precipitation in tropical South America.
Comprehensive forecasts for the SAMS, SACZ and ENSO cycles can help us understand how global climate may be changing on a yearly basis.

13 Flood and Drought Assessment of Brazil | TransRe White Paper
13
Implications For Insurers (Models & Exposures) Efficient climate models require accurate simulation of ENSO, SAMS, SACZ, MJO and SAD. Current models struggle, particularly with MJO. Improving regional climate models is extremely important given the prospect of increased frequency and severity of extreme weather conditions. If the 2005 drought is already considered to be a 1-in-20 event, not the 1-in-100 originally stated, and if it becomes a 1-in-2 year event by 2025 and a 9-in-10 year event by 2060, then Brazil will suffer declines in agricultural and industrial production.
Brazil’s insurance industry must be fully prepared for the financial impact of these developments. In terms of exposure to natural disasters and vulnerability to economic disruption from weather events, Brazil is comparable to Japan. However, with an insurance penetration level of approximately 1.5% of GDP, and the likelihood that insured losses from perils such as flood will grow significantly in the near future, private insurers in Brazil must manage their exposures very carefully if they are to actively contribute to the regeneration of the economy following such events. The higher the insurance penetration, the more support insurers will provide.
How TransRe Can Make A Difference
We can help in a number of ways. We work with customers and brokers to design the right reinsurance program to protect balance sheets and income statements. We are working to understand the changes that are driving the increase in extreme weather events, and to incorporate predictive measures of ENSO, SACZ, SAMS and MJO into reinsurance calculations. The same research can be used by insurers for catastrophe mitigation training and products for local customers. The same is true for GIS mapping, to identify flood risk hot spots in São Paulo, Rio de Janeiro and across Brazil through geospatial mapping. As you consider your response to these developments, we continue to research and track the latest scientific data and its implications. We are working on GIS mapping to develop flood risk hazard maps, and we are investigating vertical wind shear in the South Atlantic Basin, a possible source of future hurricanes. Our research is then combined with work done by government and private bodies to develop more comprehensive regional climate models that incorporate all of the pertinent climate indices and all of the updated exposure risks.

14 Flood and Drought Assessment of Brazil | TransRe White Paper
14
Glossary Anthropogenic – Caused or produced by humans.
Austral – Southern (hemisphere).
Convection- vertical transport of atmospheric properties, often results in precipitation.
El Niño – Anomalously warm phase of ENSO cycle.
El Niño Southern Oscillation (ENSO) – The 2-5 year Pacific Ocean cycle between El Niño and La Niña conditions that affects 60% of global weather.
Geographic Information Systems (GIS) –to capture, store, analyze, present all types of geographical data. Used in flood risk mapping.
Hurricane Catarina – (March 2004) the first recorded tropical cyclone to hit land in the South Atlantic Basin.
Intertropical Convergence Zone (ITCZ) –circles globe near equator, where trade winds meet , causing stagnant calm weather & violent thunderstorms.
La Niña – Anomalously cold phase of ENSO cycle.
Madden-Julian Oscillation (MJO) – Major part of intraseasonal (30-90 days) variability in the tropical atmosphere. Travels east from Indian Ocean.
South Atlantic Convergence Zone (SACZ) – elongated axis of clouds and convergent winds from NW-SE. Covers southeast Brazil into the Atlantic. A monsoon trough, it brings highly convective patterns to SE Brazil.
South Atlantic Dipole (SAD) – decadel SST pattern that affects climate dynamics on South American east coast (and African west coast).
South Atlantic Monsoon System (SAMS) – The seasonal reversing wind accompanied by corresponding changes in precipitation in South America. Most distinct effects are seen in SE Brazil.
Standard Precipitation Index (SPI) – A measure of drought that uses lack of rain statistics.
Subtropical – Geographic and climate zones located between the tropic circle of latitude and the 35th parallel in each hemisphere. Subtropical regions have distinct summer wet seasons.
Urban Heat Island – Metropolitan area that is significantly warmer than its surrounding rural areas due to human activities.
Wind Shear – The rate at which wind velocity changes from point to point in a given direction. High vertical wind shear results in decreased probability of strong tropical cyclones

15 Flood and Drought Assessment of Brazil | TransRe White Paper
15
Citations
Bombardi et al. (2012). ‘Precipitation over eastern South American and the South Atlantic Sea surface temperature during neutral ENSO periods’. http://adsabs.harvard.edu/abs/2013ClDy..tmp..273B.
Silva Dias et al. (2012). ‘Changes in extreme daily rainfall for Sao Paolo, Brazil’. http://sic2011.com/sic/arq/18954207364931895420736.pdf
Carvalho et al. (2002). ‘Extreme precipitation events in Southeastern South America and Large-Scale convective patterns in the South Atlantic Convergence Zone’. http://meteo.edu.vn/dhkhtn/stores/files/0907_Tailieu_CuaLo/TLTK/Extreme%20Precipitation%20Events%20in%20Southeastern%20South%20America%20and%20Large-Scale%20Convective%20Patterns%20in%20the%20South%20Atlantic%20Convergence%20Zone.pdf
Marengo et al. sponsored by Lloyds. ‘Climate Change and Extreme Events in Brazil’. http://www.lloyds.com/~/media/lloyds/reports/360/360%20climate%20reports/fbdsreportonbrazilclimatechangeenglish.pdf\
Kunzler, M. (2011). ‘Climate Guide Change in Brazil’. http://www.breadforall.ch/fileadmin/deutsch/2_Entwicklungpolitik_allgemein/B-Klima/Guide%20CC%20Brasil_Maerz%202011_Marion%20Kuenzler.pdf
Wilby, R. sponsored by Tearfund. (2008). ‘A review of climate change scenarios for northeast Brazil’. http://www.worldwaterweek.org/documents/WWW_PDF/Resources/2009_WnC/Brazil-SS_Technical_Briefing_R_Wilby.pdf

16 Flood and Drought Assessment of Brazil | TransRe White Paper
16
Contacts
To discuss any of the contents of this paper, please contact:
James Rohman Global Catastrophe Management
T: 1 (212) 365 2438 E: [email protected]
To discuss the implications of this paper, and your reinsurance needs in response, please contact:
Javier Vijil Paulo Pereira President, Latin America General Manager, Brazil
T: 1 (786)-437-3901 T:+5521-2127-2701 E: [email protected] E: [email protected]

18 Flood and Drought Assessment of Brazil | TransRe White Paper
18
Copyright and Disclaimers The material and conclusions contained in this document are for information purposes only and the authors offer no guarantee for the completeness of its contents. The statements in this document may provide current expectations of future events based on certain assumptions. These statements involve known and unknown risks, uncertainties and other factors which are not exhaustive. The authors of this document undertake no obligation to publicly revise or update any statements, whether as a result of new information, future events or otherwise and in no event shall Transatlantic Reinsurance Company or any of its affiliates or employees be liable for any damage and financial loss arising in connection with the use of the information relating to this document.
About TransRe
TransRe is the brand name for Transatlantic Holdings, Inc. and its subsidiaries (including Transatlantic Reinsurance Company). TransRe, wholly owned by Alleghany Corporation (NYSE-Y), is a reinsurance organization headquartered in New York with operations worldwide. Since 1978, TransRe has been offering its clients the capacity, expertise and creativity necessary to structure programs across the full spectrum of property and casualty risks.
Visit www.transre.com for additional information.
© 2013 Transatlantic Reinsurance Company. All rights reserved.
Transatlantic Reinsurance Company 80 Pine Street New York, New York 10005
