flipping the switch to cleaner electricity - union of concerned
TRANSCRIPT

C h a p t e r 5 : F l i p p i n g t h e s w i t C h t o C l e a n e r e l e C t r i C i t y 63
C h a p t e r 5
Flipping the Switch to Cleaner Electricity
Electricity is an essential part of our daily lives and vital to our economy. It helps us light and cool our homes, refrigerate and cook our food, and wash and dry our clothes.
Electricity also powers our offices, schools, hospitals, and factories. In fact, we have come to take its conve-nience for granted. We expect it to be there when we flip a switch—and at an affordable price. Yet most people do not have a good understanding of where their electricity comes from, or of the impact our reliance on fossil fuels has on our climate, environ-ment, public health, and public safety—and their sig-nificant hidden costs to our economy (see Figure 5.1). The United States could greatly reduce its reliance on fossil fuels to generate electricity by moving to re-newable resources such as wind, solar, geothermal, bio-energy, and hydropower. These homegrown energy sources are available in significant quantities across America, and we can deploy them quickly. They are also increasingly cost-effective in producing electricity, and they create jobs while reducing pollution. As Chapter 4 noted, the nation has tremendous po-tential to reduce electricity use by improving the energy efficiency of our buildings and industries. However, expanding the use of renewable energy and other low-carbon technologies to generate electricity is also criti-cal if we are to avoid the most dangerous effects of global warming. The electricity sector was responsible for more than 40 percent of U.S. carbon dioxide emissions in 2007. Those emissions from power plants have grown by more than 33 percent since 1990—faster than heat-trapping emissions in any other sector of the economy, includ-ing transportation. And coal-burning power plants are the single largest source of carbon emissions, represent-ing about one-third of the U.S. total—more than those from all our cars, SUVs, trucks, trains, and ships com-bined (EIA 2008d). This chapter describes the current status and future prospects for using renewable energy and other low-
Coal48.6%
Hydro5.8%
Other Renewables
2.5%
Nuclear19.4%
Natural Gas
21.8%
Oil1.6%
Other0.3%
Figure 5.1. U.s. electricity generation by source (2007)
carbon technologies to provide a growing share of the nation’s electricity needs. The chapter highlights key challenges to achieving widespread use of these tech-nologies, and the public policies that can help us fulfill that goal.
5.1. electricity from renewable energy technologies Diverse sources of renewable energy have the technical potential to provide all the electricity the nation needs many times over. Estimates of this potential consider the availability of strong winds, sunny skies, plant resi-dues, heat from the earth, and fast-moving water throughout the United States, while accounting for some environmental and economic limits. However, such estimates do not consider conflicts over land use, the higher short-term costs of those resources, con-straints on ramping up their use such as limits on trans-mission capacity, barriers to public acceptance, and

64 U n i o n o F C o n C e r n e d s C i e n t i s t s : C l i m at e 2 0 3 0 C h a p t e r 5 : F l i p p i n g t h e s w i t C h t o C l e a n e r e l e C t r i C i t y 65
The United States currently generates nearly half of its electricity from coal, the most carbon-intensive energy source. Accelerating energy efficiency and the adoption of carbon-free renewable energy technologies such as wind and solar is needed to cut emissions and create savings from the electricity sector.
other hurdles. Those factors will limit how quickly and to what extent the nation taps the full potential of re-newable resources to produce electricity. Several renewable energy technologies are available for widespread deployment today, or are projected to become commercially ready in the next two decades. In fact, in 2007 developers installed more than 8,600 megawatts of capacity for generating electricity from renewable sources (excluding conventional hydroelec-tric power)—topping new capacity from fossil fuels for the first time (EIA 2009a). And developers installed even more capacity to produce electricity from renew-able sources in 2008. This section describes this recent progress as well as future prospects for the most prom-ising renewable energy technologies.
5.1.1. Types of Renewable Technologies
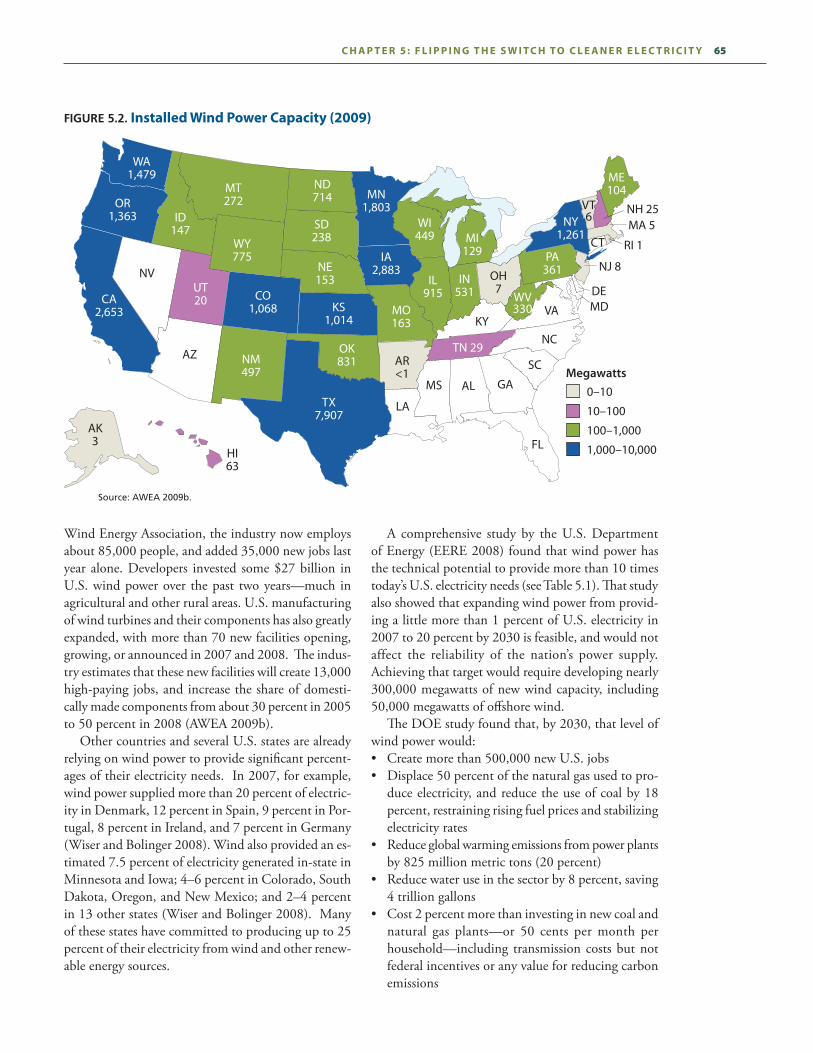
5.1.1.1. Wind PowerWind turbines convert the force of moving air into electricity. Like an airplane, the wind turns the blades using lift. Most modern wind turbines have three blades rotating around a horizontal axis. Smaller wind tur-bines used by homes, farms, and businesses range in size from a few hundred watts to 100 kilowatts or more. Larger wind turbines used for utility-scale generation range in size from about 500 kilowatts to more than three megawatts, have blades up to 52 meters long, and are mounted on towers up to 100 meters high. Wind power is one of the most rapidly growing sources of electricity in the world—having increased by about 30 percent per year, on average, over the past decade (GWEC 2008). Developers installed more wind power over the past two years than in the previous 20. In 2008 the United States surpassed Germany to be-come the global leader in installed wind capacity, fol-lowed by Spain, India, and China. U.S. wind capacity grew by a record 5,250 megawatts in 2007, and 8,545 megawatts in 2008. This represented 42 percent of all new capacity for generating electricity in the country (AWEA 2009a). As of March 2009, the United States had more than 28,000 megawatts of wind power capacity in 36 states (see Figure 5.2). Texas (7,900 megawatts) and Iowa (2,900 megawatts) have surpassed California (2,600 megawatts) to become the national leaders, followed by Minnesota, Washington, Colorado, Oregon, New York, and Kansas, which have more than 1,000 mega-watts each (AWEA 2009b). Wind power has been one of the bright spots in the struggling U.S. economy. According to the American
Renewable energy can create more jobs than fossil fuels because a larger share of renewable energy expenditures go to manufacturing, installation, and maintenance—all of which are typically more labor-intensive than mining and transporting fossil fuels. The U.S. wind industry created 35,000 jobs in 2008 alone.
64 U n i o n o F C o n C e r n e d s C i e n t i s t s : C l i m at e 2 0 3 0 C h a p t e r 5 : F l i p p i n g t h e s w i t C h t o C l e a n e r e l e C t r i C i t y 65
Wind Energy Association, the industry now employs about 85,000 people, and added 35,000 new jobs last year alone. Developers invested some $27 billion in U.S. wind power over the past two years—much in agricultural and other rural areas. U.S. manufacturing of wind turbines and their components has also greatly expanded, with more than 70 new facilities opening, growing, or announced in 2007 and 2008. The indus-try estimates that these new facilities will create 13,000 high-paying jobs, and increase the share of domesti-cally made components from about 30 percent in 2005 to 50 percent in 2008 (AWEA 2009b). Other countries and several U.S. states are already relying on wind power to provide significant percent-ages of their electricity needs. In 2007, for example, wind power supplied more than 20 percent of electric-ity in Denmark, 12 percent in Spain, 9 percent in Por-tugal, 8 percent in Ireland, and 7 percent in Germany (Wiser and Bolinger 2008). Wind also provided an es-timated 7.5 percent of electricity generated in-state in Minnesota and Iowa; 4–6 percent in Colorado, South Dakota, Oregon, and New Mexico; and 2–4 percent in 13 other states (Wiser and Bolinger 2008). Many of these states have committed to producing up to 25 percent of their electricity from wind and other renew-able energy sources.
A comprehensive study by the U.S. Department of Energy (EERE 2008) found that wind power has the technical potential to provide more than 10 times today’s U.S. electricity needs (see Table 5.1). That study also showed that expanding wind power from provid-ing a little more than 1 percent of U.S. electricity in 2007 to 20 percent by 2030 is feasible, and would not affect the reliability of the nation’s power supply. Achieving that target would require developing nearly 300,000 megawatts of new wind capacity, including 50,000 megawatts of offshore wind. The DOE study found that, by 2030, that level of wind power would:• Create more than 500,000 new U.S. jobs• Displace 50 percent of the natural gas used to pro-
duce electricity, and reduce the use of coal by 18 percent, restraining rising fuel prices and stabilizing electricity rates
• Reduce global warming emissions from power plants by 825 million metric tons (20 percent)
• Reduce water use in the sector by 8 percent, saving 4 trillion gallons
• Cost 2 percent more than investing in new coal and natural gas plants—or 50 cents per month per household—including transmission costs but not federal incentives or any value for reducing carbon emissions
Figure 5.2. installed wind power Capacity (2009)
ME104
NH 25VT6
MA 5NY1,261
PA361 NJ 8
WV330
TN 29
OH7
MI129
WI449
IN531
IL915
AR<1
MO163
IA2,883
MN1,803
ND714
SD238
NE153
KS1,014
OK831
TX7,907
CO1,068
WY775
MT272
ID147
WA1,479
OR1,363
UT20CA
2,653
AK3
HI63
0–10
10–100
100–1,000
1,000–10,000
Megawatts
CT RI 1
DEMDVA
NC
SC
GA
FL
ALMS
KY
NM497
NV
AZ
LA
Source: AWEA 2009b.

66 U n i o n o F C o n C e r n e d s C i e n t i s t s : C l i m at e 2 0 3 0 C h a p t e r 5 : F l i p p i n g t h e s w i t C h t o C l e a n e r e l e C t r i C i t y 67
Children’s tales don’t often figure in grown-up discus-sions of energy policy, but Denmark’s progress in
tapping wind energy is reminiscent of The Little Engine That Could. Denmark’s story begins in 1973, the year OpeC (the Organization of petroleum exporting Countries) embar-goed oil exports, creating debilitating shortages and sky-rocketing prices. at that time Denmark relied on oil to produce 80 percent of its electricity. For the next few
Box 5.1.
heat-and-power plants to provide both electricity and heat. the primary power plant serving Copenhagen, for example, boasts an efficiency of more than 90 percent, compared with an average efficiency rate of 33 percent for a typical U.S. coal plant (Freese, Clemmer, and Nogee 2008). Denmark fostered renewable energy as well, and today renewables supply 27 percent of the country’s electricity—most of it from wind (Ministry of Climate and energy 2008). With fewer than 70 wind turbines in 1980, the nation now has more than 5,000 providing 3,135
s U C C e s s s t o r y
The Little Country that Could
Turbines located in the high-speed wind areas off the coast of Denmark generate large amounts of electricity.
Domestic investment in wind
has made Denmark a global
leader in turbine manufacturing.
The industry accounts for roughly
20,000 jobs in Denmark—and
4 percent of its industrial
production.
years that country, much like the United States and other developed nations, invested in energy efficiency and al-ternative energy to prevent such a situation from occur-ring again. When oil prices plummeted in the 1980s, however, the Danish and U.S. governments responded very differ-ently. the United States stopped developing approaches to reducing its dependence on oil, but the Danish gov-ernment continued to encourage the development of new energy sources and nascent technologies. Denmark reaps the benefits today as a net exporter of energy— a high percentage of which is carbon-free. Denmark relied on a suite of policies to transform its economy into a much leaner, greener, and more secure one. although it expanded development of conventional fuels off its coasts, Denmark focused principally on reduc-ing demand for electricity and heat. the country stepped up its energy efficiency by insulating existing buildings, enacting stringent codes for new buildings and appli-ances, and relying on highly efficient combined-

66 U n i o n o F C o n C e r n e d s C i e n t i s t s : C l i m at e 2 0 3 0 C h a p t e r 5 : F l i p p i n g t h e s w i t C h t o C l e a n e r e l e C t r i C i t y 67
megawatts of capacity—enough to power more than 1.6 million typical american households (DWea 2009). Consistent, long-term policies encouraging the development of wind energy helped Den-mark become a global leader. the government spurred investment in wind power by providing incentives that covered 30 percent of the costs of installing turbines until 1990. Denmark also required utilities to buy wind power at a fixed price until 1999. although at that point the coun-try required customers to pay any added costs of wind power, the government mandated that utilities provide 10-year fixed-rate contracts for wind developers, which helped them secure investment financing. Wind power also benefit-ed from priority access to the electricity grid (GaO 2006). this energy transformation helped Denmark expand its economy while reducing carbon emissions. Domestic investment in wind has made Denmark a global leader in turbine manu-facturing. Vestas and Siemens Wind power domi-nate global wind sales, and the industry accounts for roughly 20,000 jobs in Denmark—and 4 per-cent of its industrial production. While the econ-omy has grown by roughly 75 percent in 25 years, energy consumption has remained stable, and the country has cut its carbon emissions in half since 1980 (Danish energy agency 2008; Ministry of Climate and energy 2008). although Denmark is obviously much small-er than the United States, and its energy needs are much lower, the Danes have proved beyond a doubt that national foresightedness and per-severance—combined with smart policies and industrial innovation—can produce an extraor-dinary shift in a country’s energy profile. the United States could learn much from the exam-ple of “the little country that could”—and did!
Wind power can provide an important economic boost to farmers. Large wind turbines typically use less than half an acre of land, including access roads, so farmers can continue to plant crops and graze livestock right up to the base of the turbines (as shown on this Trimont, MN, farm).
Growing interest in wind power is evident in the fact that at the end of 2007, developers of more than 225,000 megawatts of wind power capacity were seeking to connect with the transmission grid in 11 regions (Wiser and Bolinger 2008). This represents nine times the nation’s installed wind capacity, roughly half of all generating capacity in transmission queues, and twice as much capacity as natural gas, the next-largest resource. Although many of these projects may not be built, many are in the planning phase. While developers have so far sited all U.S. wind projects on land, they have shown considerable inter-est in developing offshore wind. At the end of 2007, seven U.S. states had seen active proposals for install-ing nearly 1,700 megawatts of offshore wind power (see Table 5.2). Developers are proposing to build most of these facilities off the Atlantic coast in the North-east, close to population centers, where power is most needed. However, projects are also being considered off the Southeast and Texas coasts, and in the Great Lakes (Wiser and Bolinger 2008).
68 U n i o n o F C o n C e r n e d s C i e n t i s t s : C l i m at e 2 0 3 0 C h a p t e r 5 : F l i p p i n g t h e s w i t C h t o C l e a n e r e l e C t r i C i t y 69
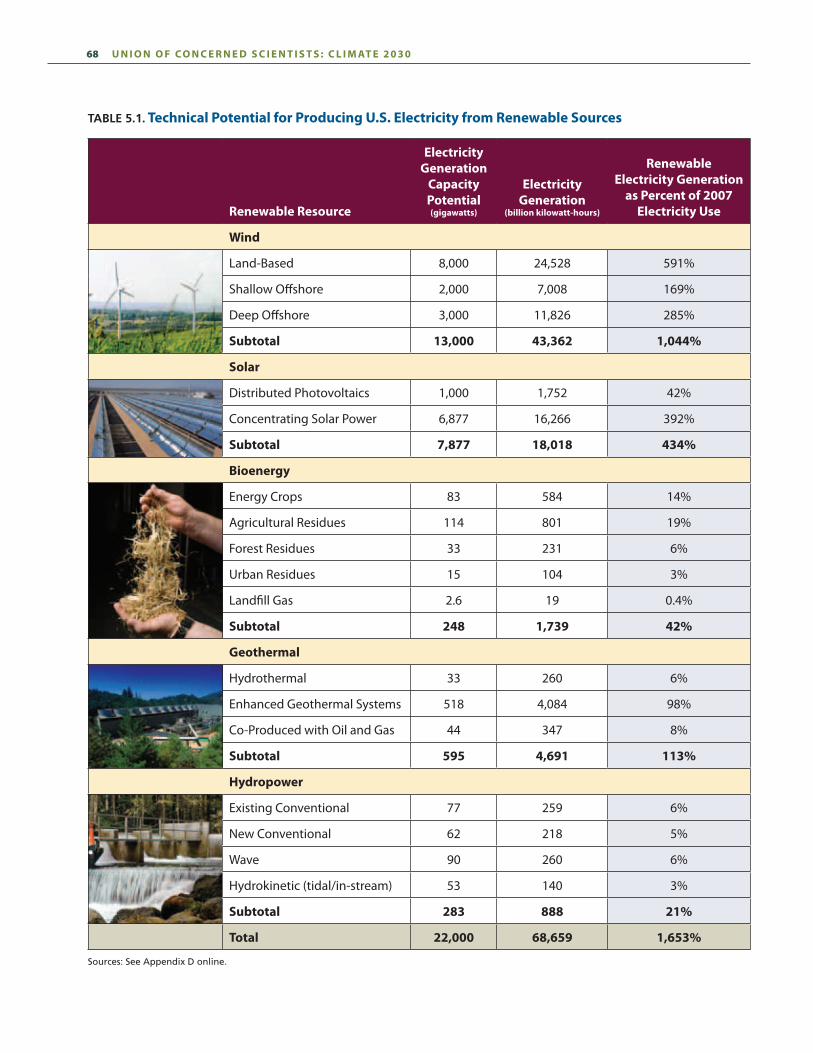
TaBle 5.1. technical potential for producing U.s. electricity from renewable sources
renewable resource
electricity generation
Capacity potential (gigawatts)
electricity generation
(billion kilowatt-hours)
renewable electricity generation
as percent of 2007 electricity Use
wind
Land-Based 8,000 24,528 591%
Shallow Offshore 2,000 7,008 169%
Deep Offshore 3,000 11,826 285%
subtotal 13,000 43,362 1,044%
solar
Distributed photovoltaics 1,000 1,752 42%
Concentrating Solar power 6,877 16,266 392%
subtotal 7,877 18,018 434%
Bioenergy
energy Crops 83 584 14%
agricultural residues 114 801 19%
Forest residues 33 231 6%
Urban residues 15 104 3%
Landfill Gas 2.6 19 0.4%
subtotal 248 1,739 42%
geothermal
hydrothermal 33 260 6%
enhanced Geothermal Systems 518 4,084 98%
Co-produced with Oil and Gas 44 347 8%
subtotal 595 4,691 113%
hydropower
existing Conventional 77 259 6%
New Conventional 62 218 5%
Wave 90 260 6%
hydrokinetic (tidal/in-stream) 53 140 3%
subtotal 283 888 21%
total 22,000 68,659 1,653%
Sources: See Appendix D online.

68 U n i o n o F C o n C e r n e d s C i e n t i s t s : C l i m at e 2 0 3 0 C h a p t e r 5 : F l i p p i n g t h e s w i t C h t o C l e a n e r e l e C t r i C i t y 69
5.1.1.2. Solar PowerOur analysis included two main technologies for using solar power to supply electricity: photovoltaics (PV) and concentrating solar power (CSP). Both have been used to generate electricity for decades, though recent techno-logical improvements and strong policy incentives have dramatically accelerated their growth. In 2007, global PV installations expanded by 62 percent from the previous year (Solarbuzz 2008). And after two decades of very little activity, the CSP market is also quickly gaining steam. Photovoltaics, or solar cells, use semiconducting materials to convert direct sunlight to electricity. Most PV cells are made with silicon, the same material used to manu-facture computer chips, although manufacturers are using new materials to make some PV cells. PV cells are often used in rooftop solar energy systems, and to power remote, off-grid applications. However, power producers have also recently shown interest in developing multi-megawatt PV projects that would connect to the transmission grid. CSP typically works by concentrating direct sunlight on a fluid-filled receiver. This heated fluid then drives a turbine to produce electricity. CSP is most often used in large, utility-scale plants that are far from urban areas yet connected to the transmission grid. Most existing CSP plants rely on curved (parabolic) mirrors to focus solar radiation. However, a number of companies are develop-ing large CSP plants that use “power towers” to collect solar energy from ground-mounted heliostats—or slightly curved mirrors—and concentrate solar radiation on distributed receivers. The technical potential of U.S. solar power is huge. PV panels installed on less than 1 percent of the U.S. land
TaBle 5.2. proposed U.s. offshore wind projects (2007)
stateproposed Capacity
(megawatts)
Massachusetts 783
New Jersey 350
Delaware 200
New York 160
texas 150
Ohio 20
rhode Island 20
Georgia 10
total 1,693 mw
area could generate the equivalent of the country’s entire annual electricity needs, as could CSP plants covering a 100-square-mile area. The southwestern United States—with its arid deserts and minimal cloud cover—is home to some of the world’s best solar resources. The National Renewable Energy Laboratory (NREL) estimates that CSP has the potential to generate 7,000 giga-watts of electricity in the Southwest—after screen-ing out urban centers, national parks, other protected areas, and lands with slopes greater than 1 percent (SETP 2007). This potential is roughly 10 times the nation’s entire current capacity to generate electric-ity. NREL also identified optimal locations for 200 gigawatts of CSP, taking into account proximity to existing transmission lines, and estimated that the nation could build as much as 80 gigawatts of CSP capacity by 2030 (see Figure 5.3). Although the United States lags behind other countries in tapping CSP, the industry is poised for significant growth because of new state and federal policies. In the Economic Stimulus Package of Oc-tober 2008 Congress extended the 30 percent invest-ment tax credit for solar energy projects for eight years. Several states have also adopted renewable electricity standards and financial incentives to ex-pand the share of solar in their electricity mix. And several utilities have signed contracts to develop
Homes that use solar panels and energy efficiency are not only sustainable but also affordable. The Make It Right project (www.makeitrightnola.org), which is helping to rebuild New Orleans homes destroyed by Hurricane Katrina, showcases designs that put low electricity bills within everyone’s reach.
Note: The 450 megawatt project in Delaware was reduced to 200 megawatts and a 20 megawatt project in Rhode Island was added.
Source: Wiser and Bolinger 2008.

70 U n i o n o F C o n C e r n e d s C i e n t i s t s : C l i m at e 2 0 3 0 C h a p t e r 5 : F l i p p i n g t h e s w i t C h t o C l e a n e r e l e C t r i C i t y 71
The world’s third largest solar power plant sits in the Nevada desert, generating clean electricity.
deserts have long been imagined as hot and deso-late landscapes—but their reputations have been
burnished recently. Deserts are now more likely to be appreciated as unique and often surprisingly diverse environments. approximately 40 miles southeast of Las Vegas, the desert does indeed hold a most surprising find: a power plant generating electricity from the sun. When most people think of solar energy, images of photovoltaic panels on rooftops come to mind. But there is another kind: concentrated solar power (CSp), which uses mirrors to collect and transform the heat of the sun into steam, which spins a generator. CSp’s rela-tively simple approach enables it to produce renew-able electricity on a scale comparable to conventional coal and natural gas plants. the third largest solar power plant in the world—and the largest CSp plant in the United States— was built outside Boulder City, NV, in June 2007. the Nevada Solar One plant uses 760 long, tubular mirrors (or parabolic troughs) to concentrate the sun’s energy on solar receivers.40 the receivers heat a mineral oil fluid to 734°F, which turns water into steam that powers a turbine to generate electricity. the solar re-ceivers track the sun’s movement, allowing the facility to produce electricity during all of the hours in which the sun is brightest. the solar fields themselves occupy an area roughly the size of 200 football fields. the plant’s maximum capacity is 75 megawatts, and it generates about 134 million kilowatt-hours of electricity each year—enough to power the lights, appliances, and electronics in 14,000 average U.S. homes. this near-zero-carbon electri-city reduces global warming emissions by an amount equivalent to taking 20,000 cars off the road each year. CSp is now sparking a lot of attention. Interest is es-pecially high in the desert Southwest, which contains large open spaces and some of the world’s best solar resources. this area is also close to some of the coun-try’s largest and fastest-growing population centers. as of July 2008, the federal Bureau of Land Management
Box 5.2.
had received 125 applications to develop large-scale solar facilities on public lands (eIa 2008). In California alone, developers have proposed more than 3,500 megawatts of CSp projects, which are now under regu-latory review (CeC 2008a). another piece of good news is that the construc-tion of CSp plants creates good jobs. estimates suggest that every 100 megawatts of installed CSp capacity creates 455 temporary construction jobs (Stoddard, abiecunas, and O’Connell 2006). the Nevada One facil-ity, for example, provided over 800 construction jobs for about 17 months, and now permanently employs approximately 30 people (aCCIONa 2009). as with any renewable energy technology, CSp must be built in an environmentally responsible man-ner. Because many CSp projects are sited in desert areas, developers must avoid disrupting the natural habitats of unique desert plants and animals, and min-imize the water used for cooling. But if careful policies guide environmentally responsible CSp development, our deserts may continue to be surprising places—where catclaw acacia and solar power plants alike delight the occasional visitor.
s U C C e s s s t o r y
Surprises in the Desert
40 TheNevadaplantisownedbyACCIONASolarPower,asubsidiaryofACCIONAEnergy.HeadquarteredinMadrid,Spain,thisenergycompanydevelopsandmanagesrenewableenergyplantsandinfrastructureprojectsthroughouttheworld.

70 U n i o n o F C o n C e r n e d s C i e n t i s t s : C l i m at e 2 0 3 0 C h a p t e r 5 : F l i p p i n g t h e s w i t C h t o C l e a n e r e l e C t r i C i t y 71
Figure 5.3. the potential of Concentrating solar power
8.0–8.27.5–8.07.0–7.56.5–7.06.0–5.5
Direct Normal Solar Radiation (kWh/m2/day)
Transmission Lines
Note: Potentially sensitive environmental lands, major urban areas, water features, areas with slope > 3%, and remaining areas less than 1 sq. km were excluded to identify those areas with the greatest potential for development.
Source: NREL, July 2007.
both distributed and large-scale solar projects. For ex-ample, utilities in California and Arizona have con-tracted for enough new CSP projects to more than triple existing global capacity. The U.S. solar energy industry employs more than 80,000 people and created more than 15,000 jobs in the last two years. One recent study estimates that the industry will create 440,000 permanent jobs and spur $325 billion in private investment by 2016, given the federal investment tax credit (Navigant 2008).
5.1.1.3. Geothermal EnergyGeothermal energy—heat from the earth—can be used to heat and cool buildings directly, or to produce elec-tricity in power plants. Almost all existing geothermal power plants use hot water and steam from hydrother-mal reservoirs in the earth’s crust to drive electric gen-erators. These plants rely on holes drilled into the rock to more effectively capture the hot water and steam. Much like power plants that run on coal and natural gas, geo-thermal plants can supply electricity around the clock. More than 8,900 megawatts of geothermal capacity in 24 countries now produce enough electricity to meet
the annual needs of nearly 12 million typical U.S. households (GEA 2008a). Geothermal plants produce 25 percent or more of the electricity produced in the Philippines, Iceland, and El Salvador. The United States has more geothermal capacity than any other country, with nearly 3,000 megawatts in seven western states. About two-thirds of this capacity is in California, where 43 geothermal plants provide nearly 5 percent of the state’s electricity (CEC 2008). While geothermal now provides only 0.4 percent of U.S. electricity, it has the potential to play a much larger role—thereby reducing carbon emissions and moving the nation toward a cleaner, more sustainable energy system. In its first comprehensive assessment in more than 30 years, the U.S. Geological Survey (USGS) esti-mated that conventional hydrothermal sources on pri-vate and accessible public lands across 13 western states have the potential capacity to produce 8,000–73,000 megawatts, with a mean estimate of 33,000 megawatts (Williams et al. 2008). State and federal policies are likely to spur developers to tap some of this potential in the next few years. The Geothermal Energy Associa-tion estimates that 103 projects now under development
72 U n i o n o F C o n C e r n e d s C i e n t i s t s : C l i m at e 2 0 3 0 C h a p t e r 5 : F l i p p i n g t h e s w i t C h t o C l e a n e r e l e C t r i C i t y 73
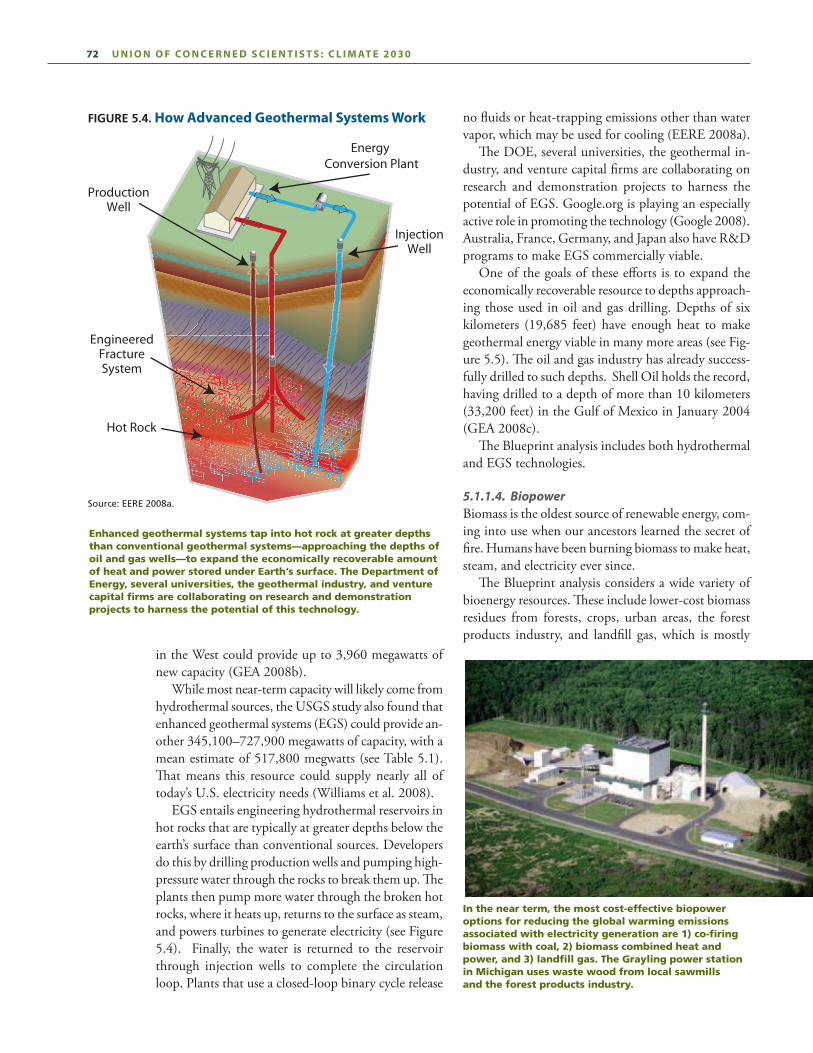
in the West could provide up to 3,960 megawatts of new capacity (GEA 2008b). While most near-term capacity will likely come from hydrothermal sources, the USGS study also found that enhanced geothermal systems (EGS) could provide an-other 345,100–727,900 megawatts of capacity, with a mean estimate of 517,800 megwatts (see Table 5.1). That means this resource could supply nearly all of today’s U.S. electricity needs (Williams et al. 2008). EGS entails engineering hydrothermal reservoirs in hot rocks that are typically at greater depths below the earth’s surface than conventional sources. Developers do this by drilling production wells and pumping high-pressure water through the rocks to break them up. The plants then pump more water through the broken hot rocks, where it heats up, returns to the surface as steam, and powers turbines to generate electricity (see Figure 5.4). Finally, the water is returned to the reservoir through injection wells to complete the circulation loop. Plants that use a closed-loop binary cycle release
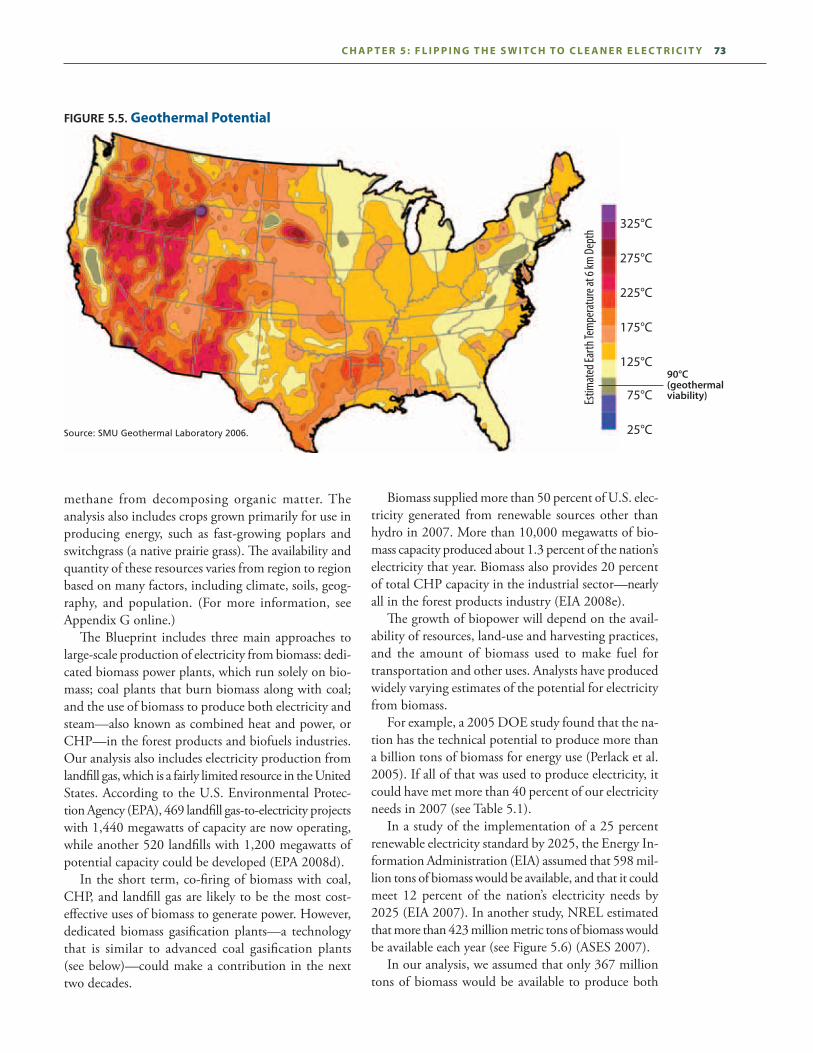
no fluids or heat-trapping emissions other than water vapor, which may be used for cooling (EERE 2008a). The DOE, several universities, the geothermal in-dustry, and venture capital firms are collaborating on research and demonstration projects to harness the potential of EGS. Google.org is playing an especially active role in promoting the technology (Google 2008). Australia, France, Germany, and Japan also have R&D programs to make EGS commercially viable. One of the goals of these efforts is to expand the economically recoverable resource to depths approach-ing those used in oil and gas drilling. Depths of six kilometers (19,685 feet) have enough heat to make geothermal energy viable in many more areas (see Fig-ure 5.5). The oil and gas industry has already success-fully drilled to such depths. Shell Oil holds the record, having drilled to a depth of more than 10 kilometers (33,200 feet) in the Gulf of Mexico in January 2004 (GEA 2008c). The Blueprint analysis includes both hydrothermal and EGS technologies.
5.1.1.4. Biopower Biomass is the oldest source of renewable energy, com-ing into use when our ancestors learned the secret of fire. Humans have been burning biomass to make heat, steam, and electricity ever since. The Blueprint analysis considers a wide variety of bioenergy resources. These include lower-cost biomass residues from forests, crops, urban areas, the forest products industry, and landfill gas, which is mostly
Energy Conversion Plant
InjectionWell
Hot Rock
ProductionWell
EngineeredFractureSystem
Figure 5.4. how advanced geothermal systems work
Source: EERE 2008a.
In the near term, the most cost-effective biopower options for reducing the global warming emissions associated with electricity generation are 1) co-firing biomass with coal, 2) biomass combined heat and power, and 3) landfill gas. The Grayling power station in Michigan uses waste wood from local sawmills and the forest products industry.
Enhanced geothermal systems tap into hot rock at greater depths than conventional geothermal systems—approaching the depths of oil and gas wells—to expand the economically recoverable amount of heat and power stored under Earth’s surface. The Department of Energy, several universities, the geothermal industry, and venture capital firms are collaborating on research and demonstration projects to harness the potential of this technology.
72 U n i o n o F C o n C e r n e d s C i e n t i s t s : C l i m at e 2 0 3 0 C h a p t e r 5 : F l i p p i n g t h e s w i t C h t o C l e a n e r e l e C t r i C i t y 73
Figure 5.5. geothermal potential
Estim
ated E
arth
Tem
perat
ure a
t 6 km
Dep
th
Source: SMU Geothermal Laboratory 2006.
325°C
275°C
225°C
175°C
125°C
75°C
25°C
90°C (geothermal viability)
methane from decomposing organic matter. The analysis also includes crops grown primarily for use in producing energy, such as fast-growing poplars and switchgrass (a native prairie grass). The availability and quantity of these resources varies from region to region based on many factors, including climate, soils, geog-raphy, and population. (For more information, see Appendix G online.) The Blueprint includes three main approaches to large-scale production of electricity from biomass: dedi-cated biomass power plants, which run solely on bio-mass; coal plants that burn biomass along with coal; and the use of biomass to produce both electricity and steam—also known as combined heat and power, or CHP—in the forest products and biofuels industries. Our analysis also includes electricity production from landfill gas, which is a fairly limited resource in the United States. According to the U.S. Environmental Protec-tion Agency (EPA), 469 landfill gas-to-electricity projects with 1,440 megawatts of capacity are now operating, while another 520 landfills with 1,200 megawatts of potential capacity could be developed (EPA 2008d). In the short term, co-firing of biomass with coal, CHP, and landfill gas are likely to be the most cost- effective uses of biomass to generate power. However, dedicated biomass gasification plants—a technology that is similar to advanced coal gasification plants (see below)—could make a contribution in the next two decades.
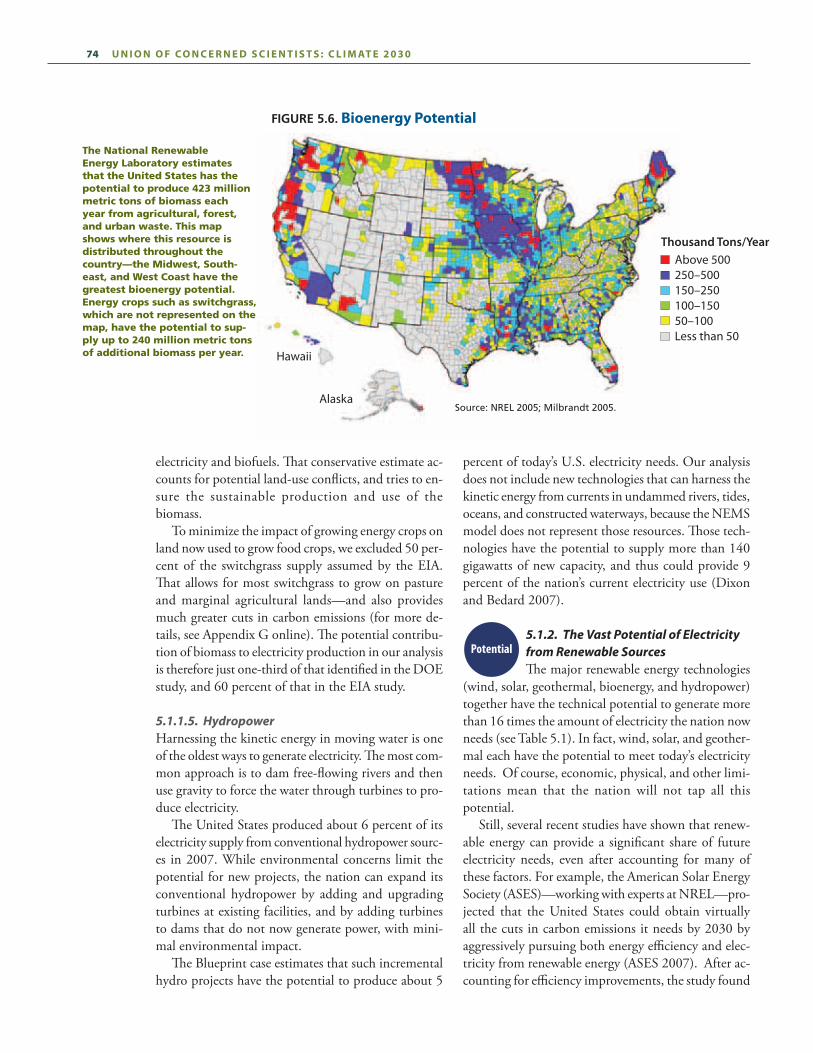
Biomass supplied more than 50 percent of U.S. elec-tricity generated from renewable sources other than hydro in 2007. More than 10,000 megawatts of bio-mass capacity produced about 1.3 percent of the nation’s electricity that year. Biomass also provides 20 percent of total CHP capacity in the industrial sector—nearly all in the forest products industry (EIA 2008e). The growth of biopower will depend on the avail-ability of resources, land-use and harvesting practices, and the amount of biomass used to make fuel for transportation and other uses. Analysts have produced widely varying estimates of the potential for electricity from biomass. For example, a 2005 DOE study found that the na-tion has the technical potential to produce more than a billion tons of biomass for energy use (Perlack et al. 2005). If all of that was used to produce electricity, it could have met more than 40 percent of our electricity needs in 2007 (see Table 5.1). In a study of the implementation of a 25 percent renewable electricity standard by 2025, the Energy In-formation Administration (EIA) assumed that 598 mil-lion tons of biomass would be available, and that it could meet 12 percent of the nation’s electricity needs by 2025 (EIA 2007). In another study, NREL estimated that more than 423 million metric tons of biomass would be available each year (see Figure 5.6) (ASES 2007). In our analysis, we assumed that only 367 million tons of biomass would be available to produce both
74 U n i o n o F C o n C e r n e d s C i e n t i s t s : C l i m at e 2 0 3 0 C h a p t e r 5 : F l i p p i n g t h e s w i t C h t o C l e a n e r e l e C t r i C i t y 75
Figure 5.6. Bioenergy potential
above 500250–500150–250100–15050–100Less than 50
Thousand Tons/Year
hawaii
alaskaSource: NREL 2005; Milbrandt 2005.
electricity and biofuels. That conservative estimate ac-counts for potential land-use conflicts, and tries to en-sure the sustainable production and use of the biomass. To minimize the impact of growing energy crops on land now used to grow food crops, we excluded 50 per-cent of the switchgrass supply assumed by the EIA. That allows for most switchgrass to grow on pasture and marginal agricultural lands—and also provides much greater cuts in carbon emissions (for more de-tails, see Appendix G online). The potential contribu-tion of biomass to electricity production in our analysis is therefore just one-third of that identified in the DOE study, and 60 percent of that in the EIA study.
5.1.1.5. HydropowerHarnessing the kinetic energy in moving water is one of the oldest ways to generate electricity. The most com-mon approach is to dam free-flowing rivers and then use gravity to force the water through turbines to pro-duce electricity. The United States produced about 6 percent of its electricity supply from conventional hydropower sourc-es in 2007. While environmental concerns limit the potential for new projects, the nation can expand its conventional hydropower by adding and upgrading turbines at existing facilities, and by adding turbines to dams that do not now generate power, with mini-mal environmental impact. The Blueprint case estimates that such incremental hydro projects have the potential to produce about 5
percent of today’s U.S. electricity needs. Our analysis does not include new technologies that can harness the kinetic energy from currents in undammed rivers, tides, oceans, and constructed waterways, because the NEMS model does not represent those resources. Those tech-nologies have the potential to supply more than 140 gigawatts of new capacity, and thus could provide 9 percent of the nation’s current electricity use (Dixon and Bedard 2007).
5.1.2. The Vast Potential of Electricity from Renewable SourcesThe major renewable energy technologies
(wind, solar, geothermal, bioenergy, and hydropower) together have the technical potential to generate more than 16 times the amount of electricity the nation now needs (see Table 5.1). In fact, wind, solar, and geother-mal each have the potential to meet today’s electricity needs. Of course, economic, physical, and other limi-tations mean that the nation will not tap all this potential. Still, several recent studies have shown that renew-able energy can provide a significant share of future electricity needs, even after accounting for many of these factors. For example, the American Solar Energy Society (ASES)—working with experts at NREL—pro-jected that the United States could obtain virtually all the cuts in carbon emissions it needs by 2030 by aggressively pursuing both energy efficiency and elec-tricity from renewable energy (ASES 2007). After ac-counting for efficiency improvements, the study found
The National Renewable Energy Laboratory estimates that the United States has the potential to produce 423 million metric tons of biomass each year from agricultural, forest, and urban waste. This map shows where this resource is distributed throughout the country—the Midwest, South-east, and West Coast have the greatest bioenergy potential. Energy crops such as switchgrass, which are not represented on the map, have the potential to sup-ply up to 240 million metric tons of additional biomass per year.
Potential

74 U n i o n o F C o n C e r n e d s C i e n t i s t s : C l i m at e 2 0 3 0 C h a p t e r 5 : F l i p p i n g t h e s w i t C h t o C l e a n e r e l e C t r i C i t y 75
that a diverse mix of renewable energy technologies could provide about 50 percent of the remaining U.S. electricity needs by 2030. A follow-up analysis found that the savings on en-ergy bills from energy efficiency would more than off-set the estimated $30 billion that renewable energy would cost under this scenario. The result would be net savings of more than $80 billion per year (Kutscher 2008). That study might well have underestimated the resulting cuts in heat-trapping emissions, because it did not consider all the options for producing electricity from renewable sources, or technologies for storing electricity other than solar thermal. More than 20 comprehensive analyses over the past decade have found that using renewable sources to pro-vide up to 25 percent of U.S. electricity needs is both achievable and affordable (Nogee, Deyette, and Clem-mer 2007). For example, a 2009 Union of Concerned Scientists study—using the same modified version of the EIA’s NEMS model that we used for the Blue-print—found that a national renewable electricity stan-dard of 25 percent by 2025 would lower electricity and natural gas bills in all 50 states, by reducing demand for fossil fuels and increasing competition among power producers (UCS 2009). Cumulative national savings to consumers and businesses would total $95 billion by 2030. A 2009 EIA study arrived at similar conclusions, despite using more pessimistic assumptions about the viability of renewable energy technologies. That study projected that a renewable electricity standard of 25 percent by 2025 would lower consumer natural gas bills slightly—offsetting slightly higher electricity bills (EIA 2009b). By 2030, the impact on consumers’ cumu-lative electricity and natural gas bills under two dif- ferent scenarios would range from a small cost of $8.4 billion (0.2 percent) to a slight savings of $2.5 bil-
The United States has more geothermal capacity than any other country, with nearly 3,000 megawatts in seven western states. Projects like the Geysers in California are harnessing only a small fraction of a much larger U.S. potential.
lion (0.1 percent). Similarly, a 2007 EIA study of a 25 percent by 2025 renewable electricity standard found $2 billion in cumulative savings on combined electric-ity and natural gas bills through 2030 (EIA 2007). These studies have also shown that renewable energy can make a significant contribution to U.S. electricity needs while maintaining the reliability of the nation’s electricity supply. The EIA and UCS analyses project that renewable technologies that operate around the clock—such as biomass, geothermal, landfill gas, and incremental hydroelectric plants—would generate 33–66 percent of the nation’s electricity under a national renewable electricity standard. Regional systems for transmitting electricity could easily integrate the remaining power produced from wind and solar at a very modest cost, and without stor-ing the power. Studies by U.S. and European utilities have found that reliance on wind energy for as much as 25 percent of electricity needs would add no more than five dollars per megawatt-hour—or less than 10 percent—in grid integration costs to the wholesale cost of wind (Holttinen et al. 2007).
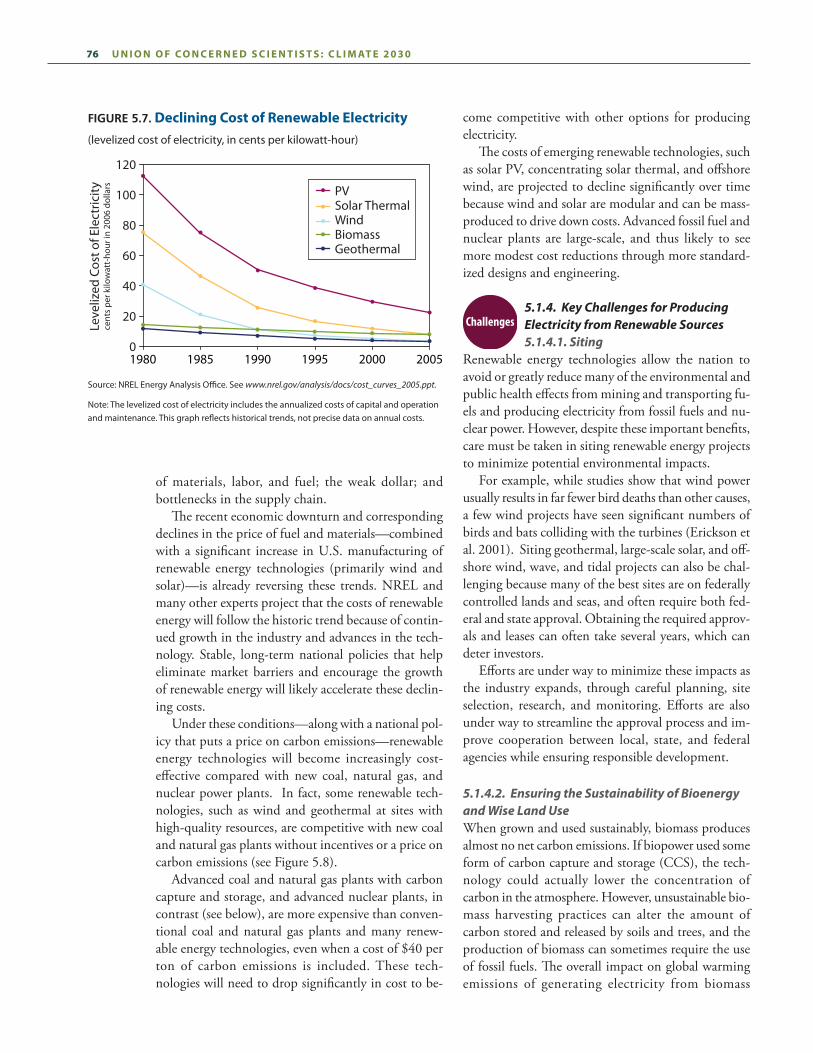
5.1.3. Costs of Producing Electricity from Renewable SourcesAn analysis by NREL shows that the costs
of wind, solar, and geothermal technologies fell by 50–90 percent between 1980 and 2005 (see Figure 5.7). The main drivers of these drops were advances in tech-nology, and growing volumes and economies of scale in manufacturing, building, and operating these plants—spurred by government policies and funding for R&D. Despite these important gains, the costs of most re-newable and conventional energy technologies rose over the past few years. Figure 5.7 does not reflect these increases, which are primarily due to the escalating costs
Costs
76 U n i o n o F C o n C e r n e d s C i e n t i s t s : C l i m at e 2 0 3 0 C h a p t e r 5 : F l i p p i n g t h e s w i t C h t o C l e a n e r e l e C t r i C i t y 77
of materials, labor, and fuel; the weak dollar; and bottlenecks in the supply chain. The recent economic downturn and corresponding declines in the price of fuel and materials—combined with a significant increase in U.S. manufacturing of renewable energy technologies (primarily wind and solar)—is already reversing these trends. NREL and many other experts project that the costs of renewable energy will follow the historic trend because of contin-ued growth in the industry and advances in the tech-nology. Stable, long-term national policies that help eliminate market barriers and encourage the growth of renewable energy will likely accelerate these declin-ing costs. Under these conditions—along with a national pol-icy that puts a price on carbon emissions—renewable energy technologies will become increasingly cost- effective compared with new coal, natural gas, and nuclear power plants. In fact, some renewable tech-nologies, such as wind and geothermal at sites with high-quality resources, are competitive with new coal and natural gas plants without incentives or a price on carbon emissions (see Figure 5.8). Advanced coal and natural gas plants with carbon capture and storage, and advanced nuclear plants, in contrast (see below), are more expensive than conven-tional coal and natural gas plants and many renew- able energy technologies, even when a cost of $40 per ton of carbon emissions is included. These tech- nologies will need to drop significantly in cost to be-
come competitive with other options for producing electricity. The costs of emerging renewable technologies, such as solar PV, concentrating solar thermal, and offshore wind, are projected to decline significantly over time because wind and solar are modular and can be mass-produced to drive down costs. Advanced fossil fuel and nuclear plants are large-scale, and thus likely to see more modest cost reductions through more standard-ized designs and engineering.
5.1.4. Key Challenges for Producing Electricity from Renewable Sources5.1.4.1. Siting
Renewable energy technologies allow the nation to avoid or greatly reduce many of the environmental and public health effects from mining and transporting fu-els and producing electricity from fossil fuels and nu-clear power. However, despite these important benefits, care must be taken in siting renewable energy projects to minimize potential environmental impacts. For example, while studies show that wind power usually results in far fewer bird deaths than other causes, a few wind projects have seen significant numbers of birds and bats colliding with the turbines (Erickson et al. 2001). Siting geothermal, large-scale solar, and off-shore wind, wave, and tidal projects can also be chal-lenging because many of the best sites are on federally controlled lands and seas, and often require both fed-eral and state approval. Obtaining the required approv-als and leases can often take several years, which can deter investors. Efforts are under way to minimize these impacts as the industry expands, through careful planning, site selection, research, and monitoring. Efforts are also under way to streamline the approval process and im-prove cooperation between local, state, and federal agencies while ensuring responsible development.
5.1.4.2. Ensuring the Sustainability of Bioenergy and Wise Land UseWhen grown and used sustainably, biomass produces almost no net carbon emissions. If biopower used some form of carbon capture and storage (CCS), the tech-nology could actually lower the concentration of carbon in the atmosphere. However, unsustainable bio-mass harvesting practices can alter the amount of carbon stored and released by soils and trees, and the production of biomass can sometimes require the use of fossil fuels. The overall impact on global warming emissions of generating electricity from biomass
Leve
lized
Cos
t of E
lect
ricity
cent
s pe
r kilo
wat
t-ho
ur in
200
6 do
llars
120
100
80
60
40
20
01980 1985 1990 1995 2000 2005
PVSolar ThermalWindBiomassGeothermal
Figure 5.7. declining Cost of renewable electricity(levelized cost of electricity, in cents per kilowatt-hour)
Source: NreL energy analysis Office. See www.nrel.gov/analysis/docs/cost_curves_2005.ppt.
Note: the levelized cost of electricity includes the annualized costs of capital and operation and maintenance. this graph reflects historical trends, not precise data on annual costs.
Challenges

76 U n i o n o F C o n C e r n e d s C i e n t i s t s : C l i m at e 2 0 3 0 C h a p t e r 5 : F l i p p i n g t h e s w i t C h t o C l e a n e r e l e C t r i C i t y 77
Figure 5.8. Cost of electricity from Various sources (2015)(levelized cost of electricity, in 2006 dollars per megawatt-hour)
natural gas, combined cycle
coal, pulverized
coal, IGCC
natural gas, combined cycle
& CCS
nuclear
coal, IGCC & CCS
wind, land-based
geothermal
bioenergy
wind, o�shore
solar thermal
solar PV, commercial
solar PV, residential
solar PV, central
0 50 100 150 200 250 300 350
Hig
h-Ca
rbon
-Em
ittin
g Te
chno
logi
esLo
w-C
arbo
n-Em
ittin
g Te
chno
logi
esCo
mm
erci
al
Rene
wab
les
Emer
ging
Re
new
able
s
2006 Dollars per Megawatt-Hour
Capital Costs Fixed Operations & Maintenance
Variable Operations & Maintenance
Fuel Costs CO2
Note: IGCC = integrated gasification combined cycle; CCS = carbon capture and storage. The levelized cost of electricity includes the annualized cost of capital, operation and maintenance, and fuel from the Reference case, as well as a CO2 price of $40/ton for illustrative purposes (where applicable). It does not include the cost of transmitting power or integrating facilities into the grid, or cost reductions from tax credits and other incentives for renewable and conventional technologies reflected in the model. See Appendix D for more details on technology cost assumptions and Appendix A for more details on fuel prices (both available online).
When grown and used sustainably, biomass produces
almost no net carbon emissions. If biopower used some form of
carbon capture and storage (CCS), the technology could actually
lower the concentration of carbon in the atmosphere.

78 U n i o n o F C o n C e r n e d s C i e n t i s t s : C l i m at e 2 0 3 0 C h a p t e r 5 : F l i p p i n g t h e s w i t C h t o C l e a n e r e l e C t r i C i t y 79
our analysis did not include several renewable ener-gy technologies that are at an early stage of devel-
opment, but that offer promise over the long-term (after 2030). Our analysis also did not include some technolo-gies that could make a contribution over the next two decades, but that our model was unable to adequately represent. these technologies include:
solar. thin-film pV cells offer promising new applica-tions for solar energy, such as in roof tiles and building facades. While such cells are less costly to produce than semiconductor-grade crystalline-silicon wafers, they typi-cally have much lower efficiencies. Still, venture capital-ists had invested more than $600 million in thin-film pV by 2008, and the technology is projected to account for 25 percent of the pV market and $26 billion in sales by 2013 (Miller 2008). researchers and several companies are also explor-ing the use of solar nanotechnology: thin films of micro-scopic particles and tiny semiconducting crystals that release conducting electrons after absorbing light. Nan-otechnology could revolutionize the solar industry by making solar cells cheaper, more efficient, lighter, and easier to install.
Box 5.3.
Biopower. Biomass gasification with carbon capture and storage (CCS) is a promising tech-nology that could reduce the net amount of carbon in the atmosphere. If grown and used sustainably, biomass absorbs CO2 from the at-mosphere, which could then be captured dur-ing the gasification process and sequestered in geologic formations. Several companies are also working on us-ing algae to produce energy, and to store—or sequester—carbon. One company has com-pleted a demonstration project using algae to sequester flue gases from a coal power plant, and is considering recycling the biomass into the host facility for use as a fuel.
geothermal. an MIt study estimated that the United States has the potential to develop 44,000 megawatts of geothermal capacity by
2050 by co-producing electricity, oil, and natural gas at oil and gas fields—primarily in the Southeast and Southern plains (tester et al. 2006). the study projects that such advanced geothermal systems could supply 10 percent of U.S. baseload electricity by that year, given r&D and deployment over the next 10 years.
hydrokinetic. New technologies that harness the hydro-kinetic energy in currents in undammed rivers, tides, oceans, and constructed waterways could provide more than 140 gigawatts of new electrical capacity—enough to power more than 67 million U.S. homes (Dixon and Bedard 2007).
renewable energy technologies for heating and cooling. these technologies are commercially available today but supply only 2–3 percent of worldwide demand. Mature technologies include solar, biomass, and geother-mal heating and cooling systems. Use of these technolo-gies is growing rapidly in the european Union, where strong policies promoting renewal energy are helping to offset higher up-front costs (Iea 2007).
Technologies on the Horizon: Renewable Energy
A researcher testing nanotechnology for solar panels.
78 U n i o n o F C o n C e r n e d s C i e n t i s t s : C l i m at e 2 0 3 0 C h a p t e r 5 : F l i p p i n g t h e s w i t C h t o C l e a n e r e l e C t r i C i t y 79
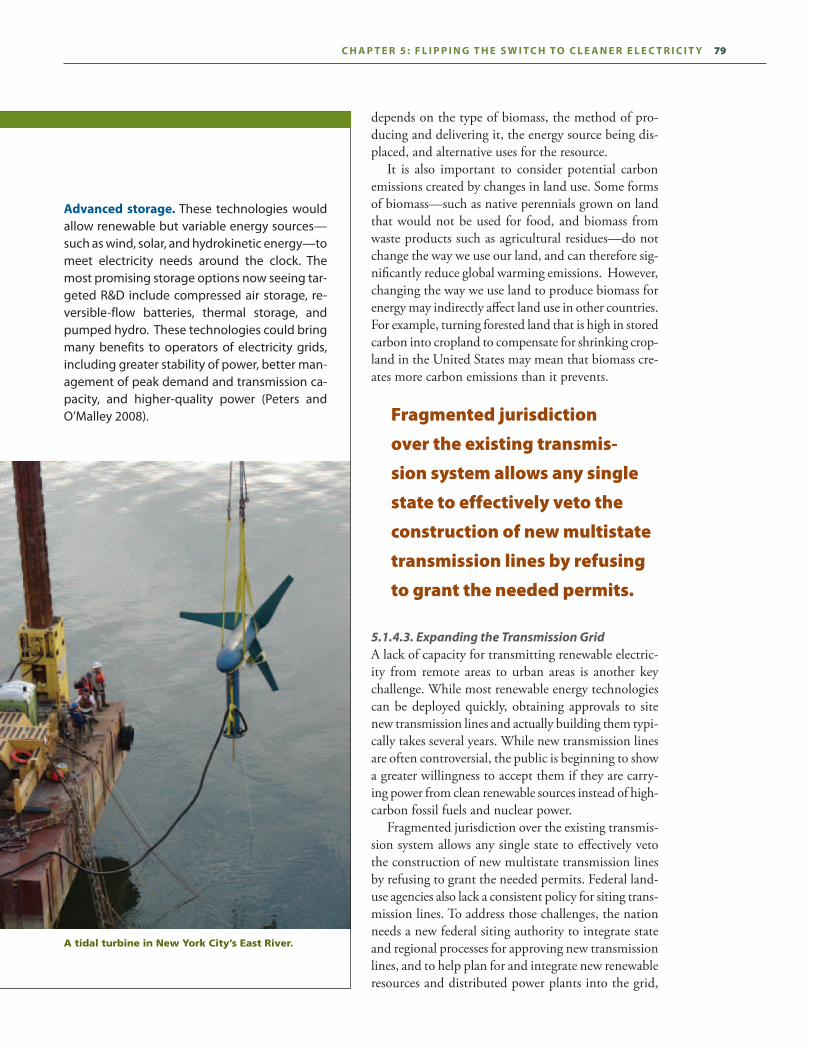
A tidal turbine in New York City’s East River.
advanced storage. these technologies would allow renewable but variable energy sources—such as wind, solar, and hydrokinetic energy—to meet electricity needs around the clock. the most promising storage options now seeing tar-geted r&D include compressed air storage, re-versible-flow batteries, thermal storage, and pumped hydro. these technologies could bring many benefits to operators of electricity grids, including greater stability of power, better man-agement of peak demand and transmission ca-pacity, and higher-quality power (peters and O’Malley 2008).
depends on the type of biomass, the method of pro-ducing and delivering it, the energy source being dis-placed, and alternative uses for the resource. It is also important to consider potential carbon emissions created by changes in land use. Some forms of biomass—such as native perennials grown on land that would not be used for food, and biomass from waste products such as agricultural residues—do not change the way we use our land, and can therefore sig-nificantly reduce global warming emissions. However, changing the way we use land to produce biomass for energy may indirectly affect land use in other countries. For example, turning forested land that is high in stored carbon into cropland to compensate for shrinking crop-land in the United States may mean that biomass cre-ates more carbon emissions than it prevents.
Fragmented jurisdiction
over the existing transmis-
sion system allows any single
state to effectively veto the
construction of new multistate
transmission lines by refusing
to grant the needed permits.
5.1.4.3. Expanding the Transmission GridA lack of capacity for transmitting renewable electric-ity from remote areas to urban areas is another key challenge. While most renewable energy technologies can be deployed quickly, obtaining approvals to site new transmission lines and actually building them typi-cally takes several years. While new transmission lines are often controversial, the public is beginning to show a greater willingness to accept them if they are carry-ing power from clean renewable sources instead of high-carbon fossil fuels and nuclear power. Fragmented jurisdiction over the existing transmis-sion system allows any single state to effectively veto the construction of new multistate transmission lines by refusing to grant the needed permits. Federal land-use agencies also lack a consistent policy for siting trans-mission lines. To address those challenges, the nation needs a new federal siting authority to integrate state and regional processes for approving new transmission lines, and to help plan for and integrate new renewable resources and distributed power plants into the grid,
80 U n i o n o F C o n C e r n e d s C i e n t i s t s : C l i m at e 2 0 3 0 C h a p t e r 5 : F l i p p i n g t h e s w i t C h t o C l e a n e r e l e C t r i C i t y 81
while taking into account options for managing de-mand. Such an authority should also allocate costs fairly among all users of the transmission system, and ensure the protection of sensitive environmental and cultural resources. Several renewable energy technologies could share transmission lines. In fact, combining bioenergy, geo-thermal, landfill gas, and hydro projects—which pro-vide baseload power—with wind and solar projects, which provide varying amounts of power, can allow more cost-effective use of new transmission lines and upgrades. State, regional, and national agencies are now considering how to increase the capacity of the grid to transmit power from “renewable energy zones” to areas of high demand, to capture some of these benefits. In
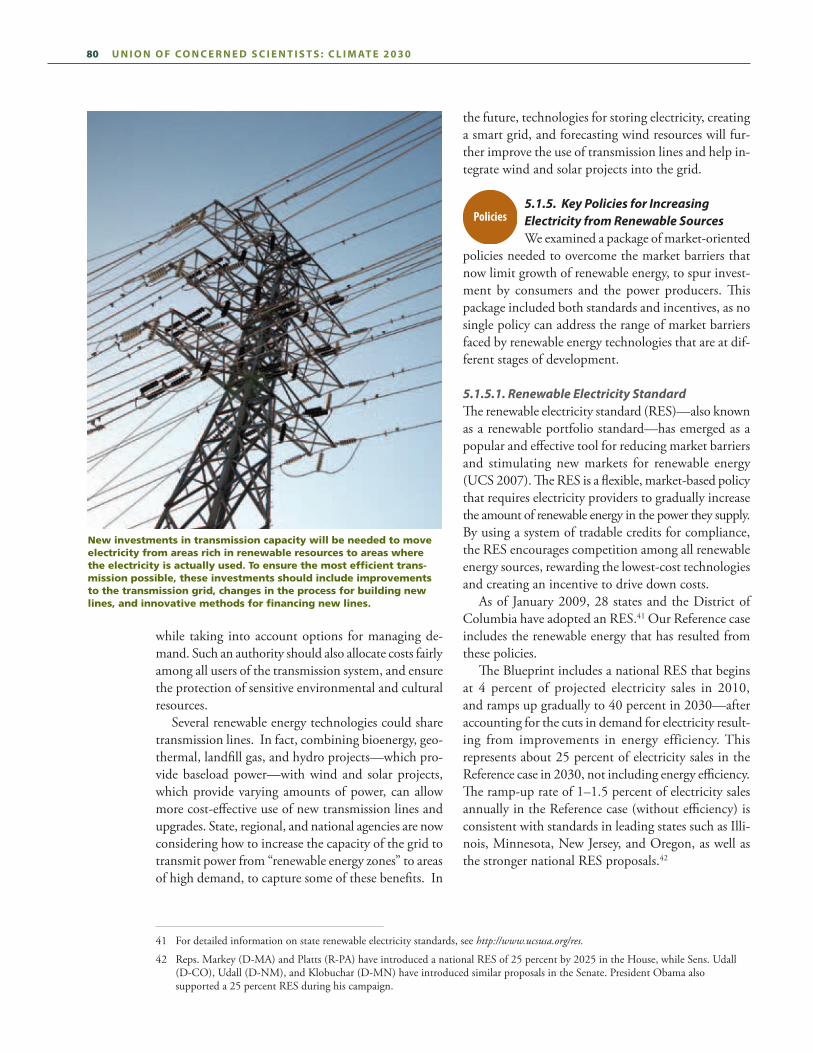
New investments in transmission capacity will be needed to move electricity from areas rich in renewable resources to areas where the electricity is actually used. To ensure the most efficient trans-mission possible, these investments should include improvements to the transmission grid, changes in the process for building new lines, and innovative methods for financing new lines.
the future, technologies for storing electricity, creating a smart grid, and forecasting wind resources will fur-ther improve the use of transmission lines and help in-tegrate wind and solar projects into the grid.
5.1.5. Key Policies for Increasing Electricity from Renewable SourcesWe examined a package of market-oriented
policies needed to overcome the market barriers that now limit growth of renewable energy, to spur invest-ment by consumers and the power producers. This package included both standards and incentives, as no single policy can address the range of market barriers faced by renewable energy technologies that are at dif-ferent stages of development.
5.1.5.1. Renewable Electricity StandardThe renewable electricity standard (RES)—also known as a renewable portfolio standard—has emerged as a popular and effective tool for reducing market barriers and stimulating new markets for renewable energy (UCS 2007). The RES is a flexible, market-based policy that requires electricity providers to gradually increase the amount of renewable energy in the power they supply. By using a system of tradable credits for compliance, the RES encourages competition among all renewable energy sources, rewarding the lowest-cost technologies and creating an incentive to drive down costs. As of January 2009, 28 states and the District of Columbia have adopted an RES.41 Our Reference case includes the renewable energy that has resulted from these policies. The Blueprint includes a national RES that begins at 4 percent of projected electricity sales in 2010, and ramps up gradually to 40 percent in 2030—after accounting for the cuts in demand for electricity result-ing from improvements in energy efficiency. This represents about 25 percent of electricity sales in the Reference case in 2030, not including energy efficiency. The ramp-up rate of 1–1.5 percent of electricity sales annually in the Reference case (without efficiency) is consistent with standards in leading states such as Illi-nois, Minnesota, New Jersey, and Oregon, as well as the stronger national RES proposals.42
41 For detailed information on state renewable electricity standards, see http://www.ucsusa.org/res.
42 Reps. Markey (D-MA) and Platts (R-PA) have introduced a national RES of 25 percent by 2025 in the House, while Sens. Udall (D-CO), Udall (D-NM), and Klobuchar (D-MN) have introduced similar proposals in the Senate. President Obama also supported a 25 percent RES during his campaign.
Policies

80 U n i o n o F C o n C e r n e d s C i e n t i s t s : C l i m at e 2 0 3 0 C h a p t e r 5 : F l i p p i n g t h e s w i t C h t o C l e a n e r e l e C t r i C i t y 81
The Blueprint also assumed that: • All U.S. electricity providers must meet the targets• Eligible technologies include biomass, geothermal,
incremental or new capacity at existing hydroelec-tric facilities, landfill gas, solar, and wind
• Providers can use existing renewable energy sources, except existing hydro, to meet the targets
policies, we assumed that they would help facilitate the development of the technologies that the analysis did include, as well as help providers meet the national renewable electricity targets. These policies include: greening our transmission system. Experts agree that deploying enough renewable energy re-sources to achieve strong targets for cutting carbon emissions will be impossible unless the nation dra-matically modernizes and expands the grid for trans-mitting electricity. Addressing this problem quickly will require reforming the management and operation of the grid, creating new mechanisms for financing and recovering the costs of an expanded grid, and cre-ating processes for siting new transmission lines. These measures will help producers of electricity generated from carbon-free renewable resources connect to the grid. Coupled with these efforts must be initiatives that encourage energy efficiency, demand-side manage-ment, and smart grid improvements, while discourag-ing access to new lines from high-carbon emitters. Our analysis assumed that new national policies will facilitate new transmission lines and upgrades of exist-ing lines to enable power producers to meet national renewable electricity targets. While we did not explic-itly model these policies, we did include the costs of building new transmission lines for new renewable, fossil-fueled, and nuclear power plants, and we allo-cated those costs to all electricity users based on EIA assumptions. The Blueprint analysis also included the costs of siting and connecting wind projects, and
New Jersey policies promoting clean energy helped finance the nation’s largest single-roof solar project (at the Atlantic City Convention Center). Unveiled in March 2009, the project meets 26 percent of the building’s elec-trical needs and avoids the release of more than 2,300 tons of CO2 annually.
Experts agree that deploy-
ing enough renewable
energy resources to achieve
strong targets for cutting
carbon emissions will be
impossible unless the nation
dramatically modernizes and
expands the grid for trans-
mitting electricity.
5.1.5.2. Tax CreditsProduction and investment tax credits help defray the typically higher up-front costs of renewable energy technologies. Such credits also help level the playing field with fossil and nuclear technologies, which have historically received much higher tax subsidies (Gold-berg 2000; Sissine 1994). Both the Reference case and the Blueprint case in-clude the extension and expansion of tax credits for renewable energy technologies that were part of the 2008 Economic Stimulus Package. That legislation in-cludes a one-year extension (through 2009) of the pro-duction tax credit for wind; a two-year extension (through 2010) of the production tax credit for geo-thermal, solar, biomass, landfill gas, and certain hydro facilities; and an eight-year extension (through 2016) of the 30 percent investment tax credit for solar and small wind systems. Our analysis did not include the tax credits and incentives from the American Recovery and Reinvestment Act of 2009, because it was enacted after we had completed our modeling.
5.1.5.3. Other Renewable Energy PoliciesWe also recommend several other policies to help com-mercialize a broad range of renewable energy technolo-gies. While our analysis did not explicitly model those
82 U n i o n o F C o n C e r n e d s C i e n t i s t s : C l i m at e 2 0 3 0 C h a p t e r 5 : F l i p p i n g t h e s w i t C h t o C l e a n e r e l e C t r i C i t y 83
transmitting the power they produce, as the use of wind grows, based on an analysis by NREL for the EIA. more funding for r&d. More funding for re-search and development is essential for commercial-izing electricity based on renewable energy, as well as other low-carbon technologies. R&D drives innova-tion and performance gains while helping to lower the cost of emerging technologies. Our analysis assumed that federal R&D funding for renewable energy would double over a five-year period.
would complement renewable electricity standards, as those tend to benefit larger, lower-cost projects and technologies that are closer to commercialization. Financial incentives. Financial incentives such as rebates, grants, and loans can stimulate investment and help bring renewable energy technologies to mar-ket. Funding for such programs can come from vari-ous state sources, such as renewable energy funds, and federal sources such as clean renewable energy bonds (CREBS), which Congress recently extended through 2009 in the Economic Stimulus Package.
5.2. electricity from Fossil Fuels with Carbon Capture and storageWhile renewable energy technologies have the techni-cal potential to produce all the nation’s electricity and eliminate carbon emissions from that sector, the coun-try must address many challenges to realize that poten-tial. Given the uncertainties in our ability to surmount those market barriers, and to guarantee advances in re-newable technologies and reductions in their cost, the nation may need other low-carbon approaches to avoid the most dangerous effects of global warming. Carbon capture and storage (CCS) is an emerging technology that could allow electricity producers to capture carbon dioxide from power plants and pump it into underground formations, where it would ideally remain safely stored over the very long term (see Figure 5.9). This approach is being investigated today pri-marily to reduce carbon emissions from coal-fired pow-er plants. However, it could also be used to prevent emissions from natural-gas-fired power plants or other industrial facilities that release a significant stream of carbon dioxide. And facilities that burn or gasify bio-mass could actually provide carbon-negative power—that is, they could store carbon dioxide recently re-moved from the atmosphere through the photosynthesis of the plants they use as fuel—if they relied on CCS.
5.2.1. Types of CCS Technologies One CCS technology is pre-combustion capture, which can be used with integrated gasification combined-cycle (IGCC) coal plants. IGCC plants heat the coal to cre-ate a synthetic gas, or syngas. The syngas fuels a com-bustion turbine used to generate electricity, and the waste heat from that process creates additional power via a steam turbine. Converting the coal into a gas al-lows operators to remove CO2 before combustion, when it is in a more concentrated and pressurized form. IGCC is a relatively new technology: only four plants now operate worldwide, although developers
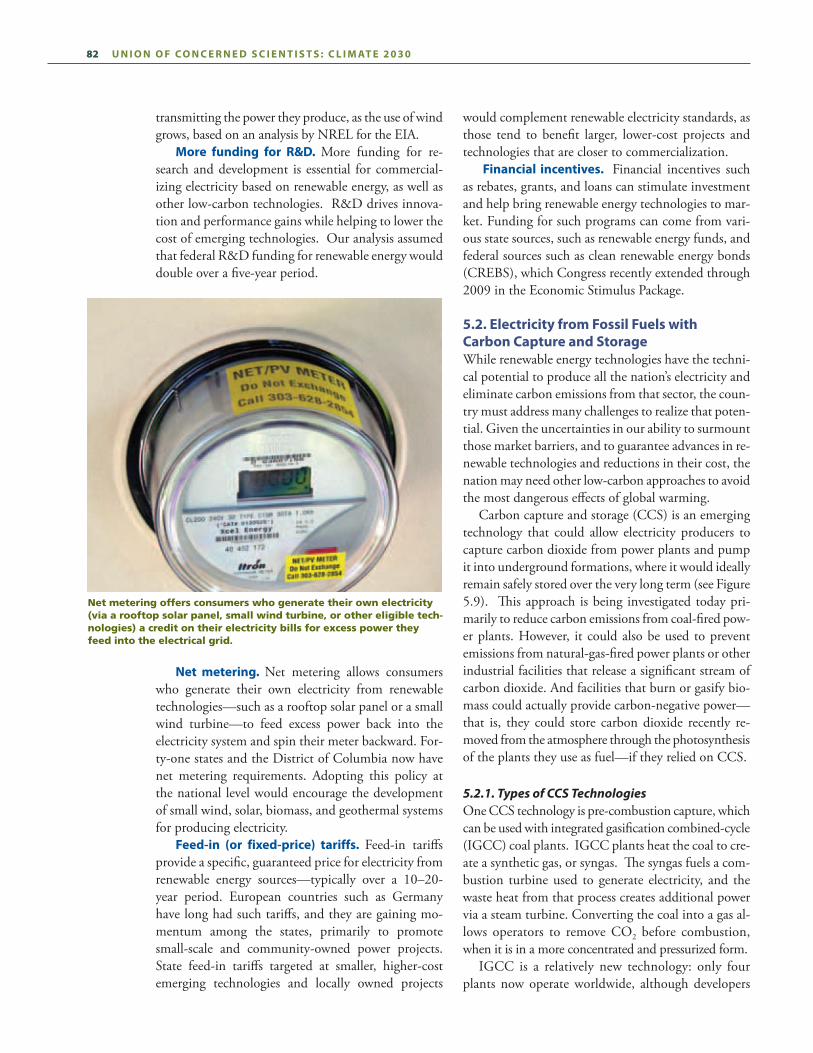
Net metering offers consumers who generate their own electricity (via a rooftop solar panel, small wind turbine, or other eligible tech-nologies) a credit on their electricity bills for excess power they feed into the electrical grid.
net metering. Net metering allows consumers who generate their own electricity from renewable technologies—such as a rooftop solar panel or a small wind turbine—to feed excess power back into the electricity system and spin their meter backward. For-ty-one states and the District of Columbia now have net metering requirements. Adopting this policy at the national level would encourage the development of small wind, solar, biomass, and geothermal systems for producing electricity. Feed-in (or fixed-price) tariffs. Feed-in tariffs provide a specific, guaranteed price for electricity from renewable energy sources—typically over a 10–20-year period. European countries such as Germany have long had such tariffs, and they are gaining mo-mentum among the states, primarily to promote small-scale and community-owned power projects. State feed-in tariffs targeted at smaller, higher-cost emerging technologies and locally owned projects
82 U n i o n o F C o n C e r n e d s C i e n t i s t s : C l i m at e 2 0 3 0 C h a p t e r 5 : F l i p p i n g t h e s w i t C h t o C l e a n e r e l e C t r i C i t y 83
have announced several others. Interest in IGCC is strong because it is seen as more amenable to carbon capture than traditional coal plants, though none of the IGCC coal plants now operating employ CCS. Another capture technology under development is post-combustion capture, which would be used with traditional coal plants. Collecting CO2 after com-bustion is more challenging because the gas is more diluted, requiring greater energy to collect and com-press it. One way to collect the CO2 is with amine scrubbers, now used to capture CO2 in much smaller industrial applications. Another approach, called oxy-fueling, would fuel a coal plant with oxygen rather than background air, yielding a purer stream of CO2 after combustion. Oxy-fueling is in an earlier stage of investigation than the other capture methods. Our analysis included only pre-combustion carbon capture in new coal IGCC and natural gas combined-cycle plants, because NEMS currently does not have the capacity to model post-combustion capture technologies. Both pre- and post-combustion technologies are expected to capture 85–95 percent of a coal plant’s car-bon emissions. When factoring in the fuel used to power the CO2 capture process, though, the actual rate of carbon emissions avoided per unit of electricity is expected to fall to 80–90 percent (IPCC 2005).
Researchers are investigating underground storage of CO2—often called sequestration—in several proj-ects around the world. Options for storing the CO2
include pumping it into depleted oil or gas fields, coal seams that cannot be mined, and deep saline aquifers. Detailed analyses of CCS have concluded that long-term geologic storage of CO2 is technically feasible, though careful site selection is critical (MIT 2007; IPCC 2005). While many components of CCS are in use in other, usually smaller, applications and pilot projects, there have not yet been any commercial-scale, fully integrated projects demonstrating CCS at coal-fired power plants. Developers have announced several such projects, including in the United States, though most are seeking more government funding before moving forward.
5.2.2. Potential of Carbon Capture and StorageSome 500 coal plants provided half the na-
tion’s electricity in 2007—and produced about one-third of all U.S. carbon emissions. A typical new coal plant averages about 600 megawatts in size. The DOE estimates that geologic formations in North America have the capacity to store hundreds of years’ worth of U.S. carbon emissions, based on today’s rate. However,
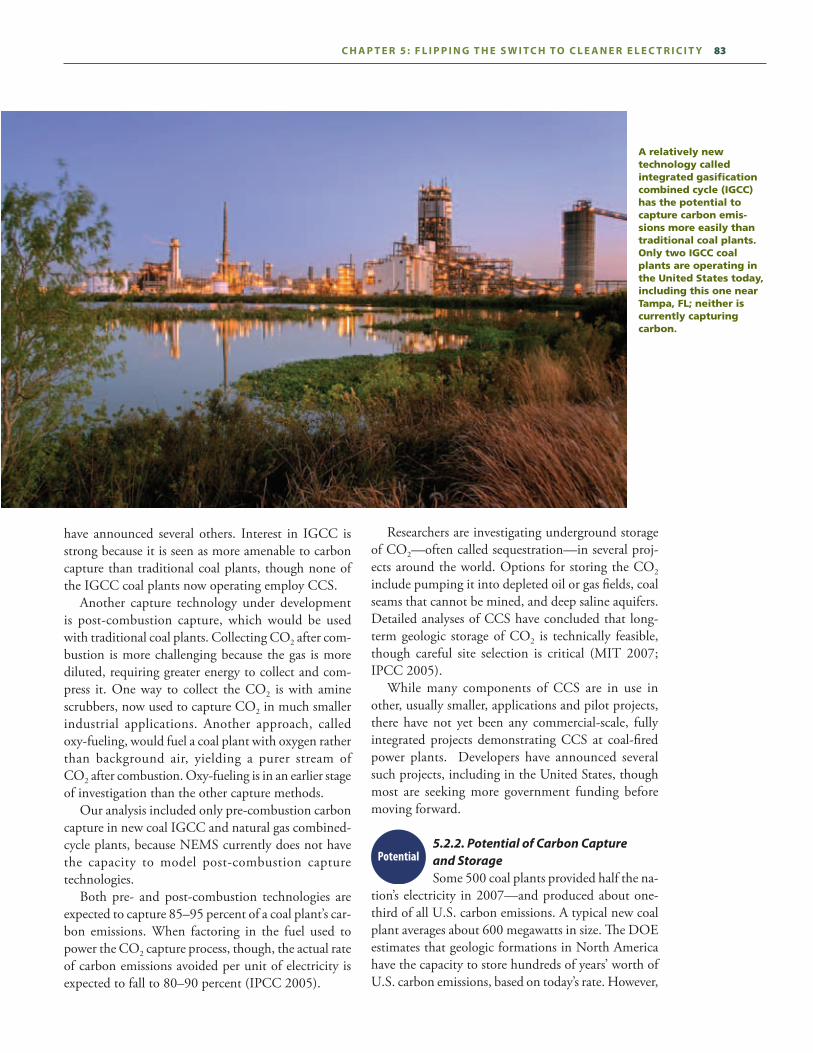
A relatively new technology called integrated gasification combined cycle (IGCC) has the potential to capture carbon emis-sions more easily than traditional coal plants. Only two IGCC coal plants are operating in the United States today, including this one near Tampa, FL; neither is currently capturing carbon.
Potential
84 U n i o n o F C o n C e r n e d s C i e n t i s t s : C l i m at e 2 0 3 0 C h a p t e r 5 : F l i p p i n g t h e s w i t C h t o C l e a n e r e l e C t r i C i t y 85
some areas are far from suitable storage formations (NETL 2006). Computer models cited by the Intergovernmental Panel on Climate Change indicate that CCS could eventually contribute 15–54 percent of the cuts in car-bon emissions needed by 2100. Recent government studies of proposed U.S. climate legislation also show large-scale development of advanced coal plants with CCS before 2030 (EIA 2008; EPA 2008a). Studies further show that CCS deployment could significantly lower the cost of stabilizing concentrations of heat-trapping gases in the atmosphere (Creyts et al. 2007; EPRI 2007; MIT 2007; IPCC 2005). However, all these studies use optimistic assump-tions about capital costs, ramp-up rates, and the ability to scale up the enormous infrastructure needed to trans-port, store, and monitor the emissions. Government studies also include generous incentives for CCS in proposed federal legislation, which tip the balance to-ward CCS versus other technologies. Studies that do not include these incentives, and that use more reason-able assumptions about capital costs and ramp-up rates, show advanced coal with CCS making a much smaller contribution by 2030 (e.g., EPRI 2008).
5.2.3. Costs of Carbon Capture and StorageThe DOE estimates that adding post-com-
bustion capture (using amine scrubbing) to a traditional coal plant would increase the cost of electricity 81–85
percent. Adding pre-combustion capture to an IGCC plant would raise the cost of electricity 32–40 percent, but the underlying IGCC plant costs more than a tra-ditional coal plant. These estimates suggest that IGCC plants with pre-combustion CCS would cost somewhat less than traditional plants with post-combustion CCS. However, MIT analysts contend that it is too soon to know which technology would cost less (MIT 2007; NETL 2007). The higher cost of energy in these approaches re-flects both the higher capital costs of adding CCS and the resulting losses in the plant’s output. Post-combus-tion capture is particularly energy intensive: amine scrubbing is expected to reduce a plant’s power output by a quarter or more, even if engineers integrate CCS into the plant’s original design. If CCS is added as a retrofit, the energy penalty and higher cost of energy would be much greater. Because no one has yet built a coal-fired power plant with CCS, estimates of the technology’s performance and cost are more uncertain than those of other ap-proaches to cutting global warming emissions.
5.2.4. Key Challenges for Carbon Capture and StorageCCS faces many challenges. For the tech-
nology to play a major role in reducing heat-trapping emissions, the nation would need an enormous new infrastructure to capture, process, transport (usually by pipeline), and store large quantities of CO2. For
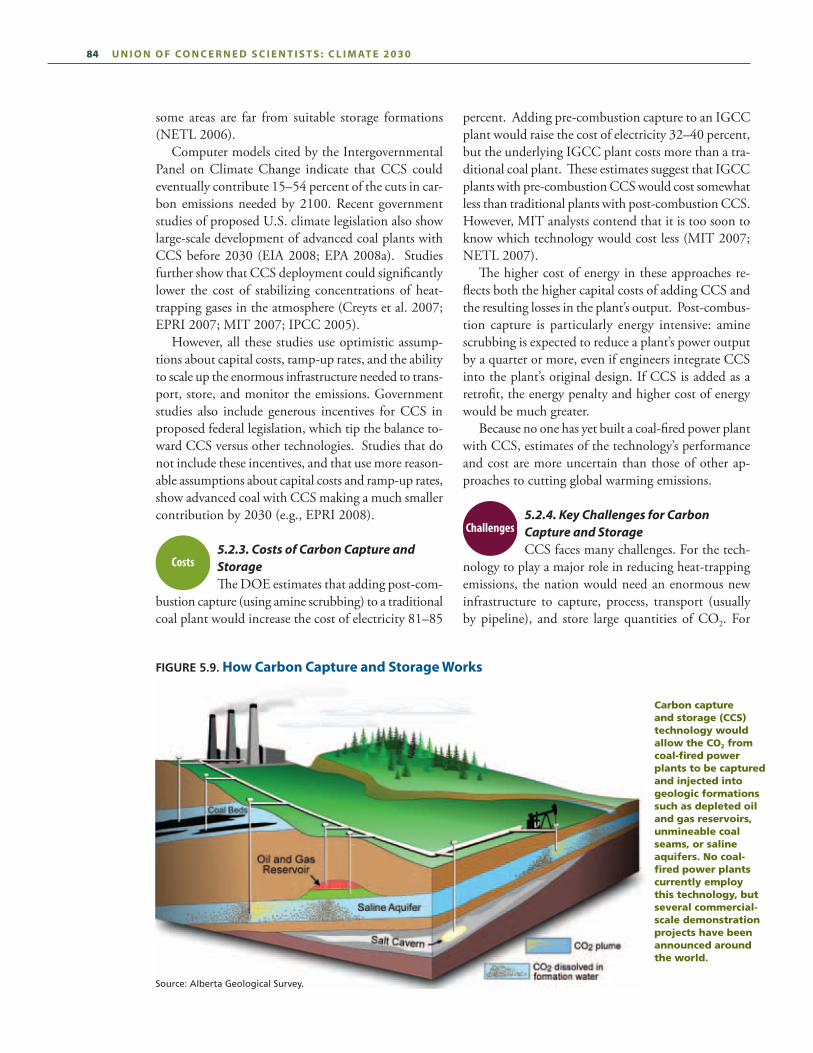
Carbon capture and storage (CCS) technology would allow the CO2 from coal-fired power plants to be captured and injected into geologic formations such as depleted oil and gas reservoirs, unmineable coal seams, or saline aquifers. No coal- fired power plants currently employ this technology, but several commercial-scale demonstration projects have been announced around the world.
Figure 5.9. how Carbon Capture and storage works
Source: Alberta Geological Survey.
Costs
Challenges
84 U n i o n o F C o n C e r n e d s C i e n t i s t s : C l i m at e 2 0 3 0 C h a p t e r 5 : F l i p p i n g t h e s w i t C h t o C l e a n e r e l e C t r i C i t y 85
example, if 60 percent of the CO2 now released by U.S. coal plants were captured and stored, the volume would equal that of all U.S. oil consumption (MIT 2007). Environmental concerns linked to CCS include the risk that CO2 will leak back into the atmosphere. Slow leaks would contribute to global warming, while fast leaks could pose a local danger, as high concentrations of CO2 are fatal. Another concern is that CO2 could migrate in unexpected ways, picking up toxic com- ponents underground and contaminating freshwater aquifers. The risk of leakage and migration rises in the presence of abandoned oil and gas wells, which can provide conduits for the CO2. Reducing these risks will require careful site selec-tion and long-term monitoring, which in turn will re-quire the development and enforcement of rigorous regulations. Long-term liability questions must also be answered. CCS added to coal plants will also do nothing to reduce the serious environmental and social costs of mining and transporting coal. Indeed, coal plants with CCS will require more coal per megawatt-hour of elec-tricity they produce than plants without it, given that the capture process consumes energy. And while some of the other air pollutants from today’s coal plants would likely decline if they were redesigned to employ
CCS, other environmental effects such as water use could increase or stay the same. One unique environmental benefit of CCS is its potential to be paired with biomass to produce elec-tricity that actually reduces atmospheric concentra-tions—not just emissions—of carbon. As plants grow, they absorb CO2 from the atmosphere. The CCS pro-cess—used at a facility that gasifies or burns biomass—would then turn the atmospheric carbon captured by the plants into geologic carbon. Such carbon-negative energy facilities could play an important role in fight-ing global warming in the decades ahead.
5.2.5. Key Policies for Carbon Capture and StorageIn Coal Power in a Warming World: A Sen-
sible Transition to Cleaner Energy Options, UCS analysts conclude that CCS has enough potential to play a significant role in reducing carbon emissions to war-rant further investigation and investment, despite its many challenges (Freese, Clemmer, and Nogee 2008). The nation needs to reduce the one-third of U.S. car-bon emissions that come from coal-based electri- city, and to stop building new coal plants without CCS technology. UCS therefore supports federal funding for 5 to 10 demonstration projects of various
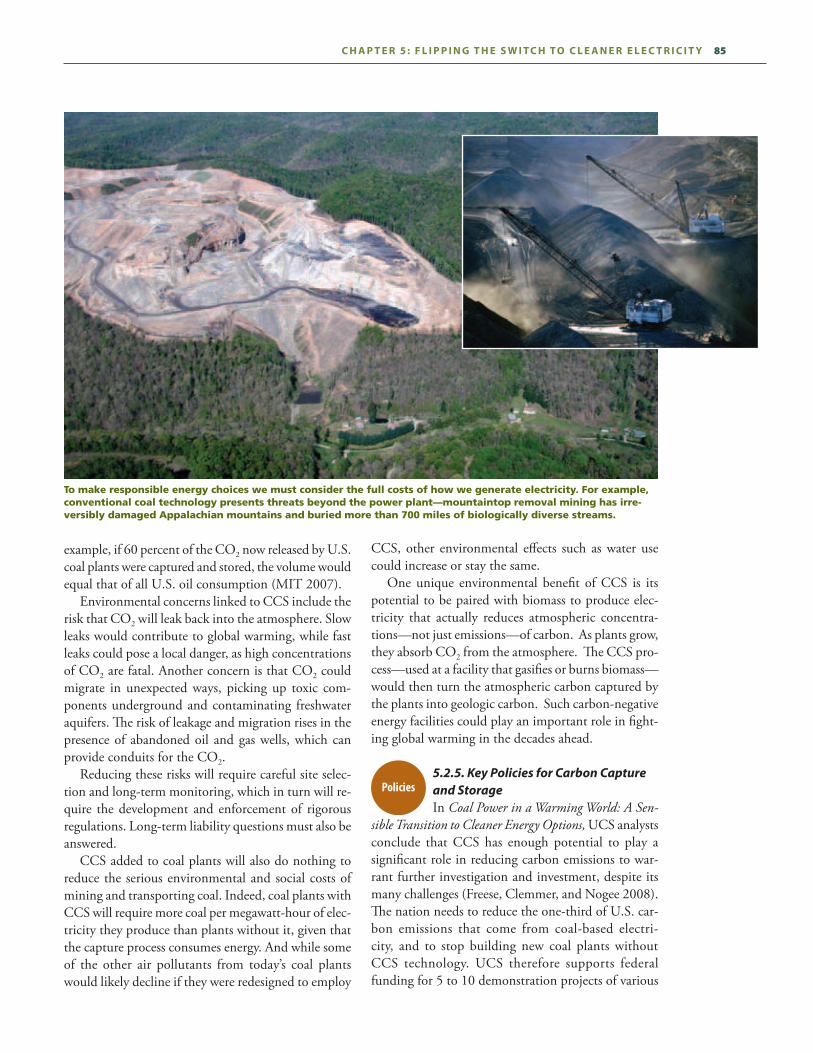
To make responsible energy choices we must consider the full costs of how we generate electricity. For example, conventional coal technology presents threats beyond the power plant—mountaintop removal mining has irre-versibly damaged Appalachian mountains and buried more than 700 miles of biologically diverse streams.
Policies
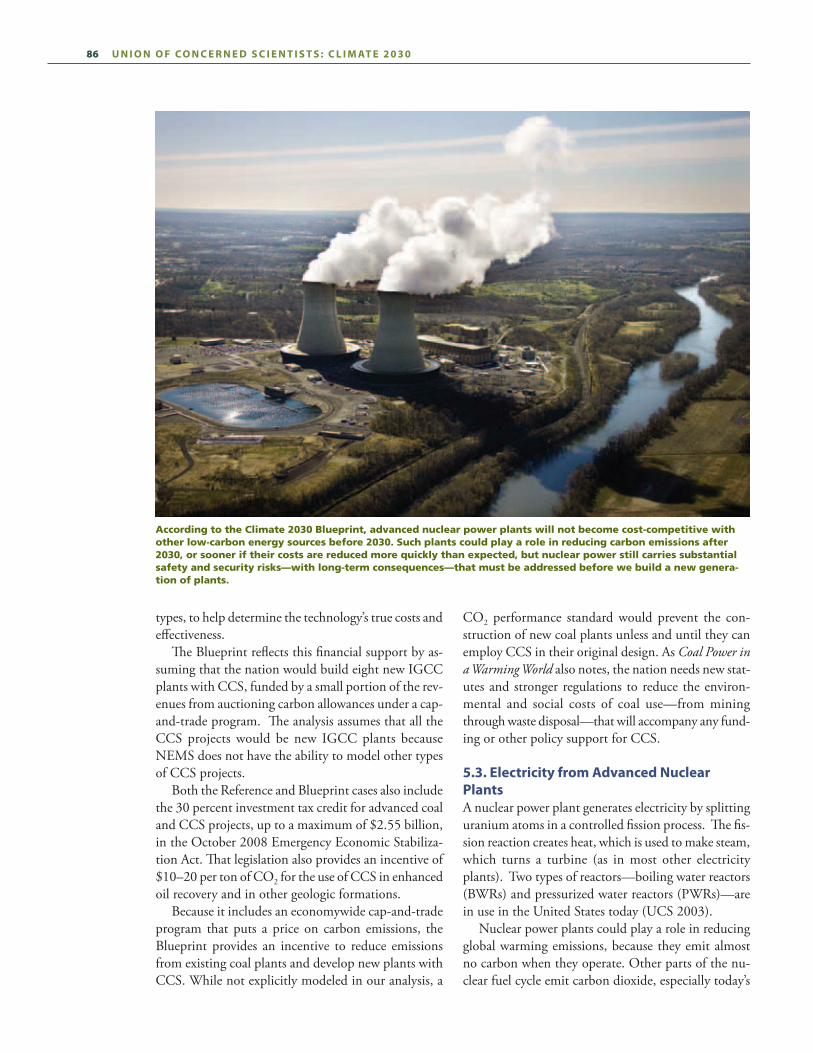
86 U n i o n o F C o n C e r n e d s C i e n t i s t s : C l i m at e 2 0 3 0 C h a p t e r 5 : F l i p p i n g t h e s w i t C h t o C l e a n e r e l e C t r i C i t y 87
types, to help determine the technology’s true costs and effectiveness. The Blueprint reflects this financial support by as-suming that the nation would build eight new IGCC plants with CCS, funded by a small portion of the rev-enues from auctioning carbon allowances under a cap-and-trade program. The analysis assumes that all the CCS projects would be new IGCC plants because NEMS does not have the ability to model other types of CCS projects. Both the Reference and Blueprint cases also include the 30 percent investment tax credit for advanced coal and CCS projects, up to a maximum of $2.55 billion, in the October 2008 Emergency Economic Stabiliza-tion Act. That legislation also provides an incentive of $10–20 per ton of CO2 for the use of CCS in enhanced oil recovery and in other geologic formations. Because it includes an economywide cap-and-trade program that puts a price on carbon emissions, the Blueprint provides an incentive to reduce emissions from existing coal plants and develop new plants with CCS. While not explicitly modeled in our analysis, a
CO2 performance standard would prevent the con-struction of new coal plants unless and until they can employ CCS in their original design. As Coal Power in a Warming World also notes, the nation needs new stat-utes and stronger regulations to reduce the environ-mental and social costs of coal use—from mining through waste disposal—that will accompany any fund-ing or other policy support for CCS.
5.3. electricity from advanced nuclear plantsA nuclear power plant generates electricity by splitting uranium atoms in a controlled fission process. The fis-sion reaction creates heat, which is used to make steam, which turns a turbine (as in most other electricity plants). Two types of reactors—boiling water reactors (BWRs) and pressurized water reactors (PWRs)—are in use in the United States today (UCS 2003). Nuclear power plants could play a role in reducing global warming emissions, because they emit almost no carbon when they operate. Other parts of the nu-clear fuel cycle emit carbon dioxide, especially today’s
According to the Climate 2030 Blueprint, advanced nuclear power plants will not become cost-competitive with other low-carbon energy sources before 2030. Such plants could play a role in reducing carbon emissions after 2030, or sooner if their costs are reduced more quickly than expected, but nuclear power still carries substantial safety and security risks—with long-term consequences—that must be addressed before we build a new genera-tion of plants.
86 U n i o n o F C o n C e r n e d s C i e n t i s t s : C l i m at e 2 0 3 0 C h a p t e r 5 : F l i p p i n g t h e s w i t C h t o C l e a n e r e l e C t r i C i t y 87
uranium enrichment processes, which rely on coal-fired power plants and inefficient technology. However, some studies have found those emissions to be roughly com-parable to those from manufacturing and installing wind power and hydropower facilities (UCS 2003). The United States now obtains about 20 percent of its electricity from 104 nuclear power plants (EIA 2008). Thanks to better operating performance, the “capacity factor” of U.S. nuclear reactors rose from 56 percent in 1980 to 91.5 percent in 2007 (EIA 2008). However, U.S. utilities ordered no new nuclear plants after 1978, and canceled all plants ordered after 1973. Other countries have continued to build nuclear plants, although at a much slower rate than during the peak years of the 1970s and 1980s. The Nuclear Regulatory Commission (NRC) is in the process of extending the licenses for most, if not all, U.S. plants now operating—from an original 40-year period to 60 years. Almost all these plants would have to be retired and decommissioned between 2030 and 2050, unless the NRC extends their licenses again. However, the economic and technical feasibility of doing so has not been established.
5.3.1. Types of Advanced Nuclear TechnologiesFourteen companies have submitted applications to the NRC to build and operate 26 plants at 17 sites, al-though no utility has actually ordered a new plant yet.43 These applications reference five plant designs—of which the NRC has certified only two. And one of those, the AP1000, has undergone significant design changes since it was certified The five designs offer evolutionary improvements on existing plants: they are somewhat simpler, relying more on “passive” safety systems and less on pumps and valves. The industry and the NRC had hoped that these upgrades—along with a streamlined licensing process and greater standardization—would improve the safety of nuclear power plants and reduce their costs. However, the goal of standardization has so far proved elusive and the licensing process has not yet been fully tested. Of all the new reactor designs under serious consid-eration for use in the United States, only one—the Evolutionary Power Reactor (EPR)—appears to have the potential to be significantly safer and more secure than existing reactors, provided that it is built to the stricter safety standards required by France and Ger-
many. However, because the EPR design does not fea-ture the same safety shortcuts as the passive designs, including the AP1000, Standard & Poor’s rated it as the most risky with regard to capital costs. Several companies are also working on much smaller plants in the 10–150-megawatt range, compared with 1,000–1,600 megawatts for traditional designs. By making modular units and siting them underground, these companies hope to rely on mass production to achieve economies of scale and improve safety and se-curity. However, no power companies have submitted such designs to the NRC for licensing, so we cannot yet evaluate the companies’ claims. Other new designs in research and development—known as Generation IV designs—aim to achieve ma-jor leaps in safety and cost. However, a significant num-ber of engineering problems remain to be solved, so we cannot yet evaluate the claims for Generation IV plants either. In fact, they are not expected to be ready for deployment before 2030. Because the Blueprint analy-sis examined costs and benefits through 2030 only, we did not include these advanced designs.
5.3.2. Potential of Advanced Nuclear PowerAccording to the International Atomic En-
ergy Agency, the world has enough uranium supplies to fuel the existing 400 nuclear plants for more than 100 years, and to expand that fleet by 38–80 percent by 2030 (IAEA 2008). Some proponents argue that the reprocessing of used nuclear fuel to extract pluto-nium could create a virtually unlimited supply of fuel for use in “fast breeder” reactors. However, reprocess-ing is many times more expensive than the traditional “once-through” fuel cycle. Reprocessing also greatly increases the risk that weapons-usable nuclear mate- rials will be diverted—as well as the volume of radio-active wastes requiring disposal (UCS 2007a). While uneconomical today, some scientists believe that sea-water could eventually supply virtually unlimited quan-tities of uranium at lower cost than fuel made from reprocessing (Garwin 2001). Nuclear power could therefore, in theory, contrib-ute to a climate-friendly future. A recent EIA analysis of the impact of climate legislation projected as much as 268 gigawatts of new nuclear capacity by 2030—supplying 58 percent of total U.S. demand, and a significant share of the needed cuts in carbon emissions
43 AmerenUE recently announced that it has canceled plans to build the proposed Callaway 2 reactor in Missouri.
Potential

88 U n i o n o F C o n C e r n e d s C i e n t i s t s : C l i m at e 2 0 3 0 C h a p t e r 5 : F l i p p i n g t h e s w i t C h t o C l e a n e r e l e C t r i C i t y 89
(EIA 2008). However, the EIA assumed very outdated and low “overnight” construction costs of $2,475 per kilowatt (in 2006 dollars)—well below current in-dustry estimates. (Overnight costs do not include financing or escalating costs during construction.) The industry also faces significant constraints to deploy- ing new nuclear plants that rapidly, and to that extent (see below).
5.3.3. Costs of Advanced Nuclear PowerThe cost of electricity from nuclear power plants is largely driven by the cost of con-
structing them. The fuel and operating costs of existing nuclear plants are generally lower than those of other conventional technologies for producing electricity. However, very high construction costs—stemming from long construction periods and associated financ-ing costs—have been the economic Achilles heel of the nuclear industry. During the 1970s and 1980s, with cost overruns averaging more than 200 percent, utilities abandoned more than half of the planned nuclear fleet during con-struction. And the plants they did complete usually led to significant increases in electricity rates. The total losses to ratepayers, taxpayers, and shareholders stem-ming from cost overruns, canceled plants, and stranded costs well exceed $300 billion in today’s dollars (Schlis-sel, Mullet, and Alvarez 2009).
Reliably projecting construction costs for new U.S. nuclear plants is impossible, because the nation has no recent experience to draw upon. Recent experience with reactors under construction in Europe, however—along with recent trends in the overall cost of commodities and construction—show the same vulnerability to cost escalation that plagued the last generation of nuclear plants. Only three years after its 2005 groundbreaking, for example, the Olkiluoto plant in Finland was report-edly three years behind schedule, with cost overruns topping 50 percent. The project has encountered numerous quality problems, and the principals are in arbitration over responsibility for the overruns (The Guardian 2009). Construction costs have risen over the past five years for all technologies used to produce electricity—but most dramatically for nuclear plants—as shown in Fig-ure 5.10 (CERA 2008). For example, in November 2008, Duke Energy revised its estimate of overnight construction costs for two nuclear units proposed for Cherokee County, SC, to $5,000 per kilowatt. Several other analysts and developers of nuclear plants have estimated a range of $3,800–$5,500 per kilowatt. Utili-ties applying for loan guarantees in November 2008 estimated that the costs of their proposed 21 plants—including cost escalation and the cost of financing—would total $188 billion, an average of $9 billion per plant, or more than $6,700 per kilowatt. Our analysis assumed that overnight capital costs for new nuclear plants would initially average $4,400 per kilowatt for those with a 2016 in-service date, not including financing costs. The NEMS model calculates the cost with financing to be $6,900 per kilowatt, which is close to the average estimates available when we finalized assumptions for our model. Our figure is lower because we assumed that industry learning would reduce costs by nearly 7 percent by 2030—or half the rate projected by the EIA based on international experience. France and South Korea have achieved higher learning rates largely because of standardization: one company builds one plant design over and over. In the fractured U.S. industry, with 17 companies proposing to build 26 units based on five different designs (with more on the horizon), high learning rates are optimis-tic. Indeed, the U.S. nuclear industry saw construction costs rise steadily through almost the entire last genera-tion of plants (EIA 1986), making any future cost reductions through learning very uncertain. Continued cost escalation would be more consistent with the U.S. experience.
250
230
210
190
170
150
130
110
90
Cost
Inde
x (2
000=
100)
2000 2001 2002 2003 2004 2005 2006 2007 2008 2009
With Nuclear Power
Without Nuclear Power
178 182189
Q3 2007: 233Q1 2008: 231
Q3 2008:224
Figure 5.10. nuclear power plant Construction Costs rising Faster than other technologies
Source: CERA 2008.
Over the past nine years, construction costs have risen for all electricity-generating facilities. But over the past four years, the costs for nuclear power plants have risen much more dramatically than other technologies. Between 2000 and the third quarter of 2008, construction costs have risen 89 percent for all non-nuclear technologies, compared with 124 percent when nuclear power is included.
Costs

88 U n i o n o F C o n C e r n e d s C i e n t i s t s : C l i m at e 2 0 3 0 C h a p t e r 5 : F l i p p i n g t h e s w i t C h t o C l e a n e r e l e C t r i C i t y 89
5.3.4. Key Challenges for Advanced Nuclear PowerNuclear technologies pose a number of
unique and complex challenges. An expansion of nu-clear power would increase the risks to human safety and security (UCS 2007a). These include a release of radiation because of a reactor meltdown or terrorist attack. If proposals for reprocessing nuclear waste move forward, the detonation of a nuclear weapon made with materials from a civilian nuclear power system could produce massive civilian deaths. Such an incident would obviously also threaten the viability of nuclear power. After 50 years of nuclear power, a mix of technical and political challenges has meant that no country has yet licensed a long-term nuclear waste repository. The proposed Yucca Mountain site in the United States has been plagued with technical, managerial, and political problems (GAO 2006), and the Obama administra-tion announced in early 2009 that it would no longer pursue it as a permanent repository. While nuclear waste can be stored safely in hardened concrete casks on-site or in a central repository in the short run, suc-cessfully licensing long-term storage is a critical chal-lenge for the industry to see substantial growth. Nuclear plants also require enormous volumes of water for cooling. In both Europe and the United States, nuclear plants have had to reduce power output or shut down during some drought periods (GAO 2006). Water requirements—especially as global warm-ing leads to more drought conditions in some regions—could limit the expansion of nuclear power. Nuclear power is sometimes touted as a “domestic” energy resource, although the United States imports about 80 percent of its nuclear fuel. These imports come primarily from stable and friendly countries: Canada, Australia, and South Africa. However, nuclear power will displace little if any imported oil from less stable and potentially less friendly regions, because the United States produces very little electricity from oil today. Furthermore, overseas corporations such as AREVA, a French-based company, and Mitsubishi Heavy Industries, which is based in Japan, will make most major components for nuclear plants. Siting and permitting nuclear facilities present other significant challenges. While many surveys have shown growing public acceptance of nuclear power during the
last few years, people still generally rank it lower than all other sources of electricity except perhaps coal. The NRC has significantly streamlined its process for licens-ing nuclear power plants to limit opportunities for in-terest groups to challenge them, but this process has yet to be tested. While nuclear plants may make a significant long-term contribution to reducing U.S. carbon emissions, they are unlikely to do so before at least 2030. Beyond the challenges just noted, the nation would have to re-build its civilian nuclear infrastructure, which has been in decline for two to three decades. For example, nuclear engineering programs in the United States have declined by half since the mid-1970s, and only 80 companies are qualified to pro- duce nuclear-grade materials, down from 400 two decades ago. Most important, only two manufac- turing facilities in the world are capable of making heavy components for nuclear plants, such as reactor pressure vessels—although AREVA announced its in-tention to build a vessel in Virginia with Northrop Grumman Corp. As a result, the Organization for Economic Co- operation and Development has estimated that the in-dustry can produce an average of only 12 plants per year worldwide until about 2030, rising to 54 plants per year from 2030 to 2050 (OECD 2008). Although the United States represents about one-quarter of global energy use and carbon emissions, it is unlikely that developers would install more than three or four U.S. plants per year before 2030.44
Scaling up the nuclear industry to make a long-term contribution along the lines suggested by MIT ana-lysts—1,000 to 1,500 new 1,000-megawatt plants worldwide, with 300 in the United States—would require the construction of 11 to 22 new enrichment facilities, as well as a new Yucca Mountain-sized waste repository somewhere in the world every four years (MIT 2003, The Keystone Center 2007). These facili-ties would pose great challenges for preventing prolif-eration of radioactive materials that could be used for weapons—as well as for siting those facilities. However, given the pressing need for cuts in carbon emissions of 80 percent or more by mid-century, the nuclear power option should not be off the table. Instead, it should receive R&D funding aimed at resolving these critical challenges.
44 Installing more than that amount in the United States could actually worsen global warming, by diverting reactors from countries such as China that use more coal and have higher rates of carbon emissions.
Challenges

90 U n i o n o F C o n C e r n e d s C i e n t i s t s : C l i m at e 2 0 3 0 C h a p t e r 5 : F l i p p i n g t h e s w i t C h t o C l e a n e r e l e C t r i C i t y 91
The industry hopes to make a number of advanced reactor designs—referred to as Generation IV—avail-able sometime after 2025 to 2030. These designs aim to achieve much higher safety levels and lower costs. The industry faces numerous challenges in meeting
those goals, however, and we cannot meaningfully eval-uate the prospects that it will do so at this time (UCS 2007a). In any case, such reactors are not expected to be commercially available until after the time period we analyzed.
• escalation of construction costs. We included re-cent increases in construction and commodity costs for all technologies, based on data from ac-tual projects, input from experts, and power plant cost indices. We assumed that the costs of all tech-nologies continue to rise 2.5 percent per year (after accounting for inflation) until 2015.
• wind. We included land-based, offshore, and small wind technologies. We based our capital costs on a large sample of actual projects from a database at Lawrence Berkeley National Laboratory (LBNL). We used an analysis from the National renewable en-ergy Laboratory (NreL), conducted for the eIa, to develop regional wind supply curves that include added costs for siting, transmitting, and integrating wind power as its use grows. We also assumed in-creases in wind capacity factors (a measure of pow-er production) and a 10 percent reduction in capital costs by 2030 from technological learning, based on assumptions from a report from the DOe on pro-ducing 20 percent of U.S. electricity from wind power by 2030 (eere 2008).
• solar. We assumed expanded use of concentrating solar power (CSp) and distributed (small-scale) and utility-scale photovoltaics through 2020, based on actual proposals. We also assumed faster learning for solar photovoltaics, to match the eIa’s assump-tions for other emerging technologies. We assumed that the amount of heat that CSp can store to pro-duce electricity during periods of high demand rises over time.
• Bioenergy. Key technologies included burning biomass along with coal in existing coal plants,
Box 5.4.
Key Assumptions for Technologies Used to Produce Electricity
dedicated biomass gasification plants, the use of biomass to produce combined heat and power in the industrial sector, and the use of methane gas from landfills.
• geothermal. We included a supply curve for hydro-thermal and enhanced geothermal systems in the West, developed by NreL and other experts. this supply curve incorporates recent increases in the costs of exploring potential sites, drilling, and build-ing geothermal power plants.
• hydropower. We assumed incremental amounts of hydropower from upgrades and new capacity at ex-isting dams, and counted both new sources of power as contributing to a national standard for renewable electricity.
• Carbon capture and storage. We included this as an option for advanced coal gasification and natural gas combined-cycle plants, with costs and performance based on recent studies and proposed projects.
• nuclear. We assumed that existing plants are reli-censed and continue to operate through their 20-year license extension, and that they are then retired, as the eIa also assumes. We based assumptions on the costs and performance of new advanced plants primarily on recent project proposals and studies.
• transmission. We included the costs of new capac-ity for transmitting electricity for all renewable, fos-sil, and nuclear technologies. We also added costs for the growing amounts of wind power, based on the NreL analysis conducted for the eIa.
(See appendix D online for more details.)
90 U n i o n o F C o n C e r n e d s C i e n t i s t s : C l i m at e 2 0 3 0 C h a p t e r 5 : F l i p p i n g t h e s w i t C h t o C l e a n e r e l e C t r i C i t y 91
poliCies in the reFerenCe Case
• state renewable electricity standards. these specify the amount of electricity that power suppli-ers must obtain from renewable energy sources. We replaced the eIa’s estimate with our own pro-jections for state standards through 2030. We ap-plied those projections to the 28 states—plus Washington, DC—with such standards as of No-vember 2008.
• tax credits. We included the tax credit exten-sions for renewable energy and advanced fossil fuel technologies that were part of the economic Stimulus package (h.r. 6049) passed by Congress in October 2008.
• nuclear loan guarantees. We assumed that the $18.5 billion in loan guarantees spur the construc-tion of four new nuclear plants with 4,400 mega-watts of capacity by 2020, based on applications received by the U.S. Department of energy in October 2008.
Box 5.5.
Key Assumptions for Electricity Policiesadditional poliCies in the BlUeprint
• efficiency. policies to increase energy efficiency in buildings and industry (see Chapter 4) reduce elec-tricity demand 35 percent by 2030 compared with the reference case.
• Combined heat and power (Chp). policies and incentives to increase the use of natural gas com-bined-heat-and-power systems in industry and commercial buildings (see Chapter 4) enable this technology to provide 16 percent of U.S. electricity generation by 2030.
• national renewable electricity standard. this standard requires retail electricity providers to ob-tain 40 percent of remaining electricity demand (after reductions for efficiency improvements and Chp) from renewable energy (wind, solar, geother-mal, bioenergy, and incremental hydropower) by 2030.
• Coal with carbon capture and storage (CCs) dem-onstration program. this new federal program pro-vides $9 billion to cover the incremental costs of adding CCS at eight new, full-scale advanced coal plants—known as integrated gasification combined-cycle plants, which turn coal into gas—from 2013 to 2016 in several regions.
5.3.5. Key Policies for Advanced Nuclear PowerBoth the Reference and Blueprint cases in-
clude existing incentives and policy support for the next generation of nuclear power plants. For example, both cases include the existing production tax credit of 1.8 cents per kilowatt-hour (adjusted annually for inflation) for new nuclear plants that begin operation by 2020. The credit is available for the first eight years of operation, and is limited to $125 million per giga- watt of capacity annually, up to 6 gigawatts of total new capacity. However, if more than 6 gigawatts are under construction by January 1, 2014, those plants can share in the credits. Both the Reference and Blueprint cases also include up to $18.5 billion in incentives available through the DOE’s current loan guarantee program. In October
2008, the DOE received applications from 17 compa-nies to build 21 new reactors at 14 nuclear plants. Those projects—which would provide a total of 28,800 mega-watts of capacity—would qualify for $122 billion in loan guarantees. Because not enough funding is avail-able for all the projects, and because the details of each one are unavailable, we simply assumed that the loan guarantees will spur the development of 4,400 mega-watts of new nuclear capacity by 2030 ($18.5 billion divided by $122 billion times 28,800 megawatts). The Blueprint’s economywide cap-and-trade policy would provide an additional incentive to build new nuclear plants rather than coal and natural gas plants, because owners of the latter would have to buy allow-ances to emit carbon. The Blueprint case does not assume any additional policy support for advanced nuclear plants.
Policies