flexible pavement design for widening : a case study of sh-8 (stretch from tarapur to vasad)
DESCRIPTION
Presentaion on --> Flexible Pavement Design for Widening : A Case Study of SH-8 (Stretch from Tarapur to Vasad)TRANSCRIPT

Flexible Pavement Design for Widening : A Case Study of SH-8 (Stretch from Tarapur to Vasad)
Prepared By:
Hardik H Patel
Enrollment No : 110080719005
M.Tech Transportation System Engg.
BVM Enginnering College, V V Nagar
Guided By: Co - Guided By:
Asst. Prof. Amit A Vankar Professor Dr. L.B. Zala
Transportation System Engg. Dept. Transportation System Engg.Dept.
BVM Engineering College, V V Nagar BVM Engineering College, V V Nagar
1
Approach to Globalization
Effective communication is a key to national progress.India is located in a region where South-Asia convergeswith Central Asia and the Middle East. Blessed withextensive natural resources and rich agriculturalland, it improves its economy particularly by exportingvaluable items.
Introduction
2
In order to improve trade and economicactivities and to materialize regional linkages withChina, Pakistan, Shrilanka, Bangladesh and otherneighboring Central Asian countries, the country isgearing up towards a large infrastructure network.

Flexible Pavements are widely used despite some doubtsregarding their economics under different conditions.Two most important parameters that governs thepavement design are soil sub-grade and traffic loading.The Indian guidelines for the design of flexible pavementsuse soil sub-grade strength in terms of California BearingRatio and traffic loading in terms of million standardaxles (msa).
Introduction
3
Design comprises the interplay of several variables suchas, wheel loads, climate, terrain and sub-gradeconditions.

4
Data Collection
Data Analysis
Conclusion & Recommendation
Problem Identification
Literature Review
Study Area Profile
Turning Movement Counts
Axle Load Survey
Traffic Volume Survey
Grain Size Analysis
Atterberg Limits
Proctor Density Test
California Bearing Ratio
Existing Pavement Composition
Methodology

Deficiencies and Issues
Operation
Road capacity augmentation
Congestion and delays through built-up areas
No access control
Vehicle competing with slow moving vehicle for the pavement space
Deficient road surface conditions (roughness)
Uncontrolled roadside developments and encroachments
Problem Justification
5

Safety
Exposed roadside hazards
No pavement markings
Inadequate traffic signs
Conflict with pedestrian, cattle, slow vehicles
Road
Poor pavement condition and structural inadequacy
6
Problem Justification

Aim of Study
Aiming to facilitate to design for widening the pavement entail to rectify theproblem of traffic accumulation and provision of superior transportationservice. Study stretch has requisite to Widening of State Highway-8mentioned route of Tarapur (Km 00+000) - Borsad (Km 29+340) - Vasad (Km48+900) from 2 Lane to 6 lane.
Improve Road Network is the one of important reason of transportationsystem at the city level. Such big project influences on neighboringenvironment.
7

Objectives
To identify the soil characteristics within study area stretch
To define the traffic volume and data interpretation of axle load survey
To find v/c ratio and suggest widening
Strengthen the existing pavement so that it can carry the anticipated traffic for design period
To design the pavement layer for widening to whole stretch
8
3 Preamble
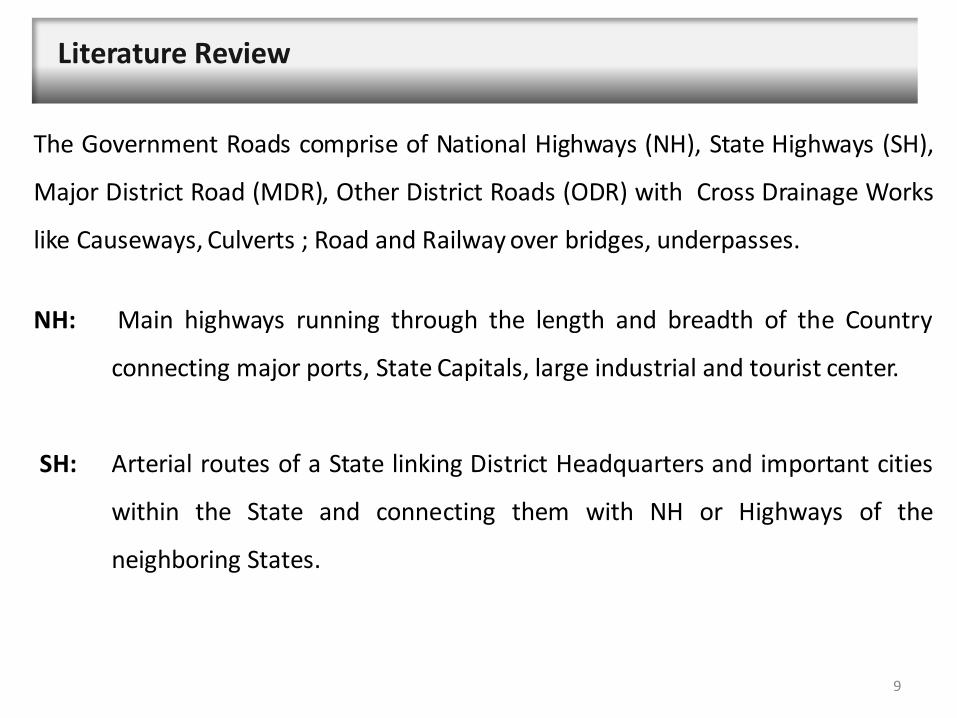
The Government Roads comprise of National Highways (NH), State Highways (SH),
Major District Road (MDR), Other District Roads (ODR) with Cross Drainage Works
like Causeways, Culverts ; Road and Railway over bridges, underpasses.
NH: Main highways running through the length and breadth of the Country
connecting major ports, State Capitals, large industrial and tourist center.
SH: Arterial routes of a State linking District Headquarters and important cities
within the State and connecting them with NH or Highways of the
neighboring States.
Literature Review
9

MDR: Important roads within a district serving areas of production and markets
and connecting those with each other or with main highways
ODR: Roads serving rural areas of production and providing them with outlet to
market centers, taluka headquarters, Block Development headquarters or
other main roads
10

11
Table 2.1 Category wise Road Length*
Road Classification Total Road Length (Km)
National Highways 70,934 + 40,000 Km under
implementation
State Highways 1,54,522
Major and other District Roads 25,77,396
Rural and other Roads 14,33,577
Total Road Length 42,36,429 Km
*Source : National Highway Authority of India ; http://en.wikipedia.org/wiki/Indian_Highways
12
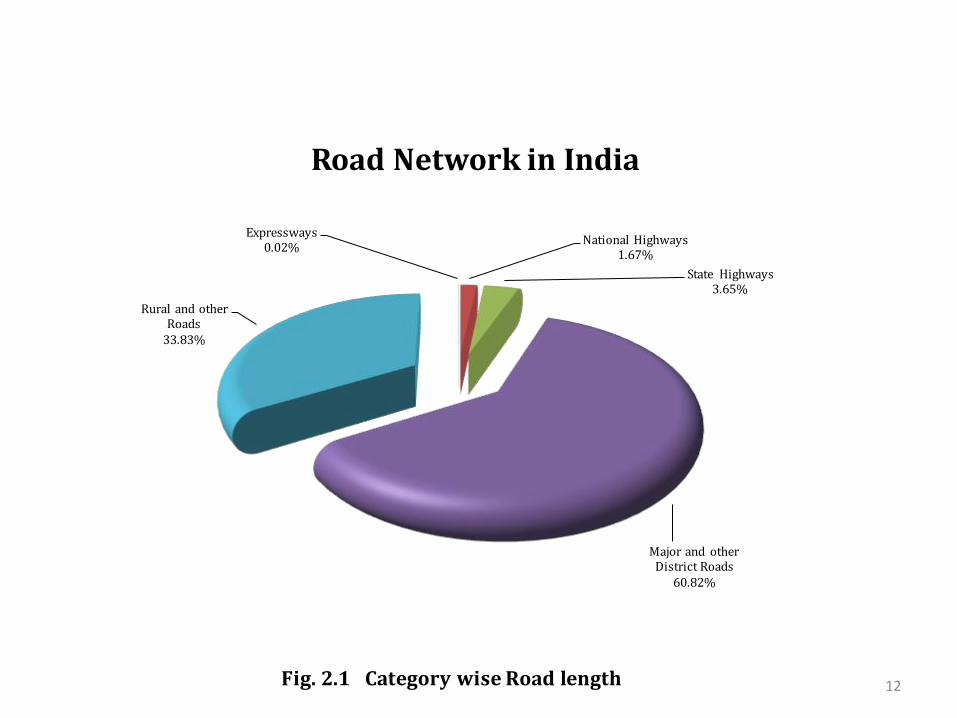
Expressways0.02%
National Highways1.67%
State Highways3.65%
Major and other District Roads
60.82%
Rural and other Roads
33.83%
Road Network in India
Fig. 2.1 Category wise Road length

13
Kilometers in
2001
Kilometers as
of May 2011
Kilometers
under
construction in
2011
Total Rural Roads 2.7 million 3.1 million 0.1 million
Paved, not maintained Rural
Roads0.5 million
Unpaved Rural Roads 2.2 million 1.9 million
Paved, maintained Rural
Roads7,28,871 53,634
New Rural Roads 3,22,900 82,734
Rural Road Network in India, tends over 10 years*
*Source: Annual Report 2010-11, Ministry of Road Transport and Highways, Government of India

Factors for design of pavements
• Design wheel load Static load on wheels
Contact Pressure
Load Repetition
• Subgrade soil Thickness of pavement required
Stress- strain behaviour under load
Moisture variation
• Climatic factors
• Pavement component materials
• Environment factors
• Traffic Characteristics
• Required Cross sectional elements of the alignment

Subgrade Soil Strength
Assessed in terms of CBR of subgrade
soil for most critical moisture conditions.
• Soil type
• Moisture Content
• Dry Density
• Internal Structure of the soil
• Type and Mode of Stress Application.
IS 2720 Part 8

Traffic Data
Initial data in terms of number of commercial vehicles per day (CVPD).
Traffic growth rate during design life in %
Design life in number of years.
Distribution of commercial vehicles over the carriage way
In terms of Cumulative Vehicles/day
Based on 7 days 24 hours Classified Traffic
National Highways and State Highways : 15 Years
Expressways and Urban Roads : 20 Years
Other Category Roads : 10 to 15 Years
17
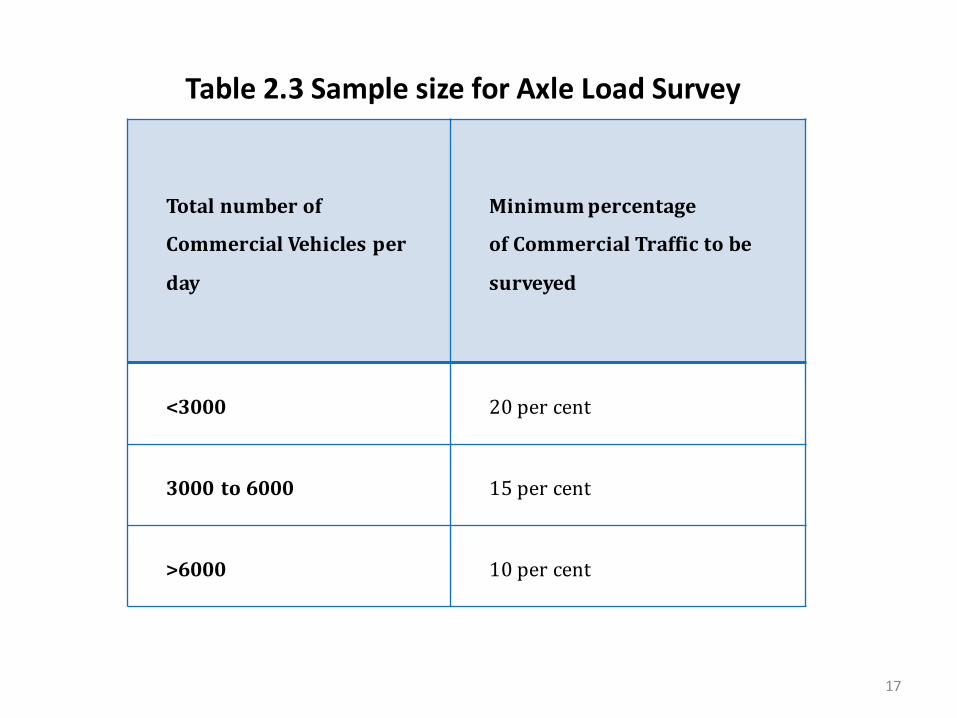
Total number of
Commercial Vehicles per
day
Minimum percentage
of Commercial Traffic to be
surveyed
<3000 20 per cent
3000 to 6000 15 per cent
>6000 10 per cent
Table 2.3 Sample size for Axle Load Survey
18
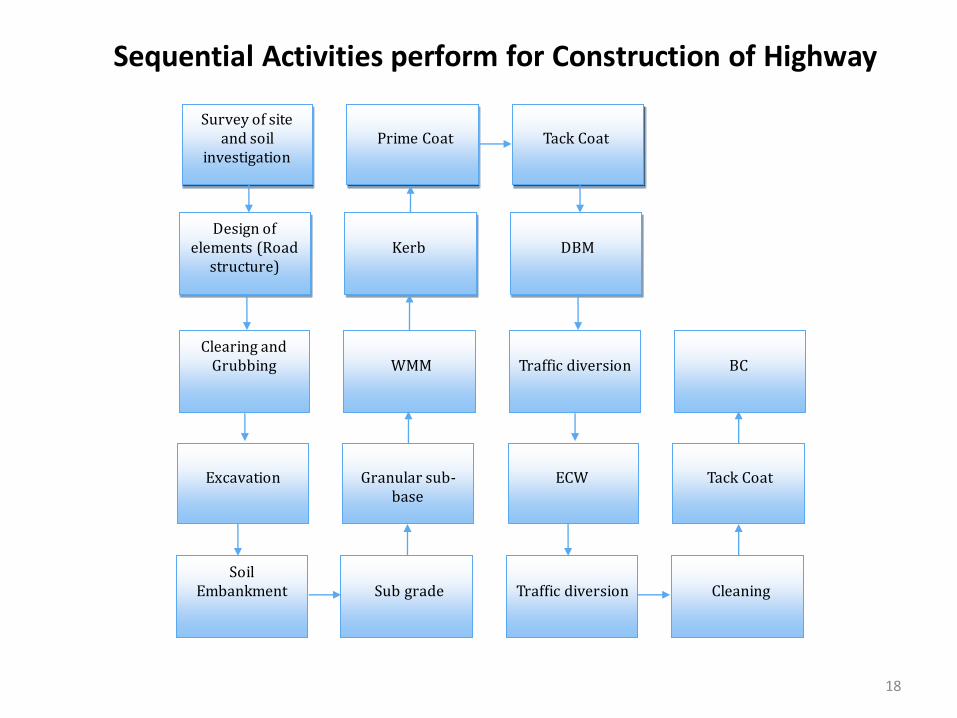
Survey of site and soil
investigation
Design of elements (Road
structure)
Clearing and Grubbing
Excavation
Soil Embankment
Tack Coat
DBM
Traffic diversion
ECW
Traffic diversion
Prime Coat
Kerb
WMM
Granular sub-base
Sub grade
BC
Tack Coat
Cleaning
Sequential Activities perform for Construction of Highway
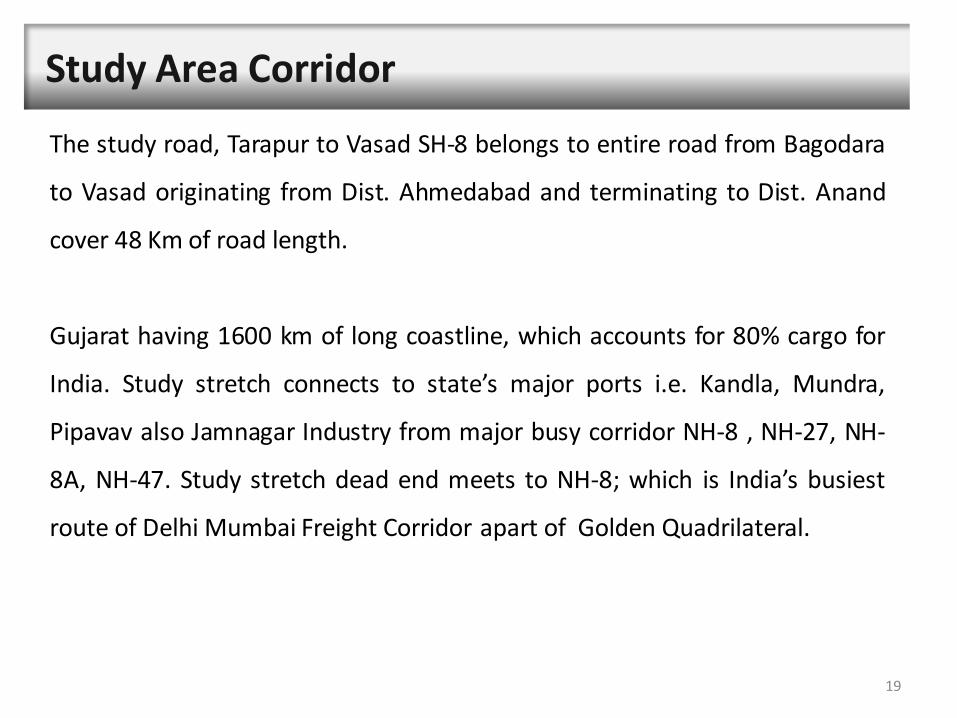
Study Area Corridor
The study road, Tarapur to Vasad SH-8 belongs to entire road from Bagodara
to Vasad originating from Dist. Ahmedabad and terminating to Dist. Anand
cover 48 Km of road length.
Gujarat having 1600 km of long coastline, which accounts for 80% cargo for
India. Study stretch connects to state’s major ports i.e. Kandla, Mundra,
Pipavav also Jamnagar Industry from major busy corridor NH-8 , NH-27, NH-
8A, NH-47. Study stretch dead end meets to NH-8; which is India’s busiest
route of Delhi Mumbai Freight Corridor apart of Golden Quadrilateral.
19

20
(Tarapur : 22°29'39.69"N 72°38'49.13"E ; Vasad : 22°27'40.01"N 73° 3'57.09"E )
Image Source: Google Earth 6.2.2.6613; Map of India www.mapsofindia.com/maps/Gujarat/

The study area is primarily agrarian in character and a vast
area is covered with matured as well as growing trees
commonly of type Babool, Khejri, Neem and Imli and rapidly
growing with different crops. The principal agricultural crop
are:paddy, wheat, pulses, oilseeds, sugarcane, potato,
different vegetable and horticulture and forest products[4].
Economic Characteristics
21

A number of small-scale production units of various types
are in operation in Anand district of Gujarat. These include
Bricks, iron and steel fabrication, earthen pots, lime
(choona), milk product (ghee), clothes, minerals, shoes and
furniture making etc.
Economic Characteristics
22

Demographic Features
The study stretch from part of Anand District, which have following demographic features:
The size of population of Anand District is approximately – 20,90,276 ; (male – 10,88,253 ; Female – 10,02,023)
23
52.06%
47.94%
male Female
Population
Population
24
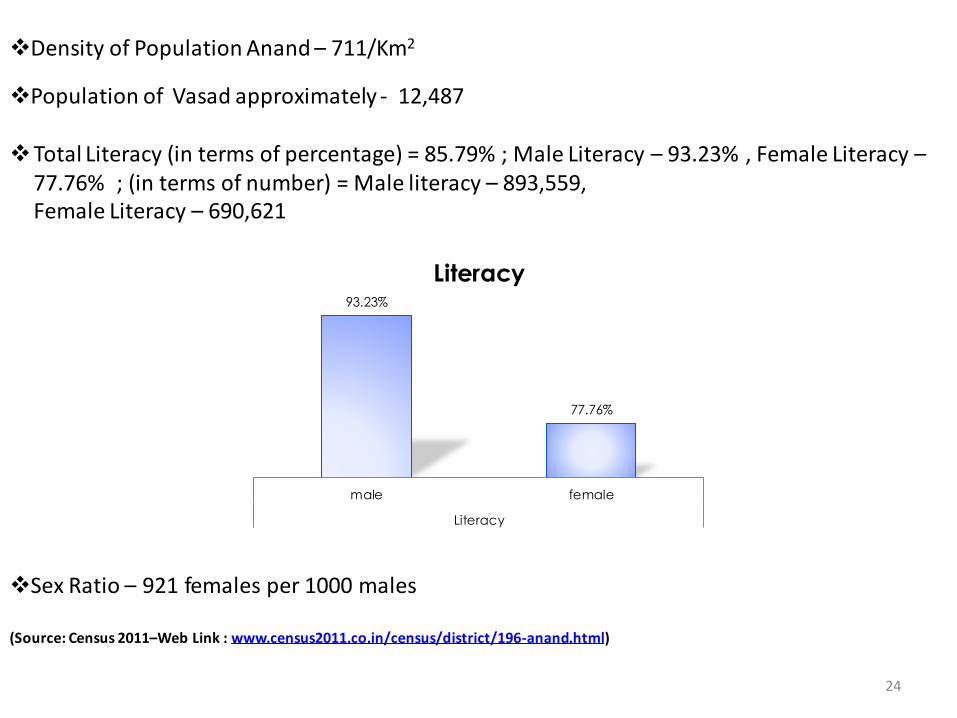
Density of Population Anand – 711/Km2
Population of Vasad approximately - 12,487
Total Literacy (in terms of percentage) = 85.79% ; Male Literacy – 93.23% , Female Literacy –77.76% ; (in terms of number) = Male literacy – 893,559, Female Literacy – 690,621
Sex Ratio – 921 females per 1000 males
(Source: Census 2011–Web Link : www.census2011.co.in/census/district/196-anand.html)
93.23%
77.76%
male female
Literacy
Literacy

25
ANAND UMRETH PETLAD SOJITRA BORSAD ANKLAV KHAMBHAT TARAPUR
VR 93.52 40.7 85.7 43.15 141.2 24.9 75.92 24
ODR 1.4 4.9 13.9 5.6 19.2 5.6 31.2 41.4
MDR 35.1 17.1 40.7 22.4 44.5 13.6 44.9 17
SH 99.25 68 67.75 25.5 73.5 36.5 84.25 42.25
NH 26 0 0 0 0 0 0 0
NE 26 0 0 0 0 0 0 0
0
20
40
60
80
100
120
140
160
Ro
ad
Le
ngt
h in
Km
Category wise Road Length distribution in different Talukas
Adjacent to the study stretch there are 25 villages namely Adas, Khadol,
Sundan, Joshikuva, Anklav, Dahemi, Kasumbad, Nisraya, Bhadran, Rudel, Vahera,
Dhundakuva, Nahapa, Silvai, Pandoli, Dharmaj, Vatadra, Nagra, Finav, Vadadla,
Nar Town, Runaj, Parol, Sath, Balinta.
Almost all villages have bus facilities and few villages have direct access to
Railway Services.
Almost all the villages have paved and mud roads though it can be said that
more improvement is necessary in this sector.
26
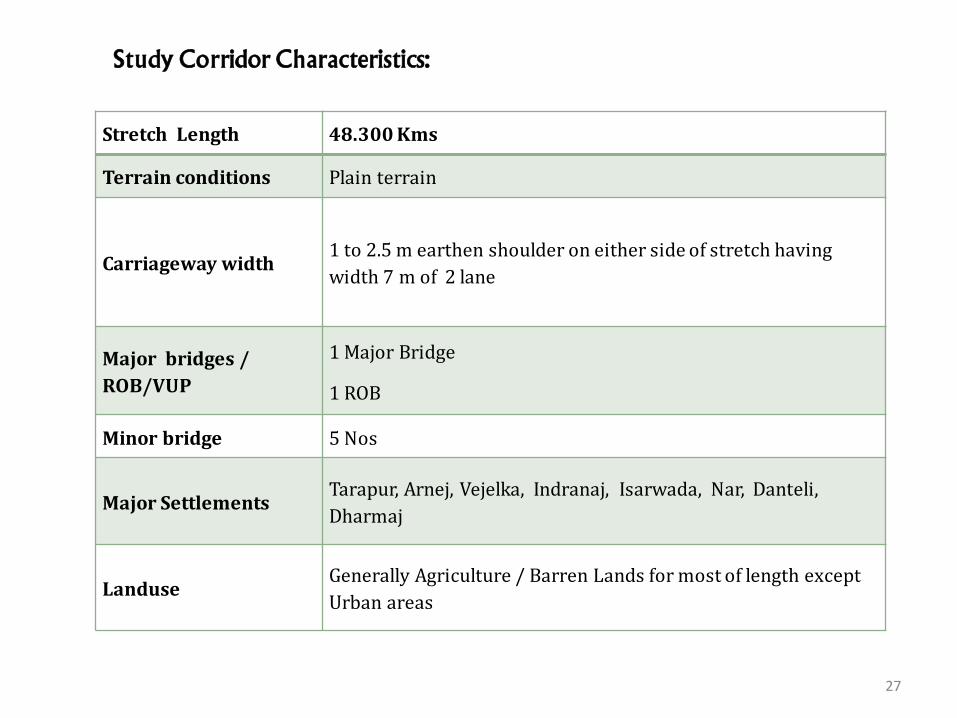
Study Corridor Characteristics:
27
Stretch Length 48.300 Kms
Terrain conditions Plain terrain
Carriageway width1 to 2.5 m earthen shoulder on either side of stretch having
width 7 m of 2 lane
Major bridges /
ROB/VUP
1 Major Bridge
1 ROB
Minor bridge 5 Nos
Major SettlementsTarapur, Arnej, Vejelka, Indranaj, Isarwada, Nar, Danteli,
Dharmaj
LanduseGenerally Agriculture / Barren Lands for most of length except
Urban areas

Original Ground elevation Profile
Original Ground Elevation of Study corridor
Ground elevation falls and rises along study stretch ; Tarapur @Km. 00+000 elev. 19m , Borsad
@ Km. 29+340 elev. 37m , Vasad @ Km.48+900 elev. 32m at an eye altitude 43.52 Km.
(Source : Google Earth 6.2.2.6613)
28

29
Data Collection and Analysis

30
Schematic Diagram of the location of collected soil sample

31
Collection of Soil Samples
32
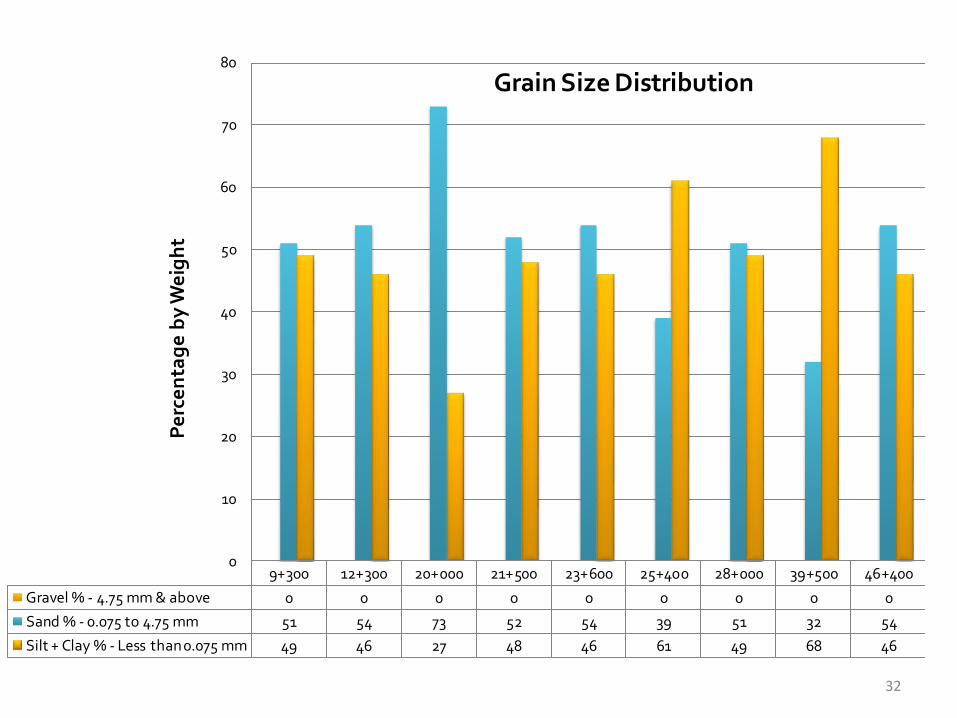
9+300 12+300 20+000 21+500 23+600 25+400 28+000 39+500 46+400
Gravel % ‐ 4.75 mm & above 0 0 0 0 0 0 0 0 0
Sand % ‐ 0.075 to 4.75 mm 51 54 73 52 54 39 51 32 54
Silt + Clay % ‐ Less than 0.075 mm 49 46 27 48 46 61 49 68 46
0
10
20
30
40
50
60
70
80
Pe
rce
nta
ge
by
We
igh
t
Grain Size Distribution
33
SC
34%
SM
11%
SM-SC
33%
CI
22%
% of Soil Classification
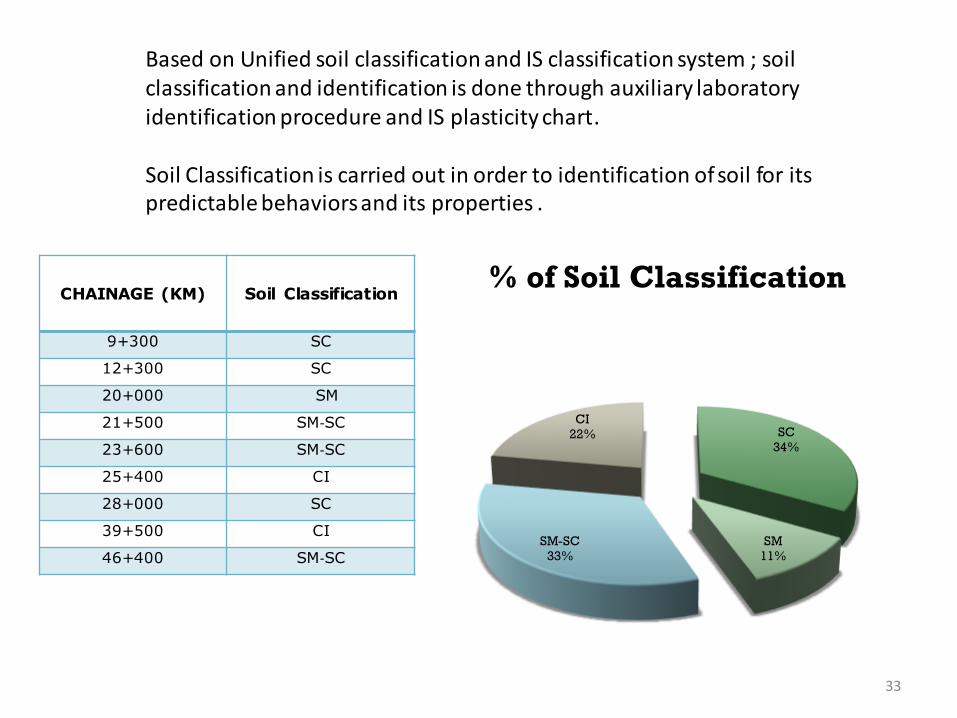
Based on Unified soil classification and IS classification system ; soil classification and identification is done through auxiliary laboratory identification procedure and IS plasticity chart.
Soil Classification is carried out in order to identification of soil for its predictable behaviors and its properties .
CHAINAGE (KM) Soil Classification
9+300 SC
12+300 SC
20+000 SM
21+500 SM‐SC
23+600 SM‐SC
25+400 CI
28+000 SC
39+500 CI
46+400 SM‐SC

34
9+300 12+300 20+000 21+500 23+600 25+400 28+000 39+500 46+400
Atterberg Limit % LL 33 30 25 28 28 37 34 38 28
Atterberg Limit % PI 12 8 0 7 7 15 13 16 7
0
5
10
15
20
25
30
35
40
Perc
en
tag
e o
f LL &
PI
Liquid Limit & Plasticity Index
NP

35
1.986
1.989
1.994
1.972
1.974
1.956
1.986
1.95
1.964
11.8 11.7
9.29.9 9.9
12.3
11.512.2
10.9
9+300
12+000
20+000
21+500
23+600
25+400
28+000
39+350
46+400
MDD OFC
Maximum Dry Density & Optimum Moisture Content by Modified Proctor Test IS : 2720 Part VII
Chainage

36
CBR Test

37
10.5
8.7
14.515.1 15.2
7.9
14.5
8.1
14.4
0
2
4
6
8
10
12
14
16
9+300
12+000
20+000
21+500
23+600
25+400
28+000
39+350
46+400
After CBR test was performed , there are different CBR values obtained for study stretch on different chainages
Chainage
CB
R %

38Test Pit for pavement composition
From test pits on existing
pavement it is noted that existing
crust thickness is around 810 mm
with following pavement
composition
Pavement Layer Thickness in mm
BC 70
DBM 100
WMM 300
Bituminous layer 40
Boulder soling 300
Total 810
Existing Pavement Composition

39
Composition of Average Daily Traffic at Tarapur
1
717
2545
1228
1558
53
780
1911
3705
1863
840
328
23 20
500
1000
1500
2000
2500
3000
3500
4000
MA
V
2 A
xle
3 A
xle
4-6
Axl
e
LC
V
Min
i B
us
Pri
va
te B
us
Sta
te B
us
Sch
oo
l B
us
Ca
r
2 W
hee
ler
Rik
shaw
Tra
cto
r
Tra
cto
r T
roll
y
An
imal
Dra
wn
Commercial Public Transport Passenger Agricultural NMV
No
. of
Veh
.At different location on study stretch classified volume count survey was
carried out . Classified Average Daily Traffic is computed.

40
Composition of Average Daily Traffic at Borsad
NMV
1
1063
2640
1267 1181
51
621
306
28
3809
2095
1150
84 31 30
500
1000
1500
2000
2500
3000
3500
4000M
AV
2 A
xle
3 A
xle
4-6
Axl
e
LCV
Min
i Bu
s
Priv
ate
Bus
Stat
e B
us
Sch
ool B
us
Car
2 W
heel
er
Rik
shaw
Trac
tor
Tra
cto
r T
rolly
An
imal
Dra
wn
Commercial Public Transport Passenger Agricultural
No
. of
Veh
.

41
Average daily Traffic and Passenger Car Units at Tarapur and Borsad
13834
24891
14330
25919
0
5000
10000
15000
20000
25000
30000
Total Veh. Total PCU Total Veh. Total PCU
At Tarapur At Borsad

42
Traffic Forecasting
Traffic Growth Rate
The present day traffic has to be projected for the end of design life at growth rates (“r”) estimated by studying and analyzing the following data:
(i) The past trends of traffic growth; and
(ii) Demand elasticity of traffic with respect to macro-economic parameters (like GDP or SDP) and expected demand due to specific developments and land use changes likely to take place during design life.
If the data for the annual growth rate of commercial vehicles is not available or if it is less than 5 per cent, a growth rate of 5 per cent should be used (IRC:SP:84-2009)
43
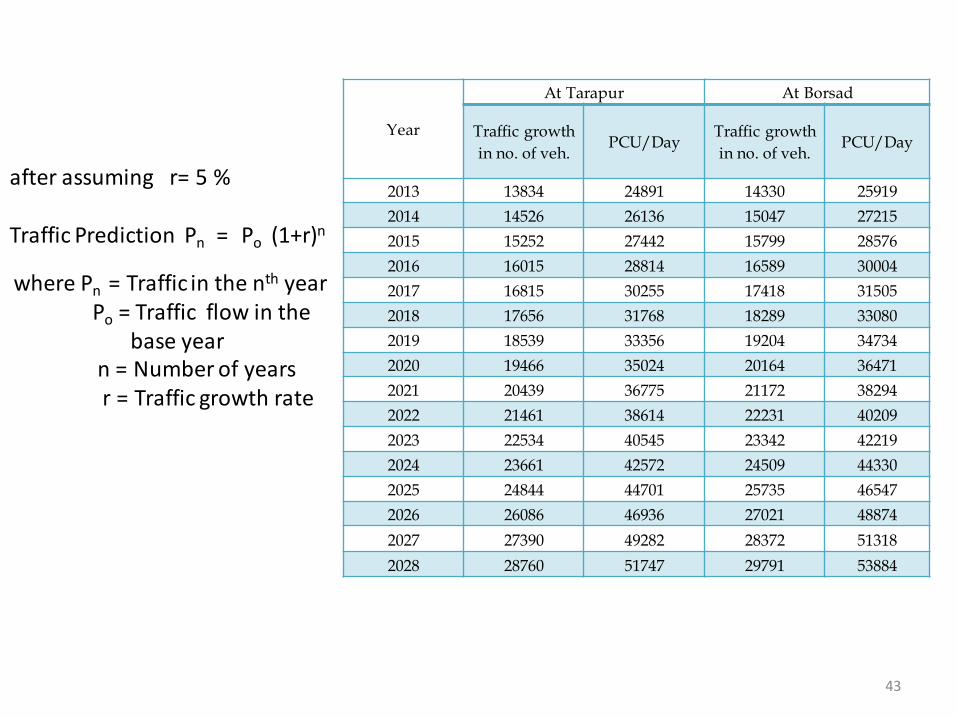
after assuming r= 5 %
Traffic Prediction Pn = Po (1+r)n
where Pn = Traffic in the nth yearPo = Traffic flow in the
base year n = Number of years r = Traffic growth rate
Year
At Tarapur At Borsad
Traffic growth
in no. of veh.PCU/Day
Traffic growth
in no. of veh.PCU/Day
2013 13834 24891 14330 25919
2014 14526 26136 15047 27215
2015 15252 27442 15799 28576
2016 16015 28814 16589 30004
2017 16815 30255 17418 31505
2018 17656 31768 18289 33080
2019 18539 33356 19204 34734
2020 19466 35024 20164 36471
2021 20439 36775 21172 38294
2022 21461 38614 22231 40209
2023 22534 40545 23342 42219
2024 23661 42572 24509 44330
2025 24844 44701 25735 46547
2026 26086 46936 27021 48874
2027 27390 49282 28372 51318
2028 28760 51747 29791 53884

44
2489126136
2744228814
30255
31768
33356
35024
36775
38614
40545
42572
44701
46936
49282
51747
24500
27500
30500
33500
36500
39500
42500
45500
48500
51500
2012 2014 2016 2018 2020 2022 2024 2026 2028 2030
PC
Us
Year
Future trend of PCUs
Future trend of PCUs at Tarapur junction

45
2591927215
28576
30004
31505
33080
34734
36471
38294
40209
42219
44330
46547
48874
51318
53884
25000
28000
31000
34000
37000
40000
43000
46000
49000
52000
2012 2014 2016 2018 2020 2022 2024 2026 2028 2030
PCU
s
Year
Future trend of PCUs
Future trend of PCUs at Borsad junction

46
VOLUME/CAPACITY RATIO
JUSTIFICATION FOR WIDENING
V/C Ratio is summarized in order to get Volume-Capacity of existing study
corridor.
Assessment is based on IRC:64-1990 Guideline for Capacity of Road in Rural
Areas. The details of V/C ratio is presented in below Table.
Count PostNo. of
Lane
Width in
meter
Volume
PCU/DayDSV Capacity V/C Ratio
Tarapur
Junction2 3.75 24891 15000 30000 0.83
Borsad
Junction2 3.75 25919 15000 30000 0.86
The V/C ratio is 0.83 to 0.86, which is near to 1, hence capacity is to be increased
by widening the existing corridor. The widening is suggested by adding 4 lanes
to existing 2 lanes for long term solution.

47
DESIGN OF PAVEMENT LAYERS
Having CVPD, VDF, traffic growth rate, design life; the cumulative million standards axles is
computed as :
𝐍 =𝟑𝟔𝟓 × [(𝟏 + 𝐫)𝐧 − 𝟏] × 𝐀× 𝐃 × 𝐅
𝐫
Location Tarapur Borsad
Design Life
(years)10 15 10 15
Cumulative
standard
axles (msa)
84 156 86 158
Plate no.6, 7, 8, pg.27, 28; IRC:37-2012,in order to obtain pavement thickness Cumulative
Standard axles repetition is adopted 158 msa among its higher value for whole study stretch.

48
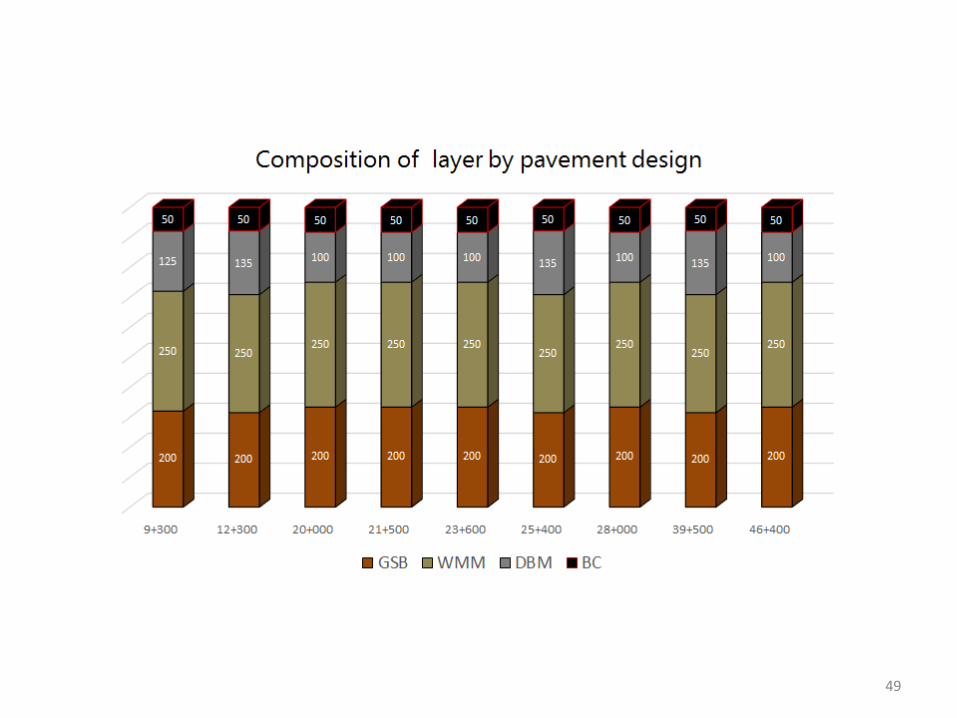
Composition of subsequent layers of pavement is calculated from above data and given in below
table
Ch
ain
ag
e(K
m)
CB
R %
Thickness of Layers (mm)
Total
Thickness
(mm)BC
DB
M
WM
M
GSB
9+300 10.5 50 125 250 200 625
12+300 8.7 50 135 250 200 635
20+000 14.5 50 100 250 200 600
21+500 15.1 50 100 250 200 600
23+600 15.2 50 100 250 200 600
25+400 7.9 50 135 250 200 635
28+000 14.5 50 100 250 200 600
39+500 8.1 50 135 250 200 635
46+400 14.4 50 100 250 200 600
Composition of diff. Layers of Pavement for Design Life n=15 years
49
50
Different type of soil have different characteristics, it is essential to have recognizance and
evaluation of particular soil on which pavement structure is being constructed. Transient
traffic loading and its effects may high if higher number of vehicles may pass. Based on
IRC:37-2012 pavement life for state highway is minimum 15 years but beside it
conventional planning for design for widen the existing road may 27 years, so its
necessary to design the pavement for initial 15 years and further
overlaying for strengthening will carried out.
CONCLUSION

51
State Highway-8 route link Bagodra - Vataman - Tarapur - Dharmaj -Borsad – Vasad having
total length 101.76 km originating in district Ahmedabad and terminating in district Anand.
This stretch will connect South Gujarat and Saurashtra region. It is expected to ease the
traffic situation on the NH 8. The road will also provide connectivity to NH-8 to NH-27, NH-
47. Based on huge advantages it is expected to widen the existing pavement to minimize
traffic congestion and carry the anticipated traffic load.
RECOMMENDATION

References
1. Feasibility cum Preliminary Design Report for NH-11, NHDP Phase-III, Rajasthan
2. “Highway Engineering” by Khanna. S. K., Justo. C. E. G., Nem Chand and Bros, Roorkee, U.K., India
3. Jha, Bindur Kant., and Aman Kumar (2009), “ Performance of Bituminous Mixes-A Case Study “ Indian Highways.
4. “ Manual for Construction and Supervision of Bituminous Works “, Publication of Indian Roads Congress, 2001.
5. “Specifications for Raod and Bridge Works” Ministry of Shipping, Road Transportation & Highways, Indian Road Congress, 2001
6. “Traffic Engineering and Transportation Planning” by Kadiyali. L. R., Khanna Publication 52
53
7. Bindra S.P., “A Course in Highway Engineering”, 5th edition, Dhanpat RaiPublication, 2012
8. IRC:36-2010 Recommended Practice for Construction of Earth Embankments and Sub-Grade for Road Works (First Revision)
9. IRC:37-2012 Tentative Guidelines for the Design of Flexible Pavements
10. IRC:SP:-84-2009 Manual for Specification & Standards for Four Laning of Highways through Public Private Partnership
11. Khanna S.K., Justo C.E.G , “Highway Engineering”, 9th edition, Nem Chand & BrosRoorkee, U.K, India, 2011
12. Yoder E.J., Witczak M.W., “Principles of Pavement Design”, 2nd edition, John Willey & Sons, 1975
References

54
13. http://www.nhai.org/roadnetwork.htm
14. National Highway Development Project -http://en.wikipedia.org/wiki/nationalhighways_develepment_project
15. Golden Quadrilateral -http://en.wikipedia.org/wiki/national_golden_quadrilateral
16. www.census2011.co.in/census/district/196-anand.html
References

55