flash report soundenergy plc - francesco maggioni flash report sou_… · 2 figure 2: soundenergy...
TRANSCRIPT
1
Flash Report SoundEnergy PLC follow me October 6th, 2015
Francesco Maggioni [email protected] IT +39 393 70 40 234 UK +44 757 681 62 43
“Quantitative approach for asymmetric results”
Playing the bottom on Oil with an extra bet(a) company
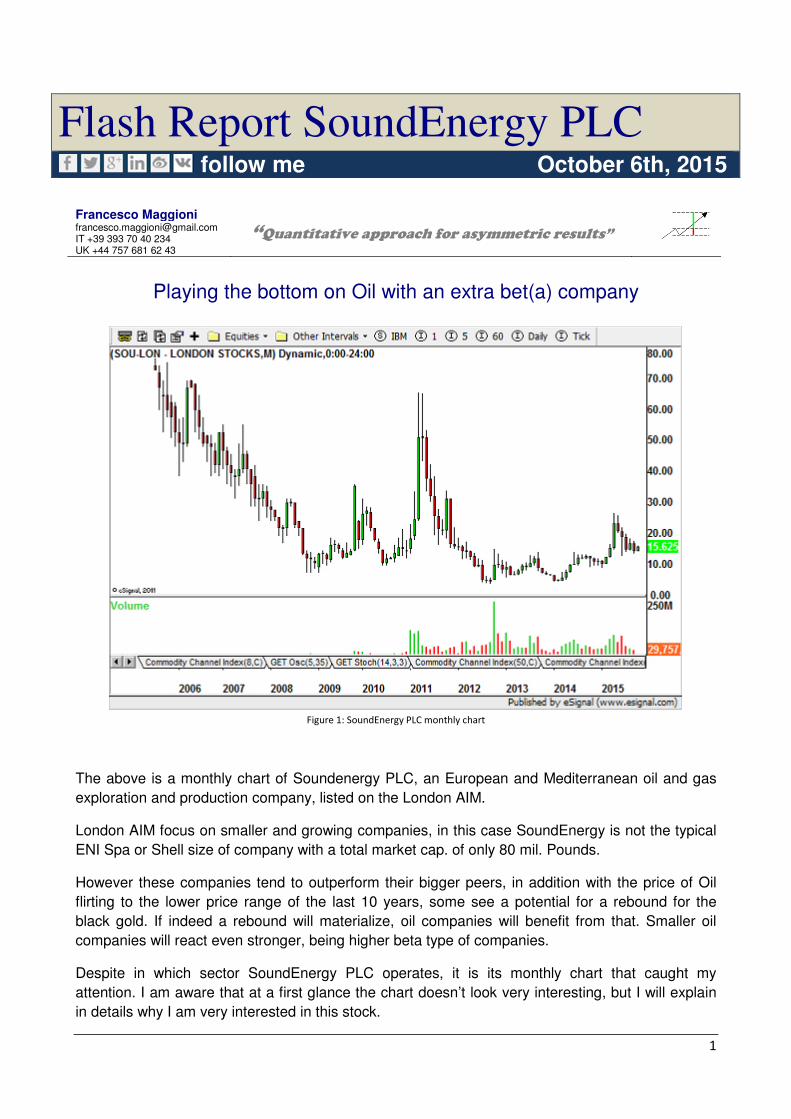
Figure 1: SoundEnergy PLC monthly chart
The above is a monthly chart of Soundenergy PLC, an European and Mediterranean oil and gas
exploration and production company, listed on the London AIM.
London AIM focus on smaller and growing companies, in this case SoundEnergy is not the typical
ENI Spa or Shell size of company with a total market cap. of only 80 mil. Pounds.
However these companies tend to outperform their bigger peers, in addition with the price of Oil
flirting to the lower price range of the last 10 years, some see a potential for a rebound for the
black gold. If indeed a rebound will materialize, oil companies will benefit from that. Smaller oil
companies will react even stronger, being higher beta type of companies.
Despite in which sector SoundEnergy PLC operates, it is its monthly chart that caught my
attention. I am aware that at a first glance the chart doesn’t look very interesting, but I will explain
in details why I am very interested in this stock.
2
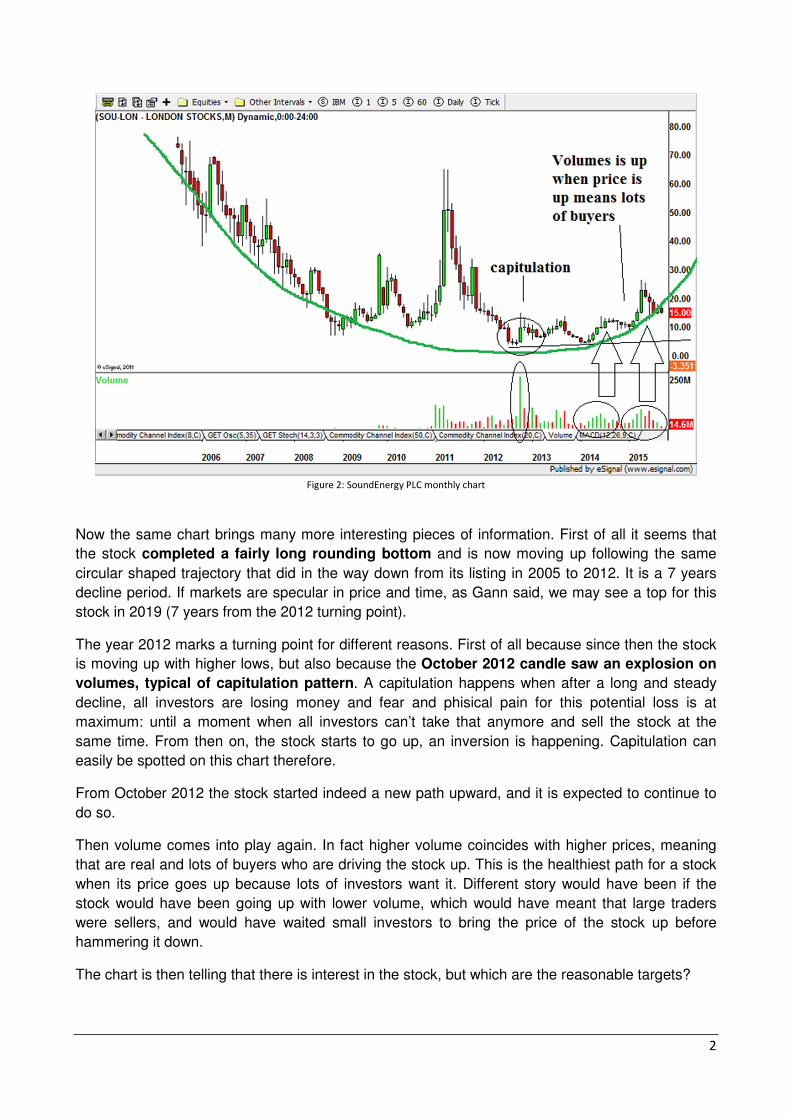
Figure 2: SoundEnergy PLC monthly chart
Now the same chart brings many more interesting pieces of information. First of all it seems that
the stock completed a fairly long rounding bottom and is now moving up following the same
circular shaped trajectory that did in the way down from its listing in 2005 to 2012. It is a 7 years
decline period. If markets are specular in price and time, as Gann said, we may see a top for this
stock in 2019 (7 years from the 2012 turning point).
The year 2012 marks a turning point for different reasons. First of all because since then the stock
is moving up with higher lows, but also because the October 2012 candle saw an explosion on
volumes, typical of capitulation pattern. A capitulation happens when after a long and steady
decline, all investors are losing money and fear and phisical pain for this potential loss is at
maximum: until a moment when all investors can’t take that anymore and sell the stock at the
same time. From then on, the stock starts to go up, an inversion is happening. Capitulation can
easily be spotted on this chart therefore.
From October 2012 the stock started indeed a new path upward, and it is expected to continue to
do so.
Then volume comes into play again. In fact higher volume coincides with higher prices, meaning
that are real and lots of buyers who are driving the stock up. This is the healthiest path for a stock
when its price goes up because lots of investors want it. Different story would have been if the
stock would have been going up with lower volume, which would have meant that large traders
were sellers, and would have waited small investors to bring the price of the stock up before
hammering it down.
The chart is then telling that there is interest in the stock, but which are the reasonable targets?
3
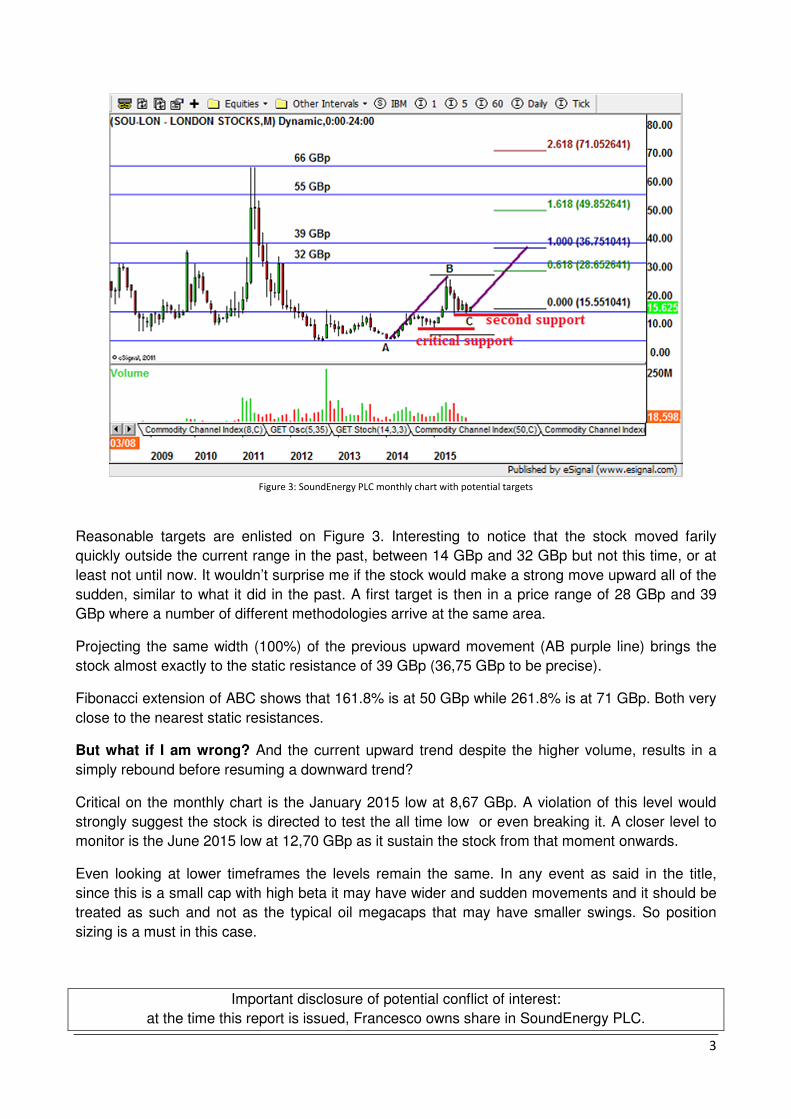
Figure 3: SoundEnergy PLC monthly chart with potential targets
Reasonable targets are enlisted on Figure 3. Interesting to notice that the stock moved farily
quickly outside the current range in the past, between 14 GBp and 32 GBp but not this time, or at
least not until now. It wouldn’t surprise me if the stock would make a strong move upward all of the
sudden, similar to what it did in the past. A first target is then in a price range of 28 GBp and 39
GBp where a number of different methodologies arrive at the same area.
Projecting the same width (100%) of the previous upward movement (AB purple line) brings the
stock almost exactly to the static resistance of 39 GBp (36,75 GBp to be precise).
Fibonacci extension of ABC shows that 161.8% is at 50 GBp while 261.8% is at 71 GBp. Both very
close to the nearest static resistances.
But what if I am wrong? And the current upward trend despite the higher volume, results in a
simply rebound before resuming a downward trend?
Critical on the monthly chart is the January 2015 low at 8,67 GBp. A violation of this level would
strongly suggest the stock is directed to test the all time low or even breaking it. A closer level to
monitor is the June 2015 low at 12,70 GBp as it sustain the stock from that moment onwards.
Even looking at lower timeframes the levels remain the same. In any event as said in the title,
since this is a small cap with high beta it may have wider and sudden movements and it should be
treated as such and not as the typical oil megacaps that may have smaller swings. So position
sizing is a must in this case.
Important disclosure of potential conflict of interest:
at the time this report is issued, Francesco owns share in SoundEnergy PLC.

4
Mr. Maggioni has been working in the financial markets for the
last 15 years covering different roles and working in tier 1
consulting companies and banks worldwide.
In recent years his studies have been focused on the psycho-
emotional aspects of trading and how those aspects have an impact
on traders’ behavior.
Before starting this venture, he was head of a hedge fund desk at
HSBC Private Bank in Monaco and before that he was employed
at Credit Suisse Asset Management (CSAM) in Zurich covering
the in-house single manager hedge funds.
Most of his experience in hedge funds was gained while working
in a Swiss family office where he was in charge of the research
and analysis as well as due diligence for US and European hedge
funds. He also performed quantitative analysis and portfolio
construction for several funds advised by the family office.
Prior to that he worked as an external consultant for KPMG
Financial Services in the Milan office. In 2002 he has been hired
by Ernst & Young LLP, San Francisco as auditor for hedge funds,
auditing large single funds and fund of funds. In 2000 he joined
Ernst & Young in Milan as an auditor for mid-sized companies.
Mr. Maggioni holds an MBA from IUM and a Portfolio
Management degree from the University of Chicago GSB.
Useful Links:
European Central Bank: www.ecb.int
Bank for International Settlements: www.bis.org
International Monetary Fund: www.imf.org
Federal Reserve: www.federalreserve.gov
US CFTC www.cftc.gov
Disclaimer
Nothing in this report constitutes a representation that any investment strategy or recommendation contained herein is suitable or appropriate to a recipient’s individual circumstances or otherwise
constitutes a personal recommendation. It is published solely for information purposes, it does not constitute an advertisement and is not to be construed as a solicitation or an offer to buy or sell any
securities or related financial instruments in any jurisdiction. No representation or warranty, either express or implied, is provided in relation to the accuracy, completeness or reliability of the
information contained herein, nor is it intended to be a complete statement or summary of the securities, markets or developments referred to in the report. The writer does not undertake that investors
will obtain profits, nor will it share with investors any investment profits nor accept any liability for any investment losses. Investments involve risks and investors should exercise prudence in making
their investment decisions. The report should not be regarded by recipients as a substitute for the exercise of their own judgment. Past performance is not necessarily a guide to future performance. The
value of any investment or income may go down as well as up and you may not get back the full amount invested. Any opinions expressed in this report are subject to change without notice.
The securities described herein may not be eligible for sale in all jurisdictions or to certain categories of investors. Options, derivative products and futures are not suitable for all investors, and trading
in these instruments is considered risky. Foreign currency rates of exchange may adversely affect the value, price or income of any security or related instrument mentioned in this report. For
investment advice, trade execution or other enquiries, investors should contact their local sales representative. Any prices stated in this report are for information purposes only and do not represent
valuations for individual securities or other instruments.