fixed line broadband performance (adsl) in new zealand · 4 executive summary epitiro has...
TRANSCRIPT

Fixed Line Broadband Performance (ADSL) in New Zealand April – June 2013

Copyright Epitiro Group Limited, 2013. No reproduction, copy, transmission or translation of this publication may be made without written permission. All rights reserved © Epitiro Ltd.

Fixed Line Broadband Performance (ADSL) in New Zealand, April to June 2013
3
TABLE OF CONTENTS
EXECUTIVE SUMMARY ........................................................................................................... 4
INTRODUCTION ..................................................................................................................... 5
METHODOLOGY ..................................................................................................................... 6
FINDINGS – FIXED LINE BROADBAND PERFORMANCE ............................................................. 7
CONCLUSION ....................................................................................................................... 17
GLOSSARY ........................................................................................................................... 18
TECHNICAL TESTING METHODOLOGY ................................................................................... 19

4
EXECUTIVE SUMMARY
Epitiro has maintained a system of probes
measuring the performance of fixed line ADSL
broadband in New Zealand since 2007. These
probes provide key performance indicators
(KPIs) on the metrics affecting the quality of
service experienced by customers of the
major NZ service providers.
This report provides a top-down analysis of
the main KPIs in the data collected during the
quarter from April to June 2013.
Services subscribed have traditionally been
from the top 5 ISPs in the NZ marketplace;
Orcon, Slingshot, Telecom, TelstraClear and
Vodafone. The probes on TelstraClear
services have remained in place while that
network is integrated with Vodafone
subsequent to their takeover. For this report
the results from these probes have been
aggregated with those from Vodafone probes.
The following key points were determined;
Overall average download speeds of
10.04 Mbps were observed.
Overall average upload speeds were
found to be 0.85 Mbps.
Overall average latency across both
national and international URLs was 138
ms.
Overall average web page download
speed was 2.02 Mbps.
A summary of the overall average
performance observed for some of the
primary KPIs by ISP is presented in Table 1
below. The combined Vodafone/TelstraClear
networks have the best average results:
The fastest average download speed of
10.9 Mbps.
The fastest average upload speed of 0.9
Mbps
The lowest average ping time of 132 ms.
The fastest average web page downloads
at 2.26 Mbps.
Table 1: Summary of average performance by KPI and ISP
Download Speed Upload Speed Network Latency Web Page
Download Speed
Orcon 9.55 Mbps 0.78 Mbps 140 ms 1.87 Mbps
Slingshot 10.17 Mbps 0.88 Mbps 137 ms 2.11 Mbps
Telecom 9.57 Mbps 0.83 Mbps 144 ms 1.82 Mbps
Vodafone 10.88 Mbps 0.90 Mbps 132 ms 2.26 Mbps
Average 10.04 Mbps 0.85 Mbps 138 ms 2.02 Mbps

5
INTRODUCTION
Since 2000 Epitiro has measured broadband
performance and regularly published studies
examining numerous key performance
indicators (KPIs) that affect the quality of
experience of those services. Epitiro
internationally provides services and
broadband performance data to ISPs, industry
bodies and telecommunication regulators for
benchmarking, service assurance and
customer experience management purposes.
Epitiro has deployed its ISP-I™ technology
platform in New Zealand since 2007 enabling
measurements of broadband services from
the customer experience perspective at
specifically selected locations nationwide.
The data collected has been provided to,
amongst others, the Commerce Commission
as the basis of its periodic published reports.
This report provides a top-down analysis of
recent results collected over the quarter from
April to June 2013.
Although new broadband technologies such
as VDSL and UFB fibre are starting to become
available, the prevalent installed base for city
central and suburban locations continues to
run on ADSL connections delivered over
copper telephone lines – often referred to as
the local loop or last mile.
Since Epitiro commenced monitoring in New
Zealand there have been some significant
changes affecting ADSL broadband. Firstly the
upgrade to ADSL2+ that commenced in 2007
has seen the networks reach a peak in the
performance available from that technology;
ADSL2+ has a theoretical limitation for
maximum speeds of 24 Mbps download and
1.4 Mbps upload. In practice these speeds
can only be attained in exceptional
circumstances because signal attenuation on
the lines increases with distance; performance
typically degrades by at least 50% beyond
around 2 Km of copper line.
As the deployment has matured ISPs have
continued to optimise their networks to make
further incremental improvements. Notably
Telecom embarked on a program of deploying
roadside cabinets to shorten local loop
lengths. Following the structural separation
of Telecom in November 2011, Chorus now
owns and operates what used to be Telecom's
ADSL network. Since the introduction of local
loop unbundling all ISP’s have been able to
install their own equipment into Chorus
exchanges and provision their own backhaul
arrangements to their core networks.
Epitiro sites are at distances from their local
exchanges that represent the mid to upper
range of user experience for ADSL2+
connections. This report provides a
comparative study of the service provided by
the four major ISPs in New Zealand to its test
locations between April and June 2013.

6
METHODOLOGY
SCOPE OF TESTING
This study of fixed line ADSL broadband
services in New Zealand analyses the data
collected from measuring the performance
delivered by the four market leading ISPs;
Orcon, Slingshot, Telecom and Vodafone.
The period covered by the report is for the
quarter from April to June 2013.
Epitiro maintains a set of eleven test sites
across the country. These are located in five
of the major cities; Auckland, Hamilton,
Wellington, Christchurch and Dunedin. In
Auckland, Wellington and Christchurch there
are two suburban sites in addition to a city
central location.
The sites are at variable distances from their
local exchanges but are typically within 1.8
km, some as close as 0.5 km. The probes are
all connected to their local exchange via the
local copper loop using the currently
prevalent ADSL2+ technology for broadband.
Results from Vodafone cable connections are
specifically excluded from this report.
APPROACH AND METHODOLOGY
The probes at each site are identical in every
respect; hardware, software and internet
connection device. Each site is an
environment fully managed by Epitiro with
24/7 monitoring to ensure continuous optimal
service. This approach ensures the results are
a fair reflection of ISP’s network performance
at each site where all the end user variables,
modem, distance from exchange etc, are
equalised as far as possible.
Each probe is provisioned with the premium
consumer full speed plan offered by each ISP.
Unbundled lines where the ISP’s own
equipment is present at the exchange have
been used wherever available. Unless
otherwise stated the results for each metric
presented in this report include both Chorus
Wholesale (UBA) and UCLL line performance.
Since there is some variation in the defaults
set by the ISPs for plans each connection is
specifically requested to be set with
interleaving off for consistency.
The probes are configured to run a
standardised test sequence every 15 minutes
24/7.
The test sequence carries out a series of
measurements to establish the key
performance indicators (KPIs). These metrics
include:
TCP Throughput Tests. These provide
an indication of the overall speed of
the connection both for downloads
and uploads.
Latency Tests. A set of URLs both
local and international are tested
with an ICMP Ping to establish packet
round trip times.
HTTP Download Tests. Requests are
sent to a set of local and
international web sites. The web
page download speed is then derived
from the time taken and the amount
of data received for each.
A detailed description of the testing
methodology that resulted in the individual
measurements is presented in the Technical
Testing Methodology section at the end of
this report.
7
FINDINGS – FIXED LINE BROADBAND PERFORMANCE
This section analyses the results obtained from measuring the performance of the four main ADSL
broadband service providers throughout the period from April to June 2013 from Epitiro’s 11 test
locations in New Zealand.
For the purposes of this study results from probes connected to the erstwhile TelstraClear-owned
network have been averaged with those of the new owner, Vodafone, to provide a view of the
combined networks that are still in a process of integration.
THROUGHPUT SPEED
Throughput speed is a measure of the rate at which data can be delivered by the broadband service
to the user’s device. Higher bandwidth applications, such as video and audio applications, benefit
significantly from faster throughput speeds.
During the testing conducted in this study, throughput speed was measured from the test probes at
the city central sites to an Epitiro server connected at the Auckland Peering Exchange. The server
was managed and monitored by Epitiro throughout the testing and is attached to bandwidth
dedicated to the purpose of throughput measurement.
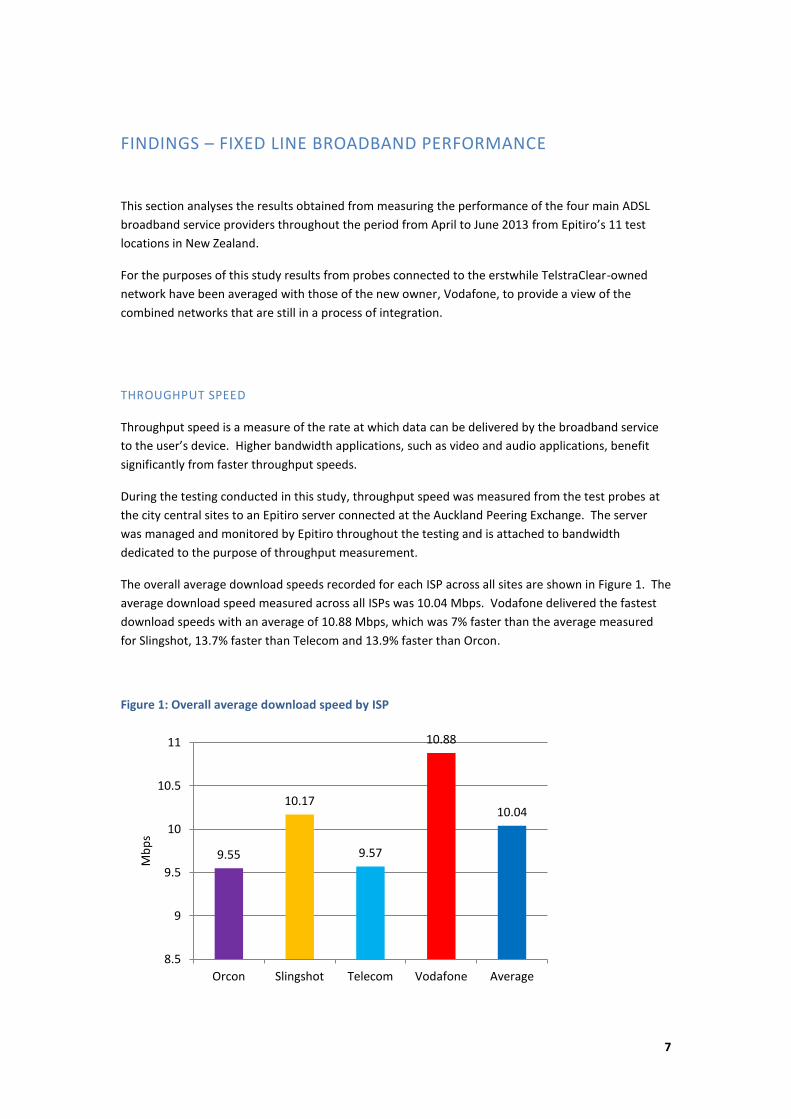
The overall average download speeds recorded for each ISP across all sites are shown in Figure 1. The
average download speed measured across all ISPs was 10.04 Mbps. Vodafone delivered the fastest
download speeds with an average of 10.88 Mbps, which was 7% faster than the average measured
for Slingshot, 13.7% faster than Telecom and 13.9% faster than Orcon.
Figure 1: Overall average download speed by ISP
9.55
10.17
9.57
10.88
10.04
8.5
9
9.5
10
10.5
11
Orcon Slingshot Telecom Vodafone Average
Mb
ps

8
In Figure 2 these results are broken down across the 3 months of the study to provide a view of how
much variation has been observed across the period. ISPs constantly adjust their networks for
changing conditions; response to loading, equipment improvements and tuning, bandwidth
provisioning etc. The Orcon network demonstrated an improvement of 6% between its June and
April results. Vodafone also showed a slight uplift of 0.6%. Both Slingshot and Telecom reported
lower download speeds in June compared to April, -0.9% and -2% respectively even though both
showed improvement in May.
Figure 2: Overall average download speed by ISP for quarter
The overall averages for each ISP will inevitably show considerable variation when viewed by site
because of the differences in the distance of each site to its local exchange. The furthest sites
experience the greatest line attenuations and therefore the lowest modem synchronisation speeds;
this is a limiting factor on the attainable download throughput speeds. However, since this factor
affects each ISP equally, similar relative performances would be expected. This is examined in Figure
3.
Figure 3: Average download speed by ISP for each site
As shown in Figure 3, distance dependent variability is indeed observed although Vodafone remains
the market leader in every location measured except Hamilton where it is a close second.
9.21
9.67 9.77
10.19 10.22 10.1
9.61 9.68 9.42
10.85 10.89 10.91
8
8.5
9
9.5
10
10.5
11
11.5
Apr May June
Mb
ps
Orcon
Slingshot
Telecom
Vodafone
0
2
4
6
8
10
12
14
16
Auckland Christchurch Dunedin Hamilton Wellington
Mb
ps
Orcon
Slingshot
Telecom
Vodafone
9
It is important to note that the results presented for each city do not indicate, for instance, that
speeds in Hamilton are generally much higher than Christchurch. It is the benchmarked relativity
between the service providers at each location that is significant.
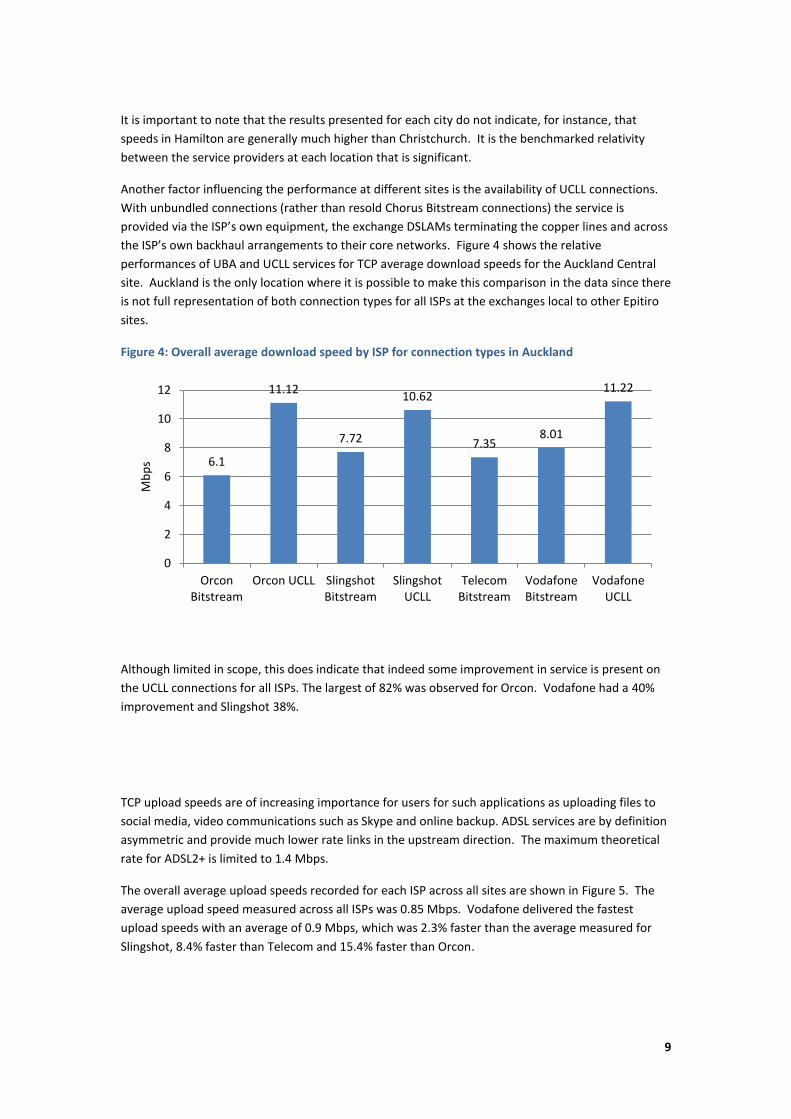
Another factor influencing the performance at different sites is the availability of UCLL connections.
With unbundled connections (rather than resold Chorus Bitstream connections) the service is
provided via the ISP’s own equipment, the exchange DSLAMs terminating the copper lines and across
the ISP’s own backhaul arrangements to their core networks. Figure 4 shows the relative
performances of UBA and UCLL services for TCP average download speeds for the Auckland Central
site. Auckland is the only location where it is possible to make this comparison in the data since there
is not full representation of both connection types for all ISPs at the exchanges local to other Epitiro
sites.
Figure 4: Overall average download speed by ISP for connection types in Auckland
Although limited in scope, this does indicate that indeed some improvement in service is present on
the UCLL connections for all ISPs. The largest of 82% was observed for Orcon. Vodafone had a 40%
improvement and Slingshot 38%.
TCP upload speeds are of increasing importance for users for such applications as uploading files to
social media, video communications such as Skype and online backup. ADSL services are by definition
asymmetric and provide much lower rate links in the upstream direction. The maximum theoretical
rate for ADSL2+ is limited to 1.4 Mbps.
The overall average upload speeds recorded for each ISP across all sites are shown in Figure 5. The
average upload speed measured across all ISPs was 0.85 Mbps. Vodafone delivered the fastest
upload speeds with an average of 0.9 Mbps, which was 2.3% faster than the average measured for
Slingshot, 8.4% faster than Telecom and 15.4% faster than Orcon.
6.1
11.12
7.72
10.62
7.35 8.01
11.22
0
2
4
6
8
10
12
Orcon Bitstream
Orcon UCLL Slingshot Bitstream
Slingshot UCLL
Telecom Bitstream
Vodafone Bitstream
Vodafone UCLL
Mb
ps

10
Figure 5: Overall average upload speed by ISP
Across the quarter under review, both Telecom and Slingshot demonstrated a slight improvement in
average upload speed of 1.2% and 1.1% respectively whereas Vodafone and Orcon showed slight
drops of -1.1% and -1.3%. These are shown in Figure 6.
Figure 6: Overall average upload speed by ISP for quarter
Viewing upload speeds across the five city centres as in Figure 7 shows them to be less variable than
download speeds.
0.78
0.88
0.83
0.9
0.85
0.72
0.74
0.76
0.78
0.8
0.82
0.84
0.86
0.88
0.9
0.92
Orcon Slingshot Telecom Vodafone Average
Mb
ps
0.79 0.78 0.78
0.87 0.88 0.88
0.82 0.83 0.83
0.9 0.9 0.89
0.72
0.74
0.76
0.78
0.8
0.82
0.84
0.86
0.88
0.9
0.92
Apr May June
Mb
ps
Orcon
Slingshot
Telecom
Vodafone

11
Figure 7: Average upload speed by ISP for each site
NETWORK LATENCY
The latency or delay in the network is measured as the time taken to deliver a single packet of data
across that network. The latency measures in this analysis are network round-trip times, and indicate
the time for data to be transmitted from the probe, to the targeted server and back again. Low
latency is critical for an acceptable user experience of real-time applications such as voice and
gaming. It is also a key factor in the experience for web browsing where the delivery of a complete
web page involves multiple requests from the user’s browser.
The average network latency measured across the four ISPs for the complete set of servers pinged
was 138 ms as shown in Figure 8. The lowest network latency was observed on the Vodafone
network, with an average of 132 ms.
Figure 8: Average latency by ISP
Figure 9 provides a view of how the overall latency results varied across the quarter under review.
Vodafone maintained a consistent low of 132 ms. Slingshot showed a 4% improvement. Both
0
0.2
0.4
0.6
0.8
1
1.2
Auckland Christchurch Dunedin Hamilton Wellington
Mb
ps
Orcon
Slingshot
Telecom
Vodafone
140
137
144
132
138
126
128
130
132
134
136
138
140
142
144
146
Orcon Slingshot Telecom Vodafone Average
Mill
isec
on
ds

12
Telecom and Orcon showed increases of 4% and 5% respectively comparing their June results with
April.
Figure 9: Overall average latency by ISP for quarter
There is inevitably a major variation between the latencies observed to locations within New Zealand
to international ones; latency increases with the length of links and the number of hops between
routers encountered. The following chart, Figure 10, shows the average for national latency results to
be 23 ms. The results between ISPs only vary within a range of 5 ms with the lowest value of 21 ms
observed on the Vodafone network. Over the quarter these results remained very stable varying by
only a millisecond for each ISP.
Figure 10: Average latency by ISP to national URLs
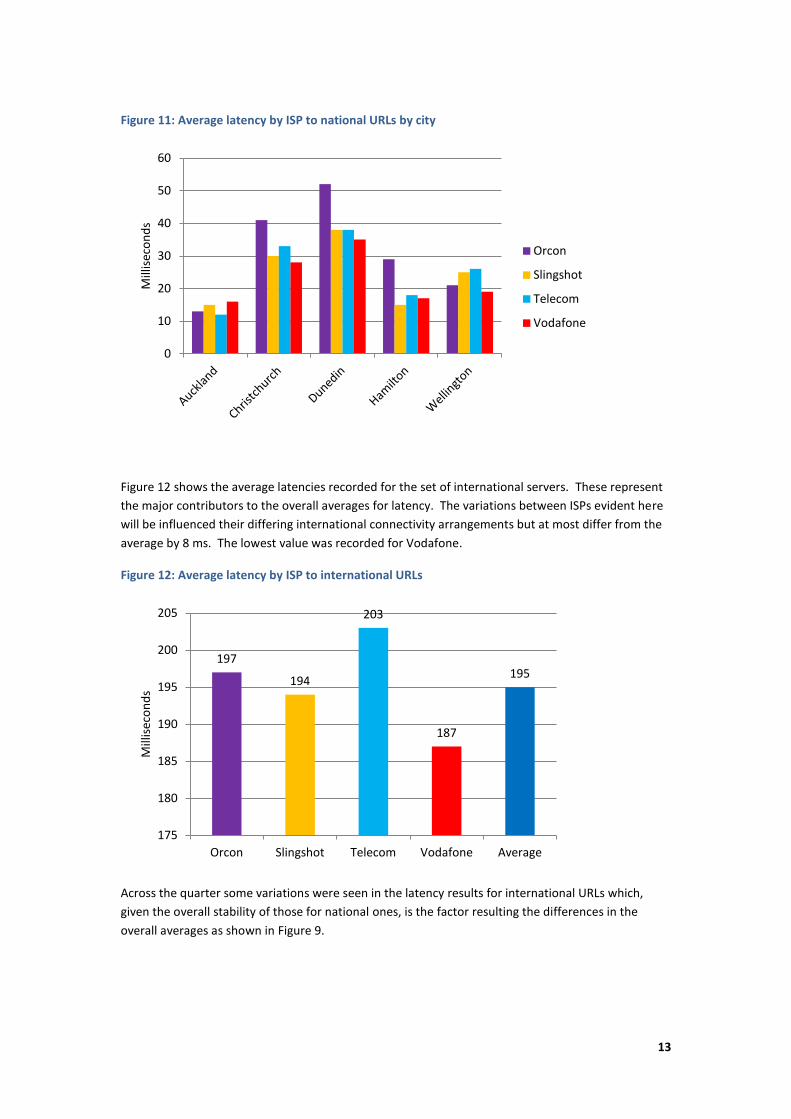
When these results are further broken down by city as in Figure 11 the effect of backhaul to Auckland
where the ISP’s house their core networks may be discernible; average latencies increase the further
from Auckland ranging from an average of 14 ms in Auckland to 41 ms for Dunedin.
137
140
144
141
135 135
142 144
147
132 131
132
120
125
130
135
140
145
150
Apr May June
Mill
isec
on
ds
Orcon
Slingshot
Telecom
Vodafone
26
23 24
21 23
0
5
10
15
20
25
30
Orcon Slingshot Telecom Vodafone Average
Mill
isec
on
ds
13
Figure 11: Average latency by ISP to national URLs by city
Figure 12 shows the average latencies recorded for the set of international servers. These represent
the major contributors to the overall averages for latency. The variations between ISPs evident here
will be influenced their differing international connectivity arrangements but at most differ from the
average by 8 ms. The lowest value was recorded for Vodafone.
Figure 12: Average latency by ISP to international URLs
Across the quarter some variations were seen in the latency results for international URLs which,
given the overall stability of those for national ones, is the factor resulting the differences in the
overall averages as shown in Figure 9.
0
10
20
30
40
50
60 M
illis
eco
nd
s
Orcon
Slingshot
Telecom
Vodafone
197
194
203
187
195
175
180
185
190
195
200
205
Orcon Slingshot Telecom Vodafone Average
Mill
isec
on
ds

14
WEB PAGE DOWNLOAD SPEED
Web page download speeds are measured by sending requests to a set of national and international
web sites. The speed is calculated by taking the amount of data received and dividing it by the time
taken to download it.
The overall averages obtained from the web page download tests are shown in Figure 13. The
average web page download speed measured across all ISPs was 2.02 Mbps. Vodafone delivered the
fastest download speeds with an average of 2.26 Mbps, which was 7.1% faster than the average
measured for Slingshot, 20.9% faster than Orcon and 24.2% faster than Telecom.
Figure 13: Overall average web page download speed by ISP
Average web page download speeds remained relatively constant across the three months reviewed
as seen in Figure 14. No results for any ISP varied by more than 0.1% across the period.
Figure 14: Average web page download speed by ISP for quarter
There is inevitably a difference between the web page download speeds attained for sites hosted in
NZ to international ones. Figure 15 shows the average HTTP download speeds for NZ websites. An
1.87
2.11
1.82
2.26
2.02
0
0.5
1
1.5
2
2.5
Orcon Slingshot Telecom Vodafone Average
Mb
ps
1.9 1.92
1.79
2.07 2.22
2.05
1.77 1.9 1.8
2.21 2.37
2.2
0
0.5
1
1.5
2
2.5
Apr May June
Mb
ps
Orcon
Slingshot
Telecom
Vodafone

15
overall average of 3.46 Mbps was observed. Vodafone was 9.5% better than average with Slingshot
3.2%; Orcon was 2.6% below average and Telecom 10.1%.
Figure 15: Average web page download speeds from NZ websites
A somewhat broader range was observed for international websites where the overall average
download speed of 1.06 Mbps was recorded. As shown in Figure 16 Vodafone was 17.9% better than
average and Slingshot 9.4% while Telecom was 9.4% below average and Orcon 17.9%.
Figure 16: Average web page download speeds from international websites
It would be expected the additional latency involved in backhaul to Auckland would result in slightly
lower web page download speeds for cities down the county. This influence is evident in the results
shown in Figure 17.
3.37 3.57
3.11
3.79
3.46
0
0.5
1
1.5
2
2.5
3
3.5
4
Orcon Slingshot Telecom Vodafone Average
Mb
ps
0.87
1.16
0.96
1.25
1.06
0
0.2
0.4
0.6
0.8
1
1.2
1.4
Orcon Slingshot Telecom Vodafone Average
Mb
ps
16
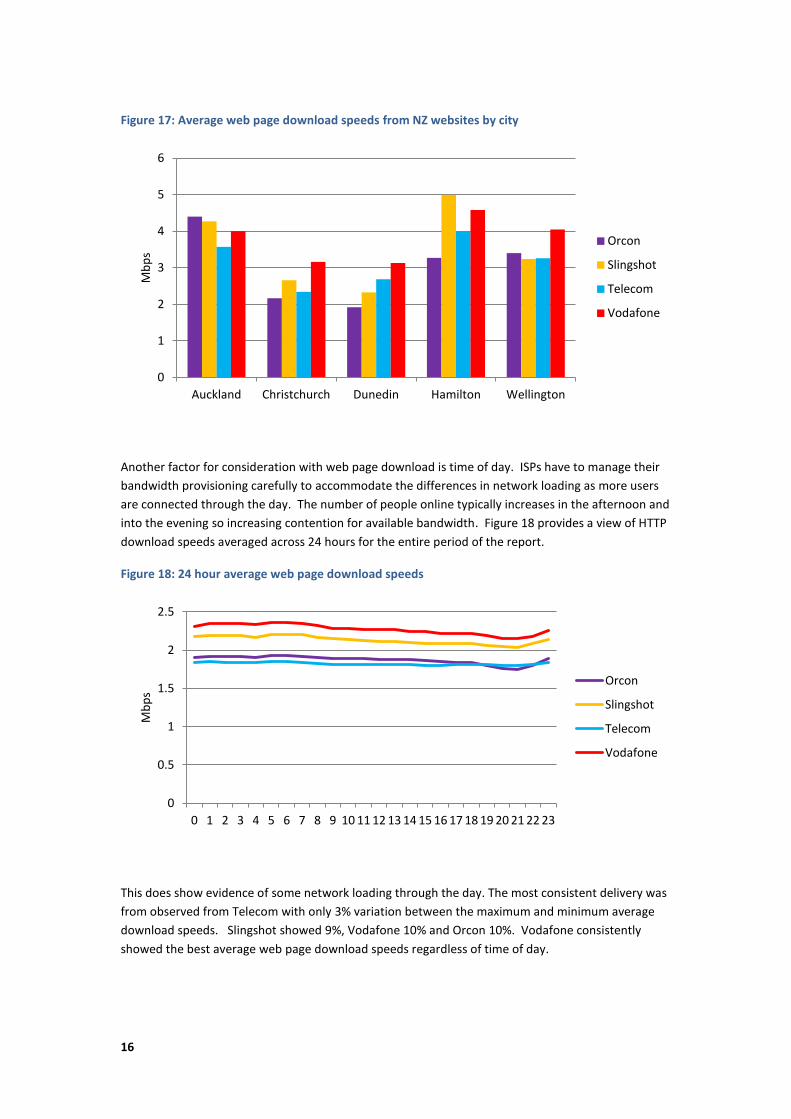
Figure 17: Average web page download speeds from NZ websites by city
Another factor for consideration with web page download is time of day. ISPs have to manage their
bandwidth provisioning carefully to accommodate the differences in network loading as more users
are connected through the day. The number of people online typically increases in the afternoon and
into the evening so increasing contention for available bandwidth. Figure 18 provides a view of HTTP
download speeds averaged across 24 hours for the entire period of the report.
Figure 18: 24 hour average web page download speeds
This does show evidence of some network loading through the day. The most consistent delivery was
from observed from Telecom with only 3% variation between the maximum and minimum average
download speeds. Slingshot showed 9%, Vodafone 10% and Orcon 10%. Vodafone consistently
showed the best average web page download speeds regardless of time of day.
0
1
2
3
4
5
6
Auckland Christchurch Dunedin Hamilton Wellington
Mb
ps
Orcon
Slingshot
Telecom
Vodafone
0
0.5
1
1.5
2
2.5
0 1 2 3 4 5 6 7 8 9 10 11 12 13 14 15 16 17 18 19 20 21 22 23
Mb
ps
Orcon
Slingshot
Telecom
Vodafone
17
CONCLUSION
In 2013 New Zealand has seen the
introduction of new kinds of broadband
services including VDSL over copper lines and
UFB fibre connections. However, as of this
report, ADSL remains the primary broadband
delivery mechanism for the majority of end
users.
This report indicates that variability of ADSL
service levels between ISPs exists. Across the
quarter reviewed, from April to June 2013, the
relative performance of each ISP remained
quite consistent indicating that no major
changes had been introduced affecting the
city central and suburban sites for the Epitiro
test locations.
The overall best performance for TCP
throughput speeds, latency and webpage
downloads was observed from the averaged
results of the combined set of probes for the
Vodafone and erstwhile TelstraClear
networks:
An overall average for download speed of
10.04 Mbps was observed. Vodafone
showed the best performance, 8.4%
better than average. Slingshot was also
above average.
The overall average for upload speed was
0.85 Mbps. Vodafone attained 5.8%
better than average. Slingshot was also
above average.
The overall average for latency was 138
ms across national and international sites.
Vodafone had the best overall
performance, 4.3% better than average.
This remained the case when latency to
national sites is considered where it
attained 8.7% below, i.e. better, than the
average of 23ms and 4.1% better than
average of 195 ms for international sites.
Slingshot was also below average for
both.
An overall average for web page
downloads of 2.02 Mbps was observed.
Vodafone again achieved the best
performance, 11.9% better than average.
For national sites it attained 9.5% better
than the average of 3.46 Mbps and 17.9%
better than the 1.06 Mbps average for
international sites. Slingshot was also
above average for both.
The least variability for web page delivery
across the hours of the day was observed
on the Telecom network with only a 3%
difference between the maximum and
minimum values. Vodafone consistently
delivered the best average web page
download speeds throughout the day
despite the variability.
The challenge will remain for ISPs to continue
to maintain and improve the level of service
available for New Zealand consumers.

18
GLOSSARY
ADSL: Asymmetric digital subscriber line. The standard deployed in New Zealand is ADSL2+.
Bitstream: Broadband service provided by Chorus for Telecom connections and to other ISPs where
they do not have their own presence at local exchanges.
Contention: A slowdown in performance caused when multiple users share the same limited
bandwidth.
Download speed: The rate of data transmission from a network operator’s access node to a
customer, typically measured in Megabits per second (Mbps).
Headline speed: The speed at which a broadband service is marketed.
ISP: Internet Service Provider
kbps: Kilobits per second. 1,000kbps is the same as 1Mbps.
Latency: The time it takes a single packet of data to travel from a user’s device to a third-party server
and back again. Most commonly measured in milliseconds.
LLU: Local Loop Unbundling refers to the provision for ISPs to locate their own equipment at
exchanges.
Mbps: Megabits per second. 1Mbps is the equivalent of 1,000kbps.
UBA: Unbundled Bitstream Access.
UCLL: Unbundled Copper Local Loop.
UFB: Ultra Fast Broadband. Government backed initiative to rollout a nationwide fibre network.
Upload speed: The rate of data transmission from a customer’s connection to a network operator’s
access node, typically measured in per second (Mbps).
VDSL: Very-high-bit-rate digital subscriber line.

19
TECHNICAL TESTING METHODOLOGY
This section provides details of the ISP-I™
metrics utilised in this report.
TCP THROUGHPUT MEASUREMENTS
TCP throughput tests are initiated from ISP-I™ probes at a raw socket level with the aim of testing the full capacity of the line under test. The tests are typically conducted to a server endpoint also running Epitiro software. An endpoint server hosted in Auckland and connected at the Auckland Peering Exchange on bandwidth dedicated to the purpose was employed for the throughput testing presented in this report. When a test is connected data is transmitted upstream from ISP-I™ to server and then downstream from server to ISP-I™ in order to measure both upstream and downstream throughputs. ISP-I™ records the time spent transmitting data upstream and downstream and also the amount of data received in each direction. The upstream and downstream TCP throughputs are then derived from these measures. Samples were taken at regular intervals during transmission to provide a measure of the sustained average throughput. LATENCY MEASUREMENTS
The Ping test measures network latency by sending an ICMP echo request to the specified server. The time recorded by ISP-I™ is the total round trip time (in milliseconds) from the request to the echo response being received from the server. The selection of local and international URLs which were pinged for the purposes of this report remained constant throughout the test period. HTTP MEASUREMENTS
The HTTP test makes a request to a specified URL and records the time taken and the amount of data downloaded, from which the speed of the download is derived. This methodology ensures a consistent approach
to measuring HTTP performance, as slow responding websites, or sites with a large amount of data, are given a representative value. The higher this value, the better the connection has performed. As with Ping, a consistent set of local and international websites were measured throughout the test period. .

20
Epitiro Group Ltd
Epitiro House, 10/11 Raleigh Walk,
Waterfront 2000,
Brigantine Place
Cardiff, UK
CF10 4LN
Tel: +44 (0) 870 850 6563
[email protected] | www.epitiro.com 20-103-1012-001