fisheries acoustics final pictures - swfsc home page · outline 1. introduction to fisheries...
TRANSCRIPT
Fisheries Acoustics
By Dylan Shinzaki
Advanced Survey Technologies
Outline
1. Introduction to Fisheries Management 2. Physics in Fisheries Acoustics3. How Fisheries Acoustics Works4. How Echo Sounders Work5. What Advanced Survey Technologies
Does

What is Fisheries Management?
• Problem: We want to eat fish, but not kill ALL of the fish
• “Sustainable exploitation”
• Fisheries Management
Picture Courtesy of NOAA Online Photo Gallery

Fisheries Management
• Needs information about fish:
– Distribution – Amount

Fisheries Acoustics: What and Where?
• Subsea observations– Aquatic Organisms
• Use Acoustics, sound energy


Why Acoustics?
• Sound waves can:– travel farther than light waves in water– travel with less attenuation– be used to survey a larger area in a shorter
amount of time.

A Brief Physics Review

Amplitude and Wavelength
• Amplitude– Half the distance
from peak to trough• Wavelength (λ)
– Distance from peak to peak
WavelengthAmplitude
Distance
Pre
ssur
e

Phase
• Angular Difference between two waves

Pressure
• Pressure– Sound wave is defined by areas of high and
low pressureRarefaction
Compression

Intensity• Intensity
– Amount of energy over time– Intensity = Pressure2
– Which graph has higher intensity?

• Density * Speed of Sound• How much it opposes sound
– Like electrical resistance**– How much it resists sound
Acoustical Impedance

Fisheries Acoustics

Scattered Waves
Scattering• When sound in the water meets a solid object• Some energy is “scattered”
– sent in a different directions• Backscattering
– Back at the source
Incident Wave
Backscattered Wave

•Bigger difference impedance more energy is scattered
High Impedance Lower Impedance
Low Impedance Similar Impedance

Sound Attenuation
• Spreading– Intensity decreases because wave expands
• Absorption– Some energy is absorbed by water molecules
Jump to Advanced
Topic

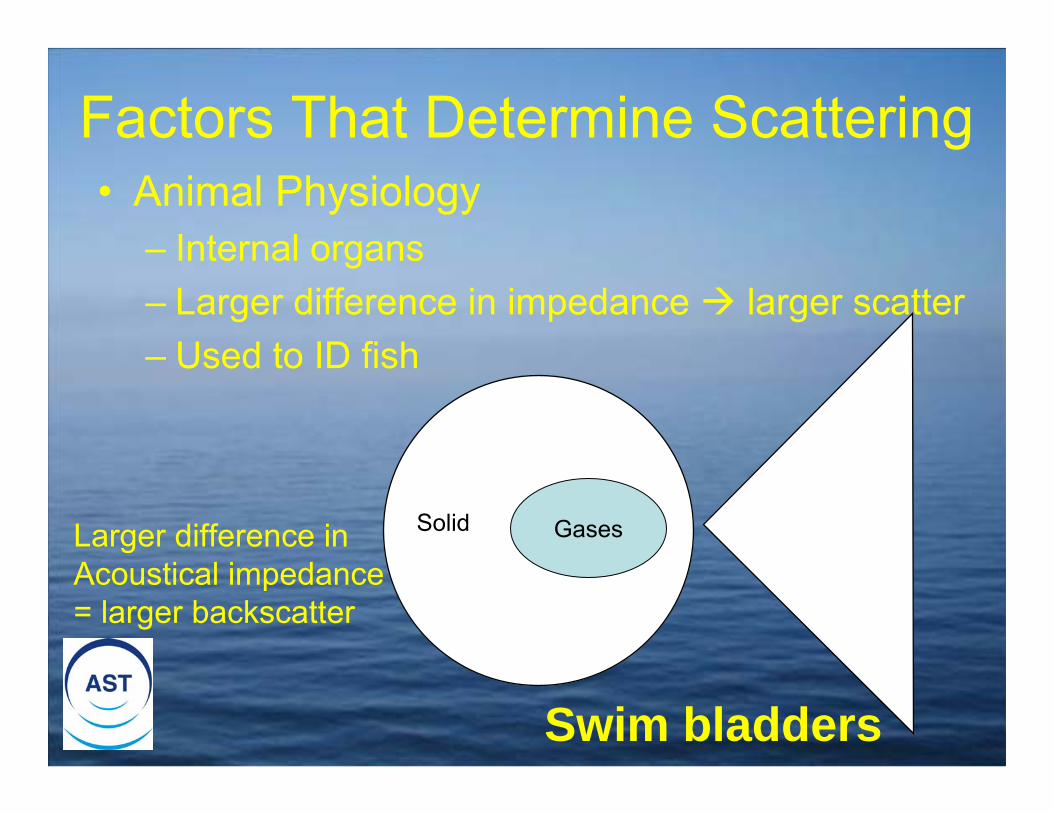
GasesSolid
Swim bladders
Factors That Determine Scattering• Animal Physiology
– Internal organs– Larger difference in impedance larger scatter– Used to ID fish
Larger difference in Acoustical impedance = larger backscatter

More Factors: Size and Shape
• Objects much larger than wavelength scatter in 1 direction (shape)
• Much smaller = scatter in all directions (size)
• Medium size = both size and shape matter
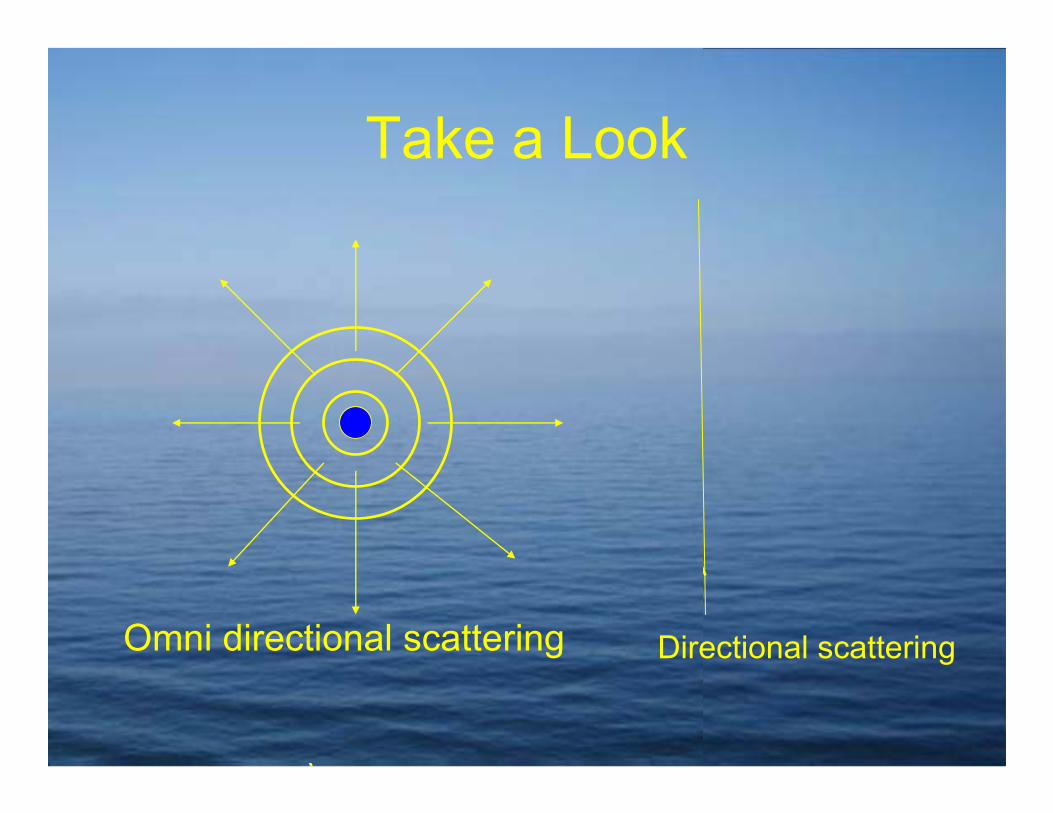
Take a Look
Omni directional scattering Directional scattering
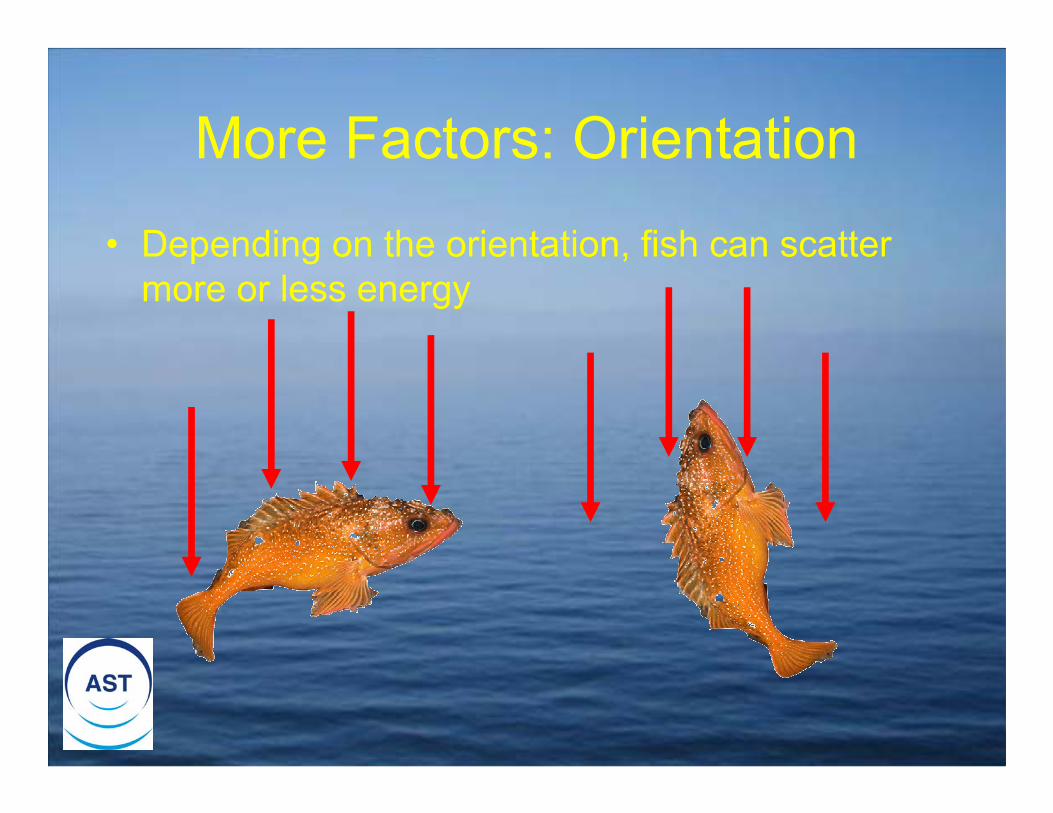
More Factors: Orientation
• Depending on the orientation, fish can scatter more or less energy
Theory of Scientific Echosounders
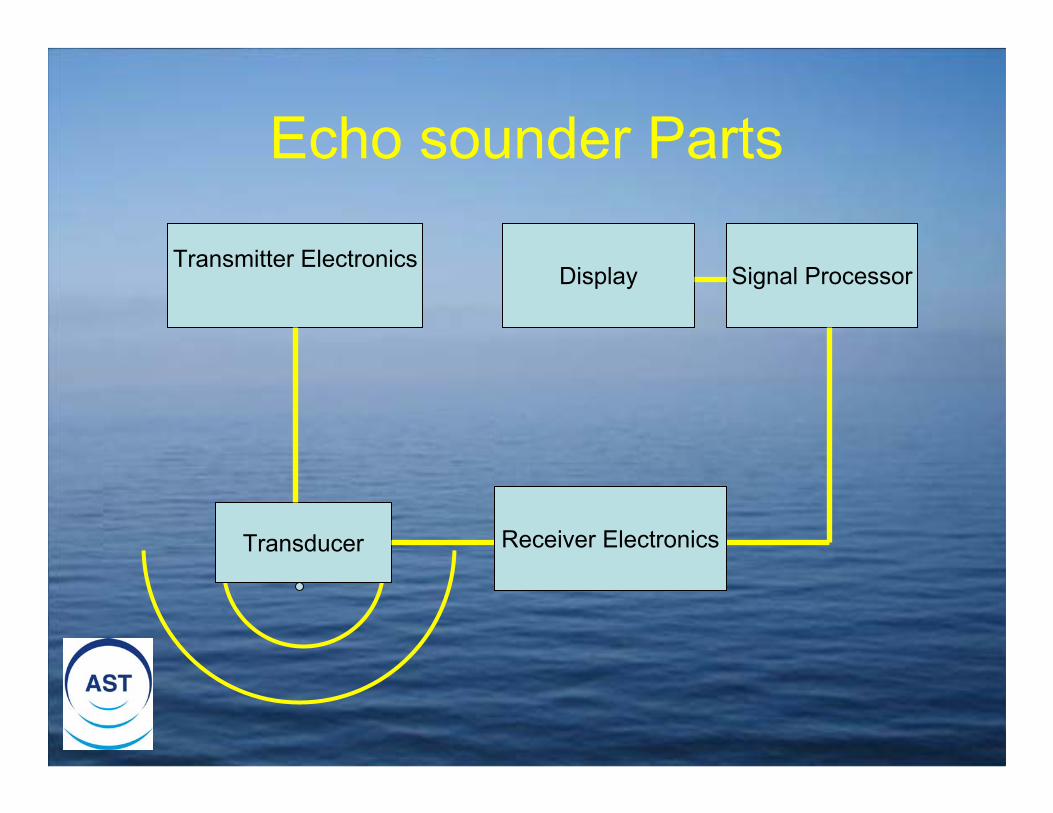
Echo sounder Parts
Transducer
Transmitter ElectronicsSignal ProcessorDisplay
Receiver Electronics

Transmitter Electronics
• Generates signal at desired frequency• Converts electric energy to acoustic
energy

Transducer• Transducer sends and receives pulses • Pulse Length
– Signal finite size– c * τ
• τ= duration of pulse • c=speed of sound
• Objects must be at least ½ pulse length to be seen as different objects

Source
Travels out at speed of soundTravels for X seconds
Pulse Length = c * τ

Distance < half a pulse length
•The signals overlap•Perceived as one fish and not two
c * τ

Distance > half a pulse length
•The signals do not overlap•Identified as two fish

Transducers: Beam Pattern and Equivalent Beam Angle
• Beam Pattern– Due to multiple elements and
destructive interference– Lobes
• Equivalent Beam Angle (ψ)– Hypothetical cone with angle ψ
“Ideal” Cone ψ

Types of Transducers
• Single beam– Only range
• Dual beam– Range and one angle
• Split beam– 3-D coordinates

•A single beam transducer can only tell the distance
•Not the direction the signal came from.
•Fish can be in variety of places, transducer can’t tell
Single Beam
?
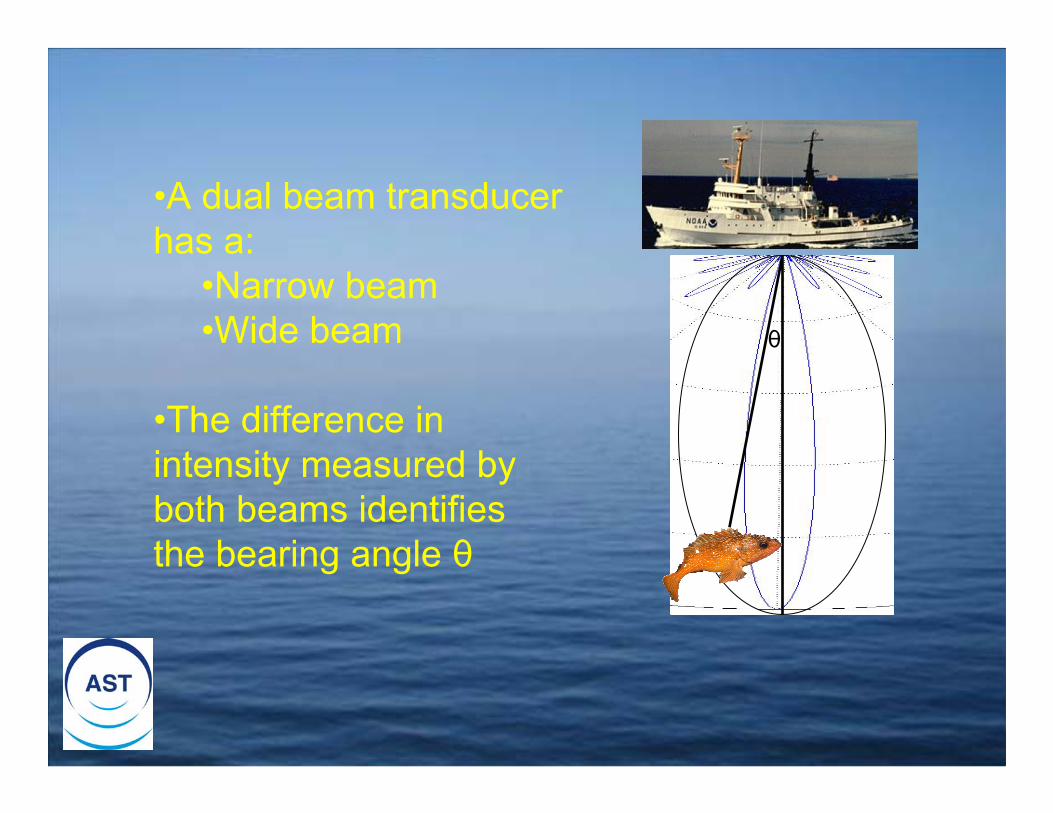
•A dual beam transducer has a:
•Narrow beam•Wide beam
•The difference in intensity measured by both beams identifies the bearing angle θ
θ

21
3 4
•When a signal arrives, the 4 sections get readings at different times.•Phase difference 3-D coordinates

Signal Processor: Compensation
• Signal must be amplified– Compensation for attenuation and spreading
• Time-Varied Gain– The longer it takes the signal to return, the more
it must be amplified.
Jump to Advanced Topic

TVG
Attenuation

Compensated Signal
Original SignalSee the small black line in the middle?

Display
• Echogram– Compilations of echo intensity versus depth– Get “picture” beneath the sea-surface

Species Identification• Identify fish based on received sound• Sound scattering from fish is modeled and
measured • The challenge is to determine what fish
scattered sound
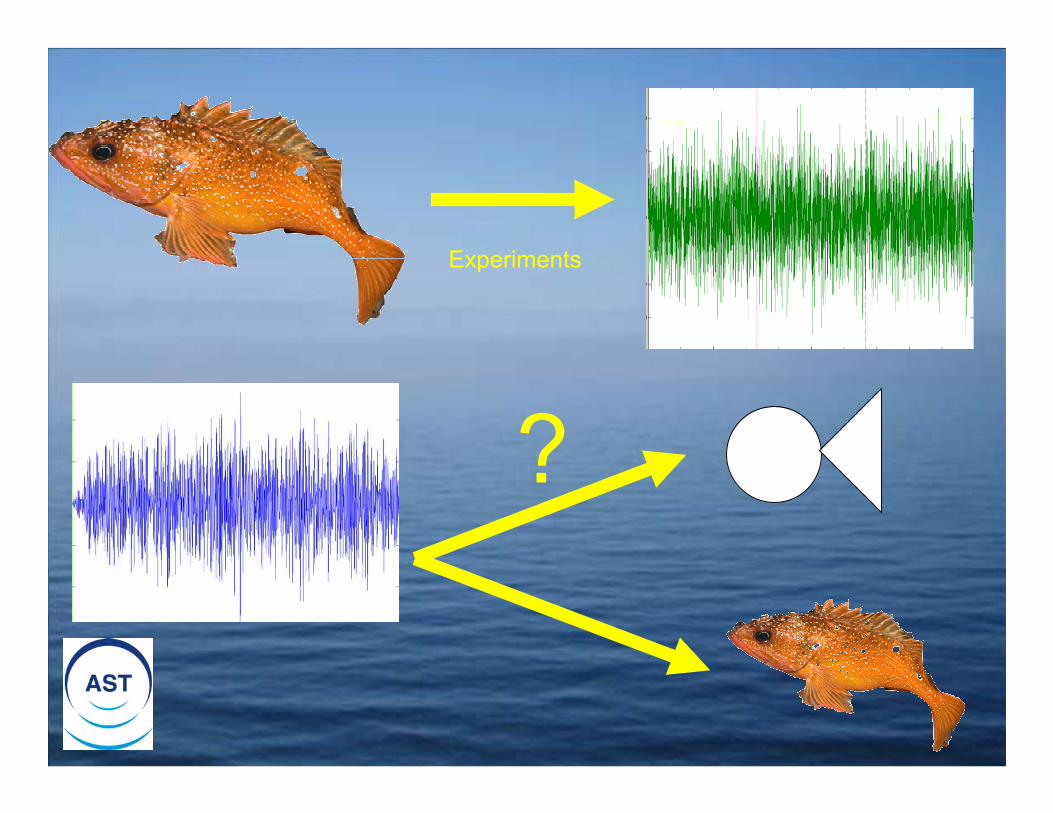
Experiments
?

Target Strength
• Target strength (TS)– How much energy gets backscattered?– Determined by factors that affect scattering
• e.g. Animal Physiology and Orientation
Only a portion of the energy is backscattered
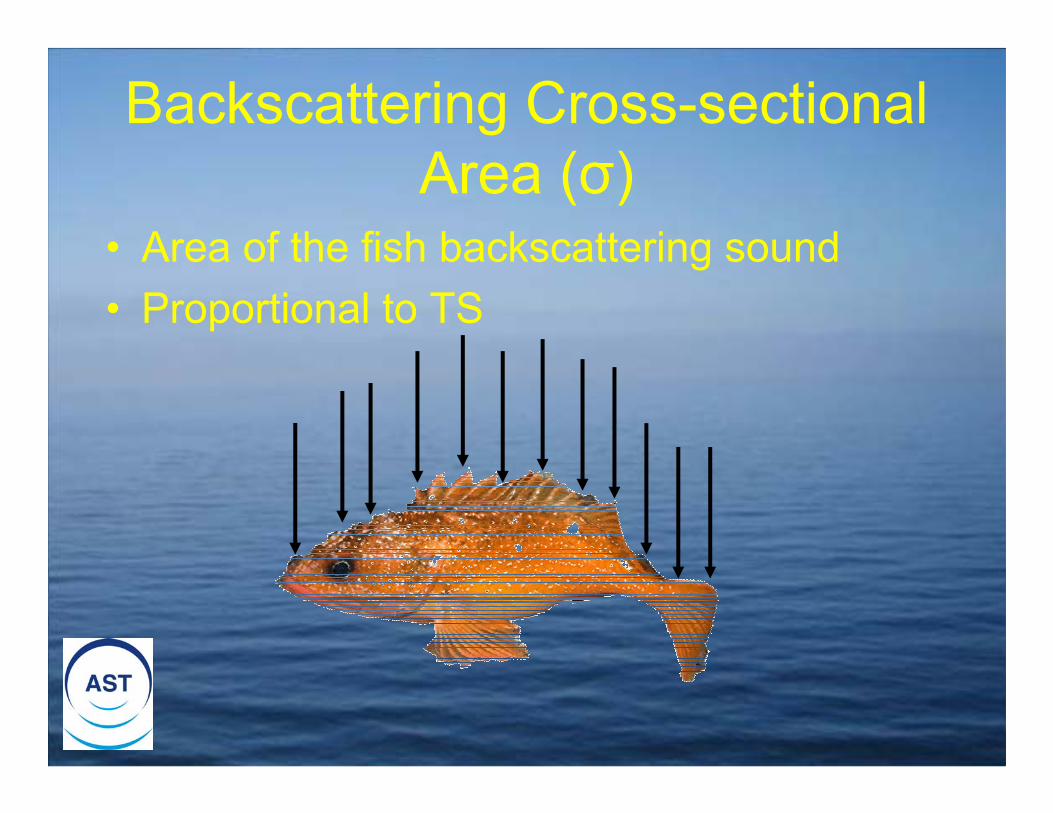
Backscattering Cross-sectional Area (σ)
• Area of the fish backscattering sound• Proportional to TS

Volume Backscattering Strength
• Amount of backscattering area per volume of seawater
• Sum of all the backscatter

•Sampling volume •Equivalent beam
angle•Pulse length
•Total backscattered energy
•With the 2 knowns, calculate Volume Backscattering Strength
τ *c
ψ

If fish are far enough apart, their echoes can simply be counted
If fish are too close together, one must use echo integration
Biomass Estimation
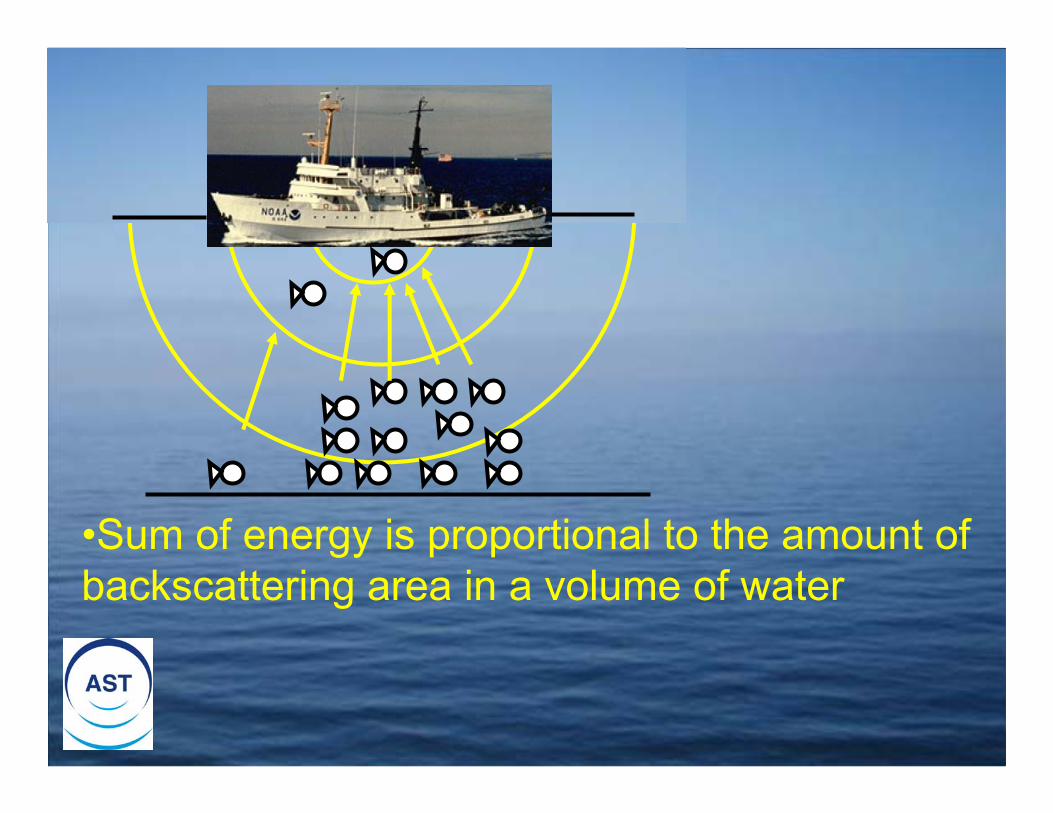
•Sum of energy is proportional to the amount of backscattering area in a volume of water

Sv
Sv
Sv
•Add up values of Sv in the water column
•Area Backscatter coefficient (sa)
•sa is the amount of area in the whole column
Sa

Echo IntegrationBackscattering Area
from X Fish(sa)
Backscattering areaper fish
(σ)
Divide By
Number of Fish In the area (Density)
Habitat Area
Multiply Total Number of Fish (Biomass)
Jump to Advanced Topic

About Advanced Survey Technologies

What Does Advanced Survey Technologies Do?
• Advanced Survey Technologies develops and refines technologies for Fisheries Management
• One of the major goals is to identify fish species from backscatter versus frequency

Hyperbaric Tank
• A hollow steel sphere• Internal transducers• Pressurize specimens• See how TS changes
with respect to variables like pressure and temperature
• Remotely ID fish species

So?
• By modeling fish, and comparing models to measurements taken ex situ, one can estimate how fish scatter sound in the wild.
• Scattering models can be used to interpret field measurements and estimate the species and numbers of fish.

Fish Surveys
• AST also does surveys of the populations of marine organisms

Alternative Survey Platforms• AST develops tools to measure in areas
that are traditionally inaccessible by ships• AST surveys near the seashore, sea-
surface, and seafloor (boundary areas)

Closing
• By surveying, identifying and estimating fish and their populations, AST helps achieve the goal of sustainable exploitation
• Now you know a bit about Advanced Survey Technologies; want to learn more?

For More Information
• Visit their website at http://swfsc.noaa.gov/textblock.aspx?Division=FRD&id=1105&ParentMenuId=294
• Or, go to http://swfsc.noaa.gov/– Click “Fisheries Resource Division” or
“Fisheries Resources”– Find AST under Programs

Special ThanksThank you to all of Advanced Survey
Technologies for giving me this opportunity and helping me along, especially Dr. David Demerand Douglas Krause.
Thank you to Marine Technologies Society for setting up the internship
Thanks to my parents for driving me here everyday (I can’t drive)
And thanks for watching, I hope you learned something!

The End
(Unless You Wish To Learn More)

More Complicated Topics

Uncertainty and Error
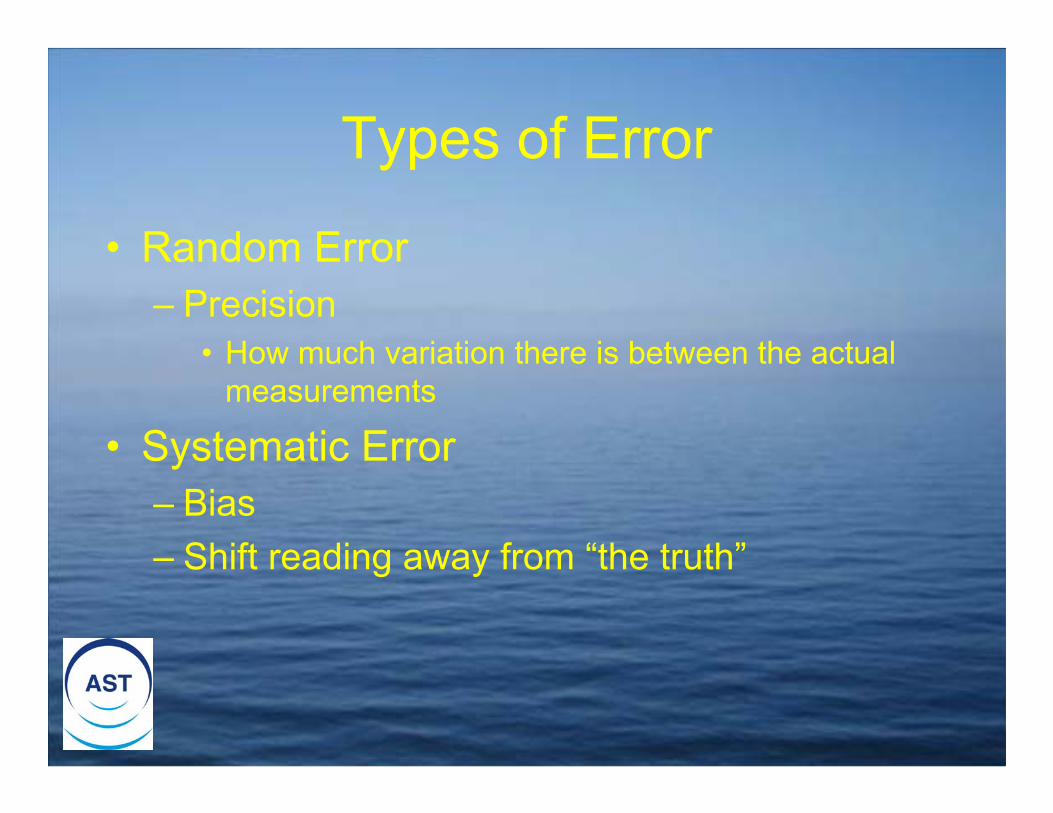
Types of Error
• Random Error– Precision
• How much variation there is between the actual measurements
• Systematic Error– Bias– Shift reading away from “the truth”

4 Degrees7/20
3 Degrees7/19
1 Degree7/18
0 Degrees7/17
MeasurementDay
The variation between these numbers is the random error
If the actual temperature is 5 Degrees, the systematic error is how far the measurements are from 5 Degrees

Total Error
• Sum of all sampling and measurement error.– Both random and systematic– Measurement Error
• Error due to the device or method• Example, having an uncalibrated transducer

If you collect too few samples, your samples could turn out like this:
In which case, one would assert that the population is half black and half white.
Or that the whole population is black
Sampling Error•When observing a small portion of a large population, the sample may not reflect the reality of the populations

Avoidance ReactionSome fish will avoid a surveying vessel, making the population seem smaller than it is
Pictures Courtesy of Kevin Baille

Where are the fish?
Bubble AttenuationDuring difficult weather, bubbles can form near the surface. Bubbles backscatter sound energy and will appear on the echogram, but not reflect the fish population
Pictures Courtesy of Kevin Baille
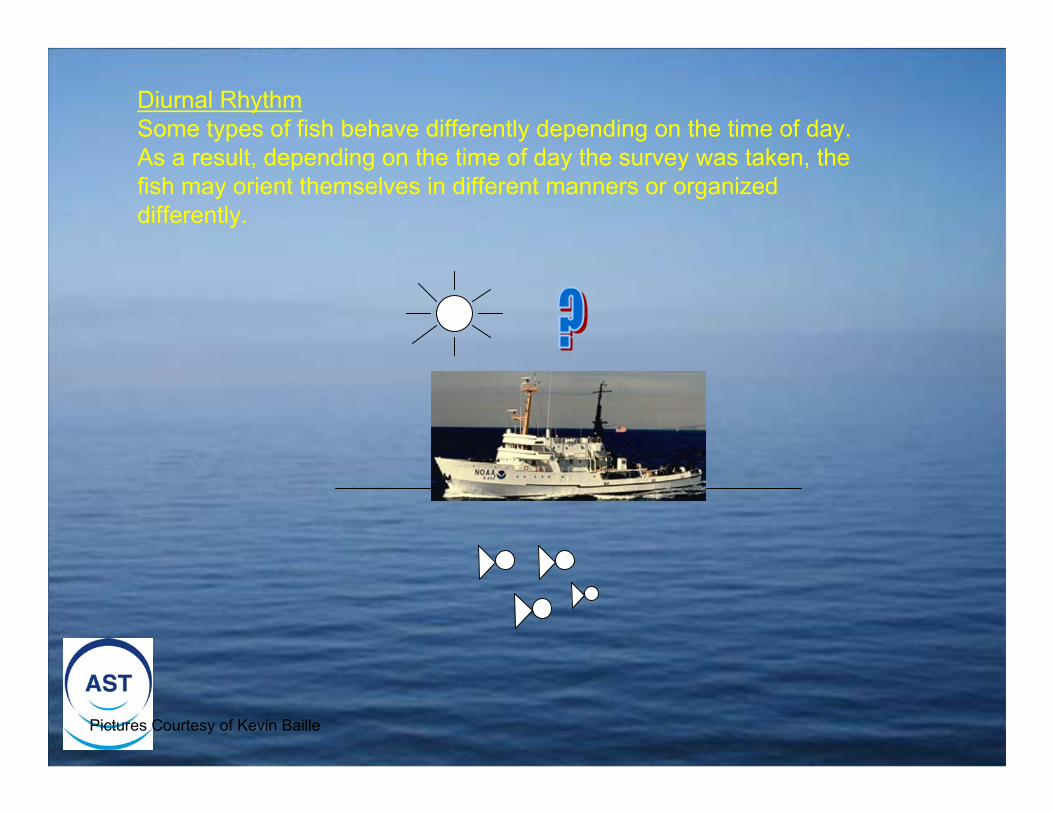
Diurnal RhythmSome types of fish behave differently depending on the time of day.As a result, depending on the time of day the survey was taken, the fish may orient themselves in different manners or organized differently.
Pictures Courtesy of Kevin Baille

Error in Volume Backscattering Strength
• Sv is based on the equivalent beam angle in order to approximate the amount of volume being surveyed
• Ψ is determined on calibration– Determined within a certain degree of
accuracy

τ *c
ψ
τ *c
ψ
Pictures Courtesy of Kevin Baille

Error in Area Backscattering Strength
• Sa is based on the Sv• If Sv is erroneous, then Sa will probably be
also

Error biomass Estimation
• Again if Sa or Sv have errors, so will the biomass estimation.
• Based on the assumption that surveyed fish represent the entire population of fish– Not necessarily true.– As seen before
Calibration

System Calibration
• Transducers must be calibrated– Insures accuracy
• Standard Sphere Method– Most common– Easiest

Homogenous sphere of known TS, usually made of copper or tungsten carbide
Acoustic energy
•Tether a sphere of known TS near transducer•Acoustic energy is sent•The acoustic energy is received•Compared to what should come out•Instruments are altered to give out that measurement Pictures Courtesy of Kevin Baille

Other Bits And Pieces

Calculating Signal Attenuation (More Rigorously)
Back

Transducers : Efficiency and Directivity
• Efficiency : Measure of the percentage of energy that is converted to sound
• Directivity Index (DI) : Ratio of beam intensity at the center over the mean intensity
DI = 1 DI = 2 DI > 2

Signal Processor: Compensation
• System Gain (Independent of System)– Efficiency and Directivity– How much energy actually got to the target?
Higher System GainLess Direct Lower System Gain
More DirectBack

Echo Integration (More Rigorously)• Sa is divided by the average active backscattering area
of the given species of fish, σ, (m^2/fish) to get density.
• Sa m^2/m^2 = σ m^2/fish
Density p(fish/m^2 of sea surface)

More Echo Integration• p is the density. Thus, p* the fish’s habitat area = the
amount of fish that are in the habitat. Thus:
• p (fish/m^2) * area of habitat (m^2) = Biomass (fish)
Back

Pulse Length
• = c * τ• C = speed of sound• τ = n * T
– N = number of cycles– T = period– F = frequency– T = 1/f
• τ = n / f

Resistance and Impedance
• Acoustics• Intensity = Pressure^2/Impedenace
• Circuts• Power = Voltage^2/Resistance
• Connection• Power is synonymous with Intensity• Pressure with Voltage• And Impedance with Resistance
Back