noaa technical memorandum nmfs - swfsc home page - swfsc
TRANSCRIPT

NOAA Technical Memorandum NMFS
AUGUST 1990
THE U.S. SEA URCHIN INDUSTRY
AND
NOAA-TM-NMFS-SWR-025 ,
U.S. DEPARTMENT OF COMMERCE National Oceanic and Atmospheric Administration National Marine Fisheries Service Southwest Region

NOAA Technical Memorandum NMFS
The National Oceanic and Atmospheric Administration (NOAA), organized in 1970, has evolved into an agency which establishes national policies and manages and conserves our oceanic, coastal, and atmospheric resources. An organizational element within NOAA, the Office of Fisheries is responsible for fisheries policy and the direction of the National Marine Fisheries Service (NMFS).
In addition to its formal publications, the NMFS uses the NOAA Technical Memorandum series to issue informal scientific and technical publications when complete formal review and editorial processing are not appropriate or feasible. Documents within this series, however, reflect sound professional work and may be referenced in the formal scientific and technical literature.

NOAA Technical Memorandum NMFS
This TM series is used for documentation and timely communication of preliminary resuks. interim repods. or special purpose information; and have not received mmplete formal review. editorial control. or detailed editing.
AUGUST 1990
THE U.S. SEA URCHIN INDUSTRY
AND
ITS MARKET IN TOKYO
Chi H. Phu
Southwest Region National Marine Fisheries Service, NOAA
Terminal Island, California 90731
NOM-TM-N MFS-S W R-025
US. DEPARTMENT OF COMMERCE Robert A. Mosbacher, Secretary National Oceanic and Atmospheric Administration John A. Knauss, Under Secretary for Oceans and Atmospheric National Marine Fisheries Service William W. Fox, Jr., Assistant Administrator for Fisheries

TABLE OF CONTENTS
Page
I . I1 . I11 .
IV . V . VI .
LIST OF TABLES ............................. LIST OF FIGURES ............................. LIST OF APPENDICES .......................... EXECUTIVE SUMMARY ........................... INTRODUCTION ................................ U.S. SEA URCHIN FISHERIES ................... U.S. SEA URCHIN INDUSTRY A . Exvessel Prices ........................ B . Processor's and Exporter's Costs ....... C . Sales Arrangements ...................... D . Packing, Shipping and Distribution ...... E . Exports ................................. F . Wholesale Prices in Tokyo ............... JAPAN'S SEA URCHIN FISHERIES ................ JAPAN'S IMPORTS .............................. CONCLUSIONS ................................. REFERENCES .................................. APPENDICES ..................................
ii
ii
iii
iv
1
1
6 7 8 9 10 11
14
14
18
19
22
i

LIST OF TABLES
Page
1. Airfreight rates, in cost per kilogram, for shipping sea urchins and sea urchin roe from the United States to Narita, Japan .................................... 8
2. U.S. exports of sea urchins and sea urchin roe, 1981-89 ............................................. 10
3 . Japan's sea urchin landings, 1975-87 (metric tons) ... 14
4. Japan's imports of sea urchins and sea urchin roe from the United States and the world 1975-89 (metric tons and millions of dollars) ....................... 15
5. Japan's imports of sea urchins and sea urchin roe by product form and major countries, 1988 (metric tons) ....................................... 17
LIST OF FIGURES
1. U.S. sea urchin landings by state, 1972-88 ..........
Page
3
2. Monthly average highest and lowest prices in dollars per tray paid in 1988 for U.S. sea urchin roe at the Tokyo Central Wholesale Market .................. 12
3 . Average daily number of trays of sea urchin roe traded in the Tokyo Central Wholesale Market and the country of origin, 1988 ......................... 13
4 . Index of Japan's imports of sea urchins and sea urchin roe from the United States, 1984-89 .......... 16
ii

LIST OF APPENDICES
Page
A . U . S . sea urchin landings by state, 1972-88 ........... 22
B. Sea urchin landings in northern and southern California, 1972-88 (metric tons) .................... 23
C. Daily number of trays of sea urchin roe traded and the highest and lowest prices paid for U.S. sea urchin roe at the Tokyo Central Wholesale Market ................ 24
D. List of U.S. sea urchin exporters ................... 30
E. List of Japan's sea urchin importers ................. 33

EXECUTIVE SUMMARY
The sea urchin fishery has been expanding in the United States, where the total landings exceeded 30,000 metric tons (mt) in 1988, surpassing that of the previous year by 30 percent. Most of the catches were made on the west coast, especially in California, which until 1987 accounted for about 90 percent of U.S. annual catches. In 1988, California's catch represented 73 percent of the total domestic catch, followed by Washington (15 percent), Maine (9 percent), Oregon (3 percent), and Alaska (less than one percent).
Because its large size allows economical processing, the red sea urchin (Stronsvlocentrotus franciscanus), found on the Pacific coast, continues to be the main target of U.S. commercial harvest on the west coast. The green sea urchin ( S . droebachiensis) is principally caught on the east coast off Maine. Recently, however, catches of green sea urchin have increased significantly on the west coast. In Washington, green sea urchins made up approximately 12 percent of the state's total sea urchin catch in 1988 compared to 2 percent in 1986. In Alaska, the green sea urchin landings increased sixfold from under 14 to over 86 mt during the same period.
U.S. exports of sea urchins and sea urchin roe (roe) were worth $68 million in 1989, compared with $42 million in 1988. In 1989, Japan was the largest buyer ($64.7 million), followed by Canada ($3.5 million) and Europe ($15 thousand).
Prices of whole sea urchins as well as roe are primarily determined by supply and demand, but quality, based on roe appearance, color, size, texture and freshness, is also important. In the Tokyo Central Wholesale Market, 1988 auction prices for fresh roe from the United States ranged from 4200 to U6,500 ($1.56 to $50.78 at V128 = US$1) per 225-260 g or 8-9 oz tray. Prices are generally unstable due, in part, to the increased flow of imports from several countries. U.S. exporters have difficulty competing in the Japanese market in summer, when supply of Japanese sea urchins is high.
Japan is by far the world's largest consumer and importer of roe. The United States and South Korea are the leading suppliers. In 1989, Japan's imports of sea urchins and roe were worth over $137 million. Of this total, imports from the United States were worth $67 million.
The import duty for sea urchins and roe, currently fixed at 10 percent, is higher than duty rates for most other seafood products imported into Japan under the General Agreement on Tariffs and Trade (GATT). Due to the nature of consigned shipments, import duties are paid by U.S. exporters. Should the duty be reduced or abolished, U.S. exporters would benefit and perhaps further development of the sea urchin fishery in
iv

unexploited areas would be encouraged. Therefore, it is recommended that appropriate U.S. agencies seek the reduction or elimination of the Japanese import tariff on sea urchins and roe.
V

I. INTRODUCTION
The U.S. fishery for sea urchins was developed in the early 1970s in California with the goal of providing sea urchin roe (roe) for the large seafood market in Japan. Today, the sea urchin fishery is among the fastest growing fisheries in the United States. Total domestic landings have increased rapidly, from 3,454 metric tons (mt) in 1975 to 30,879 mt in 1988. Most of these landings were made in California, but other states have recently started to contribute substantial amounts. A small amount is exported to Canada and Europe, but most is shipped to Japan, which continues to be the world's leading importer of sea urchin products (U.S. Dept. of Commerce, 1982-90).
Prices paid in Japan for imported roe can vary widely, depending on quality and the current supply, especially of the Japanese domestic product. Most imported fresh roe is sold through auction at the Tokyo Central Wholesale Market in Japan. Although roe from California is known to receive the highest auction prices among imported roe, only a small amount of roe actually is sold at the top prices. The reason most often given for this is that the roe is of inferior l1qualityl1 compared to the domestic product. The product from the west coast, particularly from California, has had a fairly long history of acceptance in Japan. Recently, green sea urchins from the east coast have started to appear in the Japanese market. This species has an advantage in being similar to a Japanese species found in Hokkaido, and is beginning to gain recognition.
Auction prices of roe published in Japanese seafood trading newspapers are often misleading because only the range of the lowest and highest prices is given. Further, the prices are not stable, fluctuating primarily with changes in supply and demand. Since processing of roe is labor-intensive, costs are rather high, and the business may not be as profitable as some may.think from glancing at the highest prices quoted for the product.
This report summarizes the development of the sea urchin fishery in the United States, and examines operational costs and prices. It also discusses Japan's sea urchin fishery and imports. Brief descriptions are also provided for various procedures used in packing, shipping, and distributing sea urchin products.
11. U.S. SEA URCHIN FISHERIES
The red sea urchin (Stronsvlocentrotus franciscanus) has been the main target of the U.S. sea urchin industry because of its abundance and because the species is large enough for economical harvesting and processing (Kato and Schroeter, 1985). In the United States, red sea urchins occur along the northeast Pacific coast from Alaska to the tip of Baja California. Green sea urchins ( S . droebachiensis), smaller in size and more difficult to process, are also present in the northeast and
1

northwest Pacific as well as in the northwest Atlantic (Mottet, 1976). A third species, the purple sea urchin (S. purpuratus) is also abundant in west coast waters, but it is not commercially harvested at present because of its small size. Red and green sea urchins are available throughout most of the year, but most U.S. landings are made from September to March when Japanese domestic supplies are at their lowest level.
U.S. landings of sea urchins have grown rapidly since the discovery of the export potential of sea urchins to Japan in the early 1970s. Total annual catches, primarily from California, have increased from under 3,500 metric tons (mt) in 1975 to over 30,000 mt in 1988 (Figure 1 and Appendix A). The largest contributor to this prosperity has been the increased demand in Japan. The strong Japanese yen relative to the U.S. dollar also created economic incentives for U.S. investors to expand the geographical areas of sea urchin harvests and thereby increase the volume of exports (D. Parker, pers. comm.). In addition, the increased capability to meet Japanese quality standards has contributed to today's expanded industry.
California
California was the first state to export sea urchin roe (roe) to Japan and annual catches there have risen from 3,440 mt in 1975 to over 22,000 mt in 1988 (Figure 1 and Appendix A). Prior to 1987, California accounted for over 93 percent of total domestic catches except for 1976 when Washington's catch increased dramatically (Appendix A). However, California's share has gradually decreased to 88 percent in 1987 and 73 percent in 1988.
Prior to 1985, almost 100 percent of the annual state catches were made in southern California, with approximately 75 percent of the sea urchins being harvested from the Channel Islands. During 1982-84, El Nifio, an oceanographic phenomenon characterized by increased sea temperatures, affected both the sea urchins and their source of food, giant kelp and other seaweed (Kato and Schroeter, 1985). These years saw lower landings of red sea urchins in southern California. Subsequently, annual catches in southern California recovered to 8,214 mt in 1985 and nearly 11,000 mt in 1986. Meanwhile, substantial catches were reported from Fort Bragg in northern California where 874 mt were harvested in 1985 compared to less than 30 mt in 1984 (Appendix B). Good weather, good demand, and a weakened dollar in recent years (Dewees, 1988) and fishing in unexploited areas (P. Kalvass, pers. comm.) contributed to the increased landings in the north. The northern California harvest has exceeded landings in the south during 1987 and 1988, with catches of 10,709 mt and 13,061 mt respectively. The catches in southern California were 10,226 mt in 1987 and 9,427 mt in 1988 (Appendix B) .
2

35
30
25
20
15
10
5
0
Maine
[li; Oregon
Alaska
1972
. . . . . . . . . . . . . . . . . . . . . . . . . . . . . . . .
Washington
California
76 80
YEAR 04 88
Figure 1. U.S. sea urchin landings by state, 1972-88.
3

Biologists of the California Department of Fish and Game (CDF&G) and members of the sea urchin industry are concerned about future stocks of red sea urchins if the present fishing rate persists. After much discussion among biologists and managers of the CDF&G, fishermen and processors, new regulations were recently enacted by the California Legislature to conserve the sea urchin resources. Effective March 8, 1989, the fishery was closed to new entrants until the number of diving permits was reduced to below 400; minimum harvestable sea urchin size was set at 7.6 cm ( 3 " ) in shell diameter. In addition, when commercial landings of red sea urchins in any year exceed 4,545 tons (10 million pounds) in northern California or 8,182 mt (18 million pounds) in southern California, fishing during the following year would be closed coastwide during the second complete week of each month, from May to September (CDF&G).
Washington
In Washington, the sea urchin industry had also experienced periods of boom (1976-79 and 1985-88) and recession (1980-84). Between 1976-79, sea urchin landings averaged 509 mt per year compared to an average of only 12 mt in 1972-75. The increased catches resulted from fishing on previously unexploited beds, as well as from nonrestrictive regulations in force during that period (Bradbury, 1987). Landings took a downturn in 1980 when only 20 mt were recorded. This decrease was primarily due to the bad reputation created by a few local exporters who shipped low quality roe to Japan in 1979 (A. Bradbury, pers. comm.). Total harvest remained relatively low through 1984. Not until 1985 did the harvest volume recover, and since then total annual catches have risen consistently. In 1988, Washington Department of Fisheries (WDF) records showed a total catch of 4,592 mt (over 10 million pounds), 12 percent of which was green sea urchins (Figure 1 and Appendix A).
Populations of red and green sea urchins in Washington are moderately abundant along the Strait of Juan de Fuca. Most of the catch has been taken from the San Juan Islands and Port Angeles. In 1986, WDF began to post landings of red and green sea urchins separately because green sea urchin landings increased rapidly, from 16 mt in 1986 to 559 mt in 1988. The annual harvest for red sea urchin has done equally well, increasing from 951 mt to 4,032 mt during the same period. Fishery development efforts have targeted on the red sea urchin because its larger size makes it more profitable to harvest and process. Processing the smaller green sea urchin requires greater skill and more time, so green sea urchins are usually shipped whole to Canada and Japan (A. Bradbury; M. Stewart, pers. comms. ) .
In 1986, the WDF enacted regulations based on harvest area, size of sea urchin, and season. The objectives of the regulations are to protect the sea urchin resources and to insure the long-term supply of good quality sea urchins (Washington
4

Administrative Codes, WAC 220-52-073 and 220-52-075). Presently, 60 to 70 boats are licensed to harvest sea urchins in Washington. To remain in the fishery, a boat owner must land a minimum of 9.1 mt (20,000 lbs) of sea urchins within two years. The fishery is currently closed to new entrants until the number of boats is reduced to below 45 (A. Bradbury, pers. comm.).
Alaska
Commercial harvest of sea urchins did not start until 1980 in Alaska, where the cold waters are home to both red and green sea urchins (Durr, 1989). Although the annual catches are quite small compared to those of California, they have increased from less than one mt in 1980 to 87 mt in 1988 (Appendix A).
Ketchikan in the southeast and Kodiak in the western gulf are the two principal sea urchin harvesting areas in Alaska. Green sea urchins may be more abundant near Kodiak and red sea urchins near Ketchikan.
The Alaskan sea urchin fishery and export trade have not yet been fully developed (D. House, pers. comm.). Resources are plentiful, but harvesting is not attractive because most areas of high availability of sea urchins are remote. Processors too, are discouraged by high overhead costs and the long distance from most harvesting areas to processing plants. Also, air shipment to Japan is difficult and inconsistent (Freeman, 1987). Sea urchins must be processed and marketed quickly to maintain good quality. In addition, because most Alaskan divers are inexperienced, problems have occurred concerning roe quality. As the divers gain more experience in judging roe quality in the field, and processors learn better handling and processing techniques, the quality of the product should improve, and the Alaskan fishery will grow (D. House, pers. comm.).
While Alaskan populations of sea urchins are not threatened, regulations have been enacted to promote efficient use of the resources. The Alaska Deptartment of Fish and Game (ADFbrG) has limited the harvest size of red urchins to between 7.6 cm ( 3 " ) and 11.4 cm (4%"). Harvest areas are also rotated. The catch of green sea urchins is not regulated at present. There are no restrictions on the number of fishermen allowed to enter into the fishery .
Oregon
The sea urchin fishery in Oregon was developed when catches declined in southern California in 1986. Annual landings started out at 25 mt in 1986 and increased to 885 mt by 1988. Most landings of red sea urchins have occurred at Port Orford, where 683 mt were landed in 1988. Port Orford has accounted for more than two-thirds of Oregon's total landings since the commercial fishery started. Coos Bay, with 91 mt in 1988, and Gold Beach,
5

with 82 mt in 1988 are two other landing ports (McCrae, 1989).
Overall, processors and harvesters are quite optimistic about the future of the Oregon sea urchin industry. Development of the sea urchin fishery has created jobs for local residents, and has increased Oregon's gross state product by several million dollars a year. However, recent high catches have caused some concern among local processors and harvesters who fear that reproductive capacity will be significantly reduced. Having observed the decreasing catch in southern California, regional businessmen have urged the Oregon Department of Fish and Wildlife (ODF&W) and local port commissions to manage the harvest of sea urchins to conserve existing resources (Schamehorn, 1989). The following regulations were implemented in January 1988: the number of fishermen was limited to 92 with non-transferable permits; sea urchins must be at least 7.6 cm (3") in shell diameter and taken from depths greater than 3 meters (10 feet) ; no more than two divers are allowed in the water at the same time off any one boat (McCrae, 1989).
Maine
On the east coast, Maine is the only state with a commercial fishery for sea urchins. Annual catches have surged rapidly, from 655 mt in 1987 to 2,828 mt in 1988 (Figure 1 and Appendix A). During the same period, the value of landings rose from $236,391 to $1,758,805 (National Marine Fisheries Service and Maine Department of Marine Resources). Roe of Maine green sea urchin is similar in size, texture, and color to that of Japanese products (S. Kato, pers. comm.).
Almost all green sea urchins harvested in Maine are shipped whole to Japan. The cost of air shipping whole sea urchins rather than roe is higher. But processing the small green sea urchin is costly as well as difficult, and processors run the risk of receiving lower net proceeds compared to shippers of whole sea urchins (Bernstein, 1989).
111. U.S. SEA URCHIN INDUSTRY
A. Exvessel prices
Prices for whole sea urchins in the United States are determined by market supply and demand as well as quality. During winter, the price of sea urchins reaches the highest point of the year for three reasons. First, the quality of sea urchin roe is often at its best. Second, this is a period of low production in Japan. Third, the demand in Japan is high during the holiday season (R. Juntz, K. Nishimoto, pers. comms.).
6

In California, exvessel prices of whole red sea urchins differ by catch areas. Sea urchins from the south are said to have better roe quality, and higher exvessel prices reflect this difference in quality (K. Nishimoto, pers. comm.). According to 1988 data collected by the CDF&G, the average landing price for red sea urchins in southern California, $1.03/kg ($0.47/lb), is about 56 percent more than the price in the north, $0.66/kg ($0.30/lb). Average landing prices of whole sea urchins in different states of the country in 1988 were as follows:
California: Red sea urchins = $0.81/kg
Washington: Red sea urchins = $0.63/kg Green sea urchins = $1.02/kg
Oregon : Red sea urchins = $0.59/kg
N/A - A1 aska : Red sea urchins - Green sea urchins = $1.76/kg
Maine: Green sea urchins = $0.62/kg
These prices, which are derived from dividing annual total landing value by total landing volume, were obtained from individual state fishery departments.
Written contracts between wholesalers and fishermen seldom exist in the U.S. sea urchin fishery. Divers work independently or in groups, and usually have informal sales agreements with certain processors or brokers. Prices are generally based on roe recovery and quality as well as on market conditions in Japan. Local supply is affected mainly by weather conditions, as bad weather prevents divers from harvesting in unprotected fishing grounds (K. Nishimoto, J. Wilson, pers. comms.).
B. Processor's and Exporter's Costs
Total cost of processing sea urchins is high due to its labor-intensive procedures. These include: cracking open the shell, removing the roe, cleaning, sorting, and packing (Kato & Schroeter, 1985). All these steps are time-consuming because careful handling is required to maintain roe quality. It is difficult to calculate exact costs because many of the expenditures are variable. However, total cost is relatively higher for smaller sea urchins because for the same amount of work, total output (roe) is less. The following are common expenses incurred by processors, who export their products to Japan :
7

Rent Insurance Labor Utilities Telephone, telex, and facsimile Whole sea urchins Processing and packing materials Landing tax Commission fees to broker Transportation (trucking and airfreight) Freight forwarders Handling fees (bank service) Import duty (in case of consignment sale) Others (sewage, sea urchin waste disposal, etc.)
U.S. Shipping Point
West Coast Boston and New York Anchorage, Alaska
Presently, sea urchins and roe are shipped to Japan from the United States primarily on Japan Air Lines and Korean Air Lines. Airfreight rates given in Table 1 are based on the former. The rates may vary around 5 percent for the latter. Airfreight rates from the United States to Osaka, Japan, are 3 to 10 percent higher.
Shipment weights
under 45 - 101 - over 45 kg 100 kg 300 kg 300 kg
$6.90 $5.25 $4.63 $2.43 8.22 6.24 5.51 3.09 6.31 4.81 4.23 1.76
Source: Japan Air Lines, Los Angeles, California.
C , Sales Arrangements
Generally, sea urchin sales are conducted through either consignment sale or direct sale. With that "consignment sale" method, the importer is responsible for clearing the shipment through Japan's customs, then delivering it to the auction market. Profit or loss for exporters is determined by the total revenue less all costs in the United States and in Japan. Costs in Japan include customs broker fee, transportation, and sales commission. Importers receive a commission from exporters for handling the shipment on consignment (D. Showalter, K. Nishimoto, pers. comms.) . In "direct salev1, a fixed price is set between exporters and importers. The exporter's responsibility ends after the shipment is aboard the carrier.
8

D. Packing, Shipping, and Distribution
Packing
Proper packing of fresh sea urchin roe is vital if the product is to receive high prices. Appearance is important to Japanese consumers especially in sushi restaurants where varieties of seafood are displayed. Exporters are aware of this and strive to ensure delivery of their products in optimal condition.
During processing, some skeins of roe are inevitably broken and lower quality roe (off-color, too large, etc.) are always found. Workers neatly arrange fresh roe by similar color and size in wooden trays (Kramer & Nordin, 1979; Kato & Schroeter, 1985). Usually, a stack of 8 to 12 trays, each holding 225-260 g (8-9 oz) of roe and with a wooden cover on the top tray, are tied together with string. Forty-two of these trays are then placed in an insulated shipping box along with two (in the winter) to four (in the summer) packs of gel ice to assure a cool temperature. Each pack of gel ice weighs 0.68 kg (1.5 lb) , and gross weight per shipping box is approximately 15-17 kg or 33-38 lb (H. Nakabayashi, pers. comm.).
Roe is also packed in bulk-pack foam trays. This is less costly in terms of packing materials, labor, and airfreight costs, but the roe need to be repacked in wooden trays in Japan (K. Nishimoto, pers. comm.).
Shipping
Since fresh roe is highly perishable, transporting time is critical for maintaining quality. Airfreight arrangements are made soon after sea urchins are received by processing plants. In southern California, exporters normally deliver their product to air cargo offices at Los Angeles International Airport before 10:30 P.M. This allows sufficient time for cargo to be shipped on the late night cargo flight to Tokyo, leaving between 1:00 A.M. and 2:OO A.M. This flight stops for two hours in Anchorage, Alaska for refueling, then resumes the trip to Tokyo. Occasionally, fresh roe is shipped on passenger flights (T. Oiwa, pers. comm.) .
Upon arrival in Japan around 7:OO A.M., cargo is unloaded within 30 minutes to an hour. One to two hours are needed for clearing customs. Usually, it takes 6-7 hours after arrival before the cargo is released to truckers (T. Oiwa, pers. comm.). Thus, the products will not be available for auction sale on the day of arrival, but rather on the following trading day.

Distribution
Fresh roe shipped to Tokyo from the United States is sold through auctions at the Tokyo Central Wholesale Market and other wholesale markets directly by importers, exporters, or through import agents. It is also sold to supermarket chains without going through wholesale auctions (T. Asakawa, pers. comm.).
Whole sea urchins are usually sold by importers to processors in northern Japan for processing (T. Asakawa, pers. comm.) . The tray-packed roe is then shipped to auction markets in Tokyo or elsewhere, or sold to local wholesalers (K. Nishimoto, pers. comm.).
Frozen or salted roe imported into Japan is usually sold directly to processors, who produce steamed, canned, and preserved roe, as well as other product forms (T. Asakawa, pers. comm. ) .
E. U.S. E x p o r t s
The strong demand for sea urchin roe in Japan was the principal impetus for development of the fishery in the United States. In 1989, the United States exported $68.3 million worth of sea urchins and roe, an increase of 62 percent compared with 1988. Export quantity also rose to 5,575 metric tons (mt), more than double the 1988 quantity. Of this total, 90 percent was exported to Japan, 10 percent to Canada, and less than one percent to other countries (Table 2). Until 1985, U.S. statistics of sea urchin exports referred only to roe, (fresh, frozen, and salted). Since 1985, however, these statistics have been confounded by the inclusion of whole sea urchins, which weigh some 10-20 times more than roe.
Table 2. U.S. exports of sea urchins and sea urchin roe, 1981-89 .
Year
1981 1982 1983 1984 1985 1986 1987 1988 1989
Jawan 0 V
65 910 29 310 28 411 89 895 354 5,899 658 12,420
1,598 28,228 2,421 39,942 4,990 64,682
Canada _ e - V
0 0 3 14
1 3 13 3 55 5 28 3 9
148 1,927 582 3,530
--
Eurowe 9 JT-
0 0 0 0
2 0 0 0 0
42 470 3 15 16 195
15
--
--
Total* 0 V
76 926 32 327 28 414 92 908
705 12,921 1,605 28,258 2,586 42,089 5,575 68,264
358 5,974
Note: 1981-84 data are for sea urchin roe only. * Total may include other countries not listed. V = Thousands of dollars; -- = Less than one metric ton. Source: U.S. Dept. of Commerce, Bureau of the Census, 1982-90.
Q = Metric tons;
10

California, by far the leading exporter, shipped mostly roe to Japan. Most red sea urchins harvested in Washington and Oregon also were exported to Japan as roe. Part of the catches was shipped whole to Canada, where the sea urchins are processed and reexported to Japan (A. Bradbury, J. McCrae, pers. comms.) . But green sea urchins from Maine, Washington, and Alaska were primarily sent whole to Japan, where the roe is extracted and packed.
F. Wholesale Prices in Tokyo
Most imported fresh sea urchin roe (roe) is sold by auction at the Tokyo Central Wholesale Market. The prices paid depend primarily on roe quality and the availability of Japanese roe. Highest prices are paid for roe which is bright yellow or orange, firm and smooth (not grainy), unbroken, and packed neatly in trays (Pacific Fishing, 1980).
Prices reported by the Japanese daily seafood trading newspaper, The Nikkan-Shokurvo Shimbun, give the range in daily auction prices. Figure 2 shows the monthly average prices derived from 16 to 20 daily auction prices for roe imported from the United States in 1988. Tables showing daily price ranges of U.S. roe and the supply (Japanese domestic product and imports) are given in Appendix C. It should be stressed that only a small fraction of U.S. roe exported to Japan receives the highest auction price (K. Nishimoto, pers. comm.). The line representing the average of daily highest prices by month in Figure 2 can be divided into three periods to indicate seasonal price trends during the year. Based on the price quotations, the highest price period for U.S. roe occurs from October through January. The peak prices occurred in November, averaging Y5,360 ($42.88 at Y125 = US$1) per tray. These high prices reflect the low availability of Japanese roe as the Japanese sea urchin fishery is relatively inactive in winter (Figure 3).
A medium price period runs from February to May, during which time the highest auction prices were moderate, averaging Y4,276 ($33.67 at g127 = US$1) per tray. This is the period when the Japanese domestic supply begins to increase (Figure 3; Takagi, 1985).
The lowest price period is from June to September. The price was lowest in June averaging Y2,968 ($23.74 at 4125 = US$1) per tray. High availability of Japanese sea urchins causes lower prices for the U.S. product (Figure 3).
Auction prices at the low end of the range (Figure 2) are usually for low quality roe, and are not necessarily related to supply and demand.

50
40
r- a U I- 30 U w v> a.
9 4 20 0 n
10
0
Average highest price
Average lowest price - - - .
I I I I I I I I I I I I
J F M A M J J A S O N D
MONTH
* 225-260 g (8-9 02).
Note: Monthly yen/dollar exchange rates are: J-126, F-129, M-129, A-126, M-125, J-125, J-131, A-133, S-134, 0-1 33, N-125 and D-122.
Figure 2. Monthly average highest and lowest prices in dollars per tray paid in 1988 for U.S. sea urchin roe at the Tokyo Central Wholesale Market.
12

25
20
Y a 15 a F a z a Cn 3 10 0 r I-
5
0
n
Canada
U.S.A.
S. Korea
J F M A M J J A S O N D
MONTH
Figure 3. Average daily number of trays of sea urchin roe traded in the Tokyo Central Wholesale Market and the country of origin, 1988.

IV. JAPAN'S SEA URCHIN FISHERIES
1975 22 , 482 1976 23 , 085 1977 26,898 1978 25,930 1979 26,500
Japan was the world's largest harvester of sea urchins until 1984. From 1985 to 1987, landings in Chile have exceeded Japanese landings (FAO, vol. 42, 48, 54, & 64). From 1975 through 1987, annual Japanese landings fluctuated between 22,000 and 27,000 mt (Table 3).
1980 24 , 158 1985 22 , 745 1981 23 , 984 1986 23 , 072 1982 25,975 1987 22,760 1983 25 , 254 1984 23 , 962
Table 3. Japan's sea urchin landings, 1975-87 (metric tons).
Year Landings I Year Landings I Year Landings
Sources: FAO, Yearbook of Fishery Statistics, Catches and Landings, vols. 42, 48, 54 and 64.
At least eight species of sea urchin are commercially harvested in Japan. Three major species found in southern Japanese waters are: Hemicentrotus pulcherrimus, Pseudocentrotus depressus, and Anthocidaris crassispina. Five minor species include Stronavlocentrotus intermedius, which is principally found on the coasts of Hokkaido; S. nudus Tripneustes aratilla, Mespilia alobulus, and Temnopleurus toreumaticus are mostly found off southern Japan. Of these eight species, five are harvested mainly from June to August. But H. pulcherrimus is taken in March and April, and p. depressus and S . nudus, from September to November (Takagi, 1985). The different peak fishing seasons in Japan (summer) and North America (winter) have benefited U.S. exporters in marketing sea urchins (Kramer & Nordin, 1979).
V. JAPAN'S IMPORTS
To fill the high demand for sea urchin roe, Japan increased imports from 1,684 mt valued at $10.3 million in 1975 to 4,845 mt at $136.9 million in 1989. From 1984 to 1989, Japan's imports from the United States have more than quadrupled in volume and the import value in yen has more than tripled. In terms of dollars, however, the import value in 1989 was more than six times the amount in 1984 (Table 4 and Figure 4). The difference resulted from the depreciation of the U.S. dollar which occurred after 1985. Table 4 also shows a sharp increase in Japan's imports from the United States starting in 1986, exceeding a thousand metric tons for four consecutive years. This increase was due to two factors. One was the sharp increase in catches of red sea urchins in northern California, and the other was the development of the green sea urchin fisheries in Maine, Alaska,
14

and Washington. The latter are imported whole rather than as roe, and the statistics do not differentiate between the two product forms. Thus , the increased imports from the United States are not as substantial as these statistics seem to indicate.
Table 4. Japan's imports of sea urchins and sea urchin roe from the United States and the world, 1975-89 (metric tons and millions of dollars).
Japan s Imports from the Total ImDorts United States Yen/Dol lar
Year Volume Value Volume Value Exchange Rate
1975 1976 1977 1978 1979 1980 1981 1982 1983 1984 1985 1986 1987 1988 1989+
1,684 1,874 2,458 2,315 2 , 502 2 , 207 2 , 426 2 , 397 2 , 321 2,636 2 , 857 3 , 601 3,696 4 , 651 4,845
~
10.3 14.4 20.5 23.9 30.5 28.4 34.1 32.3 34.4 43.1 45.5 74.3 99.3 140.5 136.9
232 357 511 486 759 590 637 497 411 539 888
1,243 1,564 1,750 2,301
2.5 4.1 5.9 6.3
11.1 10.0 12.1 9.4 8.7 10.5 15.9 26.5 40.2 53.7 67.0
297 297 269 210 219 227 221 249 238 238 239 169 145 128 138
+ Preliminary. Sources: Japanese Marine Products Importers Association,
1976-89. National Marine Fisheries Service, 1989-90. International Monetary Fund, 1985 and 1989. Suisan Keizai Shimbun, February 22, 1990.
The United States and South Korea are the leading suppliers of live or fresh products (Table 5). Table 5 also shows increased imports of live or fresh product forms from South Korea during the summer, while imports from the United States are primarily from fall through winter. The United States is also the largest supplier of frozen roe. South and North Korea provide most of the dried or salted product.
15

700
600
500
400
300
200
100
0
Value (dollar)
Volume
0 0 0 0 0
0 0
0 0
0 Value (Yen) 0
.e....* b..
0 0 Yen/dollar exchange rate 4 0 0 0
0 0
0 0
0
1984
Figure 4.
1 1 1 -I
05 86 87 88 89
YEAR
Index of Japan’s imports of sea urchins and sea urchin roe from the United States, 1984-89.
16

Table 5. Japan's imports of sea urchins and sea urchin roe by product form and major countries, 1988 (metric tons).
Product form & Countries Jan. Feb. Mar. Apr. May June July
Live/Fresh South Korea 56 32 56 66 91 108 80 U.S.A. 122 109 88 82 84 66 84 Canada 38 30 24 14 25 15 14
Total* Frozen
U.S.A. Chile
Total* Dried/Salted
South Korea North Korea China
222 175 179 186 209 193 186
17 20 14 21 3 10 22 29 14 11 N/A N/A 14 31
59 38 31 28 10 31 53
70 25 75 9 19 5 6 14 26 5 21 12 24 55 18 17 N/A 10 N/A 19 6
Total* 110 76 96 55 43 73 84
Product form January to & Countries Aug. Sept. Oct. Nov . Dec. December
Live/ Fresh South Korea 92 60 62 67 78 848 U.S.A. 96 101 193 109 171 1,305 Canada 19 29 61 63 73 406
Total* Frozen
U.S.A. Chile
Total* Dried/Salted South Korea
North Korea China
Total*
209 192 318 244 330 2,643
47 80 59 74 65 432 7 16 5 33 17 179
84 105 79 129 112 760
4 7 22 72 132 444 79 30 84 20 60 430 8 19 41 29 44 210
101 64 158 136 251 1,248
* Total also includes other countries not listed. N/A - not available. Sources: Japan Marine Products Importers Association, 1989.
Japan Tariff Association, 1989. National Marine Fisheries Service, 1988-89.
17

VI. CONCLUSIONS
The sea urchin fishery in the United States has expanded significantly in recent years. Overall, growth should continue in the future, probably at a slower rate, as new fishing grounds are developed. Regulations have been instituted in several states to conserve sea urchin resources. These include harvest restrictions based on sea urchin size, as well as seasonal and areal closures. In addition, the number of licensed harvesters has been regulated in some states.
U.S. exports of sea urchins and sea urchin roe have risen primarily due to increased demand in Japan. The strength of the yen against the dollar has made U.S. products more competitive in the Japanese import market. If the demand and monetary conditions remain favorable, U.S. exports should continue to increase, provided that processors furnish good quality products, which is the key to success in the demanding Japanese seafood market.
Fresh sea urchin roe is the best product form to export to Japan. Despite the high cost of processing and maintaining roe quality over long distances, the high prices paid for fresh roe make processing profitable. Auction prices for fresh roe have been as high as M6,500 ($50.78 at US$1 = Y128) per tray (225-260 g or 8-9 oz) in winter, but average prices for the U.S. product range between V2,OOO ($15.63) and g3,OOO ($23.44). If the sea urchins are small, like green and purple sea urchins, it is probably more cost effective to export them whole rather than processed.
The import duty of 10 percent for sea urchins and roe is higher than duty rates for most other seafood products imported into Japan. Due to the nature of consigned shipments, import duties are paid by U.S. exporters. Should the duty be reduced or abolished, U.S. exporters would benefit and perhaps further development in the sea urchin fishery in unexploited areas would be encouraged.
18

REFERENCES
Asakawa, T. U.S. Embassy, Tokyo, Japan (personal communication).
Alaska Department of Fish & Game. Division of Commercial Fisheries, Juneau, Alaska.
Bernstein, B. 1989. Maine divers jump into the urchin roe market. National Fisherman, 70(1): 14-17.
Bradbury, A. 1987. Washington sea urchin fishery. Washington Department of Fisheries. Brinnon, Washington, Information Bulletin, 8p. (Revision of original by R. M. Clifton and C. R. Jones).
Bradbury, A. Washington Department of Fisheries, Brinnon, Washington (personal communication).
California Department of Fish & Game. Marine Fisheries Statistics Division, Long Beach, California.
. The Resources Agency, Sacramento, California.
Dewees, C. 1988. California's sea urchin fishery continues to expand. California Sea Grant Marine Advisory Newsletter, May-June. University of California, Davis. 4p.
Durr, K. 1989. Two Kodiak divers bank on urchin roe. National Fisherman, 69 (10) : 8-9.
Embassy of Chile, Commercial Office, Tokyo, Japan.
Food and Agriculture Organization of the United Nations. Various years. "FA0 Yearbook of Fishery Statistics, Catches & Landings Series.!' Vols. 42, 48, 54 and 64.
Freeman, K. 1987. Diving for urchins: A prickly business. National Fisherman, 68(4): 12-15.
House, D. Alaska Department of Fish and Game, Ketchikan, Alaska (personal communication).
International Monetary Fund. Various years. International Financial Statistics, Washington, D.C.
Instituto Nacional de Pesca, Ensenada, Mexico.
Japan Air Lines, L o s Angeles, California.
Japan Marine Products Importers Association, 1976-89 "Japanese Imports of Marine Products (Statistics),!! Calendar years 1975-88, Tokyo, Japan.
19

Japanese Tariff Association. Japan Exports & Imports, Commodity by Country, 1989.
Juntz, R. Ocean Fresh Seafood Products, Fort Bragg, California. (personal communication).
Kalvass, P. California Department of Fish and Game, Fort Bragg, California (personal communication).
Kato, S . and S.C. Schroeter. 1985. Biology of the red sea urchin, Stronsvlocentrotidae franciscanus, and its fishery in California. Marine Fisheries Review, 47(3): 1-20.
Kato, S . NOAA, National Marine Fisheries Service, Southwest Region, Tiburon Lab. , Tiburon, California (personal communication) .
Kramer, D.E. and D.M.A. Nordin. 1979. Studies on the handling and processing of sea urchin roe. I. Fresh product. Technical Report No. 870. Department of Fisheries and Oceans, Vancouver, British Columbia, 47p.
Maine Department of Marine Resources, Lamoine, Maine.
McCrae, J. 1989. Oregon's sea urchin fishery, 1986-88, Oregon Department of Fish and Wildlife, Progress Report: 13p.
McCrae, J. Oregon Department of Fish and Wildlife, Newport, Oregon (personal communication).
Mottet, M. G. 1976. The fishery biology of sea urchins in the family Stronsvlocentrotidae, Technical Report No. 20, Washington State Department of Fisheries, 66p.
Nakabayashi , H. 'IKI' Line Air Service, El Segundo, California (personal communication).
National Marine Fisheries Service, 1988-90. Foreign Fishery Information Release, Various issues. NOAA, NMFS, SW Regional Office.
Nikkan-Shokuryo Shimbun [Japanese daily seafood trading newspapaers] 1988. Various issues.
Nishimoto, K. San Francisco Uni Product Inc., Fort Bragg, California (personal communication).
Oiwa, T. Japan Air Lines, Los Angeles, California (personal communication) .
20

Oregon Department of Fish and Wildlife, Marine Region, Newport, Oregon.
Pacific Fishing. 1980. Sea urchins: prickly fishery tickles Japan's fancy (written by staff). May 1980, l(5): 28-32.
Parker, D. California Department of Fish and Game, Long Beach, California (personal communication).
Schamehorn, M. 1989. South coast urchin harvesting could die from ODFW ignorance. The Fishermen's News. February 1989. 17p.
Showalter, D. Premium Pacific Seafood, Inc., Portland, Oregon (personal communication) .
Stewart, M. Trans-Ocean Enterprise Inc., Seattle, Washington (personal communication).
Suisan Keizai Shimbun, February 22, 1990. (in Japanese)
Takagi, K . 1986. Aspects of the sea urchin fishery in Japan. Proceedings of the Thirty-Seventh Annual Gulf and Caribbean Fisheries Institute, 40-51.
U.S. Department of Commerce. Bureau of the Census, 1982-90.
U.S. Embassy, Commercial Section, Tokyo, Japan.
Washington Administrative Code, Washington Dept. of Fisheries, Patrol Division, Olympia, Washington.
Washington Department of Fisheries. Data Management Division,
Wilson, J. Commercial diver, San Pedro, California (personal
Olympia, WA.
communication) .
21

Appendix A. U.S. sea urchin landings by state, 1972-88 (metric tons)
Year Alaska California Washington Oregon Maine Total
1972
1974 1975 1976 1977 1978 1979 1980 1981 1982 1983 1984 1985 1986 1987 1988
1973
0.4 0.7 0.3 0.9
27.9 63.4 143.3 344.3 86.6
34.8 1.1 1,634.0 6.7 3,300.8 26.1 3,439.6 14.1 5,048.4 702.0 7,516.5 410.2 6,558.0 467.2
10 , 076.0 19.7
8,440.1 92.0 7,184.1 187.4 6,679.2 187.3 9,088.6 291.8 15 , 514.0 966.5 20,936.0 1,774.2 22,487.6 4,591.8
9,344.5 455.5
12 , 035.2 122.0
--- 25.4 92.2
885.1
35.9 1,640.7 3,256.9
5,750.4 7,926.7 7,025.2 9,800.0 10,096.1 12 , 157.9 8,532.4 7,372.4 6,894.4 9,443.8 16,649.2 23 , 801.3 30,879.3
3,453.7
Sources: Alaska Department of Fish and Game. California Department of Fish and Game. Washington Department of Fisheries. Oregon Department of Fish and Wildlife. National Marine Fisheries Service. Maine Department of Marine Resources.
22

Appendix B. Sea urchin landings in northern and southern California, 1972-88. (metric tons)
Year Northern* Southern** Total
1972 1973 1974 1975 1976 1977 1978 1979 1980 1981 1982 1983 1984 1985 1986 1987 1988
--- 4.9
23.4 1.4
43.1 175.5 23.5 107.4 95.1 105.8 22.9 17.4 28.8
874.4 4,624.7 10,709.2 13 , 060.5
34.7 1,629.1 3 , 207.5 3,438.2 5,005.3 7,341.0 6,534.5 9,237.6 9,980.9
11,929.4 8,417.2 7,166.7 6,650.4 8 , 214.2 10 , 889.2 10,226.4 9,427.1
34.8 1,634.0 3,230.9 3,439.6 5,048.4 7,516.5 6,558.0
10 , 076.0 12 , 035.2 8,440.1 7,184.1 6,679.2 9,088.6
15 , 514.0 20 , 935.6 22,487.6
9,345.0
* Includes Eureka, San Francisco and Monterey districts. ** Includes Santa Barbara, L o s Angeles and San Diego districts. --- = Less than one metric ton.
Source: California Department of Fish and Game.

APPENDIX C. Daily number of trays of sea urchin roe traded and the highest and lowest wholesale prices paid for U.S. sea urchin roe at the Tokyo Central Wholesale Market.
1988 Number of Trays Yen/Trav* Date Japan S. Korea U.S.A. Canada Lowest Hiqhest
I/ 6 1,134 0 11,531 4,825 I/ 7 1,710 0 16,755 3,754 1/ 8 2,755 0 16,665 2,134 1/11 1,381 0 17,747 4,052 1/12 1,116 27 8,225 2,700 1/13 3,195 0 6,713 2,262 1/14 4,865 119 12,109 0 1/18 3,992 130 10,712 0 1/19 4,067 390 6,703 0 1/20 2,635 1,771 3,174 0 1/21 2,607 369 2,080 0 1/25 5,191 1,512 11,753 0 1/26 2,327 130 7,792 0 1/27 1,594 130 4,392 0 1/28 2,401 0 11,781 2,460 1/29 2,635 0 11,278 2,404
850 500 500 500 800 800 900
900 400 400
1,400 1,200 1,400
800 1,000
1,000
6,500 6,000 5,800 5,000 4 , 700 5,200 5,000 5,200 5,000 4,500 4,300 4 , 000 4,800 4 , 000 5,200 5,200
Avg . 2,725 286 9,963 1,537 834 5,025
2/1 4,504 2/2 3,844 2/3 1,534 2/4 1,056 2/5 2,858 2/8 4,308 2/9 1,762
2/15 4,174 2/16 1,707 2/17 1,382 2/18 2,518 2/22 3,700 2/23 3,388 2/24 2,413 2/25 2,185 2/29 2,500
2/10 3,944
0 22,518 0 9,758
390 6,157 0 9,554
910 11,560 0 23,241
187 11,555 0 12,301
749 9,536 619 5,850 130 3 , 809 581 3 , 867
0 3,116
0 2 , 196 0 6,194 0 22,833
130 4 , 553
5,076 4,497
0 1,624
3,691 0
4 , 670 2,961 2,613 2,540 4,754 3 , 144 2,943 1,780 828
3,443
4 , 777
550 650 700 750 700 800 700 750 800 500
1,300 1,400 1,200
900 2 , 200
600 800
4 , 200 4,000 3,600 3 , 700 4,000 4,000 4 , 300 4,700 4 , 800 4 , 700 4 , 900 4,600 4 , 500 4,200 4,300 4,800 4,800
Avg . 2,810 2 17 9,918 2,902 900 4,359
24

APPENDIX C (continued) . 1988 N u m b e r of Trays Yen/TraY* Date Japan S . Korea U . S . A . Canada Lowest H i s h e s t
3/1 3/2 3/3 3/7 3/8 3/9 3/10 3/14 3/15 3/16 3/18 3/22 3/23 3/24 3/25 3/28 3/29 3/30 3/31
1,477 1,973 1,809
4,103 5,260 4 , 194 4 , 340 4,186 3 , 938 4 , 599 6,825 2,612 2,645 3,105
4,268 3,254 3,126
4,333
4,534
896 260
2 , 707 260
0 899 349
5,112 2 , 924
942 2 , 468
910 1,375
107 468
5,007 5,601 2,101 1,020
14 , 569 7,175 6,298 6,829 5,697 1,107 5,526 5,641 5,671 1,265
12 , 293 23,133 8 , 108
13 , 113 11,315 9,462 5,514 4,384 2 , 898
1,510 600 560
5,430 1,320 2,206
900 2,446 3 , 504
600
4,224 3,658 2,724 1,920 2,316 1,564
690 6,194
4,955
900 1,000 1,100
800 600
1,400 1,000
900 900
2,300 950 650 500 500 600 800 600 500 800
4,000 4 , 500 4 , 800 5,000 4 , 500 4 , 000 4 , 800 4,500 4,600 4 , 700 4 , 600 4,300 4,500 4,800 5,000 5,000 4,400 4 , 800 4,300
A v g . 3,715 1,758 7 , 895 2,491 884 4 , 584
1988 Date
4/1 4/5 4/6 4/ 7 4/8 4/11 4/12 4/13 4/14 4/15 4/18 4/19 4/20 4/21 4/22 4/25 4/26 4/27 4/28
Number of Travs Japan S. Korea U . S . A . Canada
4,427 3 , 600 3,142 4,467 3 , 961 4,251 6,099 3 , 576 1,304 5,037 1,865 6,527 5,156 16,090 7,014 2,973 3,770 10,039 2,707 3 , 748 4,283 4,042 3,974 1,392
2,807 1,585 10,738 5,012 4,239 10,624 4,698 1,481 6,516 4,475 0 4 , 263 4 , 270 3,492 2,476 5,615 2 , 942 3,240 5,644 3 , 882 5,202 3 , 779 4,921 4,644 4,343 5,296 695 5,282 5,297 15,173
2,724 6,743 9,010
2 , 726 2 , 578
458 587 216
0 55 0 0
3,288 1,680 3 , 014 2 , 150 1,140 996
0 270
0 2 , 856
Yen/Trav* Lowest H i shes t
1,300 2,300 1,500 1,000 1,400 1,300 1,600 1,500 1,300
700 500 600 600 650 500
1,700 1,500 1,800 1,300
4 , 500 5,200 4 , 800 5,200 5,200 4 , 300 4 , 600 5,000 4 , 800 4 , 800 4 , 000 3 , 700 3,300 3,400 3 , 800 4,400 4 , 500 4 , 000 4,500
A v g . 4 , 398 4,235 5,870 1,159
25
1,213 4,421

APPENDIX C (cont inued) .
1988 Date
5/2 5/ 6 5/ 9
5/12
5/10 5/11
5/ 13 5/16 5/17 5/18 5/19 5/20 5/23 5/24 5/25 5/26 5/27 5/30 5/31
N u m b e r of Trays JaPan S . Korea U.S.A. Canada
6,860 5,651 4,202 3 , 536 7,024 3 , 193 5,493 2 , 654 4,433 3 , 000 3 , 488 4 , 074 4,283 7,696
5,409 9,262 6,750 5,900 8 , 274 7,320 8 , 963 9,231
12 , 535 9 , 577 3 , 308 7,032 3 , 899 4 , 474 3 , 705 1,614 3 , 691 3,517 6,931 15,046 5,544 3 , 148
4,683 9,435
21,707 5,929 11,293 1,984 2,129 1,868 1,435 0
587 0 5,990 0 7,584 2,014 7,710 3,037 5,008 3,470 1,734 1,360 5,450 1,008 8,542 3,000 4,120 708 3 , 842 630 1,704 3,141 6,542 2,772 4,803 1,991 7,752 3,106 7,146 360
Yen/Tray* Lowest H i s h e s t
500 900
1,200 1,200 1,200 800 700 900 700 800 500 400 700 800 850 300 400 700 500
3 , 800 4 , 500 4 , 800 3 , 500 4 , 000 4 , 500 4 , 500 3 , 700 3 , 300 3 , 500 3 , 000 3,400 3 , 500 3,800 3,800 4,300 4 , 000 3 , 300
2 , 000
Avg . 5,762 6,072 6,057 1,915 739 3 , 747
~~~ ~ ~
1988 N u m b e r of Travs Yen/Trav* Date Japan S. Korea U.S.A. Canada Lowest Hishest
6/ 1 6/ 2 6/ 3 6/6 6/ 7 6/ 8 6/ 9 6/10 6/ 13 6/ 14 6/16 6/2 0 6/2 1 6/23 6/24 6/27 6/28 6/29 6/30
4 , 938 7,325 3 , 009 5,565 9 , 164 3,717
7,154 10,291 6,029 3 , 776 7,845 4 , 905 5,233 6,794 2,225 5,933 12,669 1,965 7,579 7 , 939 1,621 10,821 14,695 930 5,456 0 11,005 9,318 11,017 168 11,085 5,651 10,004 8,497 4 , 355 9 , 299 8 , 550 6,457 5,280 12 , 990 5,793 7 , 824 6,880 1,602 5,387 6,623 2 , 244 2 , 684 7,921 4 , 496 3 , 581
6,742 2 , 963 4 , 733
13,265 11,654 7,733
2,748 2 , 844 1,727
540 0
506 444
1,783 540
2 , 640 1,140
1,752 3,461 2,484 1,368 1,788 1,578 239
3 , 395
600 400 300 750 500
1,100 800
1,400 1,700
200 1,800
600 600 400 500 400 600 600 700
3 , 000 3 , 300 3 , 300 4 , 000 3 , 300 3 , 700 3 , 800 4 , 000
1,800
2 , 800 2 , 800 2,800 2 , 500 2 , 800 2 , 700 2 , 500 3 , 000
2 , 200
2 , 100
A v g . 7 , 829 6,998 4 , 847 1,630
26
734 2 , 968

APPENDIX C (continued).
1988 Number of Trays Yen/Trav* Date Japan S. Korea U.S.A. Canada Lowest Hishest
7/1 7/4 7/5 7/6 7/8 7/11 7/12 7/13 7/14 7/18 7/19 7/20 7/21 7/22 7/25 7/28 7/29
8,649 3,467 4,441 9,232 7 , 674 2 , 874 7 , 545 6,174 2,417 7 , 574 7 , 005 1,070 7 , 539 6,847 3 , 182 8,793 10,506 0 8,111 10,562 0 8,541 9 , 574 0 8 , 485 7,212 1,970 8,908 3,664 11,603 8,190 2 , 679 7,288 6,293 1 , 300 1,711 8,053 1,292 6,902 10 , 259 1,536 7 , 175 11,573 1,630 6,614 13 , 601 1,940 4,631 8 , 593 126 3 , 969
0 2 , 328 1,167
0 0
1 , 620 636 0
539 2 , 940 1,845 2 , 350 1,259 1,980 2,460 2 , 097
420
1,050 3,200
1,250 3,000 2,600 3,200 1,200 3,300 1,300 3,500 1,400 3,800 700 3,000 300 3,200 800 3,000 800 3,000 300 3,000 700 3,000
700 3,000
1,300 3,000
1,100 3,000
1,200 3,000
1,200 3,000
A v g . 8 , 820 4,893 3 , 873 1,273 872 3,129
1988 Number of Trays Date Japan S. Korea U.S.A. Canada
8/1 8/3 8/4 8/5 8/8 8/9 8/10 8/12 8/19 8/23 8/24 8/25 8/26 8/29 8/30 8/31
12 , 504
5,428 8,304 11 , 712 11,406 8 , 579 8,991 5,252 5 , 650 4 , 281 5,503 6,192 7 , 169
3,410
5,957
5,933
6,653 6,658 5,183 3 , 187 6,350 2 , 106 5 , 036 2,434
0 962
1,603 2 , 381 4 , 398
572 1,359 1,378
8 , 649 1,072 7,117 4,746 7 , 874 5,460
252 7 , 472 5,772 6,195 2,463 8,960 8,243 12 , 101 6,721 2 , 054
2,520 1,260 1,068 3 , 187 3 , 048 1,367 1,918 1,140 2 , 878 1,920 1,140 719
1,607 3 , 108 2 , 940 1,440
Yen/Trav* Lowest Hishest
700 2 , 800 1,250 2 , 600
700 3 , 000 650 3 , 000 600 2 , 800 500 3 , 000
1,000 1,300 700 2 , 900
1,000 5,000 400 3 , 000 600 2 , 800 400 3 , 600 450 3,400 600 3 , 800 400 3 , 500
3 , 500 2 , 500 A v g . 7,267 3,141 5,947 1,954 742 3,125
27

APPENDIX C (continued) - 1988 Number of Trays Yen/Trav* Date Japan S. Korea U.S.A. Canada Lowest Hishest
9/2 9/5 9/7 9/8 9/9 9/12 9/13 9/14 9/16 9/19 9/20 9/21 9/26 9/27 9/28 9/29 9/30
3 , 983 7,721 9 , 563 6,485 6,863
11,201 7,379
10,806 8,733 6,085 4 , 088 4 , 659 7,684 4 , 468 3 , 480 2 , 854 3 , 163
709 709
0 0 0
2 , 451 4 , 195 3 , 458
650 306 301 130 0
124 0 0 0
8,241 4,103 12,285 3,059 4,116 2,399 7,189 2,687 8,574 2,028 1,891 3,708 291 1,932
7,653 1,932 19,173 2,700 10,578 1,134 2,738 7,709
12,418 4,257 6,670 1,431 1,384 1,769
14,391 2,106 13,943 2,921
1,722 0
200 500 400
400 400
2 , 800 900 400 450 300 500 300 500 500 400 300
1,000
4,300 4 , 500 2 , 500 1,800 2 , 200 2,200 3 , 000 1,800 3,800 3,300 3 , 500 3,300 4 , 500 4,000 3 , 500 3,600 3 , 500
Avg . 6 , 4 2 4 767 7,839 2,867 603 3 , 253
1988 Number of Trays D a t e JaDan S. Korea U.S.A. Canada
10/3 10/4 10/5 10/6 10/7 10/11 10/12 10/13 10/14 10/17 10/19 10/20 10/21 10/24 10/26 10/27 10/28 10/31
3 , 105 3 , 010 3 , 038 1,831 2,732 2 , 660 1,321 1,040 2 , 196 1,281 1,589 1,338 1,733 1,446 1,061 1,064 1,024
866
0 15,598 0 13,394 0 7,085 0 10,713 0 11,885 0 13,124 0 7,233
13 8 , 947
65 23,884 0 5,252
520 15,197 390 21,420 0 7 , 396 0 12,131
130 12,051 0 25,222
0 10,109
377 9,010
5,172 3 , 186 3 , 194 2 , 477 4,176 3 , 768 4,304 4 , 044 4 , 577 7 , 728 5,554 1,230 8 , 818 6,456 4,176
3 , 768 6,972
5,434
Y en/Trav* Lowest Hishes t
500 400 400 300 500 500 400 450 350 350 500 400 500 300 500 400 450 400
4 , 500 4 , 500 4 , 800 5,000 5,100 5,500 5,500 6,000 5,500 5,500 5,500 5,000 5,000 5,300 5,500 4 , 800 4 , 500 4,700
Avg . 1,796 269 12,758 4 , 724 422 5,122
28

APPENDIX C (continued) . 1988 Number of Travs Yen/Tray* Date Japan S. Korea U . S . A . Canada Lowest Hishest
11/1 11/2 11/4 11/7 11/8 11/9 11/10 11/11 11/14 11/15 11/16 11/17 11/18 11/21 11/22 11/24 11/25 11/28 11/29 11/30
227 0 424 0
1,946 0 995 0 832 0
2,319 0 2 , 338 0 1,739 390 2,630 130 1,526 0 1,332 0 3,132 235 2 , 750 195 3 , 309 247 1,170 0 896 10,092 393 0 529 0 65 0
168 0
13,179 2,795 13,549 5,602 29,580 5,280 12,845 2,742 9,154 3,076 6.064 2,624 3,551 4,518 6,404 6,420 7,913 12,456 5,291 6,734 2,709 3,984 3,747 6,292 6,231 10,496 12,369 10,661 7,115 7,144
14,751 4,190 10,213 5,514 6,329 2,898 5,978 4,816
20,646 0
400 650 650 900 700 600
1,600 1,800
700 1,000 2 , 100
900 800 450 500 900 500 700
1,300 1,000
5,500 5,500 5,000 5,500 5,500 4 , 800 5,000 5,500 5,600 5,500 5,800 5,000 5,900 5,200 5,300 4 , 800 5,300 5,500 5,500 5,500
A v g . 1,4 3 6 564 9,881 5,412 908 5,360
1988 Number of Travs Yen/Trav* Date Japan S . Korea U . S . A . Canada Lowest Hiahest
12/1 12/2 12/5 12/6 12/7 12/8 12/9
12/13 12/14 12/15 12/16 12/19
12/12
12/20 12/21 12/22 12/23 12/26
584 616
2 , 530 2 , 352 1,050 1,203 1,820 3,128 2 , 598 3 , 192 2 , 238 1,849 2 , 700 2,183 3,841 4,174 4 , 019 6,343
0 0
780 0
520 195 0
390 780 728 260 780 260 130 0 0
130 650
5,851 2,730 9,317 9,753
22,872 4,546 12 , 243 11,536 4,809 5,999 16,383 5,653 14,504 7,286 14,985 2,998 11,714 10,862 4,182 4,644 15,488 4,758 18,389 8,009 18 , 149 11 , 574 11,500 5,986 4,591 5,244 7,758 5,254 8,372 5,115 12,059 6,958
700 650 550 750 800 650 200 400 600 900
1,200 500 950 400 800 600
1,000 1,400
6,500 6,000 4,500 4,200 4,400 4 , 500 4 , 600 4 , 700 4 , 500 4,000 4 , 300 4 , 600 4 , 800 4 , 700 5,000 5,000 5,500 6,100
A v g . 2,579 311 11,843 6,606 725 4 , a83 * 225-260 g or 8-9 oz. Source: The Nikkan-Shokuryo Shimbun.
29

Appendix D. List of U.S.
California
C & R Pacific Enterprises P. 0. Box 1533 Sebastopol, CA 95472 Tel: (707)875-2743 FAX: (707) 875-2745
California uni 663 S . Fries Gardena, CA 90744 Tel: (213) 830-9226 FAX: (213) 830-6695
Catalina Offshore Products 4537 Mt. Henry Place San Diego, CA 92117 Tel: (619) 234-6939 FAX: (619)234-9108
Day Lee 2870 Lug0 Street Los Angeles, CA 90023 Tel: (213) 802-6822 FAX: (213) 296-0646
East Ocean Co. 1260 West 2nd Street Los Angeles, CA 90026 Tel: (213) 977-0951 FAX: (213) 977-0158
Frontier Specialty Prod. & Svcs Inc.
10064 Mesa Ridge Court, #210 San Diego, CA 92121 Tel: (619) 453-4488 FAX: (619) 453-2173
sea urchin exporters
Golden Gate Seafood 3588 Arden Road Hayward, CA 94545 Tel: (415) 732-0975 FAX: (415)732-0977
Int'l Marine Products 500 E. 7th Street Los Angeles, CA 90014 Tel: (213)680-0497 FAX: (213) 680-0317
Maruhide Marine Products 2142 West 1 7 t h Street Long Beach, CA 90813 Tel: (213)435-6509 FAX: (213) 432-4692
Mendocino Fisheries 32330 N. Harbor Drive Fort Bragg, CA 95437 Tel: (707) 961-5426 FAX: (707) 961-5428
Meredith Fish P.O. Box 954 Sacramento, CA 95804 Tel: (916)446-0251 FAX: (916) 446-1917
Natural Network Marketing 18603 N. Hwy 1, Suite 97 Fort Bragg, CA 95437 Tel: (707) 964-1261 FAX: (707)964-1281
Natural Sales Network 19290 S. Harbor Drive Fort Bragg, CA 95437 Tel: (707)964-1261 FAX: (707) 964-1281
Ocean Fresh Seafood Products, Inc.
780-A North Harbor Drive Fort Bragg, CA 95437 Tel: (707)964-2023 FAX: (707)964-8177
30

Ocean Queen 1300 East 1st Street L o s Angeles, CA 90033 Tel: (213)261-5921 FAX: (213) 261-6867
Pacific Marine Product 398 South Kalorama Street Ventura, CA 93001 Tel: (805) 648-3261 FAX: (805) 648-7148
Pemberton Fish P. 0. Box 245 El Granada, CA 94018 Tel: (415)728-7334
S / M Uni Service 728 Ceres Avenue Los Angeles, CA 90021 Tel: (213) 626-2557
San Francisco Uni Products 1709 East Colon Wilmington, CA 90744 Tel: (213)549-0274
32100 N. Harbor Drive Fort Bragg, CA 95437 Tel: (707) 961-1413
FAX: (213)549-0623
FAX: (707) 961-1442
Tidal Wave Seafood 5115 Corbina Way Oxnard, CA 93035 Tel: (805)985-0964 FAX: (805) 984-9672
Maine
BSA Group P.O. Box 181187 Cathedral Station Boston, MA 02118-1187 Tel: (617) 695-0880 FAX: (617) 695-9311
Oreaon
Bongourmet 7014 NE 79th Ct Portland, OR 97218 Tel: (503) 257-1111 FAX: (503) 257-1113
Premium Pacific Seafood P. 0. Box 2 Port Orford, OR 97465 Tel: (503) 332-5255 FAX: (503) 332-6705
Rogue Seafood P. 0. Box 154 Gold Beach, OR 97444 Tel: (503)247-4554 FAX: (503) 247-7222
Washinaton
Far East Seafood 2202 Center Street Tacoma, WA 98409 Tel: (206) 627-7003 FAX: (206) 627-7208
O.J. Fish Company 1224 46th Avenue E. Fife, WA 98424 Tel: (206)922-9171 FAX: (206) 922-9096
Orient Seafoods Production 2414 East llF1l Street Tacoma, WA 98421 Tel: (206) 272-4472 FAX: (206) 627-6703
Pacific Seafoods P. 0. Box 2150 Port Angeles, WA 98362 Tel: (206) 457-1440 FAX: (206) 452-4677

Trans-Ocean Enterprise 18942 Des Moines Way Seattle, WA 98418 P.O. Box 70628 Seattle, WA 98107 Tel: (206) 242-9469
Sources: California Department of Fish & Game. Oregon Department of Fish and Wildlife. Washington Department of Fishery. NMFS, Southwest Region Seafood Dealers Guide.
32
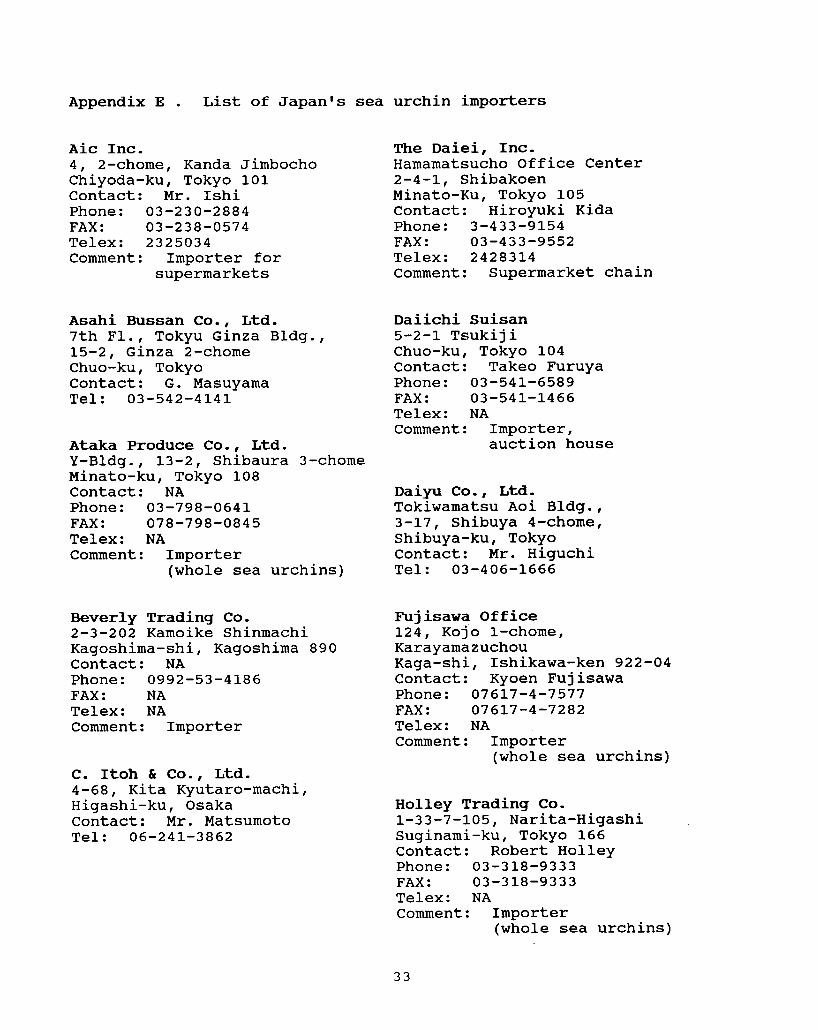
Appendix E . List of Japan's sea
Aic Inc. 4, 2-chome, Kanda Jimbocho Chiyoda-ku, Tokyo 101 Contact: Mr. Ishi Phone: 03-230-2884
Telex: 2325034 Comment : Importer for
FAX : 03-238-0574
supermarkets
Asahi Bussan Co.! Ltd. 7th Fl., Tokyu Ginza Bldg., 15-2, Ginza 2-chome
Contact: G. Masuyama Tel: 03-542-4141
Chuo-ku, Tokyo
Ataka Produce Co., Ltd. Y-Bldg., 13-2, Shibaura 3-chome Minato-ku, Tokyo 108 Contact: NA Phone: 03-798-0641
Telex: NA Comment: Importer
FAX : 078-798-0845
(whole sea urchins)
Beverly Trading Co. 2-3-202 Kamoike Shinmachi Kagoshima-shi, Kagoshima 890 Contact: NA Phone : 099 2 -53 -4 18 6 FAX : NA Telex: NA Comment: Importer
C . Itoh & Co., Ltd. 4-68, Kita Kyutaro-machi, Higashi-ku, Osaka Contact: Mr. Matsumoto Tel: 06-241-3862
urchin importers
The Daiei, Inc. Hamamatsucho Office Center 2-4-1, Shibakoen Minato-Ku, Tokyo 105 Contact: Hiroyuki Kida Phone: 3-433-9154
Telex: 2428314 Comment: Supermarket chain
FAX : 03-433-9552
Daiichi Suisan 5-2-1 Tsukij i
Contact: Takeo Furuya Phone :
Telex: NA Comment: Importer,
Chuo-ku, Tokyo 104
03 -54 1-658 9 FAX : 03-54 1-1466
auction house
Daiyu Co., Ltd. Tokiwamatsu Aoi Bldg., 3-17, Shibuya 4-chome, Shibuya-ku, Tokyo Contact: Mr. Higuchi Tel: 03-406-1666
Fu j isawa O f f ice 124, Kojo 1-chome, Karayamazuchou Kaga-shi, Ishikawa-ken 922-04 Contact: Kyoen Fujisawa Phone: 07617-4-7577
Telex: NA Comment: Importer
FAX : 07617-4-7282
(whole sea urchins)
Holley Trading Co. 1-33-7-105, Narita-Higashi Suginami-ku, Tokyo 166 Contact: Robert Holley Phone: 03-318-9333
Telex: NA Comment: Importer
FAX : 03-3 18-9333
(whole sea urchins)
33

Hosho Trading Inc. Kyodo Bldg. Ginza 3-chome 10-9, Ginza 3-chome Chuo-ku, Tokyo 104 Contact: Jerry Y. Iwasa Phone: 03-543-7201
Telex: 23803 Comment: Importer
FAX : 03-545-5833
Inoue Foods Co. 2-4-1 Fujimi Urayasu-shi, Chiba Contact: Mr. Inoue Phone: 0473-52-0035
Telex: NA Comment: Processor
FAX : 0473-51-0835
International Corporation 1-22-20 Shimanouchi, Minami-ku Osaka-shi, Osaka Contact: Ms. Komoriya Phone: 06-244-1828
Telex: NA Comment: Importer
FAX : 06-281-1150
(whole sea urchins, frozen sea urchin roe)
Iwate Trading Co., Ltd.2-10-3, Minami-Odori Morioka, Iwate 020 Contact: Masakichi Takahashi Phone: 0196-61-2003 FAX : NA Telex: 832517 Comment: Importer
Kowa Corporation Yashima Bldg. 1-1, 3-chome, Shinbashi Minato-ku, Tokyo Contact: Shojiro Ichimaru Phone: 03-501-8801 FAX : NA Telex: 22608 Comment: Importer
Kyodo Trading Col, Ltd. Shin Tanimachi #3 Bldg., 7-12-1, Tanimachi, Minami-ku, Osaka Contact: Mr. Horiya Tel: 06-768-4410
Maruto Co. Kakuman Hayashi Bldg. Nishi 19, Kita 8, Chuo-ku Sapporo, Hokkaido 060 Contact: Ken Ishii Phone : FAX : 011-644-9202 Telex: 0932388 Comment: Importer
0 11-64 4 -92 02
Matsukawa Suisan 12-46 Ohsawagashira, Shirogane-cho Hachinohe-shi, Aomori 031 Contact: Toyosaku Matsukawa Phone: 0178-34-5555
Telex: NA Comment: Importer
FAX : 0178-34-5585
(whole sea urchins)
Miyata Trading Corp. Koishikawa Bldg. 5-10, 4-chome, Tsukiji
Contact: Toru Yaegaki Phone: 03-545-8511 FAX : NA Telex: NA Comment: Importer
Chuo-ku, Tokyo
Nichia Koeki Co., Ltd. No. 6 Kakiuchi Bldg. 18-4, 1-chome Higashi-Gotanda Shinagawa-ku Tokyo Contact: T. Goto Phone: 03-447-3661
Telex: 2468386 Comment: Importer
FAX : 03-447-1886
34

Nichibo Japan Trading Co., Ltd P.O. Box 55 Ise, Mie Pref. 516 Contact: Hitoshi Sakaguchi Phone: 0596-22-3011
Telex: NA Comment: Importer, wholesaler
FAX : 0596-22-3956
Nichibu, Ltd . Iiikuradai Bldg. 1-9-12 Azabudai Minato-ku, Tokyo 106 Contact: Toshikuni Sudo Phone: 03-583-5341
Telex: NA Comment: Importer
FAX : 03-583-5359
Nichimo Co., Ltd. Nippon Bldg., 6-2, 2-chome, Ohtemachi, Chiyoda-ku, Tokyo, Contact: Commodities Supply
Tel: 03-245-4895 Dept.
Nihon Hogei Co., Ltd. Iino Bldg:, 1-1, Uchisaiwai-cho, 2-chome, Chiyoda-ku, Tokyo 100 Contact: Mr. Kikuchi Tel: 03-506-5380
Nippon Reizo Co., Ltd. 3-23, Misakicho 3-chome, Chiyoda-ku, Tokyo Contact: Mr. H. Matsubara Tel: 03-237-2222
Nisshin International Corp. 3 Fl., Nagai Bldg., 9-7, Tsukij i 3-chome, Chuo-ku, Tokyo Contact: Mr. Okamura Tel: 03-542-3628
Nozaki & Co., Ltd. Marine Prod. A Team 7-16-19 Ginza
Contact: Kazuhiro Yamaguchi Phone : 03 -54 1-92 2 1
Telex: NA Comment: Importer; whole/
Chuo-ku, Tokyo 104-91
FAX : 03-238-0574
processed sea urchins
Ogawa Shoten Co. 89-5 Irie Abuta-cho, Hokkaido 049-56 Contact: Teijiro Ogawa Phone: 01427-6-2323
Telex: NA Comment: Processor
FAX : 01427-6-4277
Seiwa Trading Co., Ltd. Tsukishima-Heights Rm. 215, 21, 4-chome, Tsukishima, Chuo-ku, Tokyo Contact: Mr. T. Tagami Tel: 03-533-5881/2
Shoei Pack Nakanishi Bldg. 11-8 Nihonbashi-Kofunecho
Contact: Hirosuke Matsui Phone: 03-664-4181
Telex: NA Comment: Importer; (processed
Chuo-ku, Tokyo
FAX : 03-664-4188
sea urchins)
Suzuki Shoten Co., Ltd.
Kobe-shi, Hyogo Pref. Contact: Mistsuo Kadota Phone: 078-321-5510
Telex: NA Comment: Importer, wholesaler
101-102, Edocho, Chuo-ku
FAX : 078-33 1-1190
35

Takasago 2-10-11 Nihonbashi Chuo-ku, Tokyo Contact: Mr. Shigemori Phone: 03-271-1466
Telex: NA Comment: Importer
FAX : 03-278-8400
Takuyo Corporation Kyoei Bldg., 1-6-1, Hatchobori, Chuo-ku, Tokyo Contact: Mr. Shimada Tel: 03-553-3261
Torin Trading Co. 21-75, Junibayashi, Kanaya Mutsu 035 Contact: Shigeru Futatsumori Phone: 0175-22-6336
Telex: NA Comment: Importer; (processed
FAX : 0175-22-6337
sea urchins)
Udo Co., Ltd Central Higashi Ginza 1207 2-15-15 Tsukij i
Contact: Atsushi Udo Phone: 03-545-3851
Telex: NA Comment: Importer; processed
Chuo-ku, Tokyo 104
FAX : 03-546-0188
sea urchins
Uriku Suisan LTD. Matsubara 2-223 Ishinomaki, Miyagi
Sources: U.S. Embassy, Tokyo, Japan. Embassy of Chile, Tokyo, Japan. Instituto Nacional de Pesca, Mexico
36