fiscal year ended march 31, 2015 brief report of ... · osaka gas co., ltd. (9532) brief report of...
TRANSCRIPT

Osaka Gas Co., Ltd. (9532) Brief Report of Consolidated Financial Statements for the Fiscal Year Ended March 31, 2015
Fiscal Year Ended March 31, 2015
Brief Report of Consolidated Financial Statements (Japanese GAAP) April 27, 2015
Name of Listed Company : Osaka Gas Co., Ltd. Listed Exchanges: 1st Section of Tokyo and Nagoya Code : 9532 URL: http://www.osakagas.co.jp Representative Officer : Title: President Name: Takehiro Honjo Contact : Title: Manager, Finance Dept. Name: Kazushige Nomura Scheduled Date of Annual General Meeting of Shareholders : June 26, 2015 Scheduled Date of Financial Report Filing with the Finance Ministry : June 29, 2015 Preparation of Supplementary Explanation Documents for Operating Results : Yes Holding of an Informational Meeting for Operating Results : Yes (for institutional investors and analysts)
(Any amount less than one million yen is rounded down to the nearest million yen.)
1. Consolidated Financial Results for the Fiscal Year Ended March 31, 2015(April 1, 2014 – March 31, 2015) (1) Consolidated Operating Results (Percentages (%) represent changes from the previous year.)
Net sales Operating income Ordinary income Net income million yen % million yen % million yen % million yen % Year ended March 31, 2015 Year ended March 31, 2014
1,528,164 1,512,581
1.0 9.6
105,065 99,381
5.7 17.2
108,173 106,044
2.0 17.7
76,709 41,725
83.8 -20.5
(Note) Comprehensive income Year ended March 31, 2015 106,084 million yen (31.2% YoY) Year ended March 31, 2014 80,850 million yen (-3.6% YoY)
Earnings
per share Diluted earnings
per share Net income /Net worth
Ordinary income /Total assets
Operating income /Net sales
yen yen %
%
%
Year ended March 31, 2015 Year ended March 31, 2014
36.86 20.04
- -
9.1 5.4
6.1 6.6
6.9 6.6
<Reference> Equity in earnings of affiliates Year ended March 31, 2015 6,990 million yen Year ended March 31, 2014 7,917 million yen
(2) Consolidated Financial Position Total assets Net assets Net worth/Total assets Net assets per share
million yen million yen %
yen As of March 31, 2015 As of March 31, 2014
1,862,201 1,668,317
918,869 828,565
47.7 47.9
426.98 383.90
<Reference> Net worth As of March 31, 2015 888,496 million yen As of March 31, 2014 798,964 million yen (3) Consolidated Cash Flows
Cash flows from operating activities
Cash flows from investing activities
Cash flows from financing activities
Cash and cash equivalents at end of year
million yen million yen million yen million yen As of March 31, 2015 As of March 31, 2014
156,908 154,225
-110,704 -175,591
22,892 4,163
162,793 90,359
2. Dividends
Dividends per share Total
dividends (full year)
Payout ratio (consolidated)
Dividends /Net assets
(consolidated) (Record date)
End of First
Quarter
End of Second Quarter
End of Third
Quarter
End of Fiscal Year
Annual
yen yen yen yen yen million yen % % Year ended March 31, 2014 Year ended March 31, 2015
– –
4.50 4.50
– –
4.50 5.00
9.00 9.50
18,734 19,768
44.9 25.8
2.4 2.3
Year ending March 31, 2016 (Forecast) – 5.00 – 5.00 10.00 28.3
(Note) Dividend for Year ended March 31, 2015 Ordinary dividend 4.50 yen, Commemorative dividend 0.5yen Dividend for mid-term and Year ended March 31, 2016 Ordinary dividend 4.50 yen, Commemorative dividend 0.5 yen

Osaka Gas Co., Ltd. (9532) Brief Report of Consolidated Financial Statements for the Fiscal Year Ended March 31, 2015
3. Forecasts of Consolidated Operating Results for the Fiscal Year Ending March 31, 2016 (April 1, 2015 – March 31, 2016) (Percentages (%) represent forecasted changes from the previous year for the full year results, and forecasted changes from the same period in the previous year for the interim results.)
Net sales Operating income Ordinary income Net income Earnings per share
million yen % million yen % million yen % million yen % yen Interim 640,000 -8.3 83,500 55.1 85,000 46.9 59,000 24.2 28.35
Full year 1,368,500 -10.4 113,500 8.0 110,000 1.7 73,500 -4.2 35.32 ※. Notes (1) Changes in significant subsidiaries during the year (changes in certain subsidiaries resulting in a change in the consolidation scope):
None (2) Changes in accounting policies and estimation methods, corrections and restatements (i) Changes in accounting policies in response to revisions in accounting standards, etc.: Adopted (ii) Changes in accounting policies other than (i) above: None (iii) Changes in accounting estimates: None (iv) Corrections and restatements: None *Note: For detailed information, please refer to “4 (5) Notes on the Consolidated Financial Statements” on Page 18 of the
Attachment to this Brief Report of Consolidated Financial Statements. (3) Issued shares (common shares)
(i) Number of shares issued and outstanding at the end of each fiscal year (including treasury stock) : As of March 31, 2015 2,083,400,000 shares As of March 31, 2014 2,083,400,000 shares
(ii) Number of treasury stock at the end of each fiscal year : As of March 31, 2015 2,532,646 shares As of March 31, 2014 2,214,444 shares
(iii) Average number of shares issued and outstanding in each fiscal year : Year ended March 31, 2015 2,081,017,962 shares Year ended March 31, 2014 2,081,828,942 shares
(Reference) Summary of non-consolidated financial results 1. Non-Consolidated Financial Results for the Fiscal Year Ended March 31, 2015 (April 1, 2014 – March 31, 2015) (1) Non-Consolidated Operating Results (Percentages (%) represent changes from the previous year.)
Net sales Operating income Ordinary income Net income million yen % million yen % million yen % million yen %
Year ended March 31, 2015 Year ended March 31, 2014
1,251,835 1,221,846
2.5 10.2
80,190 60,740
32.0 32.0
88,255 69,196
27.5 25.0
70,285 24,942
181.8 -29.0
Earnings per share
Diluted earnings per share
yen yen Year ended March 31, 2015 Year ended March 31, 2014
33.77 11.98
- -
(2) Non-Consolidated Financial Position Total assets Net assets Net worth/Total assets Net assets per share
million yen million yen %
yen As of March 31, 2015 As of March 31, 2014
1,411,266 1,283,194
637,389 580,029
45.2 45.2
306.31 278.70
<Reference> Net worth As of March 31, 2015 637,389million yen As of March 31, 2014 580,029 million yen 2. Forecasts of Non-Consolidated Results for the Fiscal Year Ending March 31, 2016 (April 1, 2015 – March 31, 2016)
(Percentages (%) represent forecasted changes from the previous year for the full year results, and forecasted changes from the same period in the previous year for the interim results.)
Net sales Operating income Ordinary income Net income Earnings per share
million yen % million yen % million yen % million yen % yen Interim 514,500 -10.1 69,500 69.3 80,000 72.9 60,000 41.4 28.83
Full year 1,064,500 -15.0 74,000 -7.7 84,000 -4.8 63,000 -10.4 30.27

Osaka Gas Co., Ltd. (9532) Brief Report of Consolidated Financial Statements for the Fiscal Year Ended March 31, 2015
* Statement regarding implementation of audit procedures At the time of disclosure of this Brief Report of Consolidated Financial Statements, the audit procedures of financial statements in accordance with the Financial Instruments and Exchange Act of Japan have not been completed. * Notes on proper use of forecasts and other matters Forward-looking statements in this document, including forecasts of operating results, are based on information currently available to Osaka Gas (the Company) and certain assumptions that the Company believes are reasonable. Actual results may significantly differ from these forecasts, affected by various factors. As for notes regarding assumptions used for operating forecasts and regarding the use of forecasts, please refer to “1. (1) Operating Results Analysis (iii) Forecasts for the Next Year (April 1, 2015 – March 31, 2016)” on Page 3 of the Attachment to this Brief Report of Consolidated Financial Statements. The Company has held a closing informational meeting for institutional investors and analysts on April 28, 2015. A video of the presentation and the presentation materials used on that day has been made available on the Company’s web site.

Osaka Gas Co., Ltd. (9532) Brief Report of Consolidated Financial Statements for the Fiscal Year Ended March 31, 2015
- 1 -
Table of Contents for Attachment
1. Analysis for Operating Results and Financial position 2 (1) Operating Results Analysis 2 (2) Financial Position Analysis 4 (3) Basic Policy for Profit Distribution and Dividends for the Current Year and the Next Year 6 (4) Business and Other Risks 7 2. Management Policy 8 (1) Basic Management Policy and Medium/Long Term Business Strategy 8 (2) Targeted Management Indices 8 (3) Challenges for the Company 9 3. Policy for Selecting an Accounting Standard 10 4. Consolidated Financial Statements 11 (1) Consolidated Balance Sheet 11 (2) Consolidated Statements of Income and Comprehensive Income 13 (3) Consolidated Statement of Changes in Net Assets 15 (4) Consolidated Statement of Cash Flows 17 (5) Notes on the Consolidated Financial Statements 18
(Notes Regarding Uncertainties of Entity's Ability to Continue as Going Concern) 18 (Notes Regarding Changes in Accounting Policies in Accordance with Changes in Accounting Standards, Accounting Estimates and Restatement) 18 (Segment Information) 18 (Per Share Information) 20 (Notes Regarding Significant Events after Reporting Period) 20
5. Non-Consolidated Financial Statements 21 (1) Balance Sheet 21 (2) Statement of Income 24 (3) Statement of Changes in Net Assets 26

Osaka Gas Co., Ltd. (9532) Brief Report of Consolidated Financial Statements for the Fiscal Year Ended March 31, 2015
- 2 -
1. Analysis for Operating Results and Financial position (1) Operating Results Analysis
(i) Results for the Fiscal Year Ended March 31, 2015
Consolidated net sales for the fiscal year ended March 31, 2015 increased by ¥15.5 billion (+1.0%) year-on-year to ¥1,528.1 billion. This was primarily due to the continuing high unit selling price on a non-consolidated basis for city gas under the fuel cost adjustment system. Consolidated ordinary income increased by ¥2.1 billion (+2.0%) year-on-year to ¥108.1 billion, primarily due to an increase in profits of the gas business on a non-consolidated basis. Consolidated net income increased by ¥34.9 billion (+83.8%) year-on-year to ¥76.7 billion, primarily due to Gain on sales of investment securities and impairment loss on the U.S. upstream business last FY . The number of consolidated subsidiary companies is currently 145, with 7 subsidiary companies removed and 2 added since the end of the previous year. The number of equity method affiliates is currently 13 with 2 added and 1 removed since the end of the previous year.
(Billion yen)
Consolidated results (a)
Changes from the previous year Non-consolidated
results (b)
Ratio of consolidated results to non-consolidated
results (a)/(b) increase /decrease
increase /decrease rate (%)
Net sales 1,528.1 +15.5 +1.0 1,251.8 1.22 Cost of sales 1,071.0 -0.3 -0.0 886.8 1.21 Selling, general and administrative expenses 352.0 +10.2 +3.0 284.7 1.24
Operating income 105.0 +5.6 +5.7 80.1 1.31 Ordinary income 108.1 +2.1 +2.0 88.2 1.23 Net income 76.7 +34.9 +83.8 70.2 1.09
(Reference) Non-Consolidated Gas Sales Breakdown Current year (a)
(Apr ’14 -Mar ’15) Previous year (b) (Apr ’13 -Mar ’14)
increase /decrease
(a)-(b)
increase /decrease rate (%)
Customers [Meters installed]
(thousand)
Residential 6,849 6,794 +56 +0.8 Non-residential 346 342 +4 +1.2 Total 7,196 7,136 +60 +0.8
Monthly average usage per residential customer (m3/month) 30.9 31.3 -0.3 -1.1
Gas sales volume (million m3)
Residential 2,186 2,198 -12 -0.5 Non-residential 5,599 5,856 -258 -4.4 Industrial 4,133 4,329 -195 -4.5 Commercial 857 890 -33 -3.7
Public and medical institutions
608 638 -30 -4.7
Wholesale 474 469 +4 +1.0 Total 8,259 8,524 - 265 -3.1
[45MJ/m3]

Osaka Gas Co., Ltd. (9532) Brief Report of Consolidated Financial Statements for the Fiscal Year Ended March 31, 2015
- 3 -
(ii) Operating Results by Business Segment a. Gas
Net sales increased by ¥17.4billion (+1.6%) year-on-year to ¥1,136.9 billion, mainly due to continuing high gas unit selling prices under the fuel cost adjustment system. Segment income increased by ¥18.2 billion (+56.8%) year-on-year to ¥50.2 billion.
b. LPG, Electricity and Other Energy
Net sales decreased by ¥17.3 billion (-6.6%) year-on-year to ¥243.7 billion, mainly due to lower sales from the LPG business. Segment income decreased by ¥3.6 billion (-8.0%) year-on-year to ¥41.6 billion.
c. International Energy
Net sales increased by ¥0.3 billion (+2.6%) year-on-year to ¥13.7 billion. Segment income decreased by ¥6.9 billion (-84.7%) year-on-year to ¥1.2 billion, due to a temporary decline in income associated with streamlining of the gasification business of Freeport LNG Development, L.P., in which our subsidiary has invested, to prepare for the liquefaction project.
d. Life & Business Solutions
Net sales increased by ¥10.9 billion (+5.6%) year-on-year to ¥207.5 billion due to the new consolidation of a manufacturing/sales company of activated carbon. Segment income decreased by ¥2.3 billion (-12.3%) year-on-year to ¥16.5 billion due to the amortization of goodwill of said company.
(Billion yen)
Gas
LPG, Electricity and Other
Energy
International Energy
Life & Business Solutions
Adjustments Consolidation
Net sales +1.6%
1,136.9 [+17.4]
-6.6% 243.7
[-17.3]
+2.6% 13.7
[+0.3]
+5.6% 207.5
[+10.9]
-73.7
+1.0% 1,528.1
[+15.5]
Segment income
+56.8% 50.2
[+18.2]
-8.0% 41.6
[-3.6]
-84.7% 1.2
[-6.9]
-12.3% 16.5
[-2.3]
2.2
+4.4% 112.0
[+4.7] The percentage figures at the upper left corner of each box show the percentage of changes from the previous year. Figures in [ ] brackets in each box show the changes from the previous year.
(iii) Forecasts for the Next Year (April 1, 2015–March 31, 2016)
Consolidated net sales for the fiscal year ending March 31, 2016 are expected to decrease by ¥159.6 billion (-10.4%) year-on-year to ¥1,368.5 billion. This is primarily due to the assumption that LNG prices would be lower than those for the current fiscal year, attributable to declines in the unit selling prices of city gas under the fuel cost adjustment system and in the selling prices of LNG and electricity). Ordinary income is expected to increase by ¥1.80 billion (+1.7%) year-on-year to ¥110.0 billion, primarily because the profits of the affiliated companies are forecast to increase, and the magnitude of the decrease in raw material costs associated with the assumed decrease in LNG prices is expected to be large relative to the assumed increase in net sales in the gas business, despite profits decreasing in the electricity business. Net income is expected to decrease by ¥3.2 billion (-4.2%) year-on-year to ¥73.5 billion.

Osaka Gas Co., Ltd. (9532) Brief Report of Consolidated Financial Statements for the Fiscal Year Ended March 31, 2015
- 4 -
(Billion yen)
Forecast for Next Year (April 2015 –March 2016)
Compared with Current Year
increase /decrease
increase /decrease rate (%)
Net sales 1,368.5 -159.6 -10.4
Operating income 113.5 +8.4 +8.0
Ordinary income 110.0 +1.8 +1.7
Net income 73.5 -3.2 -4.2
Assumptions: Crude oil price and Exchange rate (April 1, 2015 to March 31, 2016)
1Q 2Q 3Q 4Q Annual average Crude oil price(All Japan CIF price) USD/barrel 55 65 70 70 65 Exchange Rate(TTM) JPY/USD 120 120
(2) Financial Position Analysis
(i) Assets, Liabilities, and Net Assets
Total assets increased by ¥193.8 billion year-on-year to ¥1,862.2 billion, primarily due to an increase in noncurrent assets. Liabilities increased by ¥103.5 billion year-on-year to ¥943.3 billion, while net assets increased by ¥90.3 billion year-on-year to ¥918.8 billion. As a result, the ratio of net worth to total assets decreased to 47.7% from 47.9% at the end of the previous year.
(Billion yen)
As of March 31, 2015 As of March 31, 2014 increase /decrease
Total assets 1,862.2 1,668.3 +193.8
Total liabilities 943.3 839.7 +103.5
Total net assets 918.8 828.5 +90.3
Total liabilities and net assets 1,862.2 1,668.3 +193.8
(ii) Cash Flows In the current fiscal year, net cash provided by operating activities amounted to ¥156.9 billion, due to the addition of depreciation and amortization to income before income taxes and minority interests and the addition/subtraction of income taxes and other payments. Net cash used in investing activities amounted to ¥110.7 billion, mainly due to the purchase of property, plant and equipment. Net cash used in financing activities amounted to ¥22.8 billion, including the repayment of long-term loans payable. Consequently, the net increase in cash and cash equivalents at the end of the fiscal year ended March 31, 2015 amounted to ¥72.4 billion. With the addition to the balance of ¥90.3 billion at the beginning of the fiscal year under review, the balance of cash and cash equivalents at the end of the fiscal year ended March 31, 2015 amounted to ¥162.7 billion.

Osaka Gas Co., Ltd. (9532) Brief Report of Consolidated Financial Statements for the Fiscal Year Ended March 31, 2015
- 5 -
(Billion yen)
Current Year (Apr’14 -Mar ’15)
Previous Year (Apr ’13 -Mar ’14)
increase /decrease
Cash flows from operating activities 156.9 154.2 +2.6
Cash flows from investing activities -110.7 -175.5 +64.8
Cash flows from financing activities 22.8 4.1 +18.7
Increase/decrease in cash and cash equivalents 72.4 -19.0 +91.5
Cash and cash equivalents at end of year 162.7 90.3 +72.4 Balance of interest-bearing liabilities at end of year 633.9 573.5 +60.3
Free cash flow*: ¥112.2 billion [¥113.1 billion in the previous year]
*Cash flow from operating activities – capital expenditures
(Reference) Cash Flow Indices
Current Year (Apr ’14 -Mar ’15)
Previous Year (Apr ’13 -Mar ’14)
Net worth/Total assets 47.7% 47.9%
Total market capitalization /Total assets 56.2% 48.8%
Interest-bearing debts/Cash flows 4.0 3.7
Interest coverage ratio 16.56 18.00
(Notes) 1. All of the above indices are based on consolidated financial results. 2. Total market capitalization was calculated based on issued shares of the Company, excluding treasury
stock. 3. Cash flow used for the calculation of these indices is net cash provided by operating activities. 4. Interest-bearing debts include all liabilities reported on the consolidated balance sheet for which interest is
paid.

Osaka Gas Co., Ltd. (9532) Brief Report of Consolidated Financial Statements for the Fiscal Year Ended March 31, 2015
- 6 -
The following table shows forecasts for capital expenditures.
(Reference) Capital Expenditures: Results and Forecasts (Billion yen)
Forecast for Next Year (Apr ’15 -Mar ’16)
Current Year (Apr ’14 -Mar ’15)
Previous Year (Apr ’13 -Mar ’14)
Consolidated 125.3 119.3 124.1
Non-consolidated 56.6 46.5 58.6
Production facilities 15.0 6.1 5.8
Distribution facilities 35.0 33.2 47.3 Service and maintenance facilities, etc.
6.5 7.1 5.4
Major financial indicators for the next year are forecasted as follows:
Forecast for Next Year (Apr ’15-Mar ’16)
Current Year (Apr ’14-Mar ’15)
Previous Year (Apr ’13 -Mar ’14)
Con
solid
ated
Shareholders’ value added (SVA) 40.9 Billion yen 42.9 Billion yen 3.0 Billion yen
Earnings per share (EPS) 35.32 yen 36.86 yen 20.04 yen
Return on equity (ROE) 8.3 % 9.1 % 5.4 %
Return on assets (ROA) 4.0 % 4.3 % 2.6 %
Free cash flow (FCF) 129.5 Billion yen 112.2 Billion yen 113.1 Billion yen
Non
-con
solid
ated
Shareholders’ value added (SVA) 38.9 Billion yen 46.3 Billion yen 4.8 Billion yen
Earnings per share (EPS) 30.27 yen 33.77 yen 11.98 yen
Return on equity (ROE) 9.7 % 11.5 % 4.3 %
Return on assets (ROA) 4.4 % 5.2 % 2.0 %
Free cash flow (FCF) 80.2 Billion yen 65.7 Billion yen 52.0 Billion yen
(3) Basic Policy for Profit Distribution and Dividends for the Current Year and the Next Year Striving to enhance business growth and improve the efficiency of its operations, the Company has appropriated the increased profit resulting from such efforts for internal reserves to be used toward future business growth and strengthening of the financial structure of the Company, in addition to the payment of steady dividends to shareholders. The Company will endeavor to continue steadily paying such dividends to shareholders both at the interim and year-end periods based on operational results, future business management, and other plans, while also taking into account alternative profit distribution plans and other comprehensive factors. The Company will aim to maintain its consolidated payout ratio above 30%, within the non-consolidated retained earnings distributable to Osaka Gas shareholders, excluding temporary factors that may affect the profit situation. Internal reserves will be appropriated for capital investments and investments in new business. The company will be celebrating 110 years since its establishment on October 19, 2015 and as announced on March 11, 2015, there will be a commemorative dividend of 0.5 yen per share as the year-end dividend for the year ending March 2015, and as the interim and year-end dividends for the year ending March 2016. As a result, the Company will pay annual dividends of 9.5 yen (9 yen as an ordinary dividend and 0.5 yen as a commemorative dividend) per share, including an interim dividend of 4.5 yen per share, for the current fiscal year and 10 yen per share (9 yen as an ordinary dividend and 1 yen as a commemorative dividend), including an interim dividend of 5.0 yen per share, for the next fiscal year.

Osaka Gas Co., Ltd. (9532) Brief Report of Consolidated Financial Statements for the Fiscal Year Ended March 31, 2015
- 7 -
(4) Business and Other Risks The business performance and financial conditions of the Osaka Gas Group may be affected by various risks including, but not limited to, the following:
(i) Risks related to all businesses within the Osaka Gas Group a. Worsening of economic and credit conditions, etc., and contraction of the market
Worsening of economic and/or credit conditions, etc. in Japan and/or other countries that may lead to a decrease in sales revenues, difficulties in fund-raising, insolvency of joint project partner companies, suppliers, or customers, a decrease in the population, offshore transfer of factories and plants, or other unfavorable effects
b. Changes in foreign exchange rates and financing interest rates c. Catastrophic disasters/accidents/epidemics
Occurrence of catastrophic natural disasters, acts of terrorism or accidents, or epidemics of new types of influenza or other infectious diseases
d. Changes in policies, laws, regulations, and institutional systems Changes in the Gas Business Act, the Electricity Business Act, the Companies Act, the Financial Instruments and Exchange Act, environment-related laws, or other applicable policies, acts and institutional systems both in and outside of Japan
e. Intensifying competition Intensified competition with other operators in the gas business and other business areas related to the Group
f. Breakdown or malfunction of mission-critical IT systems Breakdown or malfunction of mission-critical IT systems, such as systems related to gas production/supply or billing
g. Information leaks Outside leakage of important information used in the course of business, including customer information or technical information possessed by the Group
h. Non-compliance with laws/regulations, trouble related to the quality of products and services Expenditures related to remedying noncompliance or addressing troubles from the quality of products and services of the Osaka Gas Group, and degradation of social reputation caused by any act that is in violation of any law or regulation
(ii) Risks related to major businesses within the Osaka Gas Group 1) Domestic energy businesses
a. Impact of fluctuations in atmospheric/water temperature on gas demand b. Changes in raw material costs
Fluctuations in raw material and fuel costs due to changes in crude oil prices or exchange rates, or as a result of renewal of contracts or price negotiations with suppliers, and other relevant factors*
*Although most effects may be offset through the fuel cost adjustment system, under which gas rates are revised to reflect changes in fuel costs, a time lag until the actual adjustment is made and the composition of material suppliers could affect the performance of the Osaka Gas Group.
c. Trouble in purchasing raw material and fuel Problems at facilities of LNG (from which gas or electricity are produced) suppliers or their operations, or other incidents
d. Difficulties in gas production and supply Catastrophic natural disasters or accidents that could disrupt production or supply of gas
e. Difficulties in power generation and electricity supply Catastrophic natural disasters, accidents, or trouble in purchasing fuel or other incidents that could disrupt operations at electric power plants and the supply of electricity
f. Problems with gas equipment and facilities

Osaka Gas Co., Ltd. (9532) Brief Report of Consolidated Financial Statements for the Fiscal Year Ended March 31, 2015
- 8 -
Serious trouble with gas equipment or facilities sold to customers
2) International energy businesses Changes in the operating environments due to a delay or cancellation of projects, or some other significant impact resulting from enforcement or revision of government policy or regulations, economic stagnation, worsening social conditions, or other factors occurring in any country in which the Osaka Gas Group operates, or technological causes in the resource development business
The Osaka Gas Group strives to minimize the potential impact of these risks on its performance through various measures, including derivative contracts to hedge against fluctuations in exchange rates and raw material costs, accident and other insurance contracts, enhanced security of critical IT systems, adherence to compliance and strict information control, monitoring and proper supervision of subsidiaries' business management, measures for safety and disaster prevention, and design and continuous review of business continuity plans.
2. Management Policy (1) Basic Management Policy and Medium/Long Term Business Strategy
The Company group aims to provide its customers and society with value by offering energy and related services, mainly natural gas which is regarded as one of important energy sources in the government's energy policy, electricity and LPG and various goods and services other than energy, such as materials and information. Also, the Company recognizes it is most important to flexibly respond to changes in business environments, such as business cycles and the government's policy including electricity and gas industry reforms within and outside Japan, and improve management efficiency in order to realize sustainable growth of the Osaka Gas Group. The “Osaka Gas Group Corporate Philosophy” was established in March 2015 based on its conventional management principles. Aiming to become a company group that supports further improvement of life and business, the Osaka Gas Group will conduct its business activities placing top priority on creating “customer value,” to create “social value,” “stock holder value,” and “employee value.”
(2) Targeted Management Indices
From the perspective of assuring profitability and business growth, the Company sets targets for shareholders’ value added (SVA), profit figures, return on equity (ROE), return on assets (ROA) and continuous payment of stable dividends. At the same time, to maintain its financial strength rating and other indications of financial soundness, the Company will endeavor to attain the following financial soundness indicators: (1) a ratio of consolidated net worth to total assets in excess of 50%, and (2) a ratio of consolidated D/E (interest-bearing debts to net worth) of about 0.7, while maintaining the existing balance with SVA, free cash flow, balance of interest-bearing debts, and other indicators. Opportunities to repurchase the Company's shares will always be examined to improve earnings per share (EPS), and ROE. However, repurchase will be strategically implemented only on the conditions that growth investments have been implemented and that excess cash flow is available.

Osaka Gas Co., Ltd. (9532) Brief Report of Consolidated Financial Statements for the Fiscal Year Ended March 31, 2015
- 9 -
(3) Challenges for the Company In order to achieve the medium-term management plan “Catalyze Our Dreams” under the long-term management vision "Field of Dreams 2020," we will tackle the following issues:
(i) Energy businesses Considering the Reform of the Electricity and Gas Systems as an opportunity for growth, we serve as a comprehensive energy business provider that combines the supply of gas, electricity and other energy with gas appliances and related services to satisfy customers’ needs. 1) Stable and economically beneficial materials procurement and promotion of upstream businesses
(development and production) and liquefaction business. The Company will diversify its supply sources. By sourcing materials from multiple producers around the world, we will secure a stable supply of natural gas and other raw materials. The Company also aims to procure raw materials at competitive prices by diversifying its benchmarks of contract prices. In addition, the Company will steadily promote upstream businesses, such as the liquefaction business in which it currently engages, the promotion of gas field development projects, and the acquisition of new interests including unconventional gas development projects, to stably procure natural gas and obtain new revenue sources.
2) Expanding the electricity business The Company will try to expand its power source size nationwide, including coal thermal power generation, renewable energy power generation, and power source cogeneration in addition to LNG thermal power generation, to develop electricity business.
3) Securing stable supply and safety The Company will maintain, strengthen and improve gas manufacturing and supplying facilities, as well as electricity generating facilities, as well as continuously implementing anti-earthquake and tsunami measures. We will also continue the system for responding to emergencies, such as possible gas leakage, and help securing safety at customers' sites.
4) Expanding the energy business at home and overseas The Company will try to expand the use of natural gas by encouraging the widespread use of gas cogeneration systems including fuel cells and gas air conditioning systems, which in turn will support customers’ convenient lives, energy saving, and the continuation of business during a disaster. The Company will expand the energy business at home and abroad using its business know-how. In Japan, we will strengthen cooperation with regional energy business operators and use our own high-pressure gas pipelines to accelerate gas (natural gas and LPG) dissemination promotion activities. Overseas, we will also steadily operate businesses, such as the gas, electricity, and energy service businesses, and develop new projects.
5) Preparation for the reform of electricity and gas system
The Company will be preparing for increasing competition due to electricity and gas deregulation for resale by reviewing its organization structures and reconstructing its work processes and IT systems while working to further improve the neutrality of the gas supply line business.
(ii) Life & Business Solutions Business The Company will contribute to customers’ convenient lives and business development by offering technology and know-how based on its experience in the energy business field. In the material, information, and urban development businesses, the Company will help its customers at home and abroad to live comfortable, convenient, and healthful lives by offering goods and services that make full use of the advantages nurtured through the business.

Osaka Gas Co., Ltd. (9532) Brief Report of Consolidated Financial Statements for the Fiscal Year Ended March 31, 2015
- 10 -
(iii) Business foundation 1) Improvement of Technology
The Company will enhance its technological prowess in such areas as: the development of more efficient, low-cost gas appliances and facilities, including fuel cells; the development of technologies related to hydrogen production, materials, and information; and the use of engineering technologies in various fields, including resource development and electricity generation, etc.
2) CSR
In accordance with the Osaka Gas Group CSR Charter, the Company will strive to earn further trust of customers and society by upgrading the Group's CSR. At the same time, the Company will endeavor to ensure that those concerned with the Osaka Gas Group’s supply chain at home and abroad gain a clear understanding of our efforts in this regard.
3) Development of Human Resources and Organizational Structure
The Company will develop human resources for its continuous growth. The Company will also increase diversity to create new value, aiming to become a flexible and strong organization. The Osaka Gas Group will perform internal control with high effectiveness by continuously monitoring and evaluating the operation of the Group's internal control system and taking necessary measures. Under such mechanism, the Group is committed to addressing the above challenges, pursuing its management principle of Value Creation Management, and continuing to make constant efforts toward achieving sustainable growth.
3. Policy for Selecting an Accounting Standard The Company will continuously adopt the Japanese GAAP as an accounting standard. The introduction of the IFRS will be considered in view of the business environment and the impact of the introduction.
Osaka Gas Co., Ltd. (9532) Brief Report of Consolidated Financial Statements for the Fiscal Year Ended March 31, 2015
- 11 -
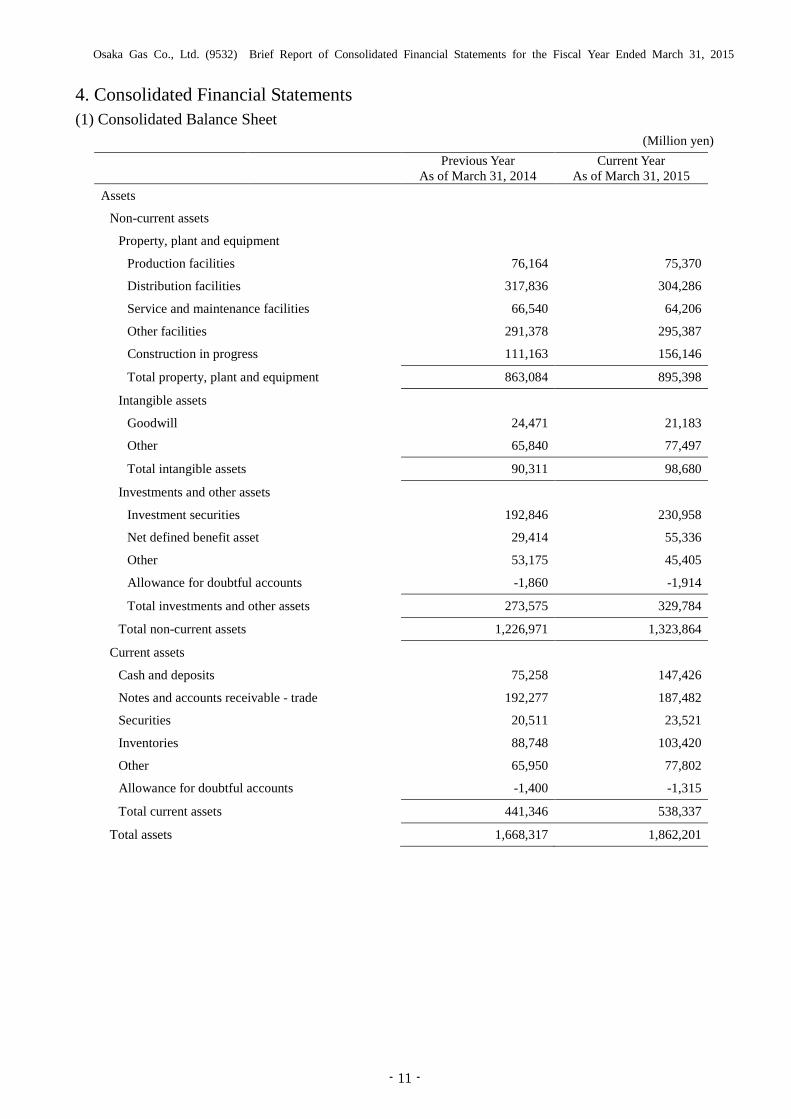
4. Consolidated Financial Statements (1) Consolidated Balance Sheet
(Million yen)
Previous Year
As of March 31, 2014 Current Year
As of March 31, 2015 Assets Non-current assets Property, plant and equipment Production facilities 76,164 75,370
Distribution facilities 317,836 304,286
Service and maintenance facilities 66,540 64,206
Other facilities 291,378 295,387
Construction in progress 111,163 156,146
Total property, plant and equipment 863,084 895,398
Intangible assets
Goodwill 24,471 21,183
Other 65,840 77,497
Total intangible assets 90,311 98,680
Investments and other assets
Investment securities 192,846 230,958
Net defined benefit asset 29,414 55,336
Other 53,175 45,405
Allowance for doubtful accounts -1,860 -1,914
Total investments and other assets 273,575 329,784
Total non-current assets 1,226,971 1,323,864
Current assets
Cash and deposits 75,258 147,426
Notes and accounts receivable - trade 192,277 187,482
Securities 20,511 23,521
Inventories 88,748 103,420
Other 65,950 77,802
Allowance for doubtful accounts -1,400 -1,315
Total current assets 441,346 538,337
Total assets 1,668,317 1,862,201

Osaka Gas Co., Ltd. (9532) Brief Report of Consolidated Financial Statements for the Fiscal Year Ended March 31, 2015
- 12 -
(Million yen)
Previous Year
As of March 31, 2014 Current Year
As of March 31, 2015 Liabilities Non-current liabilities Bonds payable 242,124 240,666
Long-term loans payable 244,503 309,848
Deferred tax liabilities 22,031 36,981
Provision for gas holder repairs 1,636 1,722
Provision for safety measures 10,831 8,451
Provision for loss on investment 6,999 6,999
Provision for loss on guarantees - 1,589
Provision for equipment warranties - 2,895
Net defined benefit liability 15,325 16,484
Other 17,946 33,154
Total non-current liabilities 561,400 658,794
Current liabilities
Current portion of non-current liabilities 39,333 55,731
Notes and accounts payable - trade 60,358 54,610
Short-term loans payable 46,756 26,832
Income taxes payable 29,608 30,835
Other 102,294 116,527
Total current liabilities 278,351 284,537
Total liabilities 839,752 943,331
Net assets
Shareholders' equity
Capital stock 132,166 132,166
Capital surplus 19,486 19,488
Retained earnings 587,268 648,896
Treasury shares -797 -938
Total shareholders' equity 738,124 799,613
Accumulated other comprehensive income
Valuation difference on available-for-sale securities 34,839 50,868
Deferred gains or losses on hedges 2,425 -6,519
Revaluation reserve for land -737 -737
Foreign currency translation adjustment 30,414 39,341
Remeasurements of defined benefit plans -6,100 5,929
Total accumulated other comprehensive income 60,840 88,882
Minority interests 29,601 30,373
Total net assets 828,565 918,869
Total liabilities and net assets 1,668,317 1,862,201

Osaka Gas Co., Ltd. (9532) Brief Report of Consolidated Financial Statements for the Fiscal Year Ended March 31, 2015
- 13 -
(2) Consolidated Statements of Income and Comprehensive Income Consolidated Statement of Income (Million yen)
Previous Year (April 1, 2013 –
March 31, 2014)
Current Year (April 1, 2014 –
March 31, 2015) Net sales 1,512,581 1,528,164
Cost of sales 1,071,374 1,071,021
Gross profit 441,207 457,143
Selling, general and administrative expenses 341,825 352,077
Operating income 99,381 105,065
Non-operating income
Interest income 638 770
Dividend income 3,172 4,659 Share of profit of entities accounted for using equity method 7,917 6,990
Foreign exchange gain 663 4,644
Miscellaneous income 5,158 5,757
Total non-operating income 17,550 22,822
Non-operating expenses
Interest expenses 8,567 9,475
Miscellaneous expenses 2,321 10,238
Total non-operating expenses 10,888 19,714
Ordinary income 106,044 108,173
Extraordinary income
Gain on sales of non-current asset - 2,941
Gain on sales of investment securities 5,968 13,011
Total extraordinary income 5,968 15,952
Extraordinary losses
Impairment loss 30,138 2,697
Total extraordinary losses 30,138 2,697
Income before income taxes and minority interests 81,874 121,428
Income taxes - current 32,149 38,064
Income taxes - deferred 4,717 4,744
Total income taxes 36,867 42,808
Income before minority interests 45,007 78,619
Minority interests in income 3,281 1,910
Net income 41,725 76,709

Osaka Gas Co., Ltd. (9532) Brief Report of Consolidated Financial Statements for the Fiscal Year Ended March 31, 2015
- 14 -
Consolidated Statement of Comprehensive Income (Million yen)
Previous Year (April 1, 2013 –
March 31, 2014)
Current Year (April 1, 214 –
March 31, 2015) Income before minority interests 45,007 78,619
Other comprehensive income
Valuation difference on available-for-sale securities 3,314 16,045
Deferred gains or losses on hedges 1,356 -3,232
Foreign currency translation adjustment 25,018 10,241
Adjustment for employee retirement benefit - 12,018 Share of other comprehensive income of entities accounted for using equity method 6,153 -7,608
Total other comprehensive income 35,843 27,464
Comprehensive income 80,850 106,084
Comprehensive income attributable to
Comprehensive income attributable to owners of parent 76,601 104,751
Comprehensive income attributable to minority interests 4,248 1,332

Osaka Gas Co., Ltd. (9532) Brief Report of Consolidated Financial Statements for the Fiscal Year Ended March 31, 2015
- 15 -
(3) Consolidated Statement of Changes in Net Assets Fiscal Year Ended March 31, 2014 (April 1, 2013 – March 31, 2014)
(Million yen) Shareholder’s equity
Capital stock
Capital surplus
Retained earnings
Treasury shares
Total shareholders'
equity Balance at beginning of current period 132,166 19,482 564,356 -413 715,592
Cumulative amount due to change in accounting policy
- -
Balance at beginning of Current period with adjustment
132,166 19,482 564,356 -413 715,592
Amount change of Current period
Dividends of surplus -18,738 -18,738
Net income 41,725 41,725 Change of scope of equity
method -75 -75
Purchase of treasury shares -405 -405 Disposal of treasury shares 3 20 24 Net changes of items other
than shareholders' equity
Total changes of items during current period - 3 22,912 -384 22,531
Balance at end of current period 132,166 19,486 587,268 -797 738,124
(Million yen)
Other Comprehensive Income
Minority interests
Total net assets
Valuation difference
on available -for-sale securities
Deferred gains or losses
on hedges
Revaluation reserve for land
Foreign currency
translation adjustment
Remeasure -ments
of defined benefit plans
Total accumulated
other comprehensive
income Balance at beginning of current period 31,526 -2,271 - 737 3,693 - 32,210 26,514 774,317
Cumulative amount due to change in accounting policy
- -
Balance at beginning of Current period with adjustment
31,526 -2,271 - 737 3,693 - 32,210 26,514 774,317
Amount change of Current period
Dividends of surplus -18,738 Net income 41,725 Change of scope of equity method - 75
Purchase of treasury shares -405
Disposal of treasury shares 24
Net changes of items other than shareholders' equity
3,312 4,697 26,720 -6,100 28,630 3,086 31,716
Total changes of items during current period 3,312 4,697 - 26,720 -6,100 28,630 3,086 54,248
Balance at end of current period 34,839 2,425 -737 30,414 -6,100 60,840 29,601 828,565

Osaka Gas Co., Ltd. (9532) Brief Report of Consolidated Financial Statements for the Fiscal Year Ended March 31, 2015
- 16 -
Fiscal Year Ended March 31, 2015 (April 1, 2014 – March 31, 2015) (Million yen)
Shareholder’s equity
Capital stock
Capital surplus
Retained earnings
Treasury shares
Total shareholders'
equity Balance at beginning of current period 132,166 19,486 587,268 - 797 738,124
Cumulative amount due to change in accounting policy
3,649 3,649
Balance at beginning of Current period with adjustment
132,166 19,486 590,917 -797 741,773
Amount change of Current period
Dividends of surplus -18,729 -18,729
Net income 76,709 76,709 Change of scope of equity
method -
Purchase of treasury shares -153 -153 Disposal of treasury shares 2 12 14 Net changes of items other
than shareholders' equity
Total changes of items during current period - 2 57,979 -141 57,840
Balance at end of current period 132,166 19,488 648,896 -938 799,613
(Million yen)
Other Comprehensive Income
Minority interests
Total net
assets
Valuation difference
on available -for-sale securities
Deferred gains or losses
on hedges
Revaluation
reserve for land
Foreign currency
translation adjustment
Remeasure-ments
of defined benefit plans
Total accumulated
other comprehensiv
e income
Balance at beginning of current period 34,839 2,425 -737 30,414 -6,100 60,840 29,601 828,565
Cumulative amount due to change in accounting policy
-97 3,551
Balance at beginning of Current period with adjustment
34,839 2,425 - 737 30,414 -6,100 60,840 29,503 832,117
Amount change of Current period
Dividends of surplus -18,729
Net income 76,709 Change of scope of equity method -
Purchase of treasury shares -153
Disposal of treasury shares 14
Net changes of items other than shareholders' equity
16,028 -8,944 8,927 12,030 28,042 869 28,912
Total changes of items during current period 16,028 -8,944 - 8,927 12,030 28,042 869 86,752
Balance at end of current period 50,868 -6,519 -737 39,341 5,929 88,882 30,373 918,869

Osaka Gas Co., Ltd. (9532) Brief Report of Consolidated Financial Statements for the Fiscal Year Ended March 31, 2015
- 17 -
(4) Consolidated Statement of Cash Flows (Million yen)
Previous Year (April 1, 2013 – March 31, 2014)
Current Year (April 1, 2014 – March 31, 2015)
Cash flows from operating activities Income before income taxes and minority interests 81,874 121,428 Depreciation 83,806 87,785 Amortization of long-term prepaid expenses 5,967 5,411 Impairment loss 30,138 2,697 Decrease (increase) in provision for safety measures -2,586 -2,379 Increase (decrease) in provision for loss on guarantees - 1,589 Decrease(increase) in provision for equipment warranties - 2,895 Decrease(increase)in Retirement Asset -3,513 -2,996 Interest and dividend income -3,811 -5,430 Interest expenses 8,567 9,475 Share of (profit) loss of entities accounted for using equity method -7,917 -6,990 Loss (gain) on sales of investment securities -5,968 -13,011 Loss(gain) on sales of fixed asset - - 2,941 Loss on Disposal of Fixed asset 1,402 1,666 Decrease (increase) in notes and accounts receivable - trade -20,573 4,132 Decrease (increase) in inventories 2,821 -14,935 Increase (decrease) in notes and accounts payable - trade 3,123 -5,371 Increase (decrease) in accrued expenses 2,887 -2,361 Increase (decrease) in accrued consumption taxes -1,913 11,402 Miscellaneous 7,688 4,663 Subtotal 181,993 196,731 Interest and dividend income received 10,524 8,678 Interest expenses paid -8,734 -9,592 Income taxes paid -29,557 -38,909 Net cash provided by (used in) operating activities 154,225 156,908 Cash flows from investing activities Purchase of investment securities -1,498 -2,997 Purchase of tangible fixed asset -109,425 -105,082 Proceeds from sales of tangible fixed asset 1,092 8,285 Purchase of intangible fixed assets -14,956 -9,600 Payments of long-term prepayment -5,268 -4,956
Proceeds from sales of investment securities 7,659 14,142 Purchase of shares of subsidiaries resulting in change in scope of consolidation -12,435 -18,495
Proceeds from shares of subsidiaries resulting in change in scope of consolidation 1,326 4,807
Other -42,086 3,193 Net cash provided by (used in) investing activities -175,591 -110,704 Cash flows from financing activities Proceeds from short-term loans payable -1,149 -19,939 Proceeds from long –term loan payment 69,356 71,650 Repayment of long term loans payable -36,870 -17,420 Proceeds from issuance of bonds 25,000 30,000 Redemption of bonds -31,217 -21,590 Payment of bond interest -18,738 -18,742 Other -2,218 -1,066 Net cash provided by (used in) financing activities 4,163 22,892 Effect of exchange rate change on cash and cash equivalents -1,894 3,336 Net increase (decrease) in cash and cash equivalents -19,097 72,433 Cash and cash equivalents at beginning of period 109,456 90,359 Cash and cash equivalents at end of period 90,359 162,793

Osaka Gas Co., Ltd. (9532) Brief Report of Consolidated Financial Statements for the Fiscal Year Ended March 31, 2015
- 18 -
(5) Notes on the Consolidated Financial Statements
(Notes Regarding Uncertainties of Entity's Ability to Continue as Going Concern)
Not applicable
(Notes Regarding Changes in Accounting Policies in Accordance with Changes in Accounting
Standards, Accounting Estimates and Restatement) Effective from the beginning of the fiscal year ending March 31, 2015, the Accounting Standard for Retirement Benefits (ASBJ Statement No. 26, issued on May 17, 2012; hereinafter, “Accounting Standard”) and Guidance on Accounting Standard for Retirement Benefits (ASBJ Guidance No. 25, issued on March 26, 2015; hereinafter, “Guidance”) have been applied (as set out in the main clause of Article 35 of the Accounting Standard and the main clause of Article 67 of the Guidance). Accordingly, the methods for calculating retirement benefit obligations and service costs have been revised. The method of attributing expected retirement benefit payments has been changed from the straight-line basis to the retirement benefit formula basis, and the method of determining the discount rate has been changed from a discount rate based on the approximate number of years of the average remaining service period of employees to a single weighted-average discount rate reflecting the expected timing and amount of benefit payment in each time. The Accounting Standard, etc., have been applied in a transitional manner as provided in paragraph 37 of the Accounting Standard, and the effects from the change have been reflected in remeasurements of defined benefit plans of the total accumulated other comprehensive income as of the end of the current consolidated accounting year. Consequently, net defined benefit assets of ¥5,996 million and net defined benefit liabilities of ¥904 million have been posted as of the end of the current consolidated accounting year. In addition, the total accumulated other comprehensive income increased by ¥3,649 million. Net asset per share increased by ¥1.75.
(Segment Information) a. Summary of reportable segments
The Osaka Gas Group’s reportable segments are the organizational units for which separate financial information is available, and they are regularly reviewed by the Board of Directors to determine the allocation of management resources and evaluate business results. The Group classifies its products and services into business segments on the basis of two business domains: the Domestic and International Energy Businesses along the Energy Value Chain, and the Life & Business Solutions Business. It then consolidates those business segments into the following four reportable segments by considering product and service similarities, namely, the Gas Business, the LPG, Electricity and Other Energy Businesses, the International Energy Businesses, and the Life & Business Solutions Business. The Gas Business sells gas and gas appliances and conducts gas pipeline installation and heat supply. The LPG, Electricity, and Other Energy Businesses sell LPG and industrial gas and supply electricity. The International Energy Businesses supply energy overseas, lease tankers to transport LNG, and conduct development and investment related to petroleum and natural gas. The Life & Business Solutions Business conducts the development and leasing of real estate, information processing services, sales of fine materials and carbon material products, operation of sports facilities, engineering, and leasing of automobiles and equipment. There has been a revision for the classification of business segments in “Catalyze Our Dreams”, the Company’s medium-term management plan established in March 2014 and the Renewable energy business, which was originally included in the Environment and Non-Energy segment was transferred to the related segments (LPG, Electricity and Other Energy and International Energy) and the Environment and Non-Energy segment was renamed to the Life & Business Solutions. The segment information for the previous consolidated fiscal year is provided based on the report for the segments after the revision.
b. Explanation of measurements of sales, profit (loss), asset, liability, and other items for each reportable segment

Osaka Gas Co., Ltd. (9532) Brief Report of Consolidated Financial Statements for the Fiscal Year Ended March 31, 2015
- 19 -
The accounting policies of reportable segments comply with accounting principles and procedures to prepare consolidated financial statements. Internal sales and transfer prices between operating segments are according to the arm’s length principle.
c. Information of sales, profit (loss), asset, liability, and other items for each reportable segment
Fiscal Year ended March 31, 2014 (April 1, 2013 to March 31, 2014) (Million yen)
Gas
LPG, Electricity, and Other
Energy
International Energy
Life & Business Solutions
Total Adjustments Consolidated
Net sales Sales from external customers 1,092,452 257,779 12,651 149,698 1,512,581 - 1,512,581
Transactions with other segments 27,074 3,282 720 46,849 77,926 -77,926 -
Total 1,119,526 261,061 13,372 196,547 1,590,508 -77,926 1,512,581 Segment Income
Operating income (loss) 34,093 44,576 -800 18,768 96,637 2,744 99,381 Equity in earnings (loss) of affiliates -2,016 770 9,029 133 7,917 - 7,917
Total 32,077 45,346 8,229 18,901 104,555 2,744 107,299 Segment assets 741,733 177,538 294,664 387,671 1,601,607 66,710 1,668,317 Other items
Depreciation 52,804 12,941 8,604 9,758 84,109 -842 83,266 Amortization of goodwill - 231 308 - 539 - 539 Investments in entities accounted for using equity method
91 5,202 63,176 8,166 76,637 - 76,637
Increase in property, plant and equipment and intangible assets
60,652 3,316 47,980 12,922 124,872 -725 124,146
Fiscal Year ended March 31, 2015 (April 1, 2014 to March 31, 2015) (Million yen)
Gas
LPG, Electricity, and Other
Energy
International Energy
Life & Business Solutions
Total Adjustments Consolidated
Net sales Sales from external customers 1,114,034 240,980 12,565 160,583 1,528,164 - 1,528,164
Transactions with other segments 22,941 2,765 1,148 46,937 73,793 -73,793 -
Total 1,136,975 243,746 13,714 207,521 1,601,957 -73,793 1,528,164 Segment Income
Operating income (loss) 50,542 42,267 -6,250 16,284 102,843 2,221 105,065 Equity in earnings of affiliates -248 -570 7,511 297 6,990 - 6,990
Total 50,293 41,697 1,261 16,581 109,834 2,221 112,055 Segment assets 818,202 177,652 368,002 394,950 1,758,807 103,393 1,862,201 Other items
Depreciation 57,143 11,508 6,247 11,098 85,999 -788 85,210 Amortization of goodwill - 235 333 2,005 2,575 - 2,575 Investments in entities accounted for using equity method
- 5,845 76,380 8,509 90,735 - 90,735
Increase in property, plant and equipment and intangible assets
49,222 15,326 38,525 17,205 120,279 -881 119,398

Osaka Gas Co., Ltd. (9532) Brief Report of Consolidated Financial Statements for the Fiscal Year Ended March 31, 2015
- 20 -
(Per Share Information)
Current year (From April 1, 2014 to March 31, 2015)
Previous year (From April 1, 2013 to March 31, 2014)
Net assets per share 426.98yen 383.90yen Earnings per share 36.86yen 20.04yen (Notes)
1. Since there were no potential shares that would have dilutive effect if issued, data on diluted earnings per share is not presented in this document.
2. The following data were used for calculating earnings per share:
Current year
(From April 1, 2014 to March 31, 2015)
Previous year (From April 1, 2013 to March 31, 2014)
Net income (million yen) 76,709 41,725
Amount not attributable to common shareholders (million yen) - -
Net income attributable to shareholders of common shares (million yen) 76,709 41,725
Average issued common shares during the year (thousand shares) 2,081,017 2,081,828
(Notes Regarding Significant Events after Reporting Period)
Not applicable
Disclosure of notes other than the above has been omitted, because of the immateriality of those notes omitted.

Osaka Gas Co., Ltd. (9532) Brief Report of Consolidated Financial Statements for the Fiscal Year Ended March 31, 2015
- 21 -
5. Non-Consolidated Financial Statements (1) Balance Sheet (Million yen)
Previous Year
( As of March 31, 2014) Current Year
(As of March 31, 2015) Assets Non-current assets Property, plant and equipment Production facilities 74,862 74,177 Distribution facilities 317,098 303,544 Service and maintenance facilities 65,649 63,334 Facilities for incidental businesses 3,916 3,982 Construction in progress 17,297 18,922 Total property, plant and equipment 478,824 463,961 Intangible assets Patent right 29 18 Leasehold right 2,953 2,985 Other intangible assets 3,139 3,334 Total intangible assets 6,122 6,338 Investments and other assets Investment securities 55,453 70,236 Investments in subsidiaries and associates 235,686 282,570
Long-term loans receivable from subsidiaries and associates 182,339 190,043
Investments in capital 22 22 Long-term prepaid expenses 8,606 7,732 Prepaid pension cost 40,224 49,184 Other investments and other assets 8,747 8,570 Allowance for doubtful accounts - 680 -530 Total investments and other assets 530,399 607,828 Total non-current assets 1,015,346 1,078,128 Current assets Cash and deposits 30,252 80,197 Notes receivable - trade 390 252 Accounts receivable - trade 112,508 104,642 Accounts receivable from subsidiaries and associates -
trade 14,161 14,816
Accounts receivable - other 7,883 21,746 Securities 18,012 20,012 Finished goods 213 227 Raw materials 35,527 49,013 Supplies 8,673 8,543
Short-term loans receivable from subsidiaries and associates 20,839 16,245
Short-term receivables from subsidiaries and associates 2,081 1,684 Deferred tax assets 6,636 7,095 Other current assets 11,212 9,111 Allowance for doubtful accounts -544 -451 Total current assets 267,847 333,137 Total assets 1,283,194 1,411,266

Osaka Gas Co., Ltd. (9532) Brief Report of Consolidated Financial Statements for the Fiscal Year Ended March 31, 2015
- 22 -
(Million yen)
Previous Year
(As of March 31, 2014) Current Year
(As of March 31, 2015) Liabilities Non-current liabilities Bonds payable 240,659 240,666 Long-term loans payable 162,896 211,276 Long-term debt to subsidiaries and associates 946 1,227 Deferred tax liabilities 9,388 14,663 Provision for retirement benefits 4,741 5,202 Provision for gas holder repairs 1,605 1,687 Provision for safety measures 10,831 8,451 Provision for investment loss 6,999 6,999 Provision for loss on guarantees - 1,589 Provision for equipment warranties - 2,895 Other noncurrent liabilities 1,931 1,676 Total non-current liabilities 440,003 496,336 Current liabilities Current portion of non-current liabilities 26,658 44,667 Accounts payable - trade 30,739 23,043 Short-term loans payable 10,000 - Accounts payable - other 18,392 21,524 Accrued expenses 37,304 38,039 Income taxes payable 19,764 22,592 Advances received 4,469 7,307 Deposits received 1,409 1,441 Short-term loans payable to subsidiaries and associates 91,076 91,721 Short-term debt to subsidiaries and associates 22,463 25,030 Other current liabilities 884 2,174 Total current liabilities 263,162 277,541 Total liabilities 703,165 773,877

Osaka Gas Co., Ltd. (9532) Brief Report of Consolidated Financial Statements for the Fiscal Year Ended March 31, 2015
- 23 -
(Million yen)
Previous Year
(As of March 31, 2014) Current Year
(As of March 31, 2015) Net Assets Shareholder’s equity Capital stock 132,166 132,166 Capital surplus Legal capital surplus 19,482 19,482 Other capital surplus 4 6 Total capital surpluses 19,486 19,488 Retained earnings Legal retained earnings 33,041 33,041 Other retained earnings Reserve for reduction entry of specified replaced
properties 232 239
Reserve for overseas investment loss 14,638 18,189 Reserve for adjustment of cost fluctuations 89,000 89,000 General reserve 62,000 62,000 Retained earnings brought forward 201,963 253,808 Total retained earnings 400,876 456,278 Treasury shares -797 -938 Total shareholders' equity 551,732 606,995 Valuation and translation adjustments Valuation difference on available-for-sale securities 23,696 35,655 Deferred gains or losses on hedges 4,600 -5,261 Total valuation and translation adjustments 28,296 30,393 Total net assets 580,029 637,389 Total liabilities and net assets 1,283,194 1,411,266

Osaka Gas Co., Ltd. (9532) Brief Report of Consolidated Financial Statements for the Fiscal Year Ended March 31, 2015
- 24 -
(2) Statement of Income (Million yen)
Previous Year (April 1, 2013 –
March 31, 2014)
Current Year (April 1, 2014 –
March 31, 2015) Product sales Gas sales 915,008 938,991
Total product sales 915,008 938,991
Cost of sales
Beginning inventories 200 213
Cost of products manufactured 621,935 623,327
Purchase of finished goods 0 0
Costs of gas for own use 7,181 9,879
Ending inventories 213 227
Total cost of sales 614,742 613,433
Gross profit 300,266 325,557
Selling, general and administrative expenses
Supply and sales expenses 225,773 229,786
General and administrative expenses 55,053 54,961
Total selling, general and administrative expenses 280,826 284,748
Income on core business 19,440 40,809
Miscellaneous operating revenue
Revenue from installation work 24,440 24,321
Revenue from gas appliance sales 107,112 105,002
Third party access revenue 2,484 2,422
Other miscellaneous operating revenue 4,347 3,785
Total miscellaneous operating revenue 138,385 135,531
Miscellaneous operating expenses
Expenses of installation work 23,628 23,160
Expenses of gas appliance sales 104,249 106,527
Total operating miscellaneous expenses 127,878 129,687
Revenue for incidental businesses
Revenue from electric supply business 89,747 100,616
Revenue from LNG sales 64,403 63,418
Revenue from other incidental businesses 14,301 13,276
Total revenue for incidental businesses 168,452 177,312
Expenses for incidental businesses
Expenses for electric supply business 60,592 72,255
Expenses for LNG sales 64,485 59,927
Expenses for other incidental businesses 12,580 11,591
Total expenses for incidental businesses 137,659 143,774
Operating income 60,740 80,190

Osaka Gas Co., Ltd. (9532) Brief Report of Consolidated Financial Statements for the Fiscal Year Ended March 31, 2015
- 25 -
(Million yen)
Previous Year (April 1, 2013–
March 31, 2014)
Current Year (April 1, 2014 –
March 31, 2015) Non-operating income Interest income 1,986 1,959
Interest on securities 29 20
Dividend income 1,121 1,181
Dividends from subsidiaries and associates 7,104 9,139
Gain from foreign exchange 705 2,654
Miscellaneous income 5,184 5,573
Total non-operating income 16,131 20,528
Non-operating expenses
Interest expenses 2,729 3,990
Interest on bonds 3,918 4,012
Amortization of bond issuance cost 115 160
Provision for loss on guarantees - 1,589
Miscellaneous expenses 911 2,709
Total non-operating expenses 7,675 12,463
Ordinary income 69,196 88,255
Extraordinary income
Gain on sales of investment securities 3,669 12,444
Total extraordinary income 3,669 12,444
Extraordinary losses
Impairment loss - 2,066
Loss on valuation of shares of subsidiaries and associates 25,520 -
Total extraordinary losses 25,520 2,066
Income before income taxes 47,345 98,632
Income taxes - current 18,600 25,000
Income taxes - deferred 3,803 3,347
Total income taxes 22,403 28,347
Net income 24,942 70,285

Osaka Gas Co., Ltd. (9532) Brief Report of Consolidated Financial Statements for the Fiscal Year Ended March 31, 2015
- 26 -
(3) Statement of Changes in Net Assets Fiscal Year Ended March 31, 2014(April 1, 2013 – March 31, 2014) (Million yen)
Shareholder’s equity
Capital stock
Capital Surplus Retained earnings
Legal capital surplus
Other capital surplus
Total capital surplus
Legal retained earnings
Other retained earnings Reserve for reduction entry of specified replaced
properties
Reserve for overseas
investment loss
Reserve for adjustment
of cost fluctuations
Balance at beginning of current period 132,166 19,482 0 19,482 33,041 232 15,454 89,000
Cumulative amount due to change in accounting policy
Balance at beginning of Current period with adjustment 132,166 19,482 0 19,482 33,041 232 15,454 89,000
Amount change of Current period Reserve for reduction entry of
specified asset replacement - Provision of reserve for
overseas investment loss 470 Reversal of reserve for overseas
investment loss - 1,285
Dividends of surplus
Net income
Purchase of treasury shares Disposal of treasury
shares 3 3 Net changes of items other than
shareholders' equity Total changes of items during period - - 3 3 - - -815 - Balance at end of current period 132,166 19,482 4 19,486 33,041 232 14,638 89,000
(Million yen)
Shareholder’s equity Valuation, translation
Total net assets
Retained Earnings
Treasury
shares
Total share
-holders' equity
Valuation difference
on available-f
or-sale securities
Deferred gains
or losses
on hedges
Total valuation and
translation adjustments
Other retained earnings Total retained earnings
General reserve
Retained earnings brought forward
Balance at beginning of current period 62,000 194,943 394,672 -413 545,908 20,134 6,380 26,514 572,423
Cumulative amount due to change in accounting policy - - - -
Balance at beginning of Current period with adjustment 62,000 194,943 394,672 -413 545,908 20,134 6,380 26,514 572,423 Amount change of Current period Reserve for reduction entry of
specified asset replacement - - - - Provision of reserve for
overseas investment loss - 470 - - - Reversal of reserve for
overseas investment loss 1,285 - - -
Dividends of surplus -18,738 -18,738 -18,738 -18,738
Net income 24,942 24,942 24,942 24,942
Purchase of treasury shares - 405 - 405 -405 Disposal of treasury
shares 20 24 24 Net changes of items other
than shareholders' equity 3,561 -1,779 1,782 1,782 Total changes of items during period - 7,019 6,204 -384 5,823 3,561 -1,779 1,782 7,605
Balance at end of current period 62,000 201,963 400,876 -797 551,732 23,696 4,600 28,296 580,029

Osaka Gas Co., Ltd. (9532) Brief Report of Consolidated Financial Statements for the Fiscal Year Ended March 31, 2015
- 27 -
Fiscal Year Ended March 31, 2015 (April 1, 2014 – March 31, 2015) (Million yen)
Shareholder’s equity
Capital stock
Capital Surplus Retained earnings
Legal capital surplus
Other capital surplus
Total capital surplus
Legal retained earnings
Other retained earnings Reserve for reduction entry of specified replaced
properties
Reserve for overseas
investment loss
Reserve for adjustment
of cost fluctuations
Balance at beginning of current period 132,166 19,482 4 19,486 33,041 232 14,638 89,000
Cumulative amount due to change in accounting policy
Balance at beginning of Current period with adjustment 132,166 19,482 4 19,486 33,041 232 14,638 89,000
Amount change of Current period Reserve for reduction entry of
specified asset replacement 6 Provision of reserve for
overseas investment loss 4,969 Reversal of reserve for overseas
investment loss -1,417
Dividends of surplus
Net income
Purchase of treasury shares Disposal of treasury
shares 2 2 Net changes of items other than
shareholders' equity Total changes of items during period - - 2 2 - 6 3,551 - Balance at end of current period 132,166 19,482 6 19,488 33,041 239 18,189 89,000
(Million yen)
Shareholder’s equity Valuation, translation
Total net assets
Retained Earnings
Treasury shares
Total share
-holders' equity
Valuation difference
on available-f
or-sale securities
Deferred gains or losses
on hedges
Total valuation and
translation adjustments
Other retained earnings Total
retained earnings
General reserve
Retained earnings brought forward
Balance at beginning of current period 62,000 201,963 400,876 -797 551,732 23,696 4,600 28,296 580,029
Cumulative amount due to change in accounting policy 3,847 3,847 3,847 3,847
Balance at beginning of Current period with adjustment 62,000 205,810 404,723 -797 555,579 23,696 4,600 28,296 583,876
Amount change of Current period Reserve for reduction entry of
specified asset replacement - 6 - - - Provision of reserve for
overseas investment loss -4,969 - - - Reversal of reserve for overseas
investment loss 1,417 - - -
Dividends of surplus -18,729 -18,729 -18,729 -18,729
Net income 70,285 70,285 70,285 70,285
Purchase of treasury shares -153 -153 - 153 Disposal of treasury
shares 12 14 14 Net changes of items other than
shareholders' equity 11,959 -9,862 2,096 2,096 Total changes of items during period - 47,997 51,555 -141 51,416 11,959 -9,862 2,096 53,512
Balance at end of current period 62,000 253,808 456,278 -938 606,995 35,655 - 5,261 30,393 637,389