fiscal transparency in open government partnership ... · fiscal transparency in open government...
TRANSCRIPT

Fiscal Transparency in Open Government Partnership Countries, and the Implementation of OGP Commitments: An Analysis Background Paper prepared by GIFT for the Open Government Partnership Fiscal Openness Working Group: Mexico OGP Summit Mexico City, October 28-30, 2015
Murray Petrie, Lead Technical Advisor, the Global Initiative for Fiscal Transparency. With inputs from David Robins and Vivek Ramkumar (International Budget Partnership), and Juan Pablo Guerrero, GIFT Network Director.

2
Table of Contents Page No.
Summary of Key Points 4
1. Introduction 9
2. How transparent are budgets and fiscal management practices of OGP Countries and what are some of the trends? 9
a. Country and regional scores and trends in scores 10 b. Which countries do not meet the OGP minimum
fiscal transparency requirements? 11 c. Country scores on public participation, and on the strength
of legislative oversight. 12 3. What fiscal transparency commitments did countries make
in their OGP Action Plans? 13 4. How well have OGP countries implemented their commitments,
based on the findings in the Independent Monitoring Reports? a. Implementation of all commitments in Action Plans. 14 b. Implementation of only the fiscal transparency commitments
in Action Plans. 16 5. What is the degree of ambition in the fiscal transparency commitments
across countries? 22 6. What are some of the cutting edge and innovative commitments
and consultation practices in OGP members? 28 7. What steps to increase fiscal transparency should OGP countries 30
consider taking in their Action Plans?
Appendices:
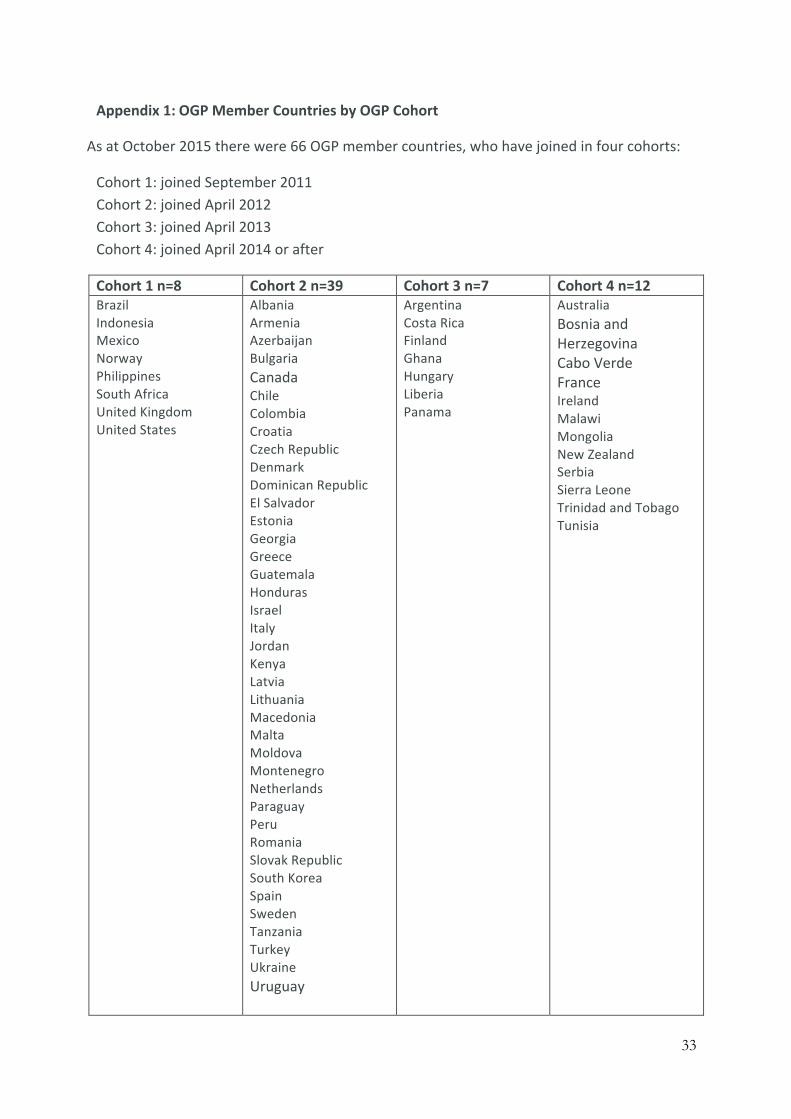
Appendix 1: OGP Member Countries by OGP Cohort 33
Appendix 2: Open Budget Index Scores and Public Participation 34 Scores of OGP Member Countries
Appendix 3: 2015 OBI Scores on the Strength of the Legislature 36 for All OGP Countries
Glossary of key terms in budget and fiscal transparency 38
3
Text Boxes: Page No.
Box 1: Lessons drawn by Foti from IRM reports on two years of action plans 15
Figures:
Figure 1: Distribution of Absolute Changes in OBI Scores of OGP 10 members from each country’s first OBI to 2015 OBI
Figure 2: Fiscal Transparency Commitments as a Proportion of all Commitments by Country 18
Figure 3: Total Fiscal Transparency Commitments by Level of Completion 19
Figure 4: Fiscal Transparency Commitments by Country and Level of Completion 21
Tables:
Table 1: 2015 Open Budget Survey Scores for Public Participation in the Budget 12 Process for OGP Members
Table 2: Table 2: 2015 Open Budget Survey Scores for Strength 13 of Legislative Oversight by Region Table 3: Comparative data on levels of completion of all commitments 20 compared to FT commitments only
Table 4: Number of FT Commitments in Action Plans 24 rated as OGP Star Commitments
Table 5: Country Implementation of Fiscal Transparency Commitments 25 by Level of Ambition: A Stylized Qualitative Approach

4
Summary of Key Points
How transparent are budgets and fiscal management practices in OGP countries?
1. There are some outstanding examples amongst OGP countries of rapid increases in fiscal transparency in recent years as measured by the Open Budget Index (OBI), including in Africa ( Malawi, Sierra Leone), the Americas (Dominican Republic, Peru, and El Salvador), Asia (the Philippines), and in Europe (Tunisia, Romania, Italy and Georgia).
2. There are also some notable examples of backsliding on fiscal transparency amongst OGP members as measured by the OBI, such as in Honduras and the Slovak Republic.
3. With respect to the 2015 OBS, 29 of the 47 OGP countries included in the OBS score 60 or below on the OBI. This means that they are categorized in the OBI as providing insufficient budget information to the public. Four of those countries provide minimal budget information, the second lowest category.
4. On average, the pace of improvement in budget transparency is slow. Across all OGP countries in the Open Budget Survey there was an average increase of only +2 on the OBI between the 2012 and 2015 surveys (which is similar to the +3 improvement for all countries in the OBS).
5. There are four OGP members that, according to IBP data, do not meet the minimum fiscal transparency eligibility criteria for OGP membership: Liberia, Malawi, Spain, and Tunisia. How well have OGP countries implemented the commitments in their National Action Plans? a) Implementation of All Commitments in Action Plans as assessed in the Independent Progress Reports
6. An analysis of all the 947 commitments in the first 43 Independent Progress Reports by Foti (Independent Reporting Mechanism Program Director), has found that:1 a There were 200 ‘starred commitments’—impactful, clearly relevant, substantially
completed commitments. This was around 25% of all commitments. b More ambitious action plans were not necessarily implemented less often – a
number of countries with higher potential impact action plans also had higher rates of completion of commitments. A next step for the OGP community will be to learn from countries with high levels of both potential impact and implementation.
1 ‘OGP By The Numbers: What the IRM Data Tell Us About OGP Results.’ IRM Technical Paper1, Joseph Foti. http://www.opengovpartnership.org/sites/default/files/attachments/Technical%20paper%201_final.pdf It should be noted that the rates of completion following IRM assessments are likely to rise as the IRM research period did not include the final months of implementation.

5
c Cohort 2 countries had considerably weaker rates of implementation of commitments than cohort 1 countries (the 8 original OGP members).2
d The Independent Reporting Mechanism progress reports show wide variation in institutional ownership and the degree of consultation with civil society.
e At this time it is inconclusive which institutional arrangements in-‐country are more conducive to successful development and implementation of an OGP action plan.
f Further research is needed to measure ultimate outcomes and impacts. Although there are many success stories, it is too early to tell if OGP has had a measurable impact on opening government in participating countries. The research agenda using IRM OGP data can help build a better evidence base for open government, guide OGP priorities, and signal success stories, some of which might be transferrable to other national contexts.
7. Of the first 43 countries covered by Independent Progress Reports, three quarters of the second cohort of 35 countries held in-‐person consultations with civil society, and four-‐fifths completed a detailed self-‐assessment on time. However, fewer than half of these OGP members met the letter of the OGP requirements for consultation in development and implementation of their Action Plans. More than half of all member countries thus risk being found in breach of their OGP commitments.
8. Analysis compiled by GIFT for this report of country-‐by-‐country performance and performance by region with respect to all commitments, based on the data in 51 Independent Progress Reports finds:
a. The top ten countries, in terms of the total number of completed commitments, were Brazil (25), Mexico (20), Denmark (17), UK (17), Moldova (16), Chile (15), USA (13), Canada (12), and Ghana,3 Hungary and Montenegro (10 each).
b. The top ten countries, in terms of the percentage of their commitments that were either completed or substantially completed, were Brazil (91%), Latvia (88%), Indonesia (83%), Uruguay (83%), Chile (79%), Croatia (78%), Mexico (76%), El Salvador (71%), Spain (69%), and USA (69%).
c. The weakest 10 performers, in terms of the number of commitments rated ‘not started’, were Ghana (17), Moldova (13), Macedonia (10), Peru (10), Montenegro (8), Romania (8), Paraguay (7), Italy (5), Kenya (5), Liberia, and Tanzania (5).
2 See Appendix 1 for a list of OGP members by cohort. 3 In Ghana’s Action Plan, there are 13 commitments but 48 sub-‐commitments that are the equivalent of commitments in many other Action Plans. For the purposes of this current report, therefore, Ghana is assessed as having 48 commitments (the total number of sub-‐commitments). A similar situation applies with respect to Croatia.

6
d. The countries with the largest number of commitments rated as of potentially moderate or transformative impact were Peru (38), Ghana (31), Moldova (31), Montenegro (28), Azerbaijan (20), Albania (19), Slovak Republic (18), Bulgaria (17), Dominican Republic (17), Macedonia and Tanzania (16).
e. In terms of performance by OGP region, the percentage of commitments completed or substantially completed was: Africa 32%; Asia 53%; Europe 46%; Americas 53%.
b) Implementation of the Fiscal Transparency commitments only
9. An analysis by GIFT for this report identifies a total of 378 commitments relating to fiscal transparency (FT) in fifty one Action Plans. This is 33% of all commitments in this set of Action Plans. Forty eight of the fifty one countries had FT-‐related commitments.
10. The definition of commitments varies widely within and across Action Plans, reducing the comparability of data on commitments.
11. There is a very wide range in the proportion of fiscal transparency commitments to total commitments in each county’s Action Plan, from 0% (Chile, Panama, and Romania) to 100% (Guatemala).
12. Of these, the IRM reports assessed that implementation of 87 (23%) commitments was completed, 94 (25%) were substantially completed, 127 (34%) were assessed as limited completion, 43 (11%) were not started, and 26 (7%) were unclear or withdrawn. These results are broadly similar to the results for implementation of all commitments.
13. Of those countries with more than five FT commitments, notable progress in implementation of commitments was made by Croatia, Mexico, Brazil, Indonesia, Moldova and the Philippines.
14. There are 74 ‘star commitments’ relating to FT – commitments that combine three elements: clear relevance to OGP goals; assessed as likely to be moderate to high impact; and substantially completed or completed. Star commitments make up 20% of all FT commitments. This is a little lower than the share of star commitments in total commitments (FT and non-‐FT), which is around 25%.
15. At the country level the stand-‐out performer on FT star commitments is Croatia (11 star commitments). Honduras, Moldova, Colombia, and the Dominican Republic also have an impressive number of star commitments (5-‐6 each), while Ghana has 4.4 It
4 In Ghana’s Action Plan, commitment 2 on fiscal transparency has six sub-‐components, which have all been independently assessed and are equivalent to commitments in many other Action Plans – see footnote 2. The IRM report scored overall performance on commitment 2 as a star rating. Four of the sub-‐components of the fiscal transparency commitment were assessed in the IRM report as completed or substantially completed, so for the purposes of this report Ghana is assessed as having four OGP star commitments.
7
needs to be noted that the star commitment rating was created only after the cohort 1 countries prepared their first Action Plans.
16. There is an impressive number of countries (14) exhibiting both high ambition and high implementation of their FT commitments. Six countries particularly stand-‐out in this respect -‐ Brazil, Croatia, Indonesia, Mexico, Moldova, and the Philippines.
17. Notable FT commitments, and innovative FT commitments and consultation practices, are listed on pages 26-‐29 of this report.
18. From a GIFT perspective, and considering potential impact, some commitments would be regarded as technically or politically ambitious that have not been rated as a star commitment by IRM researchers e.g. a reform of the Government Financial Management Information System, the introduction of a Treasury Single Account or of program budgeting, the introduction of an internal audit function across government. While some of these may look like they are internal to government, experience shows that they are critically important to improving the quality of fiscal data and information that can be published. Some of these commitments are listed on pp. 26-‐29 of this report.
19. Finally, it is not possible to discern, from the IRM reports, what the ‘OGP-‐effect’ is. Many commitments were pre-‐existing government policy or reforms, and some large multi-‐year FT reforms were already underway. Evaluating the impact of the OGP will require specific impact analysis.
Looking ahead:
20. Many OGP countries could achieve rapid increases in budget transparency just by publishing documents already produced for use within government. Drawing on data from the 2015 Open Budget Survey for 45 OGP member countries, 4 countries produced a Pre-‐Budget Statement but did not publish it; 4 countries produced but did not publish a Mid-‐Year Review; and 1 country produced but did not publish a Year-‐End Report and an Audit Report.
21. Other reports that are not currently produced, but which could be produced and published with relatively little effort, are a Citizens’ Budget (not published at the time of the 2015 OBS in 12 OGP members), and a Mid-‐Year Review (not produced in 21 OGP members).
22. The 4 OGP members that do not meet the minimum fiscal transparency requirements for OGP membership should give priority to publishing the Audit Report.
23. OGP members that have gone backwards on fiscal transparency in recent years should give priority to decisively reversing this trend.
24. Countries should give early priority to creating more opportunities for public participation in the design and implementation of fiscal policies over the budget and policy cycles. In this they should have regard to the principles of public participation
8
in fiscal policy that are being developed by GIFT, and to GIFT’s body of work on country practices in public participation in fiscal policy.5
25. Countries should also give early priority to strengthening legislative oversight (including opening up legislative committee budget hearings to the public); strengthening the independence and resourcing of the Supreme Audit Institution; and introducing social auditing.
26. Countries should pay more attention to the specification of commitments in their Action Plans, using SMART criteria (the Philippines first Action Plan and the second UK Action Plan provide some good examples); clearly demonstrate how commitments are advancing open government as opposed to good government; group similar activities together in logically sequenced steps with timelines; and consider commitments framed in terms of outcomes rather than intermediate processes.
27. Each country should designate a lead agency responsible for the implementation of each commitment, and desirably also publish the position and name of the responsible official. They should also publish the names of specific CSOs who are working with government on each commitment.
28. Countries need to follow considerably more closely the OGP process requirements for public consultation in the design and implementation of their Action Plans than was the case generally – with notable exceptions such as Mexico – for cohort 1 (with respect to their first Action Plans) and cohort 2 members. They should also go beyond traditional civil society consultation models towards institutionalising systematic, on-‐going and meaningful dialogue with non-‐government actors and the public.
29. GIFT stands ready to assist countries with the design and implementation of their fiscal transparency commitments. The OGP-‐Fiscal Openness Working Group, which is coordinated by GIFT, supports the implementation of budget and fiscal transparency commitments by providing a platform for peer to peer sharing and learning; offering access to international good practices, tools, norms, and technical expertise on fiscal openness; supporting OGP members to develop more ambitious fiscal openness goals and commitments; and motivating additional governments to join OGP. For instance, GIFT’s work on public participation in fiscal policy – including country case studies, and draft principles on how governments should engage the public -‐ may be helpful to any actors wishing to extend and strengthen public participation in their country.
5 See materials on public participation in fiscal policy, including principles, and country case studies, at http://www.fiscaltransparency.net/use-‐blog/

9
1. Introduction
This note has been prepared as background for the meeting of the Fiscal Openness Working Group (FOWG) in Mexico City, on 27-‐29 October 2015. The FOWG is a collaboration between the Open Government Partnership (OGP) Support Unit, the Global Initiative for Fiscal Transparency (GIFT), and the Governments of Brazil and the Philippines.
The aim of the OGP-‐GIFT FOWG is to support and promote the implementation of budget and fiscal transparency commitments made by OGP governments (see the glossary for definitions of some key terms relating to budget and fiscal transparency).
GIFT is a multi-‐stakeholder action network established in 2011 that works to advance significant, continuous improvements in fiscal transparency, participation, and accountability in countries around the world.6 GIFT engages a wide array of stakeholders who are committed to a robust local, national, and international action agenda around its core value proposition.
2. How Transparent are the Budgets and fiscal management practices of OGP Countries and what are some of the Trends? 7
The best way to answer this question is to draw on data from the Open Budget Survey (OBS) compiled by the International Budget Partnership (IBP) and used to compile country scores on the Open Budget Index (OBI). The OBS is the most comprehensive cross-‐country data on current practices with respect to fiscal transparency.8 There have been five OBS surveys since 2006, with country coverage increasing from 59 countries in 2006 to 102 countries in 2015. The OBS is also the source of data on whether a country meets the minimum entry requirements for budget transparency for the OGP -‐ which are the publication of the Executive’s Budget Proposal and the Audit Report.
OBS data will be used here for three purposes:
a To analyse country and regional scores, and trends in scores. b To assess the extent to which current OGP members and selected other countries
meet the minimum fiscal transparency requirements for the OGP. c To assess country scores on the strength of public participation in fiscal policy, and
on the strength of legislative oversight of fiscal policy.
6 See http://fiscaltransparency.net for more details. 7 This section uses data and information compiled by David Robins of the International Budget Partnership. 8 See ‘Defining the Technical Content of Global Norms: Synthesis and Analytic Review Revised Phase 1 Report for the GIFT Advancing Global Norms Working Group. http://fiscaltransparency.net/wp-‐content/uploads/2012/03/GIFT-‐Defining-‐the-‐Technical-‐Content-‐of-‐Global-‐Norms-‐Synthesis-‐and-‐Analytic-‐Review.pdf

10
a) Country and regional scores and trends in scores.
The Table in Appendix 2 displays country scores for OGP members for each of the five OBS surveys. For each country the table also shows the change in score for two time periods:
a) Between the year of their first inclusion in the survey (which for most countries was 2006 but for some was 2008, 2010 or 2012) and the 2015 survey; and
b) Between 2012 and 2015.
This provides some indication of trends over two recent time periods.
Figure 1 below shows the distribution of absolute changes in scores for the whole period to 2015 by size and number of countries.
9
There are some ‘long tail’ features to the distribution.
Outstanding increases in absolute OBI scores have been achieved by OGP members over the period 2006-‐2015:10
9 The absolute change in OBI score reflects the change in OBI score since the country first participated in the Open Budget Survey. For some countries this change spans from 2006-‐2015, while for others it only spans 2008-‐2015, 2010-‐2015, or 2012-‐2015.
0
1
2
3
4
5
6
7
8
Num
ber o
f Cou
ntrie
s
Absolute Change in OBI Score
Figure 1: Distribukon of Absolute Changes in OBI Scores of OGP members from each country's first survey to 2015 OBI
n = 46

11
• In Africa: Malawi +37; Liberia +35; • In the Americas: Honduras +31; Dominican Republic +39; El Salvador +25; • In Asia: Mongolia +33; Azerbaijan +21; Indonesia +17; • In Europe: Georgia +32; Tunisia +31; Bulgaria +18; Albania +13; Croatia +11.
Notable reductions in OBI scores include:
• In Europe: Macedonia -‐19; Ukraine -‐16; Bosnia and Herzegovina -‐7.
With respect to the 2015 OBS, 29 of the 47 OGP countries included in the OBS (62%) score 60 or below on the OBI. This means that they are categorized in the OBI as providing insufficient budget information to the public. Four of those countries provide minimal budget information, the second lowest category in the OBI.
The OGP member with the greatest improvement between the 2012 OBS and 2015 OBS was Tunisia, which increased its score by 31 points by publishing the Executive’s Budget Proposal and Citizens Budget. Romania (+28) and the Dominican Republic (+22) both saw substantial improvements to their OBI score by improving the comprehensiveness of the Executive’s Budget Proposal. Peru, the Philippines, Sierra Leone, Italy, Malawi, Georgia, and El Salvador all improved by 10 points or more.
On average, however, the pace of improvement in budget transparency is slow. Across all OGP countries in the Survey there was an average increase of only +2 on the OBI between the 2012 and 2015 Surveys (which is similar to the +3 improvement for all countries in the OBS).
It is notable that many of these improvements came from publication of documents that governments were already producing for their internal use and for donors, but not making publicly available.
Finally, Appendix 2 also shows average scores for OGP members by OGP region (for Africa, Asia, Europe, and the Americas).
b) Which countries do not meet the OGP minimum fiscal transparency requirements?
As noted, the minimum entry requirements for budget transparency for the OGP are the publication of the Executive’s Budget Proposal and the Audit Report.11
10 The figures that follow show the largest absolute change that occurred within the period 2006-‐2015. For most countries this is the difference between their score on first inclusion in the survey, and the score in the 2015 survey, but for some countries their score first increased, and then fell. For those countries e.g. Ukraine the 2006-‐2015 change is smaller than the change over a shorter period. The largest change is shown in these figures, while the data in Figure 1 are based on the change since the first survey. 11 In order to be eligible to participate in OGP, governments must demonstrate a minimum level of commitment to open government principles in four key areas (Fiscal Transparency, Access to Information, Income and Asset Disclosures, and Citizen Engagement). A country is eligible to join the OGP if it meets those

12
All OGP members publish their Executive’s Budget Proposal. However four countries fail to meet international standards on the availability of the Audit Report. Malawi and Tunisia do not produce an Audit Report, while Liberia produces one for its internal use only. Spain produces an Audit Report, but publishes it too late to be considered publicly available.
c) Country scores on public participation, and on the strength of legislative oversight.
The 2015 OBS included revised questions on public participation over the budget cycle (public participation was first included in the 2012 OBS). The average public engagement score in 2015 for all 102 countries surveyed was only 25 out of 100, while for OGP member countries the average was 36 – which means that on average, OGP countries included in the OBS only provide weak opportunities for the public to participate in the budget process.
Table 1 shows the average participation scores by OGP region for OGP members.
Table 1: 2015 Open Budget Survey Scores for Public Participation in the Budget Process for OGP Members
Average for Africa Average for the Americas
37 35
Average for Asia 45 Average for Europe 33 Average for all OGP countries 36
The stand out performer on public participation across all 102 countries in the 2015 OBS was South Korea, with a score of 83. This is in sharp contrast to Korea’s record of public consultation in developing and implementing its OGP Action Plan. The first IRM report for this country found that Korea failed to meet OGP commitments on public consultation at all eight stages of the Action Plan process.
In Africa, the strongest performers on the OBS public participation scores were South Africa (65) and Malawi (44). All public participation scores for OGP members are displayed in Appendix 2.
With respect to the strength of legislative oversight, there is a very wide range of scores across countries – see the table in Appendix 3. However, as illustrated in Table 2 below, there is very little regional variation.
criteria measured by objective governance indicators using public data sources. To participate in OGP, countries must score at least 75% of the total possible points available to them. For more details see http://www.opengovpartnership.org/how-‐it-‐works/how-‐join#sthash.mGxgJgnt.dpuf

13
Table 2: 2015 Open Budget Survey Scores for Strength of Legislative Oversight by Region
Average for Africa 52 (range 33-85) Average for Europe 54 (range 17-94) Average for Asia Average for Americas
55 (36-82) 67 (range 30-85)
Average for All OGP countries
58 (17-94)
Regarding oversight:
• 19 OGP countries (40%) do not have a specialized budget research office attached to the legislature.
• 22 OGP countries (47%) have a weak or no quality assurance system for their audits.
3. What fiscal transparency commitments did countries make in their OGP National Action Plans?
Most of the OGP country commitments fall within GIFT High Level Principle 3 (HLP 3), which states: ‘The public should be presented with high quality financial and non-‐financial information on past, present, and forecast fiscal activities, performance, fiscal risks, and public assets and liabilities….’ This is not surprising, as HLP 3 has broad coverage, and addresses the availability of fiscal information to the public, an obvious area of focus given that budget transparency is a core element of the OGP, and one where there are minimum eligibility criteria for entry to OGP.
Within HLP 3, the focus of OGP country commitments is on annual flows (revenues and expenditures) rather than stocks (assets and liabilities).
There is relatively little coverage in the OGP commitments in the areas of legislative oversight of fiscal policy (HLP 8); on aggregate fiscal policy (so-‐called ‘macro-‐fiscal policy’, HLP 2); and on a citizen right to fiscal information (HLP 1).
Interestingly, there are a large number of country commitments in the area of direct public participation in fiscal policy (HLP 10). Some of the more innovative and ambitious commitments are referred to on pages 26-‐29 of this report. They include commitments to the multi-‐stakeholder Extractive Industries Transparency Initiative in around a dozen countries; to promote participatory budgeting (Finland) to improve public consultation over the budget cycle (Peru); to engage citizens in monitoring public procurement (Honduras); to introduce an interactive geo-‐referencing platform to allow citizens to track public spending (Mexico); and to engage citizens in public audits (the Philippines).
For more detail on the fiscal transparency commitments in OGP National Action Plans see Section 3 of the GIFT background paper prepared for the first meeting of the FOWG in

14
London on 2 November 2013, which described the pattern of OGP country commitments against the GIFT High Level Principles: http://fiscaltransparency.net/2013/11/ogp-‐gift-‐fowg-‐background-‐paper/
4. How well have OGP countries implemented their commitments, based on the findings in the Independent Monitoring Reports?
a. Implementation of All the Commitments in Action Plans
This analysis has been completed by GIFT based on information in the first 51 Independent Progress Reports on the implementation of OGP Action Plans, produced under the OGP’s Independent Monitoring Mechanism – see http://www.opengovpartnership.org/independent-‐reporting-‐mechanism
These are the primary source of data used in this section of the paper. They have been used to compile spreadsheets recording the implementation of commitments by country, by OGP region, and by OGP cohort. In addition, there is a paper prepared by Joseph Foti (IRM program manager) of the OGP Support Unit that analyses the record of implementation of all the commitments based on the first 43 IRM reports.12 Foti’s paper compares implementation – in terms both of the process of implementation and the substantive content of commitments – across cohort 1 and cohort 2 countries, and presents data at the aggregate level across all OGP countries and across all commitments.13 Foti does not do cross-‐country comparisons. The main findings in Foti’s paper are set out in Box 1. Foti also assessed the level of country compliance with the OGP’s consultation requirements, from the first 41 IRM reports. Three quarters of the second cohort of 35 countries held in-‐person consultations with civil society, and four-‐fifths completed a detailed self-‐assessment on time. However, fewer than half of OGP members met the letter of the OGP requirements for consultation in development and implementation of their Action Plans. More than half of all these member countries thus risked being found in breach of their OGP commitments. An important point to note is that the definition of a commitment varies widely both within and across Action Plans. Some commitments are narrow and modest or vague, while others are large, specific and multifaceted. Most are described as commitments, but some are labelled in Action Plans as milestones, or activities.
12 ‘OGP By The Numbers: What the IRM Data Tell Us About OGP Results.’ IRM Technical Paper1, Joseph Foti. http://www.opengovpartnership.org/sites/default/files/attachments/Technical%20paper%201_final.pdf 13 Cohort 1 countries are the 8 founding OGP countries: Brazil, Indonesia, Mexico, Norway, the Philippines, South Africa, United Kingdom, and the United States.

15
Box 1: Lessons drawn by Foti from IRM reports on two years of action plans Foti’s paper is based on the findings of 43 OGP Action Plans, including 8 from the founding cohort of countries and 35 from the second large cohort.
• There were 200 ‘starred commitments’—impactful, clearly relevant, substantially completed commitments. This was around 25% of all commitments.
• More ambitious Action Plans were not necessarily implemented less often – a number of countries with higher potential impact Action Plans also had higher rates of completion of commitments. A next step for the OGP community will be to learn from countries with high levels of both potential impact and implementation.
• Cohort 2 countries had considerably weaker rates of implementation of commitments than cohort 1 countries.
• IRM progress reports show wide variation in institutional ownership and the degree of consultation with civil society.
• At this time it is inconclusive which institutional arrangements in-‐country are more conducive to successful development and implementation of an OGP Action Plan.
• It is too early to tell if OGP has had a measurable impact on opening government in participating countries. Further research is needed to measure ultimate outcomes and impacts. The research agenda using IRM OGP data can help build a better evidence base for open government, guide OGP priorities, and signal success stories, some of which might be transferrable to other national contexts.
For example, Croatia’s Action Plan contains only 9 commitments, considerably less than the average number of commitments. However, the first commitment in the Croatia Action Plan covers four discrete and significant elements: publication of the budget proposal, of monthly budget reports, of a semi-‐annual report, and of an annual budget report. Some other commitments in the Croatia Action Plan contain similarly substantive sub-‐components. For that reason, the number of Croatia’s commitments has been assessed for this report as 33 (the number of discrete sub-‐commitments). Similarly, the Ghana Action Plan has 13 commitments but 48 discrete sub-‐commitments, and the latter number has been used as the number of commitments in this report. In contrast to this, many commitments were vaguely worded, with the result that it was difficult for the IRM researchers to assess whether any progress had been made let alone the extent of progress. The outstanding example of this was the Norway Action Plan. The IRM researcher concluded that it was not possible to assess progress in implementing the Action Plan because ‘...the Norwegian Action Plan lacked clarity, a forward orientation, relevance to OGP values, and measureable indicators of progress.’14 This was the only IRM that did not produce summary statistics on the level of completion of commitments in the Action Plan. Other Action Plans with commitments that the IRM researcher concluded were too vaguely worded to assess whether there had been any progress, or the level of completion was unclear, included Korea (8 milestones out of 16 were rated as unclear), Peru (6 unclear
14 Executive Summary of Norway IRM Report, page 3.

16
commitments), Tanzania (5), the Netherlands (4), Sweden (3), Argentina (3), Azerbaijan (2), Bulgaria (2) and South Africa (2). These considerations reduce the comparability of all the data on commitments and the implementation of commitments, and should be borne in mind in interpreting the data in the rest of this section. With those qualifications in mind, data has been extracted by GIFT from the 51 IRMs that are the first IRM report for those 51 countries. As at 16 October 2015, there were 58 IRM reports on the OGP web site. The remaining 7 reports are the second IRM report for those 7 countries, and are not included in this analysis.
The data in this section is on the implementation of all the commitments in OGP National Action Plans, by country, and by OGP region. It should be noted that the rates of completion following IRM assessments are likely to rise as the IRM research period did not include the final months of implementation.
Some of the notable features of this data include: • The top ten countries, in terms of the total number of completed commitments,
were Brazil (25), Mexico (22), Denmark (17), UK (17), Moldova (16), Chile (15), USA (13), Canada (12), Montenegro and Ghana (10 each).
• The top ten countries, in terms of the percentage of their commitments that were either completed or substantially completed, were Brazil (91%), Latvia (88%), Indonesia (83%), Uruguay (83%), Chile (79%), Croatia (78%), Mexico (76%), El Salvador (71%), Spain (69%), and USA (69%).
• The weakest 10 performers, in terms of the number of commitments rated ‘not started’, were Ghana (17), Moldova (13), Macedonia (10), Peru (10), Montenegro (8), Romania (8), Paraguay (7), Italy (5), Kenya (5), and Tanzania (5).
• The countries with the largest number of commitments rated as of potentially moderate or transformative impact were Peru (38), Ghana (31), Moldova (31), Montenegro (28), Azerbaijan (20), Albania (19), Slovak Republic (18), Bulgaria (17), Dominican Republic (17), and Tanzania (16).
Data by OGP region is as follows:
• Average total number of commitments: Africa 22; Americas 23; Asia 21; Europe 22. • Percentage of commitments completed or substantially completed: Africa 32%;
Americas 53%; Asia 53%; Europe 46%.
b. Implementation of only the Fiscal Transparency Commitments in Action Plans
In this section data will be presented on the record of implementing just the fiscal transparency commitments in OGP Action Plans.
17
This data has been extracted by GIFT specifically for this report. The source is information and data in the Executive Summary of each of the 51 Independent Progress Reports on the OGP web site as 16 October 2015.15
Again it should be noted that the rates of completion following IRM assessments are likely to rise as the IRM research period did not include the final months of implementation.
The definition of a fiscal transparency commitment used for this exercise was any commitment that dealt with any aspect of government revenues, expenditures, financial or non-‐financial assets or liabilities, and including any activities that involve public participation in policy development or implementation in these areas. In addition, commitments relating to increasing the transparency, participation or accountability of public service delivery were also coded as fiscal transparency commitments. Commitments that were clearly not fiscal transparency-‐related are those on government regulation, or political parties or elections, or corporate governance, or the judiciary.
This definition left a number of activities at the margin that were handled as follows:
• Commitments that refer generally to freedom of information, or open data, or public participation, without any specific reference to fiscal activities, were not coded as FT commitments.
• All commitments referring to anti-‐corruption activities were coded as FT commitments, reflecting a view that public finances are often at the core of corruption – but this treatment is somewhat arbitrary and could be revisited.
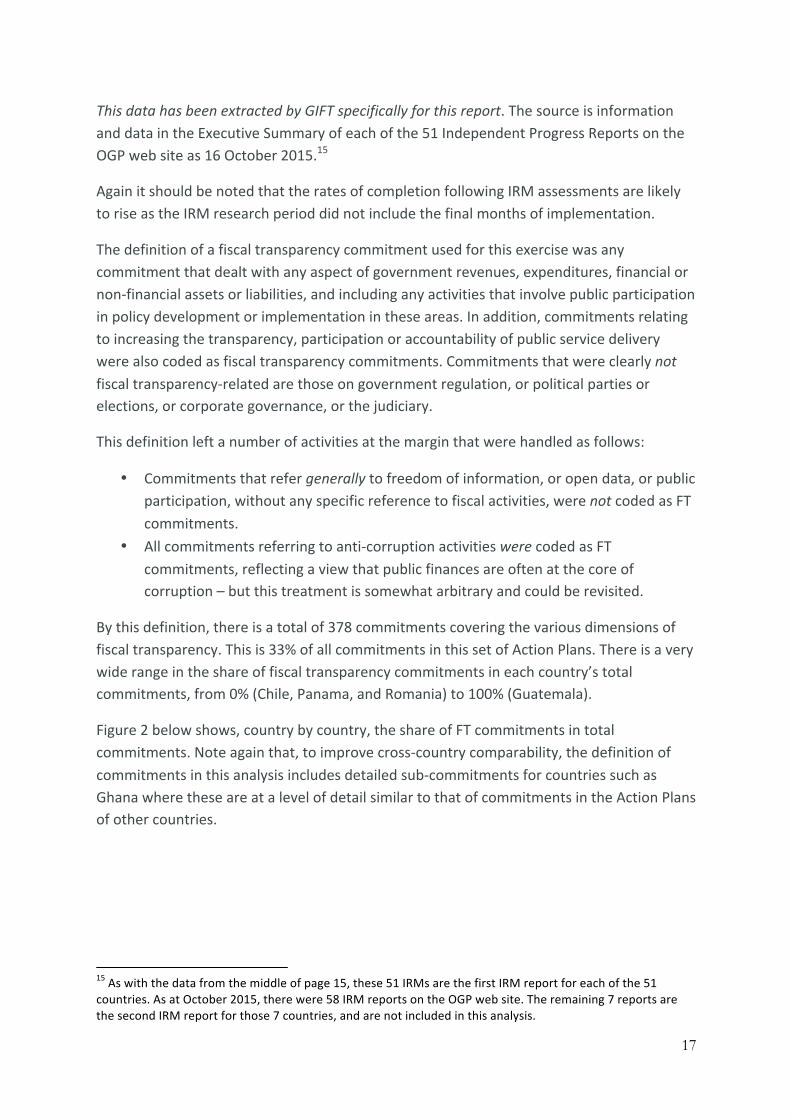
By this definition, there is a total of 378 commitments covering the various dimensions of fiscal transparency. This is 33% of all commitments in this set of Action Plans. There is a very wide range in the share of fiscal transparency commitments in each country’s total commitments, from 0% (Chile, Panama, and Romania) to 100% (Guatemala).
Figure 2 below shows, country by country, the share of FT commitments in total commitments. Note again that, to improve cross-‐country comparability, the definition of commitments in this analysis includes detailed sub-‐commitments for countries such as Ghana where these are at a level of detail similar to that of commitments in the Action Plans of other countries.
15 As with the data from the middle of page 15, these 51 IRMs are the first IRM report for each of the 51 countries. As at October 2015, there were 58 IRM reports on the OGP web site. The remaining 7 reports are the second IRM report for those 7 countries, and are not included in this analysis.

18
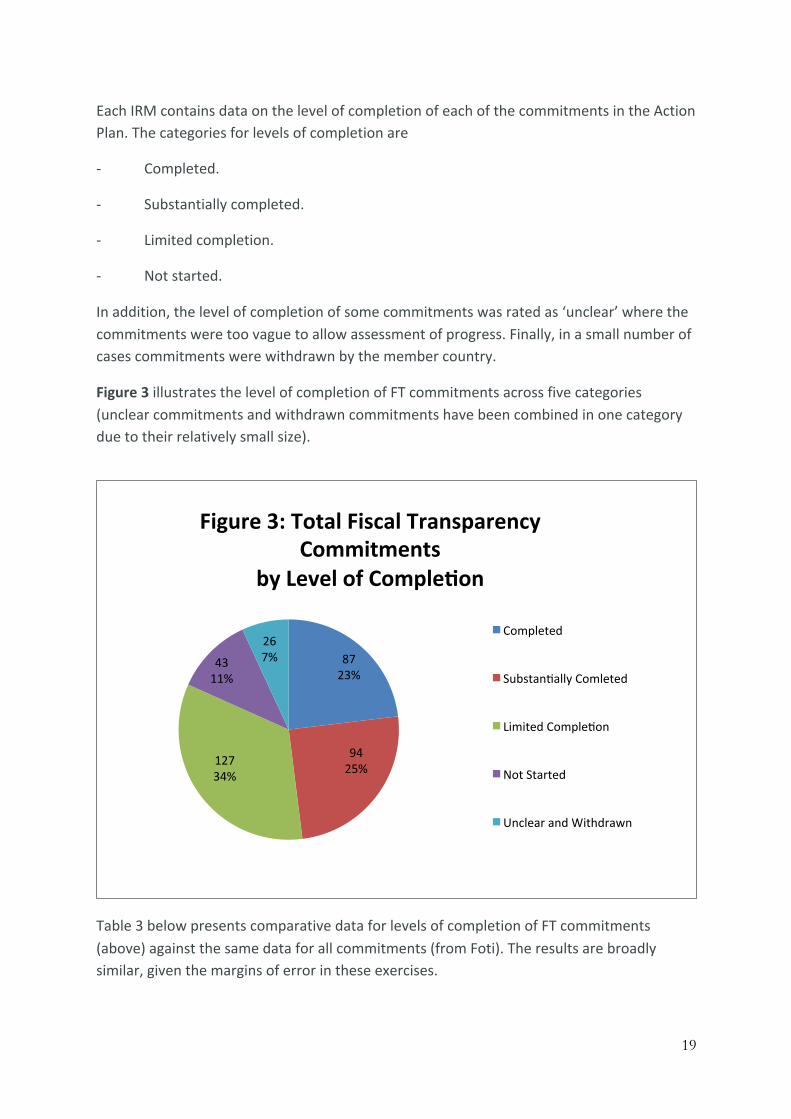
19
Each IRM contains data on the level of completion of each of the commitments in the Action Plan. The categories for levels of completion are
-‐ Completed.
-‐ Substantially completed.
-‐ Limited completion.
-‐ Not started.
In addition, the level of completion of some commitments was rated as ‘unclear’ where the commitments were too vague to allow assessment of progress. Finally, in a small number of cases commitments were withdrawn by the member country.
Figure 3 illustrates the level of completion of FT commitments across five categories (unclear commitments and withdrawn commitments have been combined in one category due to their relatively small size).
Table 3 below presents comparative data for levels of completion of FT commitments (above) against the same data for all commitments (from Foti). The results are broadly similar, given the margins of error in these exercises.
87 23%
94 25% 127
34%
43 11%
26 7%
Figure 3: Total Fiscal Transparency Commitments
by Level of CompleUon
Completed
Substankally Comleted
Limited Complekon
Not Started
Unclear and Withdrawn

20
Table 3: Comparative data on levels of completion of all commitments compared to completion of fiscal transparency commitments only16
Limited
Completion Substantial Completion
Completed Not started
Unclear Withdrawn Total
All commitments
293 31%
201 21%
284 28%
110 12%
35 4%
25 3%
948
Fiscal transparency commitments
127 34%
94 25%
87 23%
43 11%
22 6%
4 1%
378
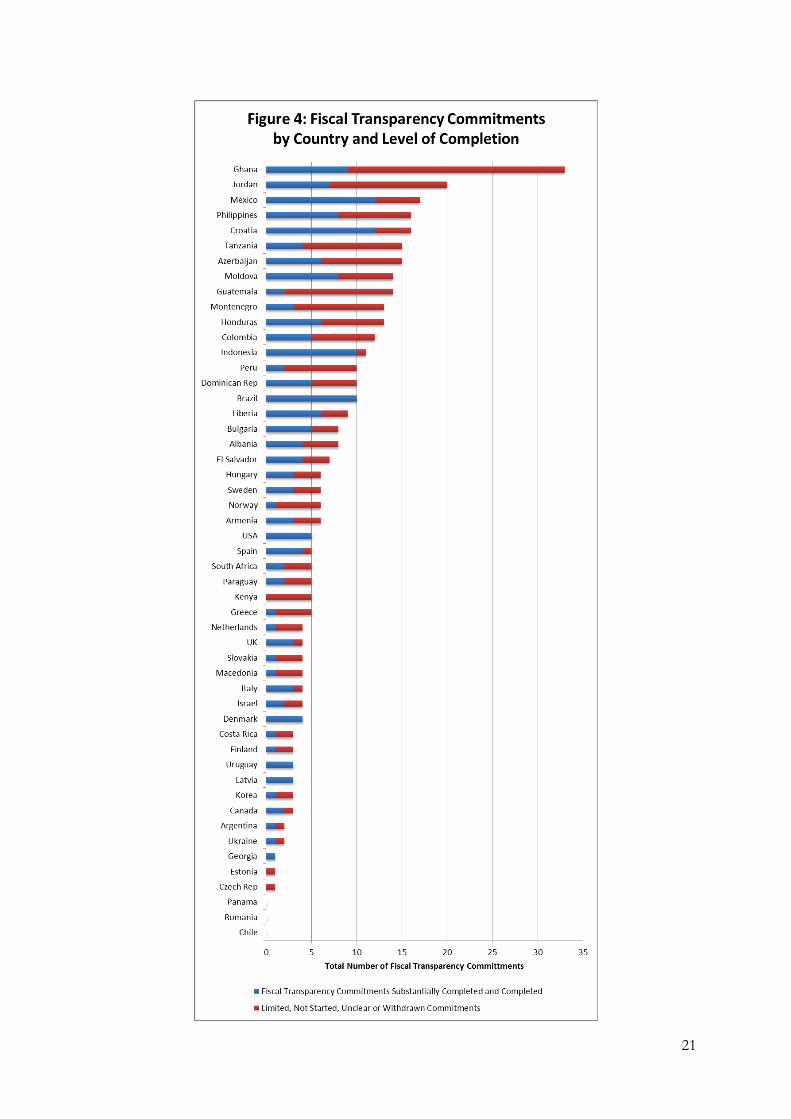
Turning to levels of completion at the country level, Figure 4 presents the data extracted by GIFT from the 51 IRM reports. Two degrees of completion are shown:
• Completed commitments and substantially completed commitments as one category; and
• Commitments assessed as limited completion, not started, unclear, or withdrawn as a second category.
16 Data for all commitments are from the first 41 IRM reports, whereas data on fiscal transparency commitments are from the first 51 IRM reports, so the data are not fully comparable.
21

22
The following points can be seen from Figure 4:
• The weightiest FT reforms are found in those countries with both a significant number of FT commitments and a high rate of implementation. Of those countries with more than 5 FT commitments, notable progress was made by:
o Croatia – 12 out of 16 FT commitments completed or substantially completed.
o Mexico – 12 out of 17 FT commitments completed or substantially completed.
o Brazil – 10 out of 10 FT commitments completed or substantially completed.
o Indonesia – 10 out of 11 FT commitments completed or substantially completed.
o Moldova – 8 out of 14 FT commitments completed or substantially completed.
o The Philippines – 8 out of 16 FT commitments completed or substantially completed.
• A small number of countries achieved over 90% completion or substantial completion of their FT commitments, including Indonesia, Denmark, Georgia, Latvia, Brazil, Honduras, Uruguay and the USA.
5. What is the degree of ambition in the FT commitments across countries?
The OGP has defined an ambitious commitment as ‘one that, once completed, will show a demonstrable advancement from action plan to action plan in the grand challenge areas proposed by OGP through openness, transparency, civic participation and accountability….In the context of civil society engagement, ambition is defined as an improvement in the quality and range of interactions, as well as in the diversity of CSO participants involved in dialogue with government.’17
For the second cohort of countries the IRM framework added the category of ‘starred commitments’ in order to highlight the major accomplishments of each country. The definition of a star commitment combines three elements: clear relevance to OGP goals; assessed to be moderate to high impact; and substantially completed or completed. This combines both ex ante elements and ex post elements. It is more a measure of the impact of a commitment on OGP goals, and is a very useful measure. An additional measure, of ex ante (forward-‐looking) ambition, which does not include the level of implementation of the commitment, is also useful for some purposes.
From an FT perspective, some commitments would be regarded as technically or politically ambitious that have not been rated as a star commitment by IRM researchers e.g. a reform of the GFMIS, the introduction of a Treasury Single Account or of program budgeting, the
17 Update to the Steering Committee: Criteria and Standards Subcommittee Recommendations on Ambition and the Biannual Calendar, July 2013, p.2.

23
introduction of an internal audit function across government, or the promotion of participatory budgeting. While some of these may look like they are internal to government, experience has shown that they are critically important to improving the quality of fiscal data and information that can be published.
In addition, some reforms have been assessed as low impact by the IRM researcher, but are significant from an FT perspective e.g. the publication of the executive’s budget proposal in Israel, which the IRM report indicated had only been available under request using freedom of information laws prior to 2012. According to the IRM researcher, the public availability of the budget resulted in a higher quality debate in the legislature, which is a step towards more effective legislative and public oversight of fiscal policy.
Nevertheless, the number of commitments rated as star commitments in the IRM reports is an important indication of the relevance and potential impact of commitments – ex ante ambition – as well as the extent to which those commitments have actually been implemented.
Table 4 below shows the number of FT star commitments by country, and the total star commitments relating to fiscal transparency.
There are 74 star commitments relating to FT, comprising 20% of all FT commitments. This is a little less than the share of star commitments in total commitments (FT and non-‐FT), which is around 25%.
At the country level, Table 4 shows that the stand-‐out performer on FT star commitments is Croatia.
Honduras, Moldova, Colombia and the Dominican Republic comprise a second group of countries with an impressive number of star commitments.
At the other end of the spectrum, three countries in this sample made no FT commitments at all – Romania, Panama, and Chile.
It is interesting that Macedonia, which fell back by 19 points on the OBI scale in the period to 2015, included 4 FT commitments in its Action Plan – including a star commitment (introduce a citizen portal for feedback on public services), and a commitment to improve the transparency of public procurement.
It is potentially useful to plot the level of completion and the level of ambition of FT commitments by country, in a 2 x 2 table. The level of completion is drawn from the assessment of each commitment in the IRM reports. The level of ambition is assessed mainly by looking at the total number of FT commitments, and the number of those that are star commitments. Because the star commitment rating was not introduced until after the

24
Table 4: Number of FT Commitments in Action Plans rated as Star Commitments
Country Number of FT Commitments rated as OGP Star Commitment
Croatia 11 Honduras 6 Moldova 6 Colombia Dominican Republic
5 5
Ghana18 Jordan
4 4
Bulgaria 3 Italy 3 Tanzania 3 Denmark 2 Latvia 2 Uruguay 2 Liberia Others*
2 16
Total 74 Star commitments as % of total FT commitments
20
*Countries with one FT commitment rated as a star commitment were: Albania, Azerbaijan, Canada, Costa Rica, El Salvador, Georgia, Greece, Guatemala, Korea, Macedonia, Montenegro, the Netherlands, Paraguay, Peru, Spain, and Ukraine.
IRM reports for the cohort 1 countries had been completed, some assessment was also made by GIFT of the level of ambition in the cohort 1 Action Plans. At this stage, data in each IRM on whether each commitment is relevant to OGP has not been incorporated in this analysis due to time constraints, although this could be done for a future iteration. A further caveat is that it has not been possible to assess the extent to which fiscal transparency commitments were pre-‐existing activities or existing government policies, prior to development of the OGP Action Plan. To the extent that a commitment was pre-‐existing it is less plausible to consider it to be ambitious.
With these limitations in mind, the result is shown in Table 5, which presents countries broadly by level of implementation and level of ambition of Table 5.
It should be stressed that Table 5 is highly stylized and qualitative, and is meant to be broadly illustrative of patterns across countries. It is not intended to be a definitive ranking. For instance, the clusters of countries within a quadrant are listed alphabetically. However, the different positioning of clusters within each quadrant, and the four quadrants
18 See footnote 3 for an explanation of the assessment of 4 star commitments for Ghana.

25
Table 5: Country Implementation of Fiscal Transparency Commitments by Level of Ambition: A Stylized Qualitative Approach
High Implementation
Denmark Italy Latvia Spain UK Uruguay USA
Brazil Croatia
Indonesia Mexico
Moldova Philippines
Albania Azerbaijan Bulgaria Colombia Dominican Republic El Salvador Ghana Honduras Jordan Liberia
Low Implementation
Canada Costa Rica Finland Israel South Korea Sweden Argentina Georgia Greece Ukraine Macedonia Netherlands Paraguay Slovakia S. Africa Czech Rep. Estonia Norway Chile Panama Romania
Armenia Hungary Guatemala Montenegro Tanzania Peru Kenya
Low Ambition High Ambition Note: the clusters of countries within a quadrant are listed alphabetically. However, the different positioning
of clusters within each quadrant, and the four quadrants themselves, are intended to indicate a broad difference in relative performance as assessed by the IRM mechanism.

26
themselves, are intended to indicate a broad substantive difference in relative performance as assessed by the IRM mechanism.
Some features of OGP FT reforms from Table 5 are:
`• There is an impressive number of countries (16) exhibiting both high ambition and high implementation.
• There are six stand-‐out countries in this respect: Brazil, Croatia, Indonesia, Mexico, Moldova, and the Philippines. Four of these six are from the eight cohort 1 countries, and only two (Croatia and Moldova) are from the much larger cohort 2.
• There are a few countries who launched ambitious FT reforms and which, while most achieved some degree of completion, this was relatively low.
• Unusually in a discussion of cross-‐country performance, there is something of a ‘Nordic race to the bottom’ with both Norway and Sweden exhibiting low ambition and low completion. All of Sweden’s six commitments were in the area of transparency of development assistance, while, as noted in section 4a, the IRM report on Norway states that it was not possible to assess progress in implementing the Action Plan because ‘...the Norwegian Action Plan lacked clarity, a forward orientation, relevance to OGP values, and measureable indicators of progress.’
It is interesting also to consider some notable individual FT commitments in Action Plans (not all of these have been implemented):
• Extend implementation of the GFMIS in Liberia beyond the pilot phase; in the Philippines, pilot a new GFMIS in national government, and roll it out fully by 2016; and extend the national GFMIS to municipal level governments in Dominican Republic and Honduras.
• Tanzania: publication of allocations of grants to local governments; and publication of quarterly tax exemption reports (this latter proved to be too ambitious).
• Ghana: consult on, pass, and raise public awareness of a Fiscal Responsibility Act; prepare guidelines for deepening CSO participation in planning and budgetary processes; produce a single unified chart of accounts and budget classification across all local governments that is compliant with IMF standards.
• A number of countries included commitments to prepare for, or join, or implement, or strengthen their participation in EITI e.g. Azerbaijan, Colombia, Ghana, Guatemala, Indonesia, Jordan, Mexico, Peru, Ukraine, and USA.
• In this respect Liberia committed to popularize its 4th EITI report (which also covers forestry) through community town hall meetings, radio and newspapers.
• Commitments to strengthen procurement are in many Action Plans; those for which the IRMs reported reasonable implementation progress include Brazil, Croatia, Georgia, Hungary, Indonesia, Mexico, Moldova, Paraguay, Philippines, and Uruguay.
27
• Dominican Republic: introduce a Treasury Single Account. • Mexico: publish the PEMEX contract database. • In El Salvador, the government attributed an increase in the country’s OBI score to
the additional information published on the tax transparency portal (an Action Plan commitment).
• Greece: publish taxpayers in arrears (very high levels of visits reported to the web site).
• The Philippines: the second Action Plan included a commitment to engage citizens in public audits.
• Azerbaijan: broad commitments to strengthen the laws on state financial control, the laws on state financial accountability, and to publish SOE financial statements and budgets.
• Bulgaria: draft a new Public Finance Law. • Indonesia: publish local service delivery-‐level budgets in health and education. • Armenia: implement a new internal audit system, based on international standards,
in all central government entities, town communities and commercial and non-‐commercial organisations; and introduce program budgeting.
• Israel: publication of the executive’s budget proposal for the first time. • Finland: promote participatory budgeting at the central government and
municipality levels, search for pilot municipality and pilot government agency, and evaluate the possibility of including provisions in the Local Government Act.
• Costa Rica: strengthen the National System of Service Audits through a promotional campaign on its functions and the channels for citizen complaints and suggestions.
• The Netherlands: publication of budgets in open data format is being implemented by other ministries, adopting the best practices first implemented by the Ministry of Finance.
• Transparency of external assistance from the donor side, including conforming to the IATI standard, in Canada, Denmark, Spain, Sweden, the UK and the US.
Finally, with respect to the degree of ambition of Action Plans commitments, it is not possible to discern, from the IRM reports, what the ‘OGP-‐effect’ is. Many commitments were pre-‐existing government policy or reforms, and the IRM report concluded it was not possible to ascertain the extent to which the OGP commitment represented an increase in ambition or scope. Some large multi-‐year FT reforms were already underway, in countries such as the Philippines and Brazil, while in other cases different stimuli, such as EU accession, may have been the driving force for FT reforms e.g. Croatia. Evaluating the impact of the OGP will require specific impact analysis.

28
6. What are some of the cutting edge and innovative commitments and consultation practices in Action Plans?
In terms of the substance of commitments, examples of innovations, both in first and second Action Plans include:19
• Kenya: an outcomes-‐based commitment to increase the country’s score on the Open Budget Index.
• Liberia: develop an interactive platform to gather citizens’ feedback on national development outcomes; develop a platform that provides regular budget updates to all citizens via SMS and associated technologies through various local languages; and provide periodic support to rural radio stations to broadcast the messages of the Open Budget Initiative.
• Honduras: update and disseminate the PEFA assessment; and create a portal on the Secretariat of Finance’s web-‐site devoted to fiscal education (to complement the Citizens’ Budget).
• Peru: develop improved mechanisms for structured public consultations over budget preparation, approval, implementation and reporting.
• Dominican Republic: publish data on public complaints at the level of individual government agencies; and introduce a balanced scorecard of performance indicators on implementation of the President’s National Development Strategy.
• El Salvador: in its second Action Plan included a commitment to ensuring that private companies managing public funds openly share their data in line with the law on Access to Public Information.
• Guatemala: in its second Action Plan is implementing Open Budgeting in all web portals for the general population to learn about and have access to information published by MOF.
• Honduras: in its second Action Plan is improving the quality of planning and budgetary control on the implementation of the Annual Plans on Procurement and Contracting and opening up citizen participation in the monitoring of public procurement processes.
• Mexico: in its second Action Plan is building a public, open and interactive geo-‐referencing platform that allows citizens to track public resource allocation as well as the results of federal spending and public works.
• Paraguay: is building capacity among citizens to monitor public sector budget management by explaining the general budget proposal in plain and accessible language and creating citizen access to budget information on indigenous beneficiaries and investment made.
19 Information on commitments in second Action Plans has been drawn from ‘What’s in the New OGP National Action Plans?’: An Overview of Commitments from 35 OGP Countries.’ http://www.opengovpartnership.org/sites/default/files/OGP-‐Whats-‐in-‐the-‐New-‐OGP-‐NAPs-‐report-‐web.pdf

29
• Macedonia: create a portal for citizen feedback on public services. • The Philippines: institutionalise social audits; create a People’s Budget interactive
web site. • The UK: spend up to 5% of ODA budget support on strengthening local accountability
to support progress for related OGP goals; and include the OGP eligibility criteria and related datasets in assessment processes to determine readiness of partner governments for UK budget support.
Innovations in consultation practices or in accountability arrangements for the design and implementation of the Action Plan itself include:
• Tanzania: awareness of OGP in the country was raised through television programs, radio, and to a lesser extent, newspapers.
• Kenya: government set up web and mobile phone-‐based channels for citizens. The implementation status of OGP commitments is shared through an OGP-‐CSO Listserve.
• Mexico: the IRM report describes a unique three-‐part governing system, a tri-‐partite commission (the STT) heads up OGP efforts. The Commission is led by the Ministry of Public Administration, the Federal Institute for Access to Information and Data Protection, and a coalition of CSOs. The IRM report also states that the Mexico Action Plan is unique in that it went through two phases, an initial Action Plan submitted in September 2011 lacked significant civil society participation. A second ‘expanded’ plan was made in close collaboration with civil society and released in early 2012.
• Chile: A Citizens’ Defence and Transparency Commission is in charge of coordinating OGP with government institutions.
• Peru: set up a multi-‐sector Commission responsible for monitoring implementation of the Action Plan that includes central government officials, representatives of the judiciary, private sector, and civil society.
• Honduras: for its second Action Plan formed an Interagency Committee of OGP that raised awareness, consulted and disseminated materials, using social media, an official OGP web site, events targeting different audiences, and awareness-‐raising activities in public parks. As a result 1,072 stakeholders, including non-‐state actors, provided inputs to the final Action Plan.
• The Netherlands: the government created an ‘Inspiration Team’ of civil society, local governments, and private sector stakeholders to guide the implementation process, and established a separate Expertise Centre to assist public professionals in implementing open government policies.
• Slovakia: the IRM report says that the Action Plan is a legally binding document, ensuring that responsible institutions take actions or explain the lack of action.

30
• The UK: in its second Action Plan, lists for each commitment the supporting CSOs that are working with government on the commitment, as well as a detailed timescale for most commitments.
Finally, in one or two cases the IRM researcher recommended engagement with CSOs that have experience working on fiscal policy issues. This was the case in Azerbaijan, which has 15 commitments relating to FT in in Action Plan, a number of which are quite ambitious.
7. What steps to increase fiscal transparency should OGP countries consider taking in their National Action Plans?
The four OGP members that do not meet the minimum fiscal transparency requirements for OGP membership should give priority to publishing the Audit Report or publishing it within the specified minimum time. Similarly, the OGP member that prepares but does publish a Year-‐end Report should do so.
OGP members that have gone backwards on fiscal transparency in recent years, such as Honduras and the Slovak Republic, should give priority to decisively reversing this trend.
Many OGP countries could achieve rapid increases in fiscal transparency just by publishing documents already produced for use within government. Specifically, drawing on data provided by the IBP from the 2015 Open Budget Survey for 45 OGP member countries, budget reports that were produced for ‘internal use’ but not published were as follows:
a. Pre-‐Budget Statement: 4 OGP countries produced for internal use only (Chile, Dominican Republic, Indonesia, and Sierra Leone).
b. Mid-‐Year Review: 4 countries produced for internal use only (Kenya, Macedonia, Sierra Leone, and Trinidad and Tobago).
c. Year-‐End Report: 1 country produced for internal use only (Albania). d. Audit Report: 1 country produced for internal use only (Liberia).
A number of OGP counties also publish documents but do so too late for them to be considered ‘publicly available’ according to OBS standards of timeliness. From the 2015 OBS, 4 countries published the Pre-‐Budget Statement too late, 2 countries published a Citizens’ Budget too late, 1 country published its Mid-‐Year Review too late, and 1 country published its Audit Report too late.
In addition, there may be cases in which the information is not produced at all currently, but would not involve significant technical capacity or resources to produce, such as publication of a Citizen’s Budget. Based on data from the 2015 OBS, twelve OGP member countries do not currently produce a Citizen’s Budget.
Further, in 21 OGP member countries the IBP recommended, on the basis of the 2015 OBI, that the government should produce and publish a Mid-‐Year Review. This is a report
31
presented to the legislature, and published, that takes stock of how the annual budget has been implemented over the first 6 months of the budget year, discusses the implications, and presents a revised forecast outturn for the full year. This is an important element of transparency and accountability, and the required information will generally already be available within the government even if it is not currently compiled into a single report.
With respect to public participation, countries should give early priority to creating more opportunities for public participation in the design and implementation of fiscal policies over the budget and policy cycles. In this they should have regard to the principles of public participation in fiscal policy that are being developed by GIFT, and to GIFT’s body of work on country practices in public participation in fiscal policy.20
Drawing on the Open Government Guide developed by the Transparency and Accountability Initiative,21and consistent with the GIFT High Level Principles of Fiscal Transparency, other areas for high value early actions on budget transparency include:
• Strengthening legislative oversight of fiscal policy, for instance through establishing an independent research office to advise the legislature on budget issues.
• Strengthening external audit by the Supreme Audit Institution, by increasing its independence from the executive and ensuring it is adequately resourced.
• Develop a citizen audit request system, introduce social audit mechanisms, and consult the public more during budget preparation.
There may also be some opportunities for quick wins in the area of increasing public participation in fiscal policy. For instance, in many countries legislative committees do not hold public hearings on the individual budgets of ministries and agencies in which testimony from the executive branch is heard; or they do so with respect to only some ministries.
Countries should pay more attention to the specification of commitments in their Action Plans, using SMART criteria. The Philippines first Action Plan provides a good example of including specific timelines in commitments (see for instance commitments 11, 13, 14, 15 and 16). The UK’s second Action Plan contains detailed timescales for a number of commitments.
The description of commitments needs to demonstrate clearly how each commitment will advance open government as opposed to good government. Related commitments should be grouped together in logically sequenced steps with timelines. Countries should consider framing commitments in terms of outcomes rather than intermediate processes.
20 See materials on public participation in fiscal policy, including principles, and country case studies, at http://www.fiscaltransparency.net/use-‐blog/ 21 See http://www.opengovguide.com/topics/budgets/

32
Countries should focus on the quality of disclosed information, and the form in which it is disclosed, in addition to expanding the range of information and reports that are made public.
A clearer distinction needs to be drawn between e-‐government and open government. And more generally, between good government and open government.
Each country should designate a lead agency responsible for the implementation of each commitment, and desirably also the name of the responsible official, and indicate which specific CSOs are taking the lead on the civil society side.
Countries need to follow the OGP process requirements for public consultation much more closely in the design and implementation of their Action Plans than was the case generally – with notable exceptions such as Mexico – for cohort 1 (with respect to their first Action Plans) and cohort 2 members. They should also go beyond traditional civil society consultation models towards institutionalising systematic, on-‐going and meaningful dialogue with non-‐government actors and the public.
GIFT stands ready to assist countries with the design and implementation of their fiscal transparency commitments. The OGP-‐Fiscal Openness Working Group, which is coordinated by GIFT, supports the implementation of budget and fiscal transparency commitments by providing a platform for peer to peer sharing and learning; offering access to international good practices, tools, norms, and technical expertise on fiscal openness; supporting OGP members to develop more ambitious fiscal openness goals and commitments; and motivating additional governments to join OGP. For instance, GIFT’s work on public participation in fiscal policy – country case studies, the development of draft principles and good practices on how governments, legislatures, and SAIs should engage the public on fiscal policy design and implementation, and the development of instruments to measure public participation – may be helpful to any actors wishing to extend and strengthen public participation in their country.
33
Appendix 1: OGP Member Countries by OGP Cohort
As at October 2015 there were 66 OGP member countries, who have joined in four cohorts:
Cohort 1: joined September 2011 Cohort 2: joined April 2012 Cohort 3: joined April 2013 Cohort 4: joined April 2014 or after
Cohort 1 n=8 Cohort 2 n=39 Cohort 3 n=7 Cohort 4 n=12 Brazil Indonesia Mexico Norway Philippines South Africa United Kingdom United States
Albania Armenia Azerbaijan Bulgaria Canada Chile Colombia Croatia Czech Republic Denmark Dominican Republic El Salvador Estonia Georgia Greece Guatemala Honduras Israel Italy Jordan Kenya Latvia Lithuania Macedonia Malta Moldova Montenegro Netherlands Paraguay Peru Romania Slovak Republic South Korea Spain Sweden Tanzania Turkey Ukraine Uruguay
Argentina Costa Rica Finland Ghana Hungary Liberia Panama
Australia Bosnia and Herzegovina Cabo Verde France Ireland Malawi Mongolia New Zealand Serbia Sierra Leone Trinidad and Tobago Tunisia

34
Appendix 2: Open Budget Index Scores and Public Participation Scores of OGP Member Countries
Country 2006 OBI
2008 OBI
2010 OBI
2012 OBI
2015 OBI
Absolute Change in OBI Score
2012-2015
Negative in (red)
Absolute Change in OBI Score
2006-2015
Negative in (red)
2015 Public Participation Score
OGP Region: Europe Albania 25 37 33 47 38 (9) 13 15 Armenia - - - - - - - - Bosnia & Herzegovina - 44 44 50 43 (7) (1) 23
Bulgaria 47 57 56 65 65 0 18 38 Croatia 42 59 57 61 53 (8) 11 38 Czech Republic 61 62 62 75 69 (6) 8 42 Denmark - - - - - - - - Estonia - - - - - - - - Finland - - - - - - - - France 89 87 87 83 76 (7) (13) 40 Georgia 34 53 55 55 66 11 32 46 Greece - - - - - - - - Hungary - - - - 49 - - 31 Ireland - - - - - - - - Israel - - - - - - - - Italy - - 58 60 73 13 15 35 Latvia - - - - - - - - Lithuania - - - - - - - - Macedonia - 54 49 35 35 0 (19) 6 Malta - - - - - - - - Moldova - - - - - - - - Montenegro - - - - - - - - Netherlands - - - - - - - - Norway 72 80 83 83 84 1 12 75 Romania 66 62 59 47 75 28 9 42 Serbia - 46 54 39 47 8 1 21 Slovak Republic - - 57 67 57 (10) 0 25 Spain - - 63 63 58 (5) (5) 17 Sweden 76 78 83 84 87 3 11 48 Tunisia - - - 11 42 31 31 21 Turkey 42 43 57 50 44 (6) 2 21 Ukraine - 55 62 54 46 (8) (9) 23 United Kingdom 88 88 87 88 75 (13) (13) 58
OGP Region: Asia Pacific
Australia - - - - - - - - Azerbaijan 30 37 43 42 51 9 21 19

35
Country 2006 OBI
2008 OBI
2010 OBI
2012 OBI
2015 OBI
Absolute Change in OBI Score
2012-2015
Negative in (red)
Absolute Change in OBI Score
2006-2015
Negative in (red)
2015 Public Participation Score
Indonesia 42 54 51 62 59 (3) 17 35 Jordan 50 53 50 57 55 (2) 5 27 Mongolia 18 36 60 51 51 0 33 19 New Zealand 86 86 90 93 88 (5) 2 65 Philippines 51 48 55 48 64 16 13 67 South Korea - 66 71 75 65 (10) (1) 83
OGP Region: the Americas
Argentina 40 56 56 50 59 9 19 27 Brazil 74 74 71 73 77 4 3 71 Canada - - - - - - - - Chile - - 72 66 58 (8) (14) 23 Colombia 57 61 61 58 57 (1) 0 46 Costa Rica 45 45 47 50 54 4 9 27 Dominican Republic - 12 14 29 51 22 39 23 El Salvador 28 37 37 43 53 10 25 17 Guatemala 46 46 50 51 46 (5) 0 10 Honduras - 12 11 53 43 (10) 31 31 Mexico 50 55 52 61 66 5 16 44 Panama - - - - - - - - Paraguay - - - - - - - - Peru - 67 65 57 75 18 8 40 Trinidad and Tobago - 33 33 38 34 (4) 1 27 United States 81 82 82 79 81 2 0 69 Uruguay - - - - - - - -
OGP Region: Africa
Ghana 42 50 54 50 51 1 9 29 Kenya - - 49 49 48 (1) (1) 33 Liberia - 3 40 43 38 (5) 35 21 Malawi - 28 47 52 65 13 37 44 Sierra Leone - - - 39 52 13 13 31 South Africa 86 87 92 90 86 (4) 0 65 Tanzania - 36 45 47 46 (1) 10 33
OGP Regional Averages
Average for Africa 64 41 55 53 55 - - 37 Average for Asia 46 54 60 61 62 - - 45 Average for Europe 58 60 61 59 59 - - 33 Average for the Americas 53 48 50 54 58 - - 35
Average for All OGP countries 54 53 57 57 59 - - 36

36
Appendix 3: OBS 2015 Score for All OGP Countries on Budget Oversight by Legislature
Country 2015 Budget Oversight by Legislature Score
OGP Region: Europe Albania 49 Armenia -‐ Bosnia and Herzegovina 37 Bulgaria 39 Croatia 27 Czech Republic 82 Denmark -‐ Estonia -‐ Finland -‐ France 75 Georgia 73 Greece -‐ Hungary 58 Ireland -‐ Israel -‐ Italy 79 Latvia -‐ Lithuania -‐ Macedonia 42 Malta -‐ Moldova -‐ Montenegro -‐ Netherlands -‐ Norway 94 Romania 54 Serbia 42 Slovak Republic 33 Spain 43 Sweden 85 Tunisia 33 Turkey 17 Ukraine 79 United Kingdom 45
OGP Region: Asia Pacific Australia -‐ Azerbaijan 37 Indonesia 82 Jordan 45

37
Mongolia 70 New Zealand 45 Philippines 36 South Korea 73
OGP Region: the Americas Argentina 30 Brazil 80 Canada -‐ Chile 67 Colombia 83 Costa Rica 73 Dominican Republic 70 El Salvador 79 Guatemala 58 Honduras 70 Mexico 45 Panama -‐ Paraguay -‐ Peru 67 Trinidad and Tobago 67 United States 85 Uruguay -‐
OGP Region: Africa Ghana 54 Kenya 49 Liberia 33 Malawi 67 Sierra Leone 36 South Africa 85 Tanzania 39
OGP Regional Averages Average for all OGP countries
58 (range 17-‐94)
Average for Africa 52 (range 33-‐85) Average for Asia Pacific 55 (range 36-‐82) Average for Europe 54 (range 17-‐94) Average for the Americas 67 (range 30-‐85)

38
Glossary of key terms in budget and fiscal transparency
Fiscal policy: in everyday terms, fiscal policies are government taxation, borrowing, spending, and the investment and management of public resources. In technical terms, fiscal policies are public policies implemented through the provision of non-‐market services, and the redistribution of income and wealth, financed primarily by taxes and other compulsory levies on nongovernment sectors.
Fiscal policy covers policy design, policy implementation, and ex post review and evaluation, and incorporates all three of the commonly recognized levels of fiscal management:
1) Aggregate fiscal policy, namely the overall level of revenues, spending, the deficit and public debt.
2) Allocation of resources to sectors, to ministries, departments and agencies, and to programs, in line with policy priorities.
3) Managing the use of budgeted resources to achieve efficient delivery of public services and value for money.
Fiscal transparency is sometimes used synonymously with budget transparency. However, fiscal transparency is in principle wider than budget transparency. It includes all public assets, liabilities, and contingent obligations, as well as revenues and expenditures authorised in an annual budget i.e. it includes all stocks as well as flows, whereas stocks often do not feature in budget documents (aside from debt).
Fiscal transparency includes fiscal activities undertaken outside the budget sector but within the government sector e.g. by autonomous government agencies or extra-‐budgetary funds that may not be reported as part of the budget sector.
Fiscal transparency also includes ‘quasi-‐fiscal activities’ undertaken outside the government sector by public corporations, the central bank, or (sometimes) by private corporations i.e. activities that are fiscal in character but that are not financed by government but by the corporations themselves, such as subsidised lending or subsidised service delivery by public corporations, or construction of public infrastructure by companies developing natural resources..
Budget transparency: may refer to the narrower budget sector (e.g. ‘budgetary central government), any may not include the budgets of autonomous agencies, or extra-‐budgetary funds. The term may also refer to a wider concept e.g. the International Budget Partnership’s ‘Open Budget Survey’, which includes some questions on assets and liabilities but which focuses on 8 key reports centred around the budget. The term budget transparency is generally not used to refer to as wide a concept as fiscal transparency.
Public resource management: One of the five OGP ‘grand challenges’. May be defined to include both stocks and flows of public resources i.e. public assets and liabilities, as well as revenues and expenditures authorised in an annual budget. Alternatively, it may refer to a narrower concept, such as just the annual flows of revenues and/or expenditures in the budget.

39
Public participation in fiscal policy: Public participation refers to the variety of ways in which the general public, including citizens, civil society organizations and other non-‐state actors interact directly with public authorities by means of face to face communication, deliberation or decision-‐making, or by written forms of communication using electronic or paper media. Participation ranges from one-‐off consultation to on-‐going and institutionalized relationships. There are four main domains of public participation in the design and implementation of fiscal policy:
i. In the annual budget cycle: from fiscal strategy and the preparation of the annual budget proposal by the executive, through presentation of the budget to and its adoption by the legislature, budget implementation, in-‐year reporting on and amendment of the budget, and end of year reporting, auditing and review.
ii. In new policy initiatives, plans, or reviews on revenues, expenditures, financing, assets and liabilities. These are fiscal policy initiatives that may have been subject to extended public engagement over a longer period than the window for preparation of the annual budget, including medium term plans, and longer term fiscal policy reviews.
iii. In the design, production and delivery of public goods and services: from service delivery planning and setting of service standards, engagement during service delivery, through feedback from service recipients, independent review mechanisms, and monitoring and evaluation.
iv. In the planning, appraisal, and implementation of public investment projects: from national and sector planning through project preparation, appraisal and selection, to project implementation, audit and review.