first quarter 2015 results april 2015. forward looking statements this presentation includes certain...
TRANSCRIPT

First Quarter 2015 Results
April 2015

Forward Looking StatementsThis presentation includes certain “forward-looking statements” within the meaning of Canadian securities regulations. Such forward-looking statements involve known and unknown risks, uncertainties, and other factors which may cause the actual results, performance or achievements of the Corporation to be materially different from any future results, performance, or achievements expressed or implied by such forward-looking statements. Forward-looking statements include without limitation, statements regarding future results, future plans and objectives of Vicwest Inc. Forward-looking statements generally can be identified by the use of forward-looking terminology such as “may,” “will,” “expect,” “intend,” “estimate,” “anticipate,” “believe,” or “continue” or the negative thereof or variations thereon or similar terminology. There can be no assurance that such statements will prove to be accurate and actual results and future events could differ materially from those anticipated in such statements. Important factors that could cause actual results to differ materially from Vicwest Inc.’s expectations are disclosed in the Corporation’s latest Annual Report, Annual Information Form, Management Information Circular and Management’s Discussion and Analysis of Financial Condition and Results of Operations, which have been filed with applicable securities regulatory authorities and are available through the SEDAR website (www.sedar.com) under the Corporation’s publicly filed documents.
2
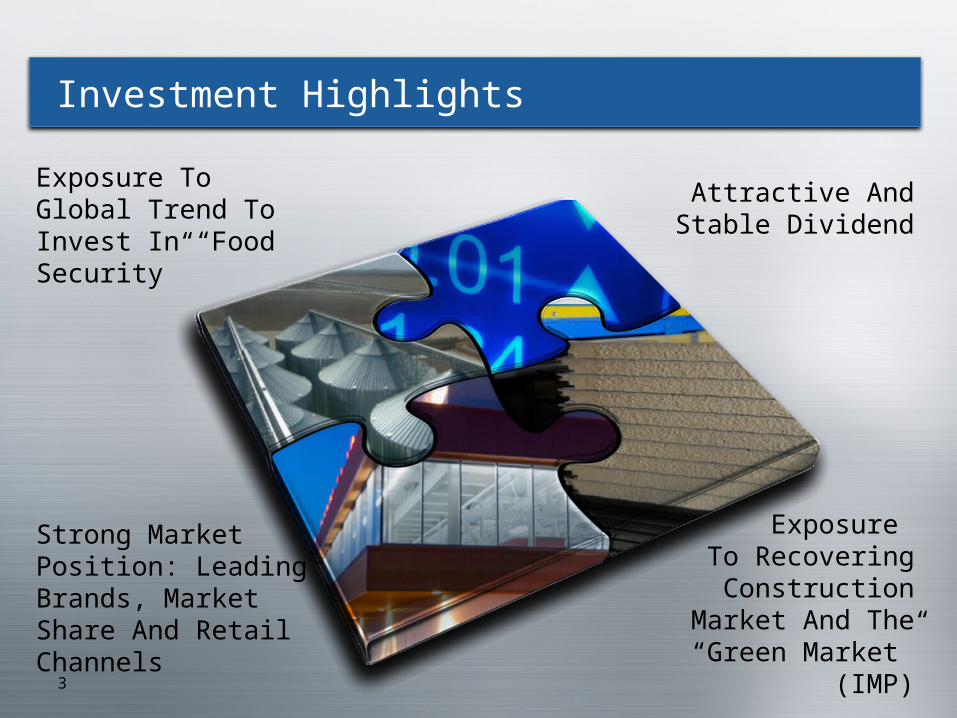
Strong Market Position: Leading Brands, Market Share And Retail Channels
Investment Highlights
Exposure To Recovering Construction
Market And The “Green Market”
(IMP)
Exposure To Global Trend To Invest In “Food Security”
3
Attractive And Stable Dividend

Financials
4

Quarterly Revenue Trend
5
FULL YEAR REVENUE FIRST QUARTER REVENUE $ Millions $ Millions
• Q1 revenues increased 18.4% due to growth in both divisions
• Our Westeel division’s sales increased 10.0%, driven by increases in international grain storage products and Canadian liquid storage volumes.
• Our Building Products division’s sales increased by 26.1%, driven by increases in our North American IMP business.
Westeel
Westeel
$84.9$100.5
VBP
VBP

Quarterly EBITDA Trend
1 Non-IFRS measure See disclosure on non-IFRS measures detailed at the end of this presentation. 2 2012 to 2015 figures represent Adjusted EBITDA, a non-IFRS measure. See disclosure on non-IFRS measures detailed at the end of this presentation. Similar figures for prior years not reported.
6
FULL YEAR ADJUSTED EBITDA1,2
FIRST QUARTER ADJUSTED EBITDA1,2
$ Millions $ Millions
• Q1 Adjusted EBITDA increased in both divisions, led by higher volume leverage, increased pass-through of steel costs, improved operating efficiencies and lower SG&A costs.

ADJUSTED EBITDA BRIDGE
7
Key consolidated variances are as follows:
• Volume increases and mix in both divisions led to improved margin of $3.4M
• Higher steel prices impacted both divisions by $0.5M, offset by price adjustments of $3.6M
• Other costs increased by $0.3M due to increased international selling activities and higher commissions on higher IMP volume, offset by lower SG&A costs
• There were EBITDA Adjustments of $0.5M in Q1 related to the Plan of Arrangement transaction costs
ADJUSTED EBITDA1 BRIDGE $ Millions
1 Non-IFRS measure. See disclosure on non-IFRS measures detailed at the end of this presentation. 2 Refer to Appendix – Detailed EBITDA Bridge.

Capital Structure
8

Capital Structure
9
• ABL balance reduced by $2M on a year over year basis
• Sufficient excess availability and cash flows to support growth plans
• Expect to achieve further meaningful decreases in ABL during balance of 2015
ABL Syndicate:

Strong Market Position: Leading Brands, Market Share And Retail Channels
Investment Highlights
Exposure To Recovering Construction
Market And The “Green Market”
(IMP)
Exposure To Global Trend To Invest In “Food Security”
10
Attractive And Stable Dividend

Appendices
11

Appendix: Business Overview
12

Corporate Overview
13
Diverse, value-add manufacturer of metal products
Strategic focus on three segments:1. AGRICULTURE:
Grain storage and handling
2. CONSTRUCTION:Exterior building products
3. INDUSTRIAL: Fuel and water containment
Growth potential + cash yield

Two Operating Divisions
A North American leader in exterior building products
A global leader in grain storage and handling
systems
Leveraging SynergiesSupply Chain (Steel), Cross-Sell (Agri.), IT (SAP Platform), Finance
14

Appendix: Vicwest BP Additional Information
15
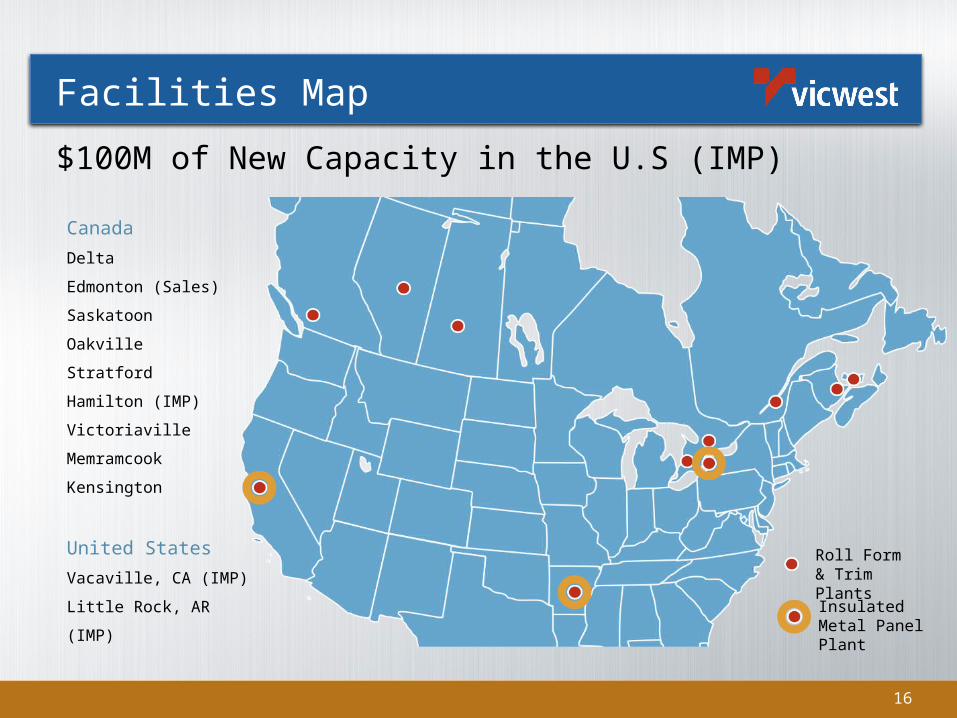
16
Canada
Delta
Edmonton (Sales)
Saskatoon
Oakville
Stratford
Hamilton (IMP)
Victoriaville
Memramcook
Kensington
United States
Vacaville, CA (IMP)
Little Rock, AR (IMP) Insulated Metal Panel Plant
Roll Form & Trim Plants
Facilities Map
$100M of New Capacity in the U.S (IMP)

About Insulated Metal Panels
17
• Continuously foamed-in-place insulation sandwiched between a finished metal exterior and interior face: 2-6” thick x 40+’ long
• Unmatched insulation value (R8 /inch + interlocking fit), low installed cost, multiple finish options • Applications: architectural, ICI (industrial, commercial, institutional), cold storage/temp
controlled storage, fire protection (w/ mineral wool)

Appendix: Westeel Additional Information
18

Westeel – Facilities Map
Expanding International Footprint
19
Canada
Winnipeg
Saskatoon
Tisdale
Olds
United States
Fargo, ND (2013)
International
Madrid, Spain
(2012)
Mumbai, India
(2013)
Este, Italy (2013)
Opened / acquired in the last 2 years

Westeel: Storage Economics
20
1 Based on Centurion’s storage capacity of 73,360 bushels.2 5-year average of high and low spread for CBOT wheat futures from September to December.3 Based on the price of CBOT wheat futures as of March 2014.
COMPELLING ECONOMICS
TOTAL1
Centurion W 4812 holds 73,360
bushels
$110k
$1.50 per bushel
$109k – $199k
$1.48 – $2.71 per bushelPER BUSHEL
INITIAL COST SIGNIFICANT ONGOING BENEFITS (per annum)
Better Potential Pricing2
Range Per Bushel Total1
5-Year Avg. High
$7.42 $544k
5-Year Avg. Low
$6.00 $440k
Difference $1.42 $104kReduced Spoilage
Yield Improveme
nt
Per Bushel Savings3 Total1
1% $0.06 $5k
5% $0.32 $24k
10% $0.65 $47k
20% $1.29 $95k

Water Storage Product Line
Water Management Systems
21

Appendix – Additional Bridges
22

Appendix – Detailed EBITDA Bridge
23
Corporate
1 Non-IFRS measure. See disclosure on non-IFRS measures detailed at the end of this presentation. ..
ADJUSTED EBITDA1 BRIDGE (Q1 2015)$ Millions
Non-IFRS MeasuresThe information included in this presentation contains certain measures that do not have standardized meanings prescribed by IFRS and are therefore, unlikely to be comparable to similar measures presented by other entities. Refer to “Non-IFRS Measures” for more details around these measures as provided in the Company’s publicly disclosed Management Discussion and Analysis. The MD&A and all required disclosure and reconciliations for these non-IFRS measures can be found on http://www.vicwestinc.com/pages/financial-reports-public-findings.
“Adjusted EBITDA” represents EBITDA adjusted to exclude changes in the fair value of embedded derivatives, unrealized losses on forward contracts, other expense, restructuring and optimization costs, pension settlement/recovery costs, Plan of Arrangement costs and non-recurring income and expense items. The Company believes that in addition to net earnings or loss, Adjusted EBITDA is a useful supplemental measure of cash available for distribution prior to debt service, changes in working capital, capital expenditures and income taxes for the Company. It is believed that Adjusted EBITDA is useful to investors for the purpose of assessing the Company’s performance and the presentation has been made to exclude items not considered representative of normal operations. Investors are cautioned that Adjusted EBITDA does not have a standardized meaning under IFRS and should not be construed as an alternative to net earnings or loss determined in accordance with IFRS. The Company’s method of calculating Adjusted EBITDA may differ from the method used by other issuers and accordingly the Company’s adjusted EBITDA calculation may not be comparable to similarly titled measures used by other issuers. A reconciliation of net income to Adjusted EBITDA is provided in the Company’s publicly disclosed Management Discussion and Analysis.
“Backlog” means the total value of work that has not yet been completed that: (a) has a high certainty of being performed as a result of the existence of an executed contract or work order specifying job scope, value and timing; or (b) has been awarded to the Company, as evidenced by an executed binding letter of intent, project plan or agreement, describing the general project scope, value and timing of work. Backlog is monitored by management as an indicator of future sales volumes and backlog is used to forecast production levels for the Company. It is believed that backlog is a useful metric for investors to forecast future revenue levels for the Company. Investors are cautioned that backlog provides no assurance about the timing of when that recorded revenue will be recognized. Investors are cautioned that backlog does not have a standardized meaning under IFRS and as a result the Company’s method of calculating backlog may differ from the method used by other issuers and accordingly the Company’s backlog calculation may not be comparable to similarly titled measures used by other issuers. Backlog does not have any equivalent financial measures and therefore cannot be reconciled to measures defined by IFRS.
24