first quarter, 2014 documents/cpi report q1... · 2015-06-12 · 2013, with the cpi at 126.4 points...
TRANSCRIPT

0
Consumer Price Index,
First quarter, 2014
(Base year 2007)
Detailed by:
Expenditure groups
Household welfare levels
Household type
Regions
Expected inflation
April 6, 2014
1
Table of Contents
Introduction ..................................................................................................................................... 2
Key Points ........................................................................................................................................ 3
Consumer Price Index (CPI) for the Month of March, 2014 and the First Quarter of 2014
(2007=100) ...................................................................................................................................... 5
A. Percentage changes in the CPI ............................................................................................ 5
B. Average CPI for the first quarter of 2014 compared with the same period of 2013 .......... 6
C. CPI of March 2014 ............................................................................................................... 8
1. Comparing the CPI of March 2014 with the CPI of March 2013 ..................................... 8
2. Comparing the CPI of March 2014 with the CPI of February 2014 ................................. 9
D. CPI by household welfare level ........................................................................................... 9
1. Comparing the average CPI by household welfare level for the first quarter of 2014
with the same period of 2013 ................................................................................................. 9
2. Comparing the average CPI by household welfare level for the month of March 2014
with March 2013 ................................................................................................................... 10
3. Comparing the average CPI by household welfare level for the month of March 2014
with February 2014 ............................................................................................................... 10
E. CPI by household type ....................................................................................................... 11
1. Comparing the average CPI by household type for the first quarter of 2014 with the
same period of 2013 .............................................................................................................. 11
2. Comparing the average CPI by household type for the month of March 2014 with
March 2013 ........................................................................................................................... 12
3. Comparing the average CPI by household type for the month of March 2014 with
February 2014 ....................................................................................................................... 12
F. CPI by Region ..................................................................................................................... 13
1. Consumer Price Index – Abu Dhabi Region ....................................................................... 14
2. Consumer Price Index- Al Ain Region ................................................................................ 15
3. Consumer Price Index, Al Gharbia Region ......................................................................... 15
G. Expected inflation 2014……………………………………………………………………………………………………16
CPI Methodology ........................................................................................................................... 17

2
Introduction
The Consumer Price Index (CPI) is an important statistical indicator for the purposes of
planning and research in various disciplines. Statistics centers and agencies in different
countries consistently compile these indices, which depend on the prices of a basket of
goods and services consumed by the household sector. The figures thus calculated
constitute a time series that provides a measure of changes in the cost of living over
time.
Therefore Statistics Centre - Abu Dhabi has always taken interest in collecting the prices
of those goods and services on a regular basis and publishes the indicators derived from
this data, following the methodologies adopted internationally in this field.
The Price Indices Section at the Statistics Centre - Abu Dhabi compile CPI according to
households’ levels of welfare and type. For the welfare level approach, the population is
divided into five segments (quintiles), which represent five standard of living levels
based on average annual expenditure per capita.
For the household type approach, the population is divided into three types of
households as set out in the results of the Household Income and Expenditure Survey
(2007-2008), namely, Citizen, Non-Citizen and Share households.
To represent all regions of the Emirate, the selected sample of items included in the
Consumer Price Index basket uses actual data from the 2007/ 2008 Household Income
and Expenditure Survey. The sample of outlets were selected in such a way to represent
points of purchase for a large base of consumers all over the Emirate of Abu Dhabi,
taking into account the geographical distribution of sources within the Emirate.

3
Key Points
This report provides an analysis of the results of the CPI for the month of March 2014
with the base year 2007. In addition, the report provides the results of the CPI by
household welfare levels and by household type and expected inflation for the second
quarter and the first half of 2014.The main findings of this analysis are outlined below:
The inflation rate in consumer prices for the first quarter of 2014 was 2.3%,
compared with the same period of 2013, as shown by the increase in the CPI to
126.3 points during the first quarter of 2014, up from 123.4 points during the
same period of 2013.
The CPI increased by 2.4% in March 2014, compared with the same period of
2013, as shown by the increase in the CPI from 123.5 points in March 2013 to
126.4 points in March 2014.
The CPI increased by 0.1% in March 2014 compared with February 2014.
Figure (1): CPI for the months of 2012, 2013, 2014
Source: Statistics Centre- Abu Dhabi
4
Consumer prices for Q1 2014 compared with Q4 2013 increased by 0.3%.
An overall rise of 2.3% in consumer prices during the first quarter of 2014 compared
with the same period in 2013, has led to an increase of 1.8% in consumer prices for
households of the bottom welfare quintile over the same period of comparison. For
the other welfare levels, consumer prices grew by 2.4% for households of the top
quintile and the middle welfare quintile.
The rise in consumer prices for the first quarter of 2014 compared with the same
period in 2013, pushed up consumer prices for citizen households by 2.4%, and by
2.3% for non-citizen households and 2.0% for share households.
The rise in consumer prices the first quarter 2014 compared with the same period in
2013, pushed up consumer prices by region for Abu Dhabi region and Al Ain region by
2.3%, and by 2.4% for Al Gharbia region
Data of the CPI estimates for April, May and June 2014 shows that the average CPI is
about 126.7 points, an increase of 0.4% compared with the first quarter of 2014. The
estimated annual inflation for the second quarter 2014 is expected to be around
2.5%. Compared 2.3% with the first quarter 2014.

5
Consumer Price Index (CPI) for the Month of March, 2014 and the First
Quarter of 2014 (2007=100)
A. Percentage changes in the CPI
During the first quarter of 2014, the average consumer prices rose by 2.3% compared with the same period of 2013, with the CPI for the first quarter of 2014 at 126.3 points, compared with 123.4 points for the same period of 2013. This rise in prices reflects the net change in the consumer basket prices (resulting from upward and downward movement) during the periods compared.
Figure (2) shows the annual inflation rates for the months of 2012, 2013 and 2014. These rates reflect the price movement of goods and services during the recent years.
Table (1): Consumer price index
Year Feb Mar Q1 Q4
CPI
2013 123.2 123.5 123.4 125.8
2014 126.3 126.4 126.3 -
— % —
Relative change 2.6 2.4 2.3 - Source: Statistics Centre - Abu Dhabi
Figure (2): Annual inflation rates for the months of 2012, 2013 and 2014
Source: Statistics Centre – Abu Dhabi

6
B. Average CPI for the first quarter of 2014 compared with the same period
of 2013
Table (2) shows the twelve major expenditure groups, as per the Classification of Individual Consumption according to Purpose (COICOP), and the Weight or relative importance of each one of the main expenditure groups. The Weight of any group is the households’ expenditure on that group as a proportion of total expenditure on all groups. The table also shows the relative change, which is the percentage rate of change in the prices of any given group for the first quarter of 2014 compared with the same period of 2013. The percentage contribution reflects the expenditure group’s contribution to the overall change in the prices of all groups, which is 2.3%.
Table (2): Major expenditure groups by Weights, relative change and contribution for the first quarter of 2014
Main Expenditure Groups Weight
Relative change Contribution
— % —
Food and beverages 16.1 2.9 22.0
Alcoholic beverages and tobacco 0.3 0.0 0.0
Clothing and footwear 9.8 3.7 12.6
Housing, water, electricity, gas and other fuels 37.9 1.9 31.1
Furnishings, household equipment and routine household maintenance 4.8 4.1 8.8
Health 0.8 -0.3 -0.1
Transport 9.7 0.8 3.3
Communication 7.7 -0.2 -0.6
Recreation and culture 2.4 0.5 0.5
Education 2.6 3.9 5.8
Restaurants and hotels 3.4 5.6 10.2
Miscellaneous goods and services 4.6 3.4 6.4
Total 100 .. 100
Source: Statistics Centre - Abu Dhabi

7
The above table shows the “Housing, water, electricity, gas and other fuels” group accounted for the largest rise in the index during the first quarter of 2014 compared with the same period of 2013, contributing 31.1% to the change. This contribution resulted from an increase of 1.9% in the prices of this group.
The second highest contributor to the overall increase in the CPI over the first quarter of 2014 was “Food and beverages”, contributed 22.0% to the change. The prices for this group rose by 2.9% during the first quarter of 2014 compared with the same period of 2013. Rises in the "Food and beverages” group came as a result of increases in the prices of most subgroups included in this group. The prices of “Fish and seafood” increased by 17.5%, “Coffee, tea and cocoa” by 8.4%, “Food products” by 5.6%, “Vegetables” by 4.4%" and “Mineral waters, soft drinks, fruit and vegetable juices” by 4.2%.
The "Clothing and footwear” group accounted for 12.6% of the overall increase occurring during the first quarter of 2014 compared with the same period of 2013.
The prices of “Restaurants and hotels” rose by 6.6% during the first quarter of 2014 compared with the same period of 2013. This group contributed 10.2% of the total increase achieved by all groups.
Figure (4): Relative change in CPI for main groups (first quarter of 2014 compared with the same period of 2013)
Source: Statistics Centre - Abu Dhabi

8
C. CPI of March 2014
1. Comparing the CPI of March 2014 with the CPI of March 2013
The average consumer prices increased by 2.4% in March 2014 compared with March 2013, with the CPI at 126.4 points in March 2014, up from 123.6 points in March 2013. This increase in prices was due to the net movement (increases and decreases) of consumer prices during the mentioned months. The most significant groups, which experienced increases in prices during March 2014 compared with March 2013, were “Housing, water, electricity, gas and other fuels” with a 2.7% increase and “Restaurants and hotels” with 6.7%, followed by “Clothing and footwear” with 3.2% “Miscellaneous goods and services” with 5.2%, and “Furnishings, household equipment and routine household maintenance” with 3.9%. Table (3): Main expenditure group by Weights, relative change and contribution, March 2014 compared with March 2013
Main Expenditure Groups Weight Relative change Contribution
— % —
Food and beverages 16.1 0.9 7.1
Alcoholic beverages and tobacco 0.3 0.0 0.0
Clothing and footwear 9.8 3.2 10.6
Housing, water, electricity, gas and other fuels 37.9 2.7 43.1
Furnishings, household equipment and routine household maintenance 4.8 3.9 8.2
Health 0.8 -0.1 0.0
Transport 9.7 0.6 2.6
Communication 7.7 -0.3 -0.7
Recreation and culture 2.4 1.9 1.7
Education 2.6 3.9 5.7
Restaurants and hotels 3.4 6.7 11.9
Miscellaneous goods and services 4.6 5.2 9.7
Total 100 .. 100
Source: Statistics Centre - Abu Dhabi

9
2. Comparing the CPI of March 2014 with the CPI of February 2014
The average consumer prices increased by 0.1% in March 2014 compared with February 2014. This overall increase in prices between the two months reflects the net movement (increases and decreases) of consumer prices during the periods compared. Figure (5): Consumer price index for the months of 2012, 2013 and 2014
Source: Statistics Centre - Abu Dhabi
D. CPI by household welfare level
1. Comparing the average CPI by household welfare level for the first quarter of 2014 with the same period of 2013
The rise of 2.3% in consumer prices during the first quarter of 2014 compared with the
same period in 2013, resulted in a increase of 1.1% in consumer prices for households of
the bottom welfare quintile for the same period of comparison. The corresponding rise
for other welfare levels was 2.4% for households of the top quintile and the middle
quintile.

10
Table (4): Average CPI values by household welfare level for the first quarter of 2013
and 2014
Period Bottom Bottom- Middle
Middle Top-
Middle Top
All households
— CPI —
2013 124.1 124.7 124.3 123.7 122.4 123.4
2014 126.4 127.5 127.3 126.7 125.3 126.3
— % —
Relative Change
1.8 2.3 2.4 2.4 2.4 2.3
Source: Statistics Centre - Abu Dhabi
2. Comparing the average CPI by household welfare level for the month of March 2014 with March 2013
The rise in consumer prices in March 2014 by 2.4% compared with March 2013 caused a rise in consumer prices for households in the bottom welfare quintile by 1.2% and top welfare quintile by 2.6%, while prices increased for households in the middle quintile by 2.3%.
Table (5): Average CPI values by household welfare level for the months of March 2013 and March 2014
Period Bottom Bottom- Middle
Middle Top-
Middle Top
All households
— CPI —
Mar-13 124.2 124.7 124.4 123.8 122.5 123.5
Mar-14 125.6 127.3 127.3 126.8 125.7 126.4
— % —
Relative Change 1.2 2.0 2.3 2.5 2.6 2.4 Source: Statistics Centre - Abu Dhabi
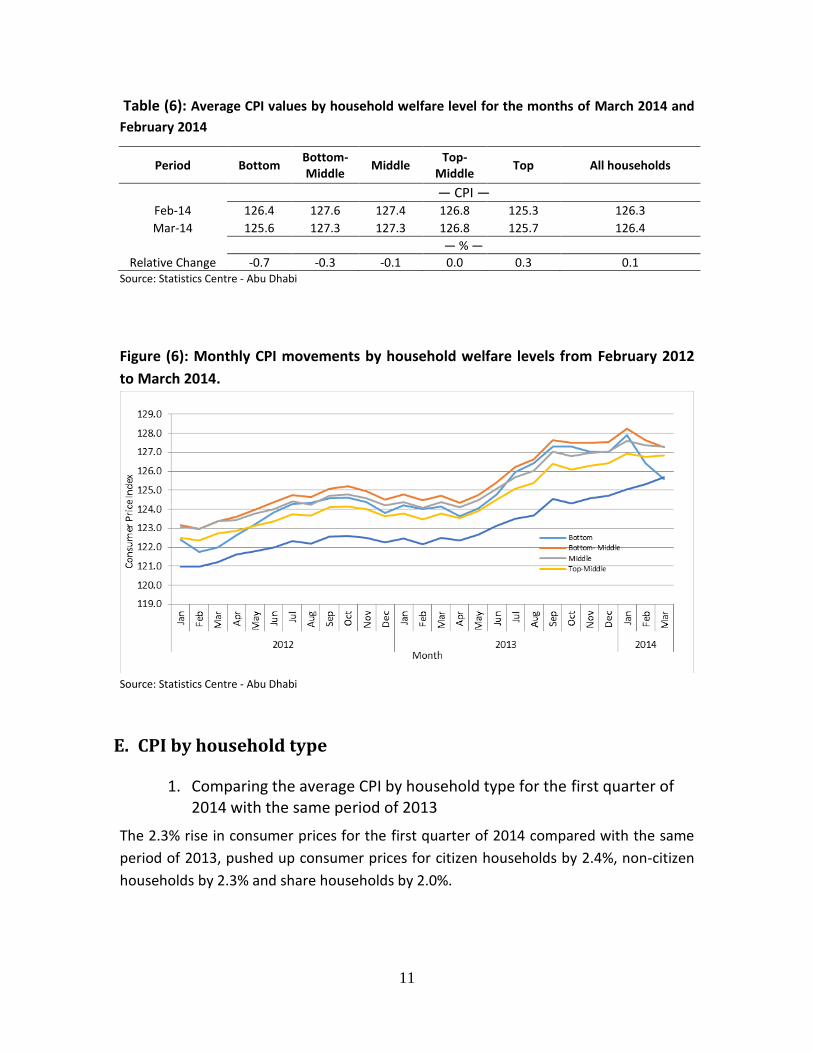
3. Comparing the average CPI by household welfare level for the month of March 2014 with February 2014
In March 2014, consumer prices increased by 0.1% compared with February 2014. This caused an increase of 0.3% in consumer prices for households in the top welfare quintile.
11
Table (6): Average CPI values by household welfare level for the months of March 2014 and
February 2014
Period Bottom Bottom- Middle
Middle Top-
Middle Top All households
— CPI —
Feb-14 126.4 127.6 127.4 126.8 125.3 126.3
Mar-14 125.6 127.3 127.3 126.8 125.7 126.4
— % —
Relative Change -0.7 -0.3 -0.1 0.0 0.3 0.1 Source: Statistics Centre - Abu Dhabi
Figure (6): Monthly CPI movements by household welfare levels from February 2012
to March 2014.
Source: Statistics Centre - Abu Dhabi
E. CPI by household type
1. Comparing the average CPI by household type for the first quarter of 2014 with the same period of 2013
The 2.3% rise in consumer prices for the first quarter of 2014 compared with the same
period of 2013, pushed up consumer prices for citizen households by 2.4%, non-citizen
households by 2.3% and share households by 2.0%.

12
Table (7): Average CPI values for the first quarter of 2013 and 2014 by household type
Period Citizen Non-Citizen Share All households
— CPI —
2013 122.8 123.9 124.0 123.4 2014 125.8 126.8 126.5 126.3
— % —
Relative Change 2.4 2.3 2.0 2.3 Source: Statistics Centre - Abu Dhabi
2. Comparing the average CPI by household type for the month of March 2014 with March 2013
The 2.4% rise in consumer prices for March of 2014 compared with the same period of
2013, pushed up consumer prices for citizen households by 2.5%, non-citizen
households by 2.4% and share households by 1.4%.
Table (8): Average CPI values during March 2013 and March 2014 by household type
Period Citizen Non-Citizen Share All households
— CPI —
March 2013 123.0 123.9 124.0 123.5
March 2014 126.1 126.9 125.7 126.4
— % —
Relative Change 2.5 2.4 1.4 2.4 Source: Statistics Centre - Abu Dhabi
3. Comparing the average CPI by household type for the month of March 2014 with February 2014
The 0.1% rise in consumer prices for March 2014 compared with February 2014, pushed
up consumer prices for citizen and non-citizen households by 0.1%.

13
Table (9): Average CPI values during March 2014 and February 2014 by household type
Period Citizen Non-Citizen Share All households
— CPI —
February 2014
March 2014
125.9 126.8 126.6 126.3
126.1 126.9 125.7 126.4
— % —
Relative Change 0.1 0.1 -0.7 0.1
Source: Statistics Centre - Abu Dhabi
Figure (7): Monthly CPI movements by household type for the period January 2012
to March 2014.
Source: Statistics Centre - Abu Dhabi
F. CPI by Region
The 2.3% increase in the CPI in for the first quarter 2014 compared with the same
period of 2013, resulted in an increase of 2.3% in the CPI for Abu Dhabi and Al Ain an
increase of 2.4% for Al Gharbia region. The increase in the CPI in Abu Dhabi Region
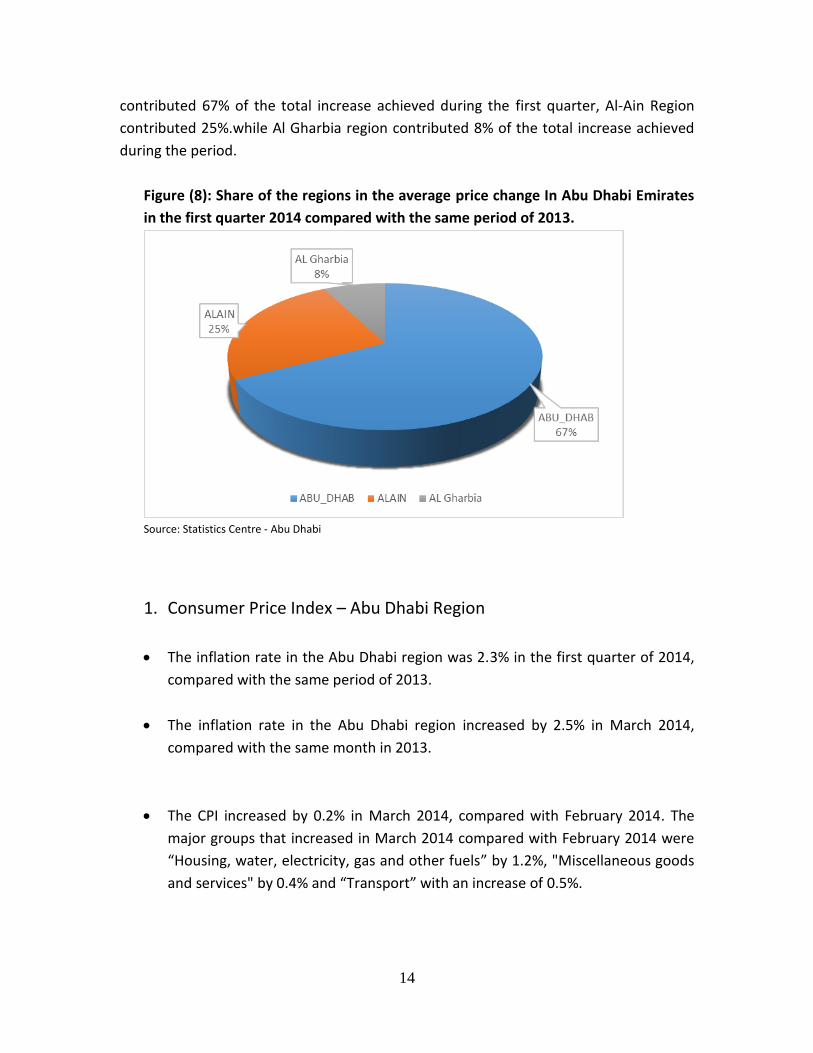
14
contributed 67% of the total increase achieved during the first quarter, Al-Ain Region
contributed 25%.while Al Gharbia region contributed 8% of the total increase achieved
during the period.
Figure (8): Share of the regions in the average price change In Abu Dhabi Emirates
in the first quarter 2014 compared with the same period of 2013.
Source: Statistics Centre - Abu Dhabi
1. Consumer Price Index – Abu Dhabi Region
The inflation rate in the Abu Dhabi region was 2.3% in the first quarter of 2014,
compared with the same period of 2013.
The inflation rate in the Abu Dhabi region increased by 2.5% in March 2014,
compared with the same month in 2013.
The CPI increased by 0.2% in March 2014, compared with February 2014. The
major groups that increased in March 2014 compared with February 2014 were
“Housing, water, electricity, gas and other fuels” by 1.2%, "Miscellaneous goods
and services" by 0.4% and “Transport” with an increase of 0.5%.

15
2. Consumer Price Index- Al Ain Region
1. The inflation rate in the Al Ain region was 2.3% in the first quarter of 2014,
compared with the same period of 2013.
2. The inflation rate in the Al Ain region increased by 2.4% in March 2014,
compared with the same month in 2013.
3. The CPI decreased by 0.1% in March 2014, compared with February 2014.The
major groups that decreased in March 2014 compared with February 2014 were
"Food and beverages” by 2.0%.
3. Consumer Price Index, Al Gharbia Region
The inflation rate in the Al Gharbia region was 2.4% in the first quarter of 2014,
compared with the same period of 2013.
The inflation rate in the Al Gharbia region increased by 2.5% in March 2014,
compared with the same month in 2013.
The CPI decreased by 0.2% in March 2014, compared with February 2014. The
major groups that decreased in March 2014 compared with February 2014 were “Food
and beverages” group by 2.3%.
G. Expected inflation
The expected inflation in the consumer prices for the second quarter and the first
half of 2014 has been determined
Data of the CPI estimates for April, May and June 2014 shows that the average
CPI is about 126.7 points, an increase of 0.4% compared with the first quarter of
2014. The estimated annual inflation for the second quarter 2014 is expected to
be around 2.5%. compared 2.3% with the first quarter 2014.
16
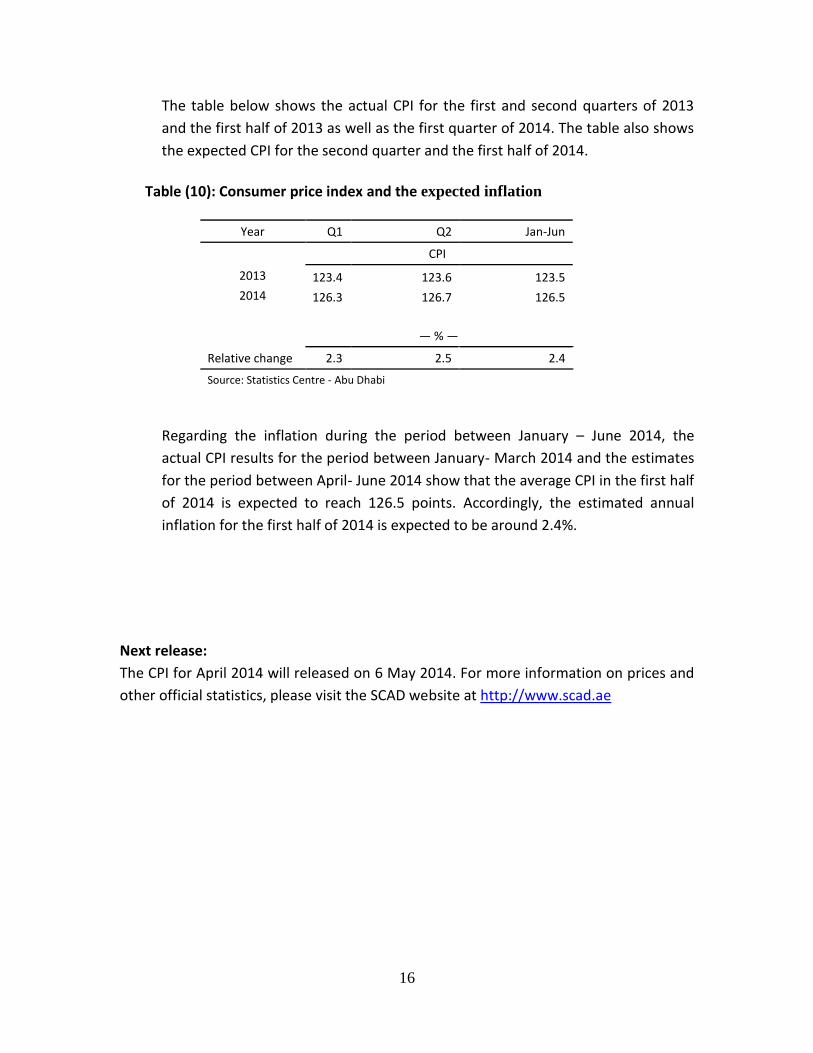
The table below shows the actual CPI for the first and second quarters of 2013
and the first half of 2013 as well as the first quarter of 2014. The table also shows
the expected CPI for the second quarter and the first half of 2014.
Table (10): Consumer price index and the expected inflation
Year Q1 Q2 Jan-Jun
CPI
2013 123.4 123.6 123.6
2014 126.3 126.1 126.6
— % —
Relative change 2.3 2.5 2.4
Source: Statistics Centre - Abu Dhabi
Regarding the inflation during the period between January – June 2014, the
actual CPI results for the period between January- March 2014 and the estimates
for the period between April- June 2014 show that the average CPI in the first half
of 2014 is expected to reach 126.5 points. Accordingly, the estimated annual
inflation for the first half of 2014 is expected to be around 2.4%.
Next release:
The CPI for April 2014 will released on 6 May 2014. For more information on prices and
other official statistics, please visit the SCAD website at http://www.scad.ae

17
CPI Methodology
Introduction
Statistics Centre- Abu Dhabi is the sole official body responsible for calculating and
publishing the Consumer Price Index (CPI) within the Emirate of Abu Dhabi. The Centre
updated the CPI base year to 2007 for both prices and weights. Weights that are used in
the new CPI were calculated using the results derived from the Household Income and
Expenditure Survey 2007-2008, which was carried out in the Emirate of Abu Dhabi. The
methodology used in calculating the CPI follows best international recommendations
and practices in this field.
What is the Consumer Price Index?
The CPI is a tool that measures the rate of change in the prices of a basket of goods and
services between two periods. The period against which prices are compared is known
as the base period and the period under review is known as the comparison period.
Importance of the Consumer Price Index
The CPI provides monthly estimates on the rate of change in the prices of a consumer
price basket in the Emirate of Abu Dhabi. Some of the significant utilizations of the CPI
are:
The CPI is used as an important economic indicator to calculate inflation rates.
The Inflation rate is a key statistic for economic policy making and is used for the
purpose of adjusting payments (such as rents and wages).
Salaries and wages are being adjusted by international entities and big
corporations based on the change taking place in the CPI.
The CPI is used as a deflator while producing national accounts at constant
prices.
Updating the Consumer Price Index
The Consumer Price Index weights are updated on a regular basis once the necessary
data becomes available. Usually the update takes place after releasing the results of the
Household Income and Expenditure Survey, which is carried out periodically about every
five years. Updating weights of goods and services of the CPI basket ensure that these
weights represent as close as possible the current consumption pattern of households.
The last CPI update in the Emirate of Abu Dhabi took place in 2007-2008, where 2007
was regarded as the new CPI base year for both weights and prices.

18
1. CPI Compilation
The CPI is calculated using the Laspeyres method WPP
CPI i
i
i
L 0
0
1
Prices of goods and services of the CPI basket are collected periodically, except for
vegetables, fruits, meat, fish and chicken groups which are collected on a weekly basis
due to the continuous change that occur in its prices. Rentals prices are collected
quarterly, while education fee prices are collected semi- annually.
The current CPI uses 2007 as the base year in Abu Dhabi region. The current CPI basket
consists of 334 goods and services, while the consumer basket contains 760 goods and
services. The new CPI included the CPI of residential units occupied by their owners; this
was done by adding the weight of this item to the weight of the rented residential units
followed by calculation of a single index for all rented units.
The average item price is calculated “on the main group level” using the geometric
mean of elementary aggregates. The price ratio is calculated by dividing the comparison
price by the base price, while the new price is calculated by multiplying by the base
price.
To calculate the CPI on the sub- group level, the new weight of all goods and services of
the sub-group should be added and then divided by the base price of the same group.
The CPI of the main groups and the general CPI are calculated using the same method.
2. Weights
The Consumer Price Index is a weighted average of the change in the price of goods and
services of the CPI basket. The weight of the good or service reflects its relative
importance. The weight of good (C) is calculated by dividing the total expenditure of all
households on the good (C) by the total expenditure of households on all goods and
services.
The relative importance1 of goods and services were calculated based on the results of
the 2007-2008 Household Income and Expenditure Survey. Goods and services with a
weight of 0.002 per cent or more were included in the CPI basket of goods and services.
Goods with weights below this value were distributed proportionally among the other
goods in the same group.
1 Relative importance of a given good or the weight of the good is the total expenditure of all households on the good
divided by the total expenditure of all households on all groups

19
3. CPI basket and Consumer basket
After calculating weights and identifying goods and services representing the CPI, the
334 goods and services in the consumer basket was identified. Each item in the CPI
basket is represented by one good or service or more, therefore the consumer basket is
larger than the CPI basket. The CPI basket includes 760 goods and services.
4. Classifications used in the CPI
The Classification of Individual Consumption according to Purpose (COICOP) is used in
the construction of the CPI. The COICOP is a United Nations classification, which is used
for statistical purposes. Based on the COICOP, goods and services of the CPI basket were
classified into the main 12 groups, 34 subgroups (two digits) and 63 subgroups (three
digits). The following table shows the main groups (one digit) and their weights:
COICOP Classification
Main Expenditure Groups
Weight
Total
100.0
1 Food and non-alcoholic beverages 16.1
2 Alcoholic beverages and tobacco 0.3
3 Clothing and footwear 9.8
4 Housing, water, electricity, gas and other fuels 37.9
5 Furnishings, household equipment and routine household maintenance 4.8
6 Health 0.8
7 Transport 9.7
8 Communication 7.7
9 Recreation and culture 2.4
10 Education 2.6
11 Restaurants and hotels 3.4
12 Miscellaneous goods and services 4.6
5. The Classification used in the CPI by household welfare
According to this classification, households were divided into five segments based on
the average expenditure per capita in 2007, when the last Household Income and
Expenditure Survey was carried out.

20
The bottom welfare quintile represented the segment with the lowest income, while the
top welfare quintile represented the segment with the highest income.
Average expenditure per capita
Welfare Lowest Highest Average
Low 2,683.3 11,122.0 7,838.7
Low middle 11,125.8 16,887.4 14,069.6
Middle 16,896.2 23,716.1 20,260.2
Upper middle 23,732.4 34,606.9 28,685.6
Top 34,631.6 422,932.4 52,720.3
6. Terms related to the CPI
Term Synonym Description
price Price is defined as the value of one unit of a product or
service; this means the market value of the product or
service. This value comes through the exchange of
products and services in the markets. This value is
equivalent to the benefit achieved by the consumer.
Consumer Price
Index (CPI)
The consumer price index (CPI) is a statistical indicator
that measures changes in level of prices of goods,
services and rents of residential units within the
consumer spending basket of households between two
periods, the reference period and the comparison
period.
Expected
Inflation
Expected inflation is the expected rate of the rise in
consumer prices. It is calculated using the CPI time
series data by studying the movement of prices at the
level of main and sub groups of the index basket, taking
into account the seasonal changes. The expected
inflation rates are statistical estimates, subject to
increase or decrease depending on the unexpected
changes in market prices.

21
Weight Weight is the relative importance of product or service
within the CPI basket compared with all other products
or services.
Outlet Outlets were products or services are sold such as
shops, supermarkets and stores.
Periods of
Collection
Periods of collection are the adopted periods to repeat
the survey of all groups in each basket. The period might
be one weekly, semi-monthly, monthly or quarterly.
GIS The Geographical Information System is a system that is
designed to capture, store, manipulate, analyze,
manage, and present all types of geographical data.
Personal Digital
Assistance
An electronic device used to collect price data such as
iPad, PDA, Galaxy Tab
Barcode a machine-readable code in the form of numbers and a
pattern of parallel lines, where is the description of the
product is stored.
7. Classification used in the CPI by household type
According to this classification, households were divided into three types, citizen, non-
citizen and share household:
Citizen household: is one person or more from the UAE citizens, who live
permanently in the Emirate of Abu Dhabi. They should have a head, while their
members might be related to each other or not and they should share
accommodation and food.
Non- citizen household; is one person or more who are non UAE citizen. The
members of the non-citizen household should share accommodation and food,
while they might be related or not and they should have a head. The household
is considered non- citizen if the head is non-citizen and wife is non-citizen, even
if the wife has citizen children from a previous marriage.
Share household: is a group of persons (more than two) regardless of their
nationalities. It should have a head and their members might be related to each

22
other or not. The members of the share household share accommodation but
they normally do not share food.
8. Geographical Scope
The current geographical scope of SCAD covers the Emirate of Abu Dhabi including all
sub regions. However, the comprehensive coverage to the whole Emirate is essential
but it requires a huge effort in order to collect the prices on a regular basis from all the
regions of the Emirate.
9. Sources of Goods and Services
Sources used for the collection of price data were determined through field visits
conducted by a team from SCAD’s Price Indices Section. The team updates SCAD on a
regular basis if any source closes down or relocates premises. While choosing a source,
it has been taken into consideration that it should represent a large segment of
consumers in the Emirates of Abu Dhabi. Price data are currently collected from 180
sources.
10. Collection of Price Data
Price data collection is a crucial stage that requires a significant amount of time and
effort. The collection of price data is conducted by a group of employees who are well
trained. To ensure the accuracy of the collected prices, the price of a sample of goods
and services are reviewed through field visits. Each group of prices is collected
differently, some is collected weekly, and others are collected monthly and quarterly.
In order to develop the price collection mechanism and cope with the latest IT trends,
SCAD developed a comprehensive system that aims at calculating CPI using tablets.
The system aims at:
Implementation of all CPI stages
Provision of electronic programs and tools required for the price data collection
(field collection) and transfer of data to the tablets, in addition to receiving data
and transfer to the prices database.
Ability to examine data accuracy and integration at all stages of the system,
including preparation of the goods and services basket, the field work and
calculating the index.
Ability to calculate the CPI for any region of the Emirate (according to the
geographical scope).
Ability to deal with special situations that may arise during data collection or CPI
calculation such as disappearance of goods, resources, and changes in the goods.

23
Determining goods and services basket of the base year with the relative weights
of the groups, in addition to calculating the prices of goods and services of the
base year.
Assisting data collectors while editing data by connecting the current data base
with the previous one.
11. Publishing
SCAD publishes the CPI and prices of consumer goods and service on a monthly basis,
seven days after the end of the month. SCAD also publish annual CPI results and
inflation rates. The CPI can also be provided on CDs upon request.
12. How to read the CPI
The CPI reflects the rate of the change in the prices of a specified goods and services
basket between two time periods, the base period and the comparison period. For
example, if the price of the goods and services basket during a specified base period is
AED 100, and the CPI of the comparison period was 105.0, this means that prices of
goods and services increased by about 5%.
In order to measure the change in the prices of the current period and the previous
period, the current CPI should by divided by the previous CPI, then multiply the result by
(100) and then subtract 100.
13. The expected inflation
The expected inflation is of great importance; it indicates the future inflation rates, which are
used to create future monetary policies by banks and financial establishments.
The inflation for the second quarter 2014 was estimated using the available CPI dataset for the
period from January 2009 till March 2014. The price movement of main and sub groups included
in the CPI basket was carefully analyzed, while taking into consideration the seasonal changes.
The technical experience of the Prices and Income team in SCAD allowed them to estimate the
CPI for April, May and June 2014 and then calculate the expected inflation for the second
quarter 2014 and the expected inflation for the first half of 2014.
Kindly note, the expected inflation rate are statistical estimates that might increase or decrease
according to the unexpected changes of the market.