first interim analysis of first offender · pdf filefirst interim analysis of first offender...
TRANSCRIPT
. ' Y P88 I- 1 1 ? 19
DOT HS-805-577
FIRST INTERIM ANALYSIS OF FIRST OFFENDER TREATMENT EFFECTIVENESS
Raymond E. Reis, Jr., Ph.D Lewis A. Davis
Comprehensive Driving Under l~e Influence of Alcohol Offender Treatment Demon~alJon Project
County of Sacramento Health Department Sacramento, California 95814
Contract No. DOT HS-6-01414 Contract Amt. $2,158,403
L
I
MARCH 1980 INTERIM REPORT
This document is available to the U.S. public through the National Technical Information Service,
Springfield, Virginia 22161
Prepared For U.S. DEPARTMENT OF TRANSPORTATION
National Highway Traffic Safety Administration Washington, D.C. 20590
If you have issues viewing or accessing this file contact us at NCJRS.gov.
This document is disseminated under the sponsorship of the Department of Transportation in the interest of information exchange. The United States Govern- ment assumes no liability for its contents or use thereof.

2 Go.e,~e., A¢~.,,,o~ ~o 3. r=c;p,i..,'s Ca,~To~ ~o. 1. r'e~o',, no.
DOT-HS-8051577 ±
4. T,He and Sub,,,le
FIRST INTERIM ANALYSIS OF FIRST OFFENDIiR TREA~.IENT E F F E C T I V E N E S S ~" ;"
7. A~.- ~-; sl Raymond E. Reis, Jr., Ph.D., Lewis A. ' D a v i . s
S. Repo,, Oo,e
March, 1980 ~6. P~,~o~m,n9 O,ga~.z=~,o~ Co~*
'~. Perfo,~mln~-.O,g'an,za,,on Repo,t No.
. C D U I - I E - 8 0 - I ""
9. I~e,foem,ng Orga~ixation Name and Address ~ 10. Work Un;~ No.' ~TRAIS)
Comprehensive/Driving Under the Influence of •Alcohol • . ~' ~*~- " ~ Offender Treatment Demonstration (CDuI) Project, Office of Alcoholism, County of Sacramento Health Department , Sacramento, California 95814
12. Spon~sor,ng ~gency I ~ and Addr,es's - • ~ ~, Office Of Driver and Pedestrian Programs National Highway Traffic Safety Administra£ion U.S. Department of Transportation~ 400 Seventh St.,S.W Washington; ~ D .C. 20590
15. Supplementary Noles ,
C~ - Clayton J. Hall • :'
] | . Cont:roct'or Grant No.
D O T - H S ~ 6 - 0 1 4 1 4
13. Ty~e'ot Report and Period Coveted
i I n t e r i m R e p o r t 921=77 / I0-29,79
14. Spons0Hng. A g e n c y Co~e
.
16. Abstract
This report is the first interim analysis concerning the effectiveness of the CDUI ProjecE's education programs for first offender DUI's. Treatment effectiveness was assessed in terms of recorded accidents, DUI offenses, and t0ial moving violations occurring subsequentto random assignment. Survival anaiysis was used to c0mpar~ control, home study, and in-classleducation groups. Comparisons:were made for the total research sample (all assigned as 0f Oct0ber, 1979), for two age subgroups, and t~ree diagnostic subgroups (drinking problem severity): A comparison was also made between the researc~ sample and a sample of non-volunteers to assess our ability to generalize results.
Additional analyses were conducted to determine the effect of quarterly letter monitoring and foliow-up interview , procedures on driving behavior.
The results of the treatment group comparisons provided very lit~le=evidence that the education programs had any effect on driving:behavior as of October., • 1979. None of the 18 analyses conducted resulted in statistically significant between group differences. The preliminary nature of these results was stressed,~and an attempt was made to identify consistent patterns in the outcome data.
The results of the letter monitoring-analyses suggested that the procedure maybe counterproductive. The follow-up interviews appeared to have no effect on driving
behavior.
17. Key ~oed3 "~
Alcol~ol safety School, Alcoho Treatment Effectiveness, Recidivism, DUI Offender • Treatment, Alcohol Education, Alcohol Highway Safety, DWI, DUI, Traffic Accidents
19. s ~ , ~ t ~ c l o ~ f , lof ,h . . . . po,,) ~" 20. S.o=~,~,x C1o,,~7'(o~ ~ , p°g. ) ~ ';'
Unclassified I : Unclassified
Fo,.'m DOT F 17C0.7 (3-72) Reproduct ion o~ comple t . 'd pag~ ou thor izad
18 "D~str bution;S)atement
D o c u m e n t i s a v a i l a b l e t o t h e U . S . p u b l i c through the National Technical Information Service, Springfield, Virginia 22161
21- No'. el Pcge~
. 214
22. Pr ice
i

METRIC CONVERSION FACTORS
. ,.• : .
i "
[
+ .
1 ,~ • .
I ~ ,
I y I I l e l
in I t Vd
m'l
in 2 |12
vd ~ mi 2
Ib
t sp Tbsp f l OZ
C pt
q t g a l 113
y d ~
Approximate Conversions to Mehic Measures
.WI~n Yam I I ~ H.
i n c h e s •
• f e a t .
V i l I t l l m i l e s
I I I I I !11: i l l c h a s s q u a r e foot I<luare" y lNds
s q u a l n , m i l e s ac r l l s + .
• s h o r t t o n s
(2000 Ib)
teaGpoons t a b l s s p o o n 8 I l u ~ l ~ n c e s
' cups . p i n t s q u a r t s • g a l l o n s c u b i c f e a t
cub+,: vs,ds
M u l t i p l y b y To F i n d
LENGTH
" 2 . 5 3O
0 .9 1 .6
AREA
6 ,5
O.O9
• 0.8 2 ,61
_ 0 ,4
MASS (weight t 28
0 .46
0 . 9
VOluME
1 5 3 0
O.24 0 .47 0 .95
3.8
0 .03
0 .76
c e n t i n a t e r s c e n t i n t e t e l s
. me te rs k i l o m o t m r S
• TEMPERATURE (OXKt) , • + ' r
, 321
IqlUl l re c l o t i n ~ t e r I q u a r e m e t e r s
I q u ~ / o rn i l tOf I
I q u l l r e k i l l , meters h e c t a l e s
9~ams k i los+ares tonnes
m i l l i l i t e r s m i l l i l i t e r s " m i l l i l i t e r s
l i t e r s l i t e r s ,
l i t e r s
l i t m s
c u b i c metm's c u b i c m e t e r s
' IyIkol
cm cm m km
cm 2 m 2
km 2 -.
ha
O • ko
t
m l m l ml
I
I
. 1
t
OF F a h r e n h e i t 019 (ahe~ ... C s l s i u s , . ++ ° C
• " t e m p e l e t u r e . + sub t~ac t i~ 9 . tempers tu+e
,-~1 if+ S 2 . 5 4 I t + . J + l l y ) . L[I¢ u lhe l e x i t Cml-~.,~,+,t,.b+ +.~0 n ~ e ~k~ ta , l~ l t a b l ~ , ~,l+u NSS'MIb(;, P*lbl, 2~(i, " U~VIz. ul Wl~l'Jhtb ;SIC FJktc3SUleS. Px4ce S~.3.~, 5~ CJ la lu t l NO. CI3.1U:28(~.
_ _ " ~
• E = - ~. .~ ~ .. . ~ •
, - - m
_ _ - - - , e
- - - . ~ ,~
- - ~ ~,j - - -
_ _ _ ~ . . ~ _
. _ ~ . - -
0
l i t
ol
i+.
~0
- - : = + ,
- - _ _ _ - -_ .
S y m b o l
m
m m km
m 2 Imm 2
ha
9
ko t
ml
I
I
I m 3 m 3 .
° c
i
A p p r o x i m a t e C o n v e f s i o n x I r o n M e t r i c M e a s u r e s
W h o l YOU K n 0 w M u l t i p l y b y To F i n d •
I I io lo18rs Jnclltois
cen t Jl1~ltl}r s i nches naotlmr s Ioo l a lo lo fs yet (11 k i l o n m l m s m o l e s
LENGTH
0 ,04
. 0 . 4
" 1 . 1
0 .6
"AREA
i q u l ' e c e n t l m e t e l s - 0.1.0 square m c h e s I q u a f e m e t e r s 1.2 S<ll+~a ya rds a q u a s k i l o m e t e r s 0 .4 I q l o m* les hecta~'es (10 ,000 m 2) 2 .5 i c t u s
g l e n s
k i l o o r a m s tommes (1000 ko)
m i l l i l i t e r s l i te l rs l i I w s
l i t e r s
c u b i c mete+ l c u b i c m e t a l s
M A S S ( w o i l i t ~
0 .035
2.z ~1.1
VOLUME
ounces pounds shm' l tol~s
0 .03 .
2.1. 1 .04
0 . 2 6
3 5 " 1.3
TEMPERATURE .~ezxt),
f l u i d ounces p0nts guacts
9 a l l m s c u b i c fee t
. cub i c yards. .
CaSs ius - - 0 /S (d~e~ F s l l l l m k e i I l a m p , r a t t a n a d d 32) " Ien~era~ufl
o F OF 32 9(1+6 : tZ
- 4 0 O n 4 o 0o L .12o 16o 90011 , | | | • , i , • L . • . . • . s i ,
. . . . ~ I , i i, , ~ , 1o , ~ - - 4 0 - 2 0 2 0 " 4 0 e n I
° C ST o c
I v n d l o l
in
m
11
ml
i n 2 ~ 2
mi 2
|| OZ pl
ql
y d 3

AC KNOW I,E D6EMENT
The authors wish to express their appreciation to the many agencies and
individuals who have provided continuous support and guidance for the
evaluation efforts of this demonstration project: , . .'., • : ., . ,
County 0fSacrament0 Municipal Court, particularly the Honorable Edward J. Garcia, Presiding Judge 1976-1978; The Honorable Allen : P. Fields, Presiding Judge 1978-1980; The Honorable Roger K. Warren, Presiding Judge 1980; and George Nuckton, Administrative Officer
CountY of sacramento District Attorney's 0ffige, the Honorable John Price, former District Attorney; and the Honorable Herbert Jackson, District Attorney 1979-present.
The Honorable Albert S. Rodda, State Senator, State of California.
California State Department Of Motor Vehicles, particularly Ms Doris Alexis, Director; R0nald S. Coppin, Chief, Researchand Development Section; Raymond C. Peck, Research program Specialist II; and Roger E. Hagen; Ph.D.., Research SpecialiSt III.
G. Van Oldenbeek, Assistant Director, California State Office of Traffic Safety.
The Honorable Rudolf H. Michaels, Chairman, CDUI Liaison and Advisory Committee.
County of Sacramento Health Department, Ronald L Usher, D.P.A., Director, and Laurence R. Valterza, Alcoholism Program Administrat0r.
Narren E. Thornton, Administrator, County of sacramento Law and Justice Agency.
National HighwayTraffic Safety Administration , Office of Driver and pedestrian Programs; Clayton J. Hall, Contract Technical Manager; James L. Nichols, Ph.D., Treatment Specialist; ~ and Robert B. Voas, Ph.D. EvaluationSpecialiSt.
i% .
iii

,%
#
TABLE OF CONTENTS
8
P a g e
D o c u m e n t a t i o n P a g e . . . . . . . . . . . . . . . . . . . . . . . . . . . . . . . . . . . . . . . . . . . . . . . . . i
i i M e t r i c C o n v e r s i o n F a c t o r s . . . . . ~ . . . . . . . . . . . . . . . . . . . . . . . . . . . . . . . . . . .
Acknowledgement iii
Table of Cbntents.7....., .... .: ..... ... ....... ..... ;-...-2. ....... ... iv
List of Figures . . . . . . . . . . . . . . . . . . . . . ; ......... v
L i s t o f T a b l e s . . . . v i i
L i s t o f A b b r e v i a t i o n s a n d D e f i n i t i o n s . . . . . . . . . . . . . . . . ; . . . . . . . . . . . . . x v
INTRODUCTIONs. . . . . . . . . . . . . . . . . . . t . . . . . . . . . . • . . . . . . . . . . . . . ' ' ' . . . . ' ' - 1
Demonstration Project objectives .... 1
Background.., .................... ~..... ....................... 1
P u r p o s e a n d S c o p e o f R e p o r t . . . . . 7
F i r s t O f f e n d e r R e s e a r C h D e s i g n . . 9
D r i v i n g R e c o r d D a t a C o l l e c t i o n . . . ; . . . . . . . . . . . . . . . . . . . . . . . . . . 12
O u t c o m e C r i t e r i a . ; . . . . : . . . . . . . . . . • . . . . . . . . - ~ . . . . . . . . . . . . . . . . . 12
S t a t i s t i c a l A n a l y s i s a n d R e l a t e d T o p i c s , ~ 14
G r o u p C o m p a r i s o n s . . . . . . . . . . . . . . . . . . . . . . . . . . . . . . . . . . . . . . . . . . . . . 1 9
S U ~ A R Y OF R E S U L T S . . . . . . . . . . . . . . . . . . . . . . . . . . . . : - . . - . . . . . . . . . . . . . . . . . . 24
E f f e c t i v e n e s s o f F i r s t O f f e n d e r E d u c a t i o n P r o g r a m s 24
E f f e c t i v e n e s s o f L e t t e r M o n i t o r i n g a n d F 0 1 1 o w - u p • I n t e r v i e w s . . 52
CONCLUSION . . . . . . . : . . . . . . . . . . . . . . . . . . . . . . . . . . . 62
APPENDICIES
A P P E N D I X A - A u t o m a t e d D r i v i n g R e c o r d D a t a C o l l e c t i o n P r o c e d u r e s . . . . . . . . . . . . . . . . . . . . . . . . . . . . 64
• APPENDIX B - Survival Data and Test Statistic Summary • Tables for First Offender Treatment
• Group Analysis ............. ; ....................
APPENDIX C- Survival,Data and Test SZatistic Summary
APPENDIX D
APPENDIX E -
APPENDIX F -
81
Tables for•Letter MonitOring and Follow-up Interview Analysis ...................... • 164
Education Program Objectives. .184
Quarterly Monit0ring Letter and Content
Analysi s ...... . ........ ..... ............ .... .... :.]87
CDUI Project DiagnOstic Interview Protocol ...... 19i

LIST OF FIGURES
F~rCURE 1 D i a g r a m o f F i r s t O f f e n d e r R e s e a r c h D e s i g n . . . . . . . .
FIGURE 2 P l o t of C u m u l a t i v e S u r v i v a l Ra te s for T o t a l F i r s t O f f e n d e r • T r e a t m e n t Groups and t t ie
: / . : N o n - v 0 i u n t e e r Sample = F i r s t A c C i d e n t . . . . : . . ~ . : . . .
FIGURE 3
FIGURE
['age
10
34
P l o t o f C u m u l a t i v e S u r v i v a l Ra te s F o r Total• F i r s t O f f e n d e r T r e a t m e n t Groups and t h e N o n - V o l u n t e e r Sample; F i r s t DUI or R e c k l e s s
D r i v i n g O f f e n s e 35
3 H o t o f C u m u l a t i v e S u r v i v a l Ra te s f o r T o t a l F i r s t O f f e n d e r T r e a t m e n t Groups and t h e
i " . . .
• N 0 n - V o l u n t e e r Sample; F ~ r s t ~lovlng V i o l a t i o n o r Any A/R O f f e n s e 36
FIGURE 5 P l o t o f C u m u l a t i v e S u r v i v a l R a t e s f o r F i r s t O f f e n d e r T r e a t m e n t Croups , Age L e s s Than "~- Y e a r s : F i r s t A c c i d e n t . . . . . . . . . . . . . . . . . . . . . . . . . . . 37
F l GURE
F I GU R E
FIGURE 8
FIGURIi 9
l.l(,Uld. 10
F IGUP, E l l
FIGURE 12
P l o t o f C u m u l a t i v e S u r v i v a l Rakes For F i r s t O f f e n d e r T r e a t m e n t Groups , Age L e s s Than 25 Y e a r s : F i r s t , D U I or R e c k l e s s D r i v i n g O f f e n s e . . . . . . . . . . . . . . . . . . , . 3 8
P l o t o f C u m u l a t i v e S u r v i v a l R a t e s For F i r s t O f f e n d e r T r e a t m e n t g r o u p s , Age Less Than 25 Yea r s : F i r s t MoVing V i o l a t i o n Or Any A / R O f f e n s e . . . . . . . . . . . . . . . . . . . ~ . . . . . . : . . . . . . . . . . . . . . . 39
Plot of Cumulative Survival Rates For First offender Treatment Groups, Age 25 Years or Oideri iEirst Accident ... ...... : ..... ...... ,..... 40
P l o t o f C u m u l a t i v e S u r v i v a l Ra te s f o r F i r s t O f f e n d e r T r e a t m e n t G r o u p s , A g e 25 Years o r O l d e r : F i r s t DUI or R e c k l e s s l ) r i v i n g Offense• 41 , . . . . . : , . . . . . . . . * . . . . . . . . . .
P l o t o f C u m u l a t i v e S u r v i v a l Ra te s f o r F i r s t Of fend .e r T r e a t m e n t g r o u p s , Age 25 Years o r O l d e r : F i r s t i4oving V i o l a t i o n or
, 42 Any A/k O f f e n s e . . . . . . . . . . • . . . . . . . . . . . . . . . . . . . .
P l o t Of C u m u l a t i v e S u r v i v a l Ra te f o r F i r s t O f f e n d e r T r e a t m e n t Groups , S o c i a l D r i n k e r s : F i r s t A c c i d e n t . . . . . . . . . . . . . . . . . . . . . . . . . . . . . . . . . . . 43
P l o t o f C u m u l a t i v e S u r v i v a l R a t e s For F i r s t O f f e n d e r • T r e a t m e n t Groups , •Soc ia l D r i n k e r s : F i r s t DUI o r ~ 6 c k l e s s D r i v i n g O f f e n s e . . . . . . . . . . . 44
v i " .

F IGUP, E 13
1: I tilJRI:, 14
F I ( ; UR E 15
!: IGURE 16
F I.GURE 17
FIGURE 18
FIGURE 19=
F I(;URE 20.
F I(;URE 21
FIGURE ~?
FIGURE 23
FIGURI; 24.
FIGURE 25
P l o t o f C u m u l a t i v e S u r v i v a l . R a t e s f o r F i r s t O f f e n d e r T r e a t m e n t G r o u p s , S o c i a l D r i n k e r s : F i r s t Hovi.n~ V i o l a t i o n o r Any A/R O f f e n s e . . . . . . . . . . . -15
P l o t o f C u m u l a t i v e . q u r v i v a l : R a t e s F o r F i r s t O f f e n d e r T r e a t m e n t ( ; r o u p s , .~.tidran!,e t ' i r ob l em D r i n k e r s : F i r s t A c c i d e n t . . . . . . . . . . . . . . . . . . . . . . . . . . 46
P l o t o f . C u m u l a t i v e " i u r v i { , a l . , R a t e s F o r . F i r s t O f f e n d e r T r e a t m e n t G r o u p s , P. i d r a n g e P r o b l e m D r i n k e r s : F i r s t DUI o r R e c k l e s s D r i v i n g O f f e n s e . . . . . . . . . . . . . . . . . . . , . 2 . . . . . . . . : . . . . " . . . . . . . . . . 47
P l o t o f C u m u l a t i V e S u r v i w i l R a t e s F o r F i r s t • O f f e n d e r T r e a t m e n t G r o u p s , M i d r a n g e P r o b l e m
D r i n k e r s : F i r s t _ .~,loving V i o l a t i o n o r Any A/P, Ot~fens,e . . . . . . . . . . . . . . . . . . . . . . . . . . . . . . . . . . • . . . . . . . . . . 48
P l o t of Cumulative S u r v i V a l R a t e s [ : o r F i r s t O f f e n d e r T r e a t m e n t G r o u p s , S e v e r e P r o b l e m D r i n k e r s : F i r s t A c c i d e n t . . . . . 49
P l o t o f C u m u l a t i v e S u r v i v a l R a t e s F o r F i r s t O f f e n d e r T r e a t m e n t . G r o u p s , S e v e r e P r o b I e m D r i n k e r s : F i r s t I)UI: o r R e c k l e s s D r i v i n g O f f e n s e " . . . . . . . . . . . . . . . . . . . . . . . . . 50
PlOt o f , C u m U l a t i v e S u r v i v a i R a t e s For F i r s t O f f e n d e r T r e a t m e n t ( ; r o u p s , S e v e r e P r o b l e m D r i n k e r s : F i r s t M o v i n g V i o l a t i o n o r Any A/R O f f e n s e . . . . . . : . . . . i . . , . . . . . . . . • . . . . . . . . . . . . . . . . . . . . 51
P l o t o f C u m u l a t ire S u r v i v a l R a t e s . F o r b l o n i t o r i n g l , e t t e r and No M o n i t o r i n g L e t t e r C, r 0 u p s : F i r s t : \ c c i d e n t . . . . . . . . . . . . . . . . . . . . . . . . . . . . . 56
P l o t o f Cumulative S u r v i v a l P, a t e s F o r M o n i t O r i n g L e t t e r and No H o n i t o r i n g L e t t e r G r o u p s : F i r s t DUI o r R e c k l e s s D r i v i n g O f f e n s e . . . . . 57
P l o t o f C u m u l a t i v e S u r v i v a l Rates For M o n i t o r i n g L e t t e r and NO M o n i t o r i n g L e t t e r G r o u p s : F i r s t . Movinii, V i o l a t i o n o r A n y A/R O f f e n s e . . . . . . . . . . . . . . . . 58
P l o t • o f C u m u l a t i v e S u r v i v a l R a t e s F o r F o l l o w - I I l ~ and No F o l l m q - U p G r o u p s : F i r s t A c c i d e n t . . . . . . . . . . . 59
P l o t " 0 . f . C u m u l a t i v e S u r v i v a l P, a t e s F o r F o 1 1 0 w - u p : and No Follow-Up G r o u p s :- F ] . r s t D U I o r R e c k l e s s
D r i v i n g O f f e n s e ' . . . . . . . . 60
P l o t o f C u m u l a t i v e S u r v i v a l Rat~,s F o r Fo i l ow- -Up a n d N o F o l i o w - U p G r o u p s : F i r s t ~.lovin(: V i o l n t i o n o r A n y A/R O f f e n s e . . . . . . . . . . . . . . . . . . . . . . . . . . . . . . . . . 61
vii

/
't
T E ,'-: T
LIST Ol: TABI,ES . , . •
/:i ' "
T A B L I ! 1 Exam ple S u r v i v a l l ) a t a T a b l e . . . . . . . . . . . . . . . , : . . . . . . . .
T-~BLI- 2 . a Summary o f C u m u l a t i v e Survi-~31 R a t e s a,* S e l e c t e d T i m e I n t e r ~ a l s ~ F i r s t O f f , r u d e r
' T r e a t m e n t . ' ( ; r o n p . . . . . . l ' " ; " : i " " " ' " " . . . . . . . . . . .
TABLE 2 . b Summary o f A c c i d e n t and V i o l a t i o n R a t e s a t S e l e c t e d Time I n t e r v a l s : F i r s t O f f e n d e r T r e a ' t m e n t Group
TABLE 2. c Relative Order of C u m u l a t i v e Survival Rates a t S e l e c t e d Time Intervals: Fi r .~ t O f f e n d e r T r e a t m e n t G r o u p s . . . . . . . . . . . . . . . . . . . . . . . . . . . . . . . . -
TAB I,E .3.a
3:b
summary of C u m u l a t i v e S u r v i v a l , R a t e s a t S e l e c t e d T i m e I n t e r v a l s : T o t a l C o n t r o l Group A s s i g n m e n t s v e r s u s N o n - V o l u n t e e r s . . . . . . . . . .
Su.mmary o f A c c i d e n t and V i o l a t i o n R a t e s a t S e l e c t e d Time I n t e r v a l s : T o t a l C o n t r o l G r o u p A s s i g n m e n t s v e r s u s N o n - V o l u n t e e r s . . . . . . . . . .
T.XBLE
'!'ABLE
TAI]Lt:
3.c Relative Order oF Cumulative Survival Rates atSelected Time Intervals" Total Control Croup As s i !Inment .~ ve r su s Non-Vo lunt eer s ....... :..
4.a Sununary of Cumulative Sm'vival Rates at Seiected Time Intervals: Letter Honitoring vs. No Letter ~k)nitorin£ and Follow-Up vs.
No Follow-Up . ° " " " " . . . . . . . . , , . , . . , . • ° • • . ° , . • • • , -- ° .
4 b Summary of A,,:cident and Violation Rates at Selected Time IntervaIs: I,etter Honitorjng vs, No Letter },ilonitor]ng and Follow-Up vs.
No F o l l o w - U p . . . ~ . . . . . . . . . . . . . . . . . . . . . . . . . . . . . . . . .
• • ) ....
1ABI,E 4 . c R e l a t i v e O r d e r o f C u m u l a t i v e S u r v i v a l R a t e s a t S e l e c t e d "[ilr, e i n t e r v a l s : L e t t e r ! ! 0 n i t 6 r i n g v s . No l , e t t e r } ! o n i t o r i n g and F o l l o w - U p v s . ?!o Fol low-Up . . . . . . . . . . . . . . . . . . . . . . .
\PPEND 1X B
iAI~I.E ,,D] .
"fABLI! B1 .b
TABLE B1 .c
Control Group Survival Data: First Accident . . . . .
tlome S t u d y C, r o u p S u r v i v a l D a t a : F i r s t A c c i d e n t . .
I n - C l a s s (~roup Survival D a t a : F i r s t A c c i d e n t . . . .
Page
16
25
28
29
32
32
32
53
$3
54
85
84
85
viii
• " ' . ' " " " i
TABLE B l . d S u r v i v a : l , . D a t a l o t , t h e S a m p l e o f N o n - . ! : : i ~ • V o l u n t e e r s , : F i r s t A C c i d e n t . . . . . . . . . . . . . . . . . : . . . : . 86
TABLE
• TABLE
.. •
TABLE
TABLE
B 1. e C o m p a r i s o n . o f F i r s t O f f e n d e r T r e a t m e n t . ( ; r b u p s U s i n g . t : h e l ,ee. .Dest , S t a t i s t i c : F i r s t A c c i d e n t . . . . . 87
B l . . f C o m p a r i s o n o f F i r s t O f f e n d e r T r e a t m e n t G I : o u p , , a n d t h e . N o n , V o l u n t e e r : SampFe U s i n g t h e LEO-
Desu S t a t i s t i c : F i r s t A c d l d e n t . . . . . . . . . . . . . 88
B 2 . a C o n t r o l G ro u p S u r v i v a l D a t a : F i r s t .DtJi o r , R e c k l e s s D r i V i n g O f f e n S e . . . , . . , , . . . . . " . . . . . . . . . . . . . . . . 90
B2 .b l l o m e S t u d y G r o u p S t i r v i V a i D a t a : F i r s t DUI o r R e c k l e s s D r i v i n g O f f e n s e . . . . . . . . . . . . . . . . ..: . . . . . . . . . 91
TABLE B 2 . c
TABLE B2 .d
I n , C l a s s Group S u r v i v a l D a t a F i r s t DU[ o r R e c k l e s s D r i v i n g o f f e n s e • 92
S u r v i v a l D a t a f o r t h e S a m p l e . ~ o f N 0 n - V o l u n t e e r s : First DUI or Reckless Driving Offense 93
TABLE B2. e C o m p a r i s o n o f F i r s t O f f e n d e r T r e a t m e n t . G r o u p s U s i n g t h e l , e e - D e s u S t a t i s t i c : F i r s t DUI o r R e c k l e s s D r i v i n g O f f e n s e . . . . . . . . . . : . . . . . . . . . . . . . . . . 94
TABLE B2 .g C o m p a r i s o n o f F i r s t O f f e n d e r T r e a t m e n t G r o u p and t h e N o n - V o l u n t e e r S a m p l e U s i n g t h e Lee- '
• , Desu S t a t i s t i c : F i r s t DUI o r R e c k l e s s D r i v i n g O f f e n s e . . . . . . . . . . . . . . . . . . . . . . . . . . . . . . . . . . . . . . . . . . . " 95
TABLE B 3 . a C o n t r o l G r o u p S u r v t v a i D a t a : F i r s t b i o v i n g V i o l a t i o n o r Any," A/R O f f e n s e 9 7
TABLE B3. b tlome S t u d y Cro u p S u r v i v a l D a t a : F i r s t b lov ing V i o l a t i o n o r Any A/R O f f e n s e . . . . . . . . . . . . ~ . . . . . . . . . . . 98
TABLE B3 . c
TABLE B 3 . d
TAB LI! B3. e
T A B L E B 3 . f
TABLE B4. a
I n - C l a s s G ro u p S u r v i v a l D a t a : F i r s t Mo v in g V i o l a t i o n o r A n y A/R O f f e n s e . . . . . . . . . . . . . . . . . . . . . . . 99
S u r v i v a l D a t a F o r t h e S a m p l e o f N o n - V o l u n t e e r s : F i r s t b iov ing V i o l a t i o n o r Any A/R O f f e n s e . . . . . . . . . 1 0 0
C o m p a r i s o n o f F i r s t O f f e n d e r T r e a t m e n t G r o u p s U s i n g t l i e L e e - D e s u S t a t i s t i c : F i r s t ~4oving V i o l a t i o n o r Any A/R O f f e n s e . : . . . . . . . . . . . . : . . . . . . . . 101
Comparison of Firstl Offender Treatment Groups and theNon-VolunteerSample Using the l,ee- Desu Statistic: First Hoving Violation or Any.A/R:Offense ....'...;..,... ...... • ......... ....... 102
Control • Group Survival Data for Age Less Than 25Years: FirSt Accident .... • ..... 104
i x
TABLE B 4 . b
TABLE B4. c
TAB I,E B4. d
TABLE BS.a
T~BLE B5 .b
TABLE BS.c
TABLE B5. d
TABLE 136. a
TABLE B6. b
TABLE B6.c
TABLE B6.d
TABI,E B7. a ....
TABLE B7.,b {
T.hBLE B7.c
Home S t u d y Group S u r v i v a l - D a t a f o r Age ! ; : : Less Than 25 Years~: . F i r s t A c c i d e n t . . . . . . . . . . . . . . 105
I n - C l a s s (;rour~ S u r v i v a l Da,ta f o r Age Less , : ; - . Than 2'5 Y e a r s : F i r s t Accdden t . . . . . . . . . . . . . . . . . . . 106
C o m p a r i s o n of, F i , r s t O f f e n d e r T r e a t m e n t Groups f o r Age Less Than 25 Yea r s Using t h e L e e - D e s u S t a t i s t i c : F i r s t A c c i d e n t . . . . . . . . . . . . , . . . . . . . . . . . 107
Control Group Survival Data For Age Less Than 25 Years: First DUI or Reckless Driving Offense . . . . 108
llome S t u d y Group S u r v i v a l Data !:or Age Less Than 25 Y e a r s : F i r s t DUI o r Reck: less D r i v i n g O f f e n s e . . . . . . . . . . . . . . . . . . . . . . . . . . . . . . . . . . . . . . . . . . . . 109
I n - C l a s s Group S u r v i v a l Data For Age Less Th/in 25 Y e a r s : F i r s t DiJI o r R e c k l e s s l ) r i v i n g O f l e n s e . . . . . . . . . . . . . . . . . 110
C o m p a r i s o n O f F i r s t O f f e n d e r T r e a t m e n t Groups For Age Less "rhan 25 Y e a r s , u s i n g t h e Lee -Desu S t a t i s t i c : F i r s t D U I o r R e c k l e s s D r i v i n g O f f e n s e 111
C o n t r o l Group S u r v i v a l Data For Age Less Than 25 Y e a r s : F i r s t Hoving V i o l a t i o n o r Any A/R O f f e n s e 112
Home Study Group Survival Data for Age Less Than 25 Years: First Moving Violation or
Any A/R Offense 113
In-Class GroUp Survival Data For Age Less Than 25 Years: First Hoving Violation or Any A/R Offense ....... . ..... ..... • . 114
Comparison of First Offender Treatment Groups for Age Les s Than 25 Years, Usin~ the Lee-Desu Statistic: First Moving Violation or Any A/R
Offense ................ r- ....... ....... .... ..... .. ll5
C o n t r o l G r o u p ~ ;u rv iva l D a t a For Age 25 Yea r s o r O l d e r : F i r s t A c c i d e n t . . . . . . . . . . . . . . . . . . . . . . . . 116
florae Study Group Survival Data For Age 25 Years or Older: Fi:rst Accident .................. 117
In-Class Group Survival Data For ~,ge 25 Years or Older: First Accident . .... . ............ 118
- .[
X

TABLE B71d
TABLE B8.a
'FABLE B8 .b
,]'ABLE B8.c
TABLE B8. d
"FABLE B9.a
TABLE B9.b
TABLE B9.c
TABLE B9.d
TABLE B10. a
TABLE B10 .b
FABLE B10.c
TABLE B10.d
TABLE B i l : a
Comparison o f F i r s t O f f e n d e r "Freatment'~ UCd~ips For Age- ,25 .Years :or O l d e r , u s ing the Lee-l)esu S t a t i s t i c : F i r s t Acc iden t ' ~ . . . . . . . . . . . . . . . . . . . . . . . . 119
Cont ro l Group S u r v i v a l Data For Agei25 Y'ears or Older : F i r s t I)UI or R e c k i e s s - D r i v i n g Offense• "" . . . . . . - ' . . . . . . • - .: - • -••120
florae Stud:y Group SUrVival D a t a F o r Age 2 5 Years or Older." F i r s t DUI or R e c k l e s s Dr iv ing O f f e n s e . . . . . . . . . . . . . . . . . . . . . . . . . . . . . . . . . . . 121
I n : C l a s s Croup, S u r v i v a l Data For Age 25 Years o r O l d e r : F i r s t DUI o r R e c k l e s s D r i v i n g O f f e n s e
• " - . - - - . . - - . - . . - . . . . . . . . . . . . . . . . . . . 122
COmparison Of F i r s t O f f e n d e r Tr~eatment Croups For Age 25 Y e a r s Or O l d e r , Using ti le Lee-Desu Statistic: First DUI or Reckless Driving O f f e nse 123
Cont ro l Group SurViva i Da ta For Age 25 Years or O l d e r : F i r s t Moving. Vio la t : ion or Any A/R Of fense • . .22 . . . . ; ' ' , . . . . . . . . - . ~ i . . . . . . . . . . . . . . . . . . . . 1•24
7 , . •
ltome S t u d y i;roup S u r v i v a l Data For Age 25 Years or O lde r : F i r s t ~1oving V i o l a t i o n o r Any A/R O f f e n s e 125
I n - C l a s s Group S u r v i v a l Data f o r Age 2 5 Years or O lde r : F i r s t Moving V i o l a t i o n or
Any A/R O f f e n s e . . . . 126
Comparison Of F i r s t O f f e n d e r T rea tmen t Groups f o r Age 25 Years o r O lde r , u s i n g the Lee-Desu S t a t i s t i c : F i r s t btoving V i o l a t i o n o r Any A/R Of fense . . . . . . . . . . . . . . . : . . . . . . . . . . . . . . . . . . . . . . . . . . . . 127
Cont ro l Group • S u r v i V a l Data For S o c i a l D r i n k e r s : F i r s t Acc iden t
' * * * * * * * * * * * * * * * * * * * * * * * * * * * * * * * * * * * * 1 2 8
ttome Study Group S u r v i v a l Data For S o c i a l D r i n k e r s : F i r s t A c c i d e n t . . . . . . . . . . . . . . . . . . . . . . . . . . . . . 129
I n = c l a s s Group S u r v i v a l Data F o r S o c i a l DrTnkersi F i r s t ,Acc iden t . . i . . . . . . . . . . . . . . . . . . . . . 130
Comparison o f F i r s t O f f e n d e r T rea tmen t Groups For S o c i a l D r i n k e r s , . Us:ins t he Lee- Desu s t a t i s t i c : F i r s t A c c i d e n t 131
Cont ro l Group S u r v i v a l Data For S o c i a l Drinkers~ F i ' r s t DllI or Reck l e s s Dr iv ing O f f e nse 132
TABLE. B11 .b
TABLE Bll.c
TABLE Bll.d
TABLE B12 .a
TABLE B12.b
TABLE B12 .c
TABLE B12.d
TABLE BlS.a
TABLE Bl3.b
TABLE B13 ,c
TABLE Bl3.d
TABLE B14 . a
TABLE Bl4.b
TABLE Bl4.c
• , , . ,
, % :
ltome S t u d y Group S u r v i v a l Data f o r Soc i / a l (- D r i n k e r s : F i r s t DUI o r : R e c k l e s s D r i v i n g O f f e n s e . . . . . . . . . . . . . . . . . . . . . . . . . . . . . . 133
In-Class GroupSurvival Data for Social DrinkerS: First DUI or Reckless Driving o f f e n s e 134
Comparison of First Offender Treatment Groups for~Social Drinkers, Using the Lee-Desu Statistic: First DUI or Reckless Driving Offense 135
Control Group survival Data For Social Drinkers: First Moving Violation or Any A/R Offense ........ 136
Home Study Group Survival Data For Social Drinkers: First Moving Violation or Any A/R Offense ...................................... 137
In-Class Group Survival Data For Social Drinkers: FirstMoving Violation or Any A/R Offense ...................................... 138
Comparison of First Offender Treatment Groups For Social Drinkers, Using the Lee-Desu Statistic: First Moving Violation or Any A/R Offense 139
Control Group Survival Data For Midran~e Problem Drinkers: First Accident 140
ltome S t u d y Grou p S u r v i v a l Data For M i d r a n g e P r o b l e m D r i n k e r s : F i r s t A c c i d e n t . . . . . . . . . . . . . . . . 141
i n - C l a s s Group S u r v i v a l Data For M i d r a n g e P r o b l e m D r i n k e r s : F i r s t A c c i d e n t . . . . . . . . . . . . . . . . . 142
Comparison of First Offender Treatment Groups For Midrange Problem Drinkers, Using the Lee- Desu Statistic: First Accident .................. 143
Control Group Survival Data for ~lidrange P r 0 b l e m D r i n k e r s : F i r s t DUI o r R e c k l e s s D r i v i n g O f f e n s e . . . . . . . . . . . . . . . . . . . , . . . . . . . . . . . . . . 144
Home S t u d y S u r v i v a l Data f o r M i d r a n g e P r o b l e m D r i n k e r s : F i r s t DUI o r R e c k l e s s D r i v i n g O f f e n s e . . . . . . . : . . . . . . . . . . . . . . . . . ~ . . . . . . . . • . . . . . . . 145
In-Class Group Survival Data For ~lidrange Problem Drinkers: First DUI or Reckless Driving Offense ...... ..; ..... ; .................... 146
J ~J
xil
t
2,'
i
W'

I'ABI,E Bl4 .d
TABI,E B15.a
TABI~E B15.b
TABLE B l 5 . c
TABLE B1S.d
'FABLE B16.a
TABLE B l 6 , b
TABLE B16.c
TABLE B16.d
TABLE B17 .-a
TABLE B17.b
TABLE B17.c
T.,% 8LE B17.d
TAI~ LE B lg . a
Compar ison o f F i r s t O f f e n d e r T r e a t m e n t d ro f lps f o r ~I idrange Problem l ) r i n k e r s , Using t h e Lee- Desu S t a t i s t i c : F i r s t DUI or R e c k l e s s [ ) r i v ing O f f e n s e . . . . . . . . . . 147
, . . . . . . . . . . . - . . - : 7 : . . . . . . .
C o n t r o l Group S u r v i v a l Da ta For Mid range Problem D r i n k e r s : F i r s t Moving V i o l a t i o n
o r Any A/R O f f e n s e . . . . . . . . . . . . . . . . . . . . ; . . . . . . . . . 148
Home S tudy Group S u r v i v a l Data For Mid range Problem D r i n k e r s : F i r s t Moving V i o l a t i o n o r Any A/R O f f e n s e , 149
I n - C l a s s Group S u r v i v a l Data For Midrange Problem D r i n k e r s : F i r s t Hoving V i o l a t i o n or Any A/R O f f e n s e . . . . . . . . . . . . . . . . . . . . . . . . . . . . . . . . . . i50
Compar ison o f F i r s t O f f e n d e r T r e a t m e n t G r o u p s For Midrange Problem D r i n k e r s , Us ing t h e Lee- Desu S t a t i s t i c : F i r s t Moving V i o l a t i o n o r Any A/R O f f e n s e . . . . . . . . . . . . . . . . . . . . . . . . . . . . . . . . . . . 151
C o n t r o l Group S u r v i v a l D a t a For S e v e r e Problem D r i n k e r s : F i r s t A c c i d e n t . . . . . . . . . . . . . . . . . 152
tlome S t u d y Group S u r v i v a l Data For S e v e r e P r o b l e m D r i n k e r s : F i r s t A c c i d e n t 153
I n - C l a s s (;roup S u r v i v a l Data For S e v e r e Problem D r i n k e r s : F i r s t A c c i d e n t . . . . . . . . . . . . . . . 1 5 4
Compar ison o f F : i r s t O f f e n d e r T r e a t m e n t G r o u p s For Seve re ProbJern D r i n k e r s , P s i n g t h e L e e . Desu S t a t i s t i c : F i r s t A c c i d e n t 155
C o n t r o l (;roup. S u r v i v a l Data F o r . S e v e r e Problem D r i n k e r s : F i r s t Dill o r R e c k l e s s D r i v i n g O f f e n s e 156
t{ome Study Group Survival Data For S e v e r e Problem D r i n k e r s : F i r s t DUI o r R e c k l e s s D r i v i n g O f f e n s e . . . . . . . . : . . . . . . . . . . . . . . . . . . . . . . . . 157
in-Class Group Survival Data for Severe Problem Drinkers: First DUI or Reckless Driving Offense ................................. 158
Compa#ison of First Offender Treatment Groups For Severe Problem Drinkers, using the Lee-Desu Statistic: First DUI or~ Reckless Driving Offense ............. . .. .... .............. ~ ...... 159
C o n t r o l Group S u r v i v a l • Data F o r •Severe Problem D r i n k e r s : F i r s t Moving V i o l a t i o n or An)- A/R O f f e n s e . . . . . . . . . . . . . . . . . . . . . . . . . . . . . . . 160
xlli

,'r" " - • ,ABLL ~I18 b
TABLE B18.c
TABLE B18.4
APPENDIX C
TABLE C l . a
TAIH,E ,C l .b
TABI,E C l . c
TABI,E C2 .a
TABLE C2 .b
TABLE (.2 c
T:\B I,E C3. a
TABLE C3. b
TABLE C3. c
T,\IiLI- C:I .a
llo.me S t u d y Group S u r v i v a l Data For Selvere P r ob l em D r i n k e r s : l : i r s t Hoving V i o l a t i o n o r Any A/R O f f e n s e : . ; . . . . . . . . ,. . . . . . . . . . . . . . . . . . . . 161
I n - C l a s s ( ;roup S u r v i v a l D a t a For S e v e r e P rob l em D r i n k e r s - F i r s t Hov ing V i o l a t i o n o r Any A/R O f f e n s e . . . . . . . . . . . . . . . . . . . . . . . . . . . . . . 162
Compar i son Of F i r s t O f f e n d e r T r e a t m e n t Croups For S e v e r e Prob iem D r i n k e r s , Us ing t h e Lee -Desu S t a t i s t i c : F i r s t DUI o r Any A/R O f f e n s e 163
S u r v i v a l Data For C l i e n t s Receiving Q u a r t e r l y H o n i t o r i n g l , e t t e r s " F i r s t A c c i d e n t . . ; . . . . . . . . . . . i 66
S u r v i v a l Data For C l i e n t s Not R e c e i v i n g Q u a r t e r l y H o n i t o r i n g L e t t e r s : F i r s t A c c i d e n t . . . 167
C o m p a r i s o n o f H o n i t o r i n g L e t t e r and No ~ ' l o n i t o r i n g L e t t e r G r o u p s , Using t h e Lee - Desu S t a t i s t i c " F i r s t A c c i d e n t . . . . . . . . . . . . . . . . . 168
S u r v i v a l Data For C l i e n t s R e c e i v i n g Q u a r t e r l y H o n i t o r i n g I , e t t e r s : F i r s t DUI o r R e c k l e s s D r i v i n g O f f e n s e 169
S u r v i v a l Da t a For C l i e n t s Not R e c e i v i n g Q u a r t e r t y ~ I o n i t o r i n g L e t t e r s : F i r s t DUI o r R e c k l e s s D r i v i n g O f f e n s e . . . . . . . . . . . . . . . . . . . . . . . . 170
Compar iSon o f 5 t o n i t o r i n g L e t t e r and No ~'Ionitorin~,, L e t t e r ( ; r o u p s , Us ing t h e l , e e - Desu s t a t i s t i c . F i r s t DUI o r R e c k l e s s D r i v i n g Of f ' ense " 171
S u r v i v a l Data For C l i e n t s R e c e i v i n g Q u a r t e r l y H o n i t o r i n g l , e t t e r s : F i r s t Hoving V i o l a t i o n o r Any A/R O f f e n s e . . . . . . . . . . . . . . . . . . . . . . . . . . . . . . 1 7 2
S u r v i v a l Data For C l i e n t s Not R e c e i v i n g Q u a r t e r l y H o n i t o r : i n g L e t t e r s : F i r s t , H o v i n g V i o l a t i o n ? o r Any A/R O f f e n s e . . . . ; . . . . . . . . . . . . . . . 173
C o m p a r i s o n o f H o n i t o r i n g L e t t e r and No H o n i t o r i n g L e t t e r Groups Us ing t h e Lee - Desu S t a t i s t i c : F i r s t Hoving V i o l a t i o n o r Any A/R O f f e n s e . . . . . . . . . . . . . . . . . . . . . . . . . . . . . . . . . . 1,74
S u r v i v a l Data F0'. C l i e n t s A s s i g n e d To F o l l o w - U p I n t e r v i e w s " F i r s t A c c i d e n t ' 175 •
xiv

TABLE C 4 . b
TABLE C4 . c
TABLE C5..a
TABLE C5. b
TABLE C5.c
TABLE C6.a
TABLE C6.b
]'ABLE C6.c
S u r v i v a l D a t a F o r C l i e n t s No t A s s i g n e d t o F o l l o w - U p I n t e r v i e w s : F . i r s t . A c c i d e n t ~ .~ . . . . . . . . . . 176
C o m p a r i s o n Of F o l l o w - U p and No F o l l o w - U p G r o u p s , U s i n g t h e l , e e - D e s u S t a t i s t i c : F i r s t A c c i d e n t . . . . , . . . . . . . . . . . . . . . . . . . . . . . . . . . . . : 177
Survival Data For Clients Assigned to Follow-Up Interviews: First DUI or Reckless Driving Offense .... ....... ...; ................... 178
S u r v i v a l D a t a F o r C l i e n t s Not A s s i g n e d : t o F o l l o w - U p I n t e r v i e w s : F i r s t DUI o r R e c k l e s s D r i v i n g O f f e n s e " " • 179
Comparison of Follow-Up and No Follow-Up Groups, Using the Lee-Desu Statistic: First DUI or Reckless Driving Offense .................. 180
Survival Data For Clients Assigned to Follow-Up Interviews: First ~Ioving Violation or Any A/R Offense . ......... ! 81
Survival Data For Clients Not Assigned to Follow-Up Interviews: First ~4oving Violation or Any A/R Offense ............................... 182
C o m p a r i s o n o f F o l l o w - U p and No F o l l o w ' - U p ' .. Groups, Using the Lee-Desu Statistic: First ~!oving Violation or Any A/R Offense 183
x-V

Abbreviation or Term
- - . .
LIST OF. ABBREVIAT-I.ONS! AND DEFINITIONS • ". !-. i
ExPlanation
DUI Driving Under the Influence of~Alc0hoi or Alcohol andDrugs
CDUI.Project or CDUI
BAC
ASAP
NHTSA
ComprehensiveDriving Under the Influence of Alcohol Offender Treatment
,Demonstration Project . .
Blood AlcoholContent
Alcohol Safety Action-Project
National Highway Traffic Safety. Administration
A/R Alcohol Related
DMV~
Follow-u p Interviews
California Department of Motor Vehicles
A series of three in-depth personal interviews administered prior to entering treatment and again at I0 months and 20 months from the initial interview, used•to assess life changes
-resulting from the. treatment inter- ventions.
I,AI
Letter Monitoring
Exposure Time
Life Activities Inventory , the follow-up interview protocol and questionnaires.
An experimental procedure in which clients were mailed letters on quarterly basis toperiodically remind them that they were on informal probation for twoyears..
The~length of time between the date of random assignment to one of the treat- ment conditions and the date of the latest DMV records search. This is the period of time during which clients were exposed tO the risk of rearrest or accident involvement anddur{ng which such outcome measures could be officially recorded.
xvi

Abbreviation or T e r m
Survival Rate
Statistically Significant Difference
LIST OF ABBREVIATIONS AND D E F I N I T I O N S • ( C o n t . ! d . ) : , :,. , ,
Explanation . " . ... . .
The proportion of Clients for-whom outcome events (violations, accidents, etc¢) were not detected dUring a. specific exposure time period. The converse of rearrest and accident rates.
A difference between treatment groups on an outcome measure (e.g.; DUI " survival rate) that was unlikely to have resulted from pure chance. In the present study any differencethat could be obtained by chance, only ten or fewer times out of 100 was con- sidered statistically significant.
First offender DUI
M u i t i p l e O f f e n d e r DUI
Reckless Driving Offense
A person With only one officially recorded.conviction for DrivingUnder the influence of Alcohol.
A person with two.or more officially recorded convictions for Driving Under the Influence of-Alc6hol.
The most common charge reduction from DUI. It was standard Practice for Sacramento Municipal Court to reduce low BAC cases (.12 or less) to reckless driving.
SB 38
PCPS
California State Senate Bill No. 38, the legislation,Which permitted multiple DUI offenders to participate in alcohol treatment programs in lieu of license suspension.
Post-Conviction Presentence, a special court referral procedure used by Sacramento Municipal Court for multiple DUI offenders with only one prior DUI conviction. Theprocedure involved accepting a guilty plea'to DUI .but postponing sentencing for 13 months. If the client successfully completed treatment during this period the -charge was reduced to reckless driving. 'Inadequate participation resulted in
' " .... sentencing on the original charge of " DUI.
. .

A b b r e v i a t i o n
o r T e r m
Control Group
Home Study
LIST OF ABBREVIATIO~NS AND DEFINITIONS ( C o n t ' d . ) " " :
Explanation
DUI offender clients randomly assigned to a no-treatment condition, i.e., they were not required to attend education or counselingprograms.
A self-study, self-paced alcohol traffic safety education program.
In-Class Education An Alcohol Traffic Safety School whichconsisted of four, 2% hour classsessions ~
Non-Volunteer Sample
Social Drinker
Severe Problem Drinker
Persons convicted of their first DUI offense or who had their original DUI charge reduced to reckless driving but who Chose to pay a higher fine in lieu of par- ticipation in the CDUI Project,s education programs. .
A DUI offender who appeared tb have only a modest tolerance to. alcohol, who did not regularly drive at illegal blood alcohol levels, and who was unlikely to be rearrested for DUI ~ A Subjective diagnostic classification.
.' . .'
A DUI offender who showed symptoms • of physical or strong psychological addiction to alcohol, heavy frequent drinking, high level of tolerance-- capable Of functioning at hig h BAC levels,and who evidenced significant life problemsresulting from alcohol abuse. A subjective diagnostic classification.
MidiRange Problem Drinker
xvlii
A DUI offender who could not be classified as a social drinker but whose drinking problem s were not as advanced as a severe problem drinker. .Rersons in this broad category
evidenced a variety of excessive • drinking patterns, moderate but not ~extreme!y high tolerance to alcohol, andwere often developing life problems related to their excessive drinking haSits. A subjective diagnostic classification./
INTRODUCTION
D e m o n s t r a t i o n P r o j e c t O b j e c t i y e s . i . ,
The Comprehens ive D # i v . i n g U n d e r t h e I n f l u e n c e Of A l c o h o i O f f e n d e r
• T r e a t m e n t D e m o n s t r a t i o n . ~ P r o j e c t , a b b r e v i a t e d CDU,I P r o j e c t , was i m p l e m e n t e d
t o d e t e r m i n e t h e . e f f e e t i v e n e s s : : o f a l c o h o l e d u c a t i o n a n d e d u c a t i O n a l . • .
Counseling programs as traffic safety countermeasures, comparativeiy
short-term alcohol traffic s'afety education programs were provided to •
persons having only one recorded conviction for driving~under the •
influence ofalcohol (DUI), while more comprehensive, longer-t~erm educa-
tional counseling programs were provided , with or without chemotherapy
treatment, to persons having two or more convictions ~ for driving under
the influence.
Through the assignment of a proportion of DUI offenders to a no
treatment control condition, each program's • potential forreducing
accidents and driving violations, as well as inducing positive life
changes could be assessed relative ~o those offenders who were not
. provided treatment. '
Background
The Highway Safety:Act of 1967 • required the Secretary of Transportation
to conduct an investigationinto the role of alcohol in highway traffic
• safety. The resulting report presented•to the Congress in 1968" detailed
the extent• O f death and property damage due t0 drunk driving,•and high-
lighted the overrepresentation of problem drinkers in fatal alcohol
related accidents.
An assessment of existing procedures to control drunk driving indi-
cated that in most Communities there was little awareness Of the magnitude
of the drunkdriving Problem among th e general public, and even among
professional groups, such as police, judges, educators and therapists
Concerned with the traditional treatment•of alcoholics. •Consequently,
few communities provided police • officers with specialized training in
the detection and apprehension of drunk drivers, there were•few systematic
Court referral mechanisms to r~fer potential problem drinkers tO appro-
priate treatment programs , an d there were few• educationand counseling,
~U.S.• Department of Transportation•: Alcohol and Highway Safety/, a Report to the Congress from the Secretary of Transportation , August 1968. •
programs app rop r i a t e for non-problem (soc ia l ) d r inke r s or persons with
only moderate d r ink ing problems. " " ~ " "
In response to these f i n d i n g s . t h e . National Highway Traff ic . Sa fe ty
Admin i s t r a t ion (NHTSA) i n i t i a t e d a major a lcohol t r a f f i c s a f e t y p r o g r a m
in 1 9 7 0 . TheNHTSA program involved the establ, ishment. .(between. January
1971 and September i 9 7 2 ) o f 35.Alcohol Safety Action P r o j e c t s (ASAP's)
throughout the C o u n t r y . The under ly ing concept of a l l the ASAP's was
to develop a drinking.driver control system,an integrate d set of ,
countermeasures which would identify Problem drinkers on the road,
make judicial decisions regardingthe most appropriate sanctions and
rehabilitative procedures in a timely and efficient manner, and put
the rehabilitative procedures into effect.
The primary. ASAP objectives were to:
Demonstrate the feasibility of a systems.approach for dealing
with the drinking-driving problem, and to.demonstrate the
approach can save l i v e s . .
Urge each s t a t e to improve i t s sa fe ty programs in a l coho l
t r a f f i c s a f e ty .
. Evaluate i n d i v i d u a l countermeasures as adequa te ly as p o s s i b l e
given the s imultaneous a p p l i c a t i o n of an e n t i r e System Of
c o u n t e r m e a s u r e s a t each s i t e .
In gene ra l , the ASAP's were success fu l in a t t a i n i n g t h e i r most
immediate, o b j e c t i v e s . There w a s a s u b s t a n t i a l i nc rease in awareness
of the a lcohol t r a f f i c s a f e t y problem, new alcohol s a f e t y laws were
enacted , and countermeasure procedures were r e f i n e d . The ASAP's
demonstra ted t h a t a - coo rd ina t ed mult iagency approach to the d r i n k i n g -
d r i v e r p roble m was not only f e a s i b l e but could save l i v e s . Of the
35 ASAP s i t e s , 12 showed s t a t i s t i c a l l y s i g n i f i c a n t r e d u c t i o n s ~in
n i g h t t i m e f a t a ! c rashes . F o r t h e 12 ASAP s i t e s showing S i g n i f i c a n t
r e d u c t i o n s , none of the corresponding comparison communities showed
s i g n i f i c a n t r e d u c t i o n s i n n igh t t ime f a t a l c rashes .
I t was found, however, t ha t t he ASAP's o r i g i n a l t h r e e - y e a r
o p e r a t i o n a l pe r iods did not provide s u f f i c i e n t time to adequa te ly
assess the r e l a t i v e e f f e c t i v e n e s s of the i n d i v i d u a l ' c o u n t e r m e a s u r e s .
- 2 -

The ASAP sites were allowed to compete for a two-year extension of
t h e i r o p e r a t i o n s . : Ten: o f ~ t h e A S A p , s i t e s : were awarded~ the o p e r a t ~ o n a l
e x t e n s i o n c o n t r a c t s f o r F ¥ 75 /76 t:hrough FY 7 6 / 7 7 . At t h e s e - e x t e n d e d
s i t e s the e v a l u a t i o n o f t h e r e h a b f l i t a t i o n component was s t r e n g t h e n e d :
by r e q u i r i n g random a s s i g n m e n t - o f DUI o f f e n d e r s to t r e a t m e n t and
c o n t r o l (or minimum exposu re ) c o n d i t i o n s and by r e q u i r i n g f o l l o w - u p . r ' ' , . " " : " . , " " . •
i n t e r v i e w s .to c o l l e c t l i f e c h a n g e outcome c r i t e r i a to supplement
d r i v i n g v i o l a t i o n and a c c i d e n t d a t a .
The i n f o r m a t i o n g a t h e r e d from the e v a l u a t i o n o f t he ASAP r e h a b i l i -
t a t i o n e f f o r t s i n d i c a t e d the f o l l o w i n g :
N o n - p r o b l e m ( s o c i a l ) d r i n k e r s who were r e f e r r e d to e d u c a t i o n
programs had a s i g n i f i c a n t l y lower r e a r r e s t r a t e than s o c i a l
d r i n k e r s who were no t r e f e r r e d to e d u c a t i o n p rograms .
One ASAP s i t e found t h a t a home s t u d y c o u r s e was as e f f e c t i v e
as t h e i r i n - c l a s s program i n r e d u c i n g r e a r r e s t r a t e s .
There was, however , no e v i d e n c e t o i n d i c a t e t he ASAP e d u c a t i o n
e f f o r t s r educed Crash i nvo lvemen t among s o c i a l d r i n k e r s .
• For p e r s o n s wi th modera te to s e v e r e d r i n k i n g p r o b l e m s , t h e r e
was l i t t l e e v i d e n c e t h a t r e f e r r a l t o e d u c a t i o n or o t h e r f o r m s
o f r e h a b i l i t a t i o n r e s u l t e d in lower r e a r r e s t o r a c c i d e n t r a t e s
when compared wi th problem d r i n k e r s no t r e f e r r e d to such p rograms .
There was some evidence, although inconclusive, to suggest
that chemotherapy (Disulfiram)treatment may reduce subsequent
rearrest and accident rates.
There was evidence that persons with certain characteristics
(particularly those characteristics related to drinking problem
severity and socio-economic status) benefit more from some
types of education and rehabilitation approaches than others.
The ASAP rehabilitation efforts provided much additional information
about the design, implementation, and evaluation of ~,lcohol safety
schools and other forms of rehabiiitation for drinking drivers. The
information obtained from the ASAP experience, however, generated as
many questions as it didanswers. Consequently, as the last of the
-3 -

• original ASAP sites were concluding operations the NHTSA was~detailing
the requirements of a new demonstration project that would, provide
definitive answers to a number of specifi~c..alcohol treatmen.t questions.
The resulting contract for the Comprehensive DUI Offender Treatment
Demonstration Project .was awarded to the Sacramento County, California ,
Health Department in october of i976. The project was implemented in the
following t~me frame:
• ~ Development Period - October 1976 through August i977, detailed
contract negotiations, recruitment of ~ey personnel, identifica-
tion of data•sources and design of data collection forms and
procedures.
Pilot Period September 1977 through December 1977, start
random assignmentinto first offende# DUI research design and
conduct education programs, refinement of data collection forms
and procedures, refinement of the education andcounseling
programs, start of majo~ comPuter data base analysis and pro-
gramming effort. .
• Operational Period - January 1978 through December 1979, start
random assignment of multiple DUI offenders and conduct counsel-
ing and .zhemotherapy programs, continue assignment of first
offender DUI's, monitor participation, and collect data.
• Follow-up and AnalYsis Period - January 1980 through December.
1981, finish treatment of clientsassigned during operational
period, continue to collect evaluati0n data,~analyze data and
write interim reports.
Project Closeout Period - January 1982 through June. 1982, produce
final reports and recommendations.
The CDUI Project!s research designs were. developed.to provide
answers to the •questions prompted by theearlier ASAP findings..For
example, one ASAP found thatahome study education program was as
effective as an in-class education program for DUI offenders who did
-4-

not evidence, problem drinking symptoms. A.new self-paced, programmed
learning, home study curriculum, was developed for-:.the CDUI Project in
order to verify this finding, and define in more detail the character-
istics of the DUI offenders who may benefit most.from a.less costly
approach to alcohol education. , . ... - !, . . . . . . " . . .
The ASAP findings also suggested that referral to. an in-class
alcohol safety school resulted in lower rearrest ,rates among non-
problem drinkers. The CDUI Project's-research design for first
offender DUI's has sufficient sample size t0 clarify and extend.these
earlier findings. Answers will be sought to questions such as: What
are the characteristics of clients who benefit most.fr0m an in-class
alcohol safety school? Can certain persons with moderate drinking.
" C a n e d u c a t i o n p r o g r a m s problems benefit from an education program?
reduce .the level of crash involvement as well asrearrest rates?.
For persons with moderate to severe drinking problems, the ASAP.
findings suggested that the rehabilitation programs provided at the.
ASAPsites had little or no effect on Subsequent driving behavior.
The CDUI Project's year-long educational counseling programs for
multiple DUI offenders, who have moderate to severe drinking problems,
provided approximately double the in-group-contact time Of even.the
longest of the ASAP rehabilitation programs. ThuS, the Project's
multip!e DUI offender research design will enablethe NHTSA to deter-
mine whether longer duration rehabilitation program s are necessary
in order to produce a measurable change in the behavior .of problem
drinkers. The multiple offender design will also allow an assessment
of which client subgroups benefit most from a group educational
counseling approach. •
The CDUI Project's educational counseling programswere provided
with and without chemotherapy (Disu!firam) treatments to determine
whether such support enhances the behavior modifying potentia ! of
group counseling; a possibility suggested from the ASAP research.
Inthe few ASAP sites which utilized chemotherapy , such treatment
was generally reservedfor, those clients with ~he, most severe drinking
-5-

problems.• In the CDUI Project all multiple DUI offender :cllie~itS ,- with
moderate as •well as severe levels of problem drinking, were assigned. - "
on a random basis to chemotherapy andnonochemotherapy conditions. This
procedure produced a broader base of client characteristics from which
to determine what client subgroups benefit most fromchemotherapy
support d u r i n g g r o u p counse l ing ,
F i n a l l y , i t should be noted t h a t as with some of the l a t e r ASAP
t rea tmen t e v a i u a t i o n s , the CDUI Pro jec t u t i l i z e d in -dep th fol low-up
i n t e r v i e w s admin i s t e red p r i o r to t rea tment en t ry and again at s u b
sequent intervals f0r the.purpose of assessing changes in life activities
which may have been •induced by the treatment interventions. The follow-
up interview protocols used•by the CDUI Project we•re modified versions
of the ASAP protocols.. The modifications were based on the experience
of both the interviewers who administered the ASAP protocols and the
researchers who analyzed the resulting!ife activities data. The
maximum fo!!ow-up.period was extended slightly from 18 months for the
ASAP's to 20 months for the CDUI. Project. Moreover, the CDUI Project
utilized follow-up interviews on a proportion of all clients, first.and
multiple DUI offenders, who were randomly assigned to treatment and
control conditions, thus allowing life change measures to be used in the
evaluation of both education and counseling programs for clients with a
range of drinking problem severities. Most of the ASAP sites which
utilized follow-up interviews, restricted such interviews to moderate
problem drinkers assigned to CoUnseling programs~
It is apparent from the research topics discussed thus far, that
whereversample size and sensitivity of outcome criteria permit, analyses
will. be conducted to determine the relationship betweenDUI offender
characteristics and outcome in the.various treatment programs of the , , . • '.
research designs.~ This !s a practical approach to treatment evaluation
considering ~tlie broad spectrum of personal characteristics .(demographic
socio-economic, alcohol problems, driving and criminal histories, etc.)
among the DUI offenders•assigned to the CDUI Project's education and
counseling programs. HoweVer, when one begins to examine the treatment •
-6-

outcome for relatively small subgroups of clients using direct traffic
safety Criteria such as vio~la~ionsand accidents the results_ can .be
insensitive to sUbtlebehaviOr changes and'generally unreliable... The
magnitudeof ~this problem will:progressively decrease as additional
outcome dataa:re..collected throughout the .two-year follow-.up, and .
analysis phase of the CDUI.Project. T.herefore, the first interim..
studies of treatment outcome will be restrictedto all clients randomly
assigned to the treatment groups (intact groups) andsome of the .
larger subgroups. In later interim studies, smallermore homogeneous
Subgroups of clients can be used in the evaluation of .treatment outcome
but many of the most specific and detailed analyses cannot be conducted
until all of the outcome data have•been collected for the final reports
Scheduled for ~he Spring of 1982. .
Purpose andScope of Report
The effectiveness of CDUI treatment programs will • be determined
through an examination of client driving behavior and other areas of
life activity W~ich may havechanged as a result, of the treatment
interventions. Most any•sensitive•and reliable assessment, of behavior
change requires time. It•could take manymonths for a person to
begin tO resolve, at least to.a measurable extent, problems of
employment, family and social relationships, or of physical or mental
health. Furthermore, acquiring and practicing theskills necessary
to control alcohol consumption can also be a time• consuming process,
especially where denial is•high, as in our relatively young, court
referred client population.
While the stresses Of life and the imprudent use of alcohol are
thoughtl to be the antecedents to most drinking-driving episodes, it
is changes in the actual drinking-driving behavior that are the most
direct and immediate criteria of treatment effectiveness. After • all,
the CDUI. treatment programs are intended to be traffic safety counter-
measures. Unfortunafely,.drinking-driving behavior can only be
_ 7 : L .
measured indirectly by arrests for driving under the influence and
reported alcohol •related accidents. ~Certa,inly, such offi~ially
recorded instances of driving under:the influence are far fewer than
the actual number of occurrences. When the detection ofthe target
behavior is relatively infrequent, one must observe a large sample
of persons who are also exposed to the possibility of detection fo r
an extended period of•time, in order to have a reasonably sensitive
assessment Of treatment effectiveness.
Thus, time is an essential element not Only for changes to occur
in the underlying human conditions which lead to drinking-driving
behavior but it is•also essential to adequately measure this behavior
in an outcome analysiS. The need for •time is emphasized because the
present analyses are of a most preliminary nature. The CDUI Project
was funded to allow two years of fol!ow-u p beyond the treatment'
assignment period. This extended follow-up period will allow a
reasonably sensitive analysis of treatment effects. However, no
one wants to wait two more years to view the findings. Consequently,
a series of interim •impact evaluation reports concerning treatment
~ffectiveness will be released approximately twice a year.
These interim reports serve several functions: They provide
at least some assurance tha~ the evaluation is being properly
conducted, they•satisfy curiosity, and they provide tentative data
for planning purposes.
It is important to note, however, that the tentative nature
of interim data does not imply.that the results will be .
different in the final reports, but only that they can be
different
The present report takes an initial look at the effectiveness of
ourfirst offender treatment programs in terms, of direct traffic safety
criteria.
-8-

First Offender Researc.h Design
Persons convicted of driving under the influence were.offered
a reduced fine as incentive tavolunteer for the CDUI Project~. The
net savings for volunteers averaged $105 and resulted in a fifty
percent volUnteer.rate, among"convicted first offender DUI's in
Sacramento Municipal Court. In addition, approximately twenty-seven
percent of the low •arrest • BAC cases allowed to plead to Reckless
Driving were also referred to the CDUI Project
Among those first offender clients who enrolled at intake,.
seventeen percent were determined to be ineligible for inclusion in
the research sample. Most of the ineligible clients lived out of
town and were transferred to programs in,their home communities.
Other ineligible clients were typically non-English speaking and/or
functionally illiterate. .
Clients in the research sample were randomly assigned according
to.the schema illustrated in Figure i.
Every first offender research client was randomly assigned in
equal proportion to one level of each of three factors. The treat-
ment factor has three levels:
1) Control Group - These clients received the reduced fine,
as did all first offender research clients, butthey did
not have .to attend classes or read any educational
materials.
2) Home Study - The home study program consisted of a set
of reading materials designed as a self-study, self-paced
package. The home study package, which covers the same
topics as the ~n-ciass education program, was first
introduced to clients in a one hour group orientation
session. Apre-Program knowledge test was also admin-
i s t e r e d a t o r i e n t a t i o n . E a c h c l i e n t then r e t u r n e d in
f o u r week§ f o r an i n d i v i d u a l i n t e r v i e w o f a p p r o x i m a t e l y
f i v e minu tes d u r a t i o n . The p u r p o s e o f t he f i n a l i n t e r v i e w
-9-

I
<D I
Control
1/3
I Moni tor ing . I L e t t e r s
1/2
& Follow.- No
Up Follow- I n t e r - Ups views
1/2 1 / 2
Home Study
1/3
I n - C l a s s Educat ion
1/3
I No
I Moni tor ing I L e t t e r s [_ 112
& • I Follow-. No Up lFollow-
Inter- l Ups views I,
1 / 2 I 112
I Monitoring I No Letters I Monitoring
I Letters 1/2 I 1/2
& & Follow- I No IFoliow- Up i.Follow- [. Up
Inter- I Ups [Inter- views l I views
112 I 112 [ 1 / 2 . " 112
. F igu re 1 " Diagram of F i r s t O f f e n d e r
Research Design
No
Follow- Ups
Monitoring L e t t e r s
1/2
& ! F° i i °w° II No I Up .Follow- i i n t e r - I Ups
• I v i e w s I I 1 / 2 1 1 / 2 ' :
!
I No i Monitoring I Letters I 1/2
I Follow- . No Up " !Fo l low-
I n t e r - i i U p s ' views 1
1/2 I. 1/2 i;
?

wast0 determine whether the clients satisfactorily
compieted' the wo~kassignments, and to •administer the
post-pr0gram knowledge test.
3) In-Class Education - The in,ciass Program consisted of
• four ciassroom sessions lasting 2½ hours each, over a
one-month period. The CDUIin-class program was based
largely On the original Phoenix DUI School curriculum
and represents the typical alcohol education approach
in use around the country. As with the home study program,
knowledge tests were administered during the first and
the last sessions.
Both the home study and in-class education programs covered the
same topics and shared the same knowledge and attitude change objectives.
The essential difference between the two programs was the method of ~
presentation • . The basic goal of.the CDUi Project's education programs
was to assist clients to develop a personal action pl~n to prevent
another DUI occurrence. Thus,.the programemphasis was on self-directed
change. Appendix D presents a summary of the-specific education
objectives and highlights the coursecontent.
The second .factor of. the research design has two levels, clients
were either assigned to receive quarterly monitoring letters or they
were not,one-half of the sample to each condition on a random basis.
The function of theSe letters wasto periodically remind the clients
that they were on informal summary probation for two years, and•to
encourage them to drive Safely and soberly. It washypothesizedthat
such periodic reminders which extended beyond the date of treatment
Completion may enhance the behavior modifying potential ~ of the.
Project's education .and counseling programs. Thus, the CDU.I monitor-
ing letters were used as an adjunct to the Summary probation process.
Appendix E shows an example of the quarterl¢ monitoring letter and
a summary of the content analysis. '
The third factor of the~relsearchldelsign also has two. levels.
Fifty percent of the first~'6ffender clients were assJgned to receive
-ll
follow-up interviews and fifty percent were not. The follow-up-,,>
interview process involves three in,dept h interv.iews: The first
Shortly after assignment (and prior to beginning treatment), and
then again at ten and at twenty months from the initial interview.
The primary purpose of the follow-up.interviews is to collect life
activities d~ta for treatment outcome analyses. However, the
possibility that follow-up interviews have an effect on driving
behavior necessitated .the requirement for random ass-ignment to
adequately examine this possibility.
Driving Record Data Collection
The collection of driving record data from the California
Department ofMotor Vehicles (DMV) is largely an automated process.
Approximately. every six months driving record requests are sent
to the D~,via magnetic computer tape, for every person represented
in the CDUI Master Data Base. Upon receipt of the request.ed records,
the specific information needed.• for project evaluation is removed and
the new accident~ driving violation, and licensing action data are
added to the CDUI D~ Data Base The entire process takes from four
to six weeks from request to completion.
A more detailed description of the data collection procedures-
is provided in Appendix A. This description is intended to be
Conceptual rather than technical, althoughthe use of a few data
processing terms could notbe avoided.
Outcome Criteria
Three treatment outcome (impact).measures were used in this
interim report: .
i) The first DUI orreckless driving offense occurring
subs.equent to the date of random assignment. •Reckless
driving offenses were inclUded in this measure because
they are almost all reductions from DUI. In fact, one
-12-
2)
3)
of the CDUI Project's multiple offender research designs
(the post-conviction,presentence, PCPS program) makes the
inclusion ofreckless driving offenses mandatory'. If a
first offender research client was rearrested for DUI he
could have. been referred back to the CDUI Project as a
PCPS client. • If the client successfullY completedthe
PCPSprogram he would be allowed to plead to a charge of
reckless driving.
The firstreported accident of any kind occurring subse-
quent to the date of random assignment. While thefirst
alcohol related accident would providea more sensitive
measure of treatment outcome, A/R- accidents were simply too
infrequent•to be used in such a preliminary analysis
Consequently, any accident recorded .through police or
financial responsibilityreports must suffice for the . . . : .
present, it is important to note, however, that the iden-
tification of an accident as alcohol related was often
based on the investigatingpolice officer's observations
of•the appearance and behavior of the driver. Unless the
driver was cited for DUI, Chemical tests were not usually
administered. Thus, some of. the police reported accidents
indicated as non-al.cohol related may actuaily have involved
alcohol Further, some of the•Property damage accidents
identified through financial responsibility reports•may
have been alcohol related, such alcohol involvement woulcl
not generally be self-reported by the driver.
The first moving violation or anyalcohol related offense
occurring subsequent to the date of random assignment. This
outcomemeasure includes any violation of the California
Vehicle Code which carries one or more negligent operator
points (including DUI and reckless driving), and any alcohol
related zero point violation (e.g., open container). From
the standpoint of sensitivity to treatment effects, this
measure represents something of a tradeoff. It comprises
-13-

many offenses which are not alcohol related, and thus, are
not the direct targets of our education efforts. However,
the measure does provide a much higher percentage of observed
events in the research sample, than either DUI's or accidents.
A higher event probability tends to increase the power of
the test statistics, other factors remaining constant. This
relatively broad outcome measure was used in the present
report primarily to describe the general driving behavior of
the first offender DUI's in the research design. Future
analyses will utilize more sensitive outcome measures such as
all alcohol related driving violations era combination of
all A/R violations and A/R accidents.
Statistical Analysi.s and Related Topics
The analysis of effectiveness involves the comparison of each out-
come measure between randomly assigned treatment groups. However, these
measures are most meaningful when they are related to a co,non period
of time, e.g., the percentage of control group clients rearrested-for
DUI, versus the percentage of in-class education Clients rearrested
for DUI, during the first year following their random assignment. Since
first offender DUI clients were continuously assigned from September,
1977 through early January, 1980, all Clients in the research sample
were not exposed to the risk of rearrest for equal periods of time.
Conceptually, the first step in the analysis of effectiveness
was to organize ~clients in the rese~irch sample (those assigned through
early October, 1979) by exposure time. By computing the exact number
of days between the da~e of random assignment.and the date of the last
California DMV records search (for this study October 29,• 1979), for
each client in the sample; cases•could beorganized in thirty day
exposure time intervals, 0~30 days•, 30-60 days, etc. All clients in
the research sample were represented"in the 0-30.day interval, however,
those clients assigned in October, 1979, would not be represented in
the 30-60 day interval. Continuing this procedure, one finds that
-14-

o n ! y a v e r y sma l l n u m b e r ' o f c l i e n t s a s s i g n e d i n e a r l y F a l l Of 1977
were r e p r e s e n t e d in t h e l a s t i n t e r v a l 0 f 7'50 d a y s o r more~ Thus ,
t h e e f f e c t i v e sample s i z e d e c r e a s e s p r o g r e s s i v e l y as e x p o s u r e t~me
i n c r e a s e s .
S u r v i v a l r a t e a n a l y s i s , a p r o c e d u r e o r i g i n a l l y d e v e l o p e d f o r
b i o m e d i c a l r e s e a r c h , i s h i g h l y a p p l i c a b l e t o d a t a in t h e a b o v e f o r m .
In t h e p r e s e n t . a p p l i c a t i o n , a s u r v i v o r i s a c l i e n t who has n o t c o m m i t t e d
t h e t a r g e t e v e n t d u r i n g h i s p e r i o d o f e x p o s u r e ( i . e . , a DUI o f f e n s e ,
o r a c c i d e n t , o r a moving v i o l a t i o n o f any k i n d ) . C o m m i t t i n g t h e t a r g e t
( o r t e r m i n a l ) e v e n t removes t h e c l i e n t f rom t h e s a m p l e , t h u s t h e
o u t c o m e m e a s u r e s a r e d e f i n e d as t h e f i r s t o c c u r r e n c e o f e a c h e v e n t t y p e .
In o t h e r w o r d s , an i n d i v i d u a l c a n n o t be c o u n t e d as a DUI r e c i d i v i s t
t w i c e . Wi th t h i s r e s t r i c t i o n , i t i s a p p a r e n t t h a t t h e e f f e c t i v e
s a m p l e s i z e d e c r e a s e s n o t o n l y when s u r v i v o r s r un o u t o f e x p o s u r e t i m e
b u t a l s o when t e r m i n a l e v e n t s o c c u r .
T a b l e 1 p r o v i d e s an example , o f a s u r v i v a l d a t a t a b l e . T h e s e a r e
real data for the total control group using first moving violation or
any A/R offense as the outcome measure. The first, left most, •column
shows the start of each thirty day interval. The second column shows
the number Of cases enteringeach interval. Examination of the first
row of data indicates that there was a total Of 1,270 contro ! group
cases available for analysis. Out of the 1,270 cases, there were 13
cases whose foilow-up period ended somewhere in the first thirty-day
interval. The number of clients who were Withdrawn surviving at each
successive thirty-day interval is indicated in the thirdcolumn.
Assuming that those cases withdrawn surviving at each interval
were evenly distributed throughout the interval, then the number of
clients exposed to risk may be estimated by•the number entering each
interval• (column 2), minus 1/2 of those withdrawn during that interval
(column 3). The number of clients exposed to the risk of detection
for a target event at each interval is shown in column 4 of Table i.
The fifth column shows the number of •terminal or target events which
occurred during each interval. The first row in the example table
indicatesthat 38 clients committed a moving violation or some kind
of A/R offense within the first thirty days after recei.ving their
-15-
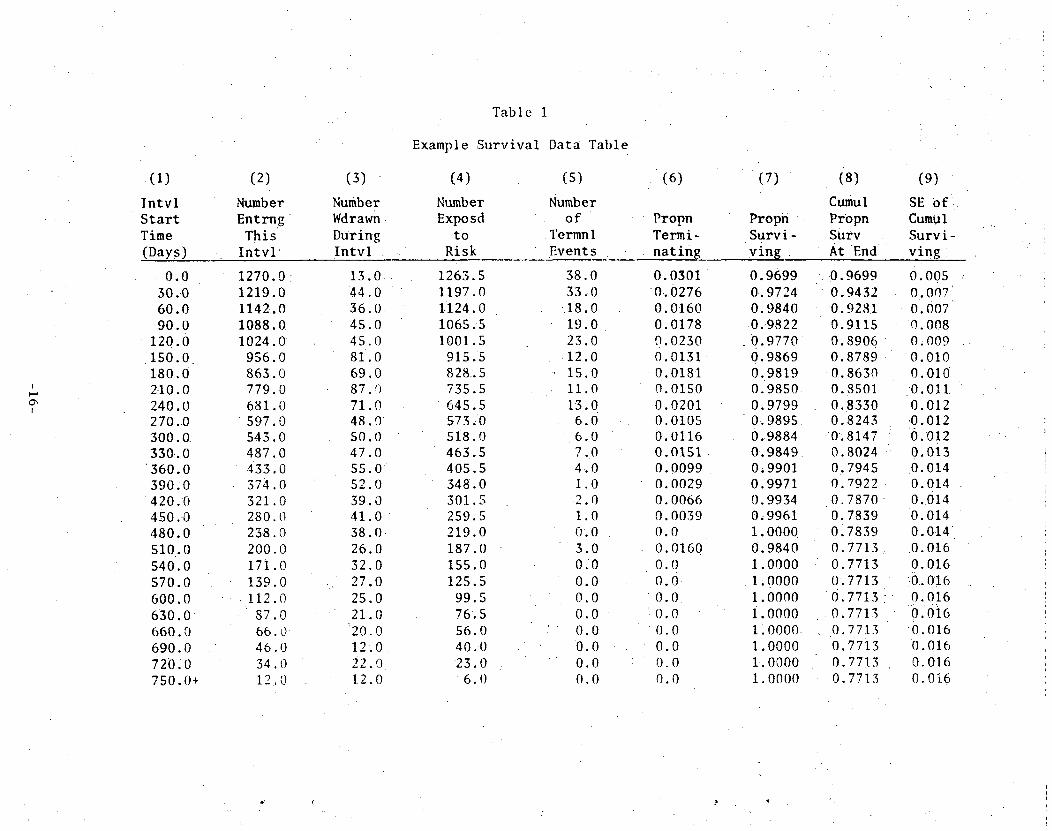
I
I
(1)
Intvl Start Time (Days)
0 . 0 30 .0 60 .0 90 .0
120 .0 150 .0 . t 8 0 . 0 2 t 0 . 0 2 4 0 . 0 270 .0 3 0 0 . 0 330..0 3 6 0 . 0 390 :0 420 .0 450.0 480.0 510 .0 540.0 570.0 600.0 630.0 660.0 690.0 720 .0 750.0+
T a b l e
Example Survival Data Table
(2)
Number Entrng This Intvl
(3) Number Wdrawn. During. Intvl ..
(4)
Number Exposd
to Risk
(s) Number
of Termn I Events
(6)
• Propn Termi- nating
1270 .0 : 1219.0 1142.0 1088 .0 1 0 2 4 . 0
956 .0 863 .0 779 .0 681 .0 597 .0 543.0 487 0 433 0 374 0 321 0 280 0 238 0 200,0 171.0 139.0 112.0
87.0 66 .0
4 6 . 0 34.0 12.0
1 3 . 0 4 4 . 0 5 6 . 0 45 .0 45 .0 8 i . 0 69 .0 87 .9 71 .0 4 8 . 0 50 .0 47 .0 5 5 . 0 52.O
3 9 . 0 4 1 . 0 3 8 . 0 26.0 32.0 27.0 25.0 21.0
:20.0 12.0 22.o 1.2.0
1263.5 1197.0 1124.0 I065.5 I001.5 915.5 828:5 735.5 645.5 573,0 518 .0 463 .5 405.5 348.0 301.5 259.5 219.0 187.0 155.0 125.5 99.5 76.5 56.0 40 .0 23 .0 6 . 0
38 .0 33 .0
1 8 0 19 0 23 0
1 2 0 15 0 11 0 13.0
6 .0 6 .0 7 .0 4 . 0 1 .0 2 . 0 1.0 0 :0 3 .0 0 /0 0 . 0 0 .0 0 . 0 0 .0 0 .0 0 .0 0 .0
~ O. 0301 0.0276 0.0160 0 .0178 0 .0230 0 .0131 0.018.1 0 .0150 0.0201 0.0105 0.0116 0 .0151 O. 0099 0 .0029 O. 0066 0 .0039 0 .0 0 .0160 O. 0 0.0 ~
0 . 0 O. 0 0 .0 0 .0 0 .0 0 .0
(7)
Propn S u r v i - v i n g
0 .9699 0 .9724 0 .9840 0 . 9 8 2 2
. 0 . 9 7 7 0 0 .9869 0 .9819 0.9850 0.9799 0 .9895 0.9884 0 .9849 0,9901 0.9971 0.9934 0,9961 1.0000 0.9840 1.0000 1,0000 1.0000 i.oooo 1.0000. 1.0000 1.0000 1.0000
(8) Cumul PrOpn SUrv AtEnd
(9) SE O f Cumul S u r v i - v i n g l
0 .9699 0 .9432 0 . 9 2 8 1 0.9115 0 .8906 0 .8789
0 . 8 6 3 0 0.8501 0 .8330 0 .8243
0 ; 8 1 4 7 0.8024 0.7945 0.7922 0.7870 0.7839 0.7839 0.7713 0.7713 0.7713
0 . 7 7 1 3 0 . 7 7 1 3 0 .7713 0 . 7 7 i 3 0 .7713 0 . ~ / , 1 3
O.oos O. 0071 O. 007 O. 008 0;009
0 . 0 1 0 0 .010 O. 011 0 .012 ,0.012 0 .012 o.oi3 0 . 0 1 4 0.014 0.014 0 . 0 1 4 0 . 0 1 4 0 . 0 1 6 0 .016
,6.0i6 O. 016
0 . 0 1 6 0;016 0 .016 O.Ot6

random assignment. Thisis 38,clients out of 1,263.5 exposed to risk
during the first thirty-day period~ representing a proportion of .0301.
The second row of Table 1 shows that 33 more clients committed offenses
sometime between 30 and 60 days after their random assignment,~out of
1,197'exposed to risk, giving an o£fense rate of .0276 for this inter-
Val. The proportion of clients terminating at each interval is shown
in column 6.
Each proportion terminating was subtracted from 1.0 to give the
proportion surviving in each thirty-day interval, shown in column 7.
An estimate of the cumulative survival rate up to the end of a specific
interval was computed by multiplying the proportions surviving (in
column 7) up throughthat interval. For example, the cumulative pro-
portion surviving up to 120 days after random assignment is 9699 x
.9724 x .9840 x .9822 = .9115. The cumulat.ive proportion of clients
surviving at the end of each interval is shown in the eighth column
of Table i. The last column shows the standard error of the cumula-
tive survival rate at each thirty-day interval.
In addition to computing the cumulative survival rate for each
treatment group in the research design, tests were conducted to deter-
mine Whether the survival rate differed significantly between treat-
ment groups. The significance test Used was the Lee-Desu statistic.
This test is based on a score U computed for each client by comparing
his survival time with that of all other clients in the total research
sample. A client's score begins as zero and is incremented by One for
every case that is known to have a survival time less than the client's
and decremented by one for every case with a survival time greate r
than the client's. There are aiso specific rules for breaking ties.
The Lee-Desu statistic calculated from the U scores is distributed as
chi'square with g-i degrees of freedom (where g is tile number of treat-
ment groups). This statistic uses all available information to test
the null hypothesis that the treatment groups are samples from the
same survival distributioni The alpha level was se t at .10. Readers
interested in a more detailed explanation of survival rate analysis
-17-
and the Lee-Desu statistic should refer to the Statistical Package
for:the Social Sciences, SPSS Update for Releases 7 and 8 *
One's ability to detect treatment::effects whenlt-hey~ex;is.t,
that is to reject the null hypothesis and show that the treatment
groups havesignificantly different surviva ! .rates, depends on
severai fa6torsl. " Two of these factorsare guaranteed to fmpr0ve
with time: Total Sample size, and the probability of observing .
the target events.
The t o t a l . f i r s t offender research sample obtained during the
random assignment period was 4,637clieflts. In October.~ 1979, there l
were only 4,155 cases in the CDUI database and available for the
DMV records search. Of the~4,155 requests made, 290 cases could
not be identified in the DMV automateddriving.record system, and
must be considered temporarily missing. Thus, the research sample
size for this report was 3,865 clients or 83 percent of the complet e •
researdh s a m p l e .
W h i l e an e v e n t u a l 17 p e r c e n t i n c r e a s e in the t o t a l s a m p l e s i z e
w i l l enhance our a b i l i t y to d e t e c t t r e a t m e n t e f f e c t s , an i n c r e a s e i n
t h e l e n g t h o f t ime t h e sample i s exposed t o r i s k o f a r r e s t o r
a c c i d e n t i n v o l v e m e n t i s even more i m p o r t a n t . A ]ook a t t h e s u r v i v a l
d a t a in Tab le 1 s h o w s t h a t l e s s than h a l f o f the c o n t r o l group c l i e n t s
were expose d to r i s k a t n i n e months a f t e r random a s s i g n m e n t . As t he
f o l l o w - u p p e r i o d i n c r e a s e s , so w i l l t h e p r o b a b i ! i t y 0 f d e t e c t i n g
outcome e v e n t s (or our sample e s t i m a t e of t he even t p r o b a b i l i t y ) ,
and thus t h e s e n s i t i v i t y o f our outc0me a n a l y s e s . One can see in
Table 1 t h a t no one in t h e c o n t r o l group was Observed commi t t i ng a
moving violation beyond 540 dayz from assignment . . . . .
"In the present report there is another factor affecting the
sensitivityof analyses which use subsequent DUI/Reckiess Driving
offenses as the outcome measure. Some randomly assigned first
offenders who were rearrested for. DUI were placed i.n the CDUI
Project;s Post-Conviction Presentence(PCPS)..program for second-time
*Hull, C.H. & Nie, N.H. (Eds.) SPSS UPDATE: Facilities for Releas.es 7 and 8. New York:
New Procedures and McGraw-Hill, 1979.
' -181
offenders. Clients in this program are monitored by the D~ and
the CDUI Project through a special pull notice/system triggered by
subsequent DUI activity. There is no official record of~the~
DUl/Reckless Driving event in the DMV file until the client is
sentenced (for reckless driving) thirteen months from the date of
conviction (or when the client is deleted from the PCPS program
for n0n-participation and sentenced on the original DUI charge).
An examination of the CDUI Data Base indicated that there may
be as many as 155 clients in the first offender research sample who
were actually rearrested for DUI, but who were not counted as
recidivists in the present analysis because there was as of
October 29, 1979, no official record of the event in the DMV files.
When one considers that out of a total sample of 3,865 cases there
were 236 detected DUI events, the addition of another 155 could
make a substantial difference in the results of the analysis.
In order to estimate the effect of this loss of outcome events,
the 155 suspected recidivists were grouped by treatmentmodalitY.
They were found to be distributed in equal proportion between the
control, h0me-stud ~, and in-class education groups. This suggests
that their 10ss from the sample did not introduce a between group
bias in the results. Nevertheless, their loss from the samp!e
certainly decrea§ed the apparent event probability, and thus the
sensitivity of the analyses.
Accurately backing the missing data into the survival rate
analyses bY hand would take more time than was presently available.
However, it will be done for the next interim report.
Group Comparisons
The principal set Of analyses involved the comparison of sur-
vival experience between levels of the treatment factor, that is
between the control, home study, and in-class education groups.
About one-half of the clients in these groups were also assigned
to letter monitoring and/or follow-up interviews, however, such 7
7
_19 ̧ -

cases were distributed in equal proportion between the treatment:.
groups.by the random assignment process. Separate treatment g~rdup
comparisons weremade using.each of the three outcome measures,' •
e.g., DUI/reckless driving, accidents, and moving violation/any
AR offense.
.surV~valr~t@swereialso~computedf6r.a sample 0f offenders: Who
did not Volunteer for theCDUI Project. ~The non-volunteers represent
persons who were convicted0f their first DUI offense • or wh0 had their
original DUI charge reduced.to reckless driving because of a'rela ±
tively 10w BAC level (typically .1.2 or below) but who chose to pay
a higher fine in•lieu of participati0n in the CDUI Project's education
Programs. unfortunately,the Project was not permitted to interview
the non-volunteers so relatively little is known about their Personal
characteristics. This sample is not part of the research design but
when compared with the volunteer research sample (and the control
group in particular)it Provides an indication of relative driving
behavior. A substantial difference, between control Clients (repre--
senting untreated volunteers)and the untreated non-volunteer sample
wou!d make it inappropriate to generalize treatment effects to those
persons having the characteristics of our non~vo!unteer samp!e.
In addition to examining the total number•of clients assigned
to the treatment groups, it is.of interest to determine whether
certain subgroups of clients appear differentially, affected by the
education programs. This was accomplished•by comparing the treatment
group survival rates for clients.in two different age•groups (less
than 25 years, and 25 years orolder), and three different diagnostic
classifications •(social drinker, mid-range problem:drinker, and
severe problem drinker).•
The classification of clients by drinking problem severity was
based on ithe judgement Of-the diagnostic counselor during a half-hour
intake interview. The counselors did not apply a uniform, systematic
formula, rather the Classification decision was'a subjective process
of weighing mostly self-reported information.
-20-

From September !977 through August 1978, the Mortimer-Filkins.
questionnaire and interview protocol was used to obtain.the informaz...-~
tion for the-diagnosis. It must be emphasized that the diagnostic
counselors, several Of .whom had been using the Mortimer-Filkins in an
on-going treatment referral program prior to theimplementation of the • r
CDUi Project, aimos.tnever compared the total instrument score with
the standard cutoff points when making their classification decisions.
Instead,.the Counselors based their decisions on the responses to
"key" items on which the clients appeared tobe most candid.
In September of 1978 it became necessaryto shorten the intake
procedures in order to process an increasing number of clients. The
procedures were modified by eliminating the questionnaire portion of
the Mortimer-Filkins and by using in the interview protocol only
those items for which the counselors felt that they got the most con-
sistently honest responses. Several new items were added at the
suggestion Of the counselors. These items addressed life problems
which would cause situational and transient stress, e.g., loss of
a job, a recent divorce, o~ the death of a close friend or relative.
It was felt that such items could hel p the counselors to identify
persons whose drinking-driving activity represented an atypical -
and inappropriate response to a temporary stress condition, as opposed
to a long-standing habit of heavy drinking and. driving. The revised
intake interview protocol used from september 1978 through the end
of the operational period is shown in Appendix F.
In addition to the Self'reported information, the diagnostic
counselors usually knew the clients' blood alcohol content (BAC) at
the time of arrest,~and of course, they also knew that Clients
referred as multiple.DUI offenders had at least one prior DUI convic-
tion. The total number of prior alcohol±reiated offenses, however,
had to be obtained from self-reports. Through the interview process
the counselors found that even a proportion of the clients referred
as first offender DUI.'s actually had prior DUI arrests which had
been purged from the official records, or which had Occurred in
other States.
-2i -
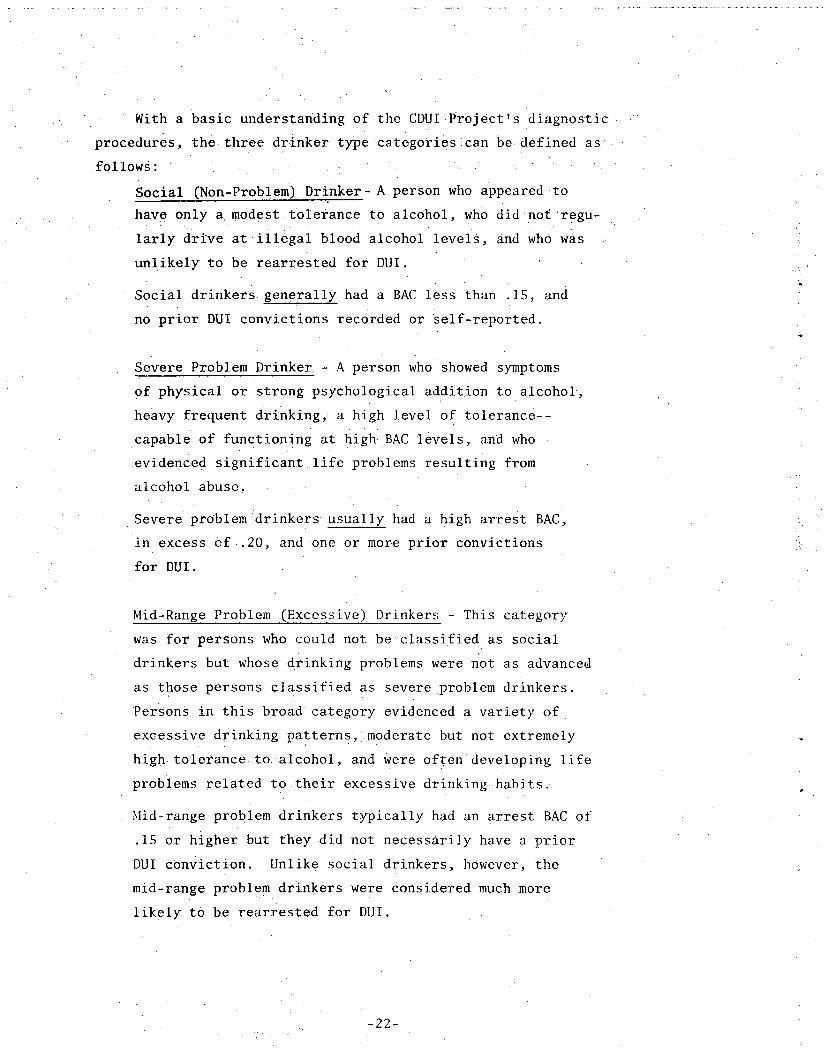
• With a basic understanding of the CDUi Project's diagnostic
procedures, the three drinker type categoriescan be. defined as'
follows: . '-
Social (Non-prob%eg)Drinker- Aperson who appeared to
have only a m0dest tolerance to alcohol , who did~noi'regu ~
" larly drive atillegal blood alcohol levels, and who was
unlikely to .be rearrested for DUI.
Social drinkers generally had a BAC less than .15, and
no prior DUI convictions recorded or self-reported.
Severe Problem Drinker~- A person who showed symptoms
of physical or strong psychological addition to alcohol,
heavy frequent drinking, a high level of tolerance--
• capable of functioning at highi.BAC levels, and who
.evidenced significant life problems resulting from
alcohol abuse.
Severe problemdrinkers usually had a higharrest BAC,
in excess, of .20, and one or more prior convictions
for DUI.
/. :!
Mid-Range Problem (Excessive) Drinkers - This category
was for persons who could not be classified as social
drinkers but whose drinking problems were not as advanced
as those.persons classified as severeproblem drinkers.
PerSons in this broad category evidenced a variety of
excessive drinking patterns, moderate but not extremely
hightolerance to. alcohol, and Were often developing life
problems related to their excessive drinking, habits. •
Mid-range problem drinkers typically had an arrest BAC of
.15 or higher but ~hey did not necessarily have a prior
DUI conviction. Unlike social drinkers, however, the
mid-range problem drlnkers were considered much more
likely to be rearrested for DUI.
-22-

Finally, the effectiveness Of our secondary procedures of
quarterly letter monitoring and follow-up interviews was examined
by comparing the Survival experience Of clients assigned to these
conditions, versus those who •were not. > •
The various group comparisons are listed below in order Of
p r e s e n t a t i o n : ..
Treatment Group Comparisons:
vs. In-ClaSs Education
Total Assigned
Control vs Home Study
Age less than 25 years
Ag e 25 years.or older
Social Drinkers
Mid-range Problem Drinkers
Severe Problem Drinkers
• Comparison of all control group clients vs.
non-volunteer sample.
Letter Monitoring GroupComparisons:
vs. NoLetter • Monitoring
• Total Assigned
Letter Monitoring
Follow-up IntePviewGroup Comparisons: Follow-up
Interviews vs. No Follow-up Interviews
• Total Assigned
P
- 2 3 - /

. . . .
SU e: ARY OF ReSULTS': . . . .
The f o l l o w i n g , r e v i e w o f t h e i n t e r i m impact ana lyses• does no t
e mpha s i ze t h e r e s u l t s o f s i g n i f i c a n c e t e s t s . R a t h e r , an a t t e m p t :is
made to i d e n t i f y c o n s i s t e n t p a t t e r n s in t h e S u r v i v a l d i s t r i b u - ~ i o n s .
The f i n d i n g s a r e s u m m a r i z e d f i r s t f o r t h e t r e a t m e n t g r 0 u p cgmpar i s . ons ,
and t h e n f o r t h e a n a l y s e s o f t h e l e t t e r m o n i t o r i n g and f o l l o w - u p
i n t e r v i e w p r o c e a d r e s . ~ "
E f f e c t i v e n e s s o f F i r s t O,f fender Educa t i on Programs
Tab l e 2 . a p r e s e n t s t h e c u m u l a t i v e s u r v i v a l r a t e s a t t h r e e t ime
i n t e r v a l s . f o r t h e f i r s t o f f e n d e r t r e a t m e n t g r o u p s . The i n t e r v a l s
s e l e c t e d f o r p r e s e n t a t i o n were 240 days, 360 d a y s , and 480 days from
random a s s i g n m e n t , o r a p p r o x i m a t e l y 8 , 12, and 16 m o n t h s . The 12
month s u r v i v a l r a t e Was S e l e c t e d as a common s t a n d a r d c o m p a r a b l e wi th
p r e v i o u s r e s e a r c h . Two p o i n t s were t h e n s e l e c t e d , s p a c e d e q u i d i s t a n t
p r i o r and s u b s e q u e n t t o the. 12 montt~ i n t e r v a l . S i x t e e n months from
a s s i g n m e n t was t h o u g h t to p r o v i d e t he maximum e x p o s u r e t i m e M~ile
s t i l l m a i n t a i n i n g a. r e a s o n a b i y s t a b l e e s t i i n a t e o f t h e c u m u l a t i v e
s u r v i v a l r a t e . A c t u a l l y , t h e s t a b i l i t y o f . the 16 month s u r v i v a l
r a t e f o r t h e two s m a l l e s t s u b g r o u p s , s o c i a l d r i n k e r s , and s e v e r e p rob l em
d r i n k e r s , was q u e s t i o n a b l e , lIowever, t h e 16 month r a t e was p r e s e n t e d
f o r a l l t r e a t m e n t g roup c o m p a r i s o n s to make . the d a t a c o m p a r a b l e . The
S month i n t e r v a l r e p r e s e n t s t h e s h o r t e s t expos i i re t ime but o f t h e t h r e e
s e l e c t e d i n t e r v a l s i t p r o v i d e s t h e 0n ly s u r v i w i l r a t e s based oF, more
t h a n h a l f o f t h e t o t a l r e s e a r c h s a m p l e
The s u r v i v a l r a t e s in Tab le 2 . a r e p r e s e n t .the r e s u l t s o f a l l 18
a n a l y s e s o f t r e a t m e n t e f f e c t i v e n e s s : t o t a l a s s i g n e d , two age s u b g r o u p s ,
and t h r e e d i a g n o s t i c c l a s s i f i c a t i o n s , f o r each o f t h e t h r e e ou tcome
m e a s u r e s . For each o f t h e 1,~ a n a l y s e s , an o v e r a l l s i g n i f i c a n c e t e s t
was c o n d u c t e d to a s s e s s w h e t h e r t h e o b s e r v e d d i f f e r e n c e s in c u m u l a t i v e
s u r v i v a l r a t e be tween c o n t r o l , home s t u d y , and i n - c l a s s g r o u p s were
s t a t i s t i c a l l y s i g n i f i c a n t ( i . e . , i n d i c a t i v e o f a t r e a t m e n t e f f e c t ) . Each
o v e r a l l s i g n i f i c a n c e t e s t was f o l l o w e d by t h r e e s p e c i f i c pa i rwi . se
c o m p a r i s o n s ( c o n t r o l v~. home s t u d y , c o n t r o l v s . i n - c l a s s , and home
s t u d y vs . i n - c l a s s ) .
- 24 -
Table 2.a
Summary o f Cumulative Survival Rates at Selected Time Intervals: First Offender Treatment-Grouns
# Days Erom : A s s i g n m e n t
Total Assigned
Control Home Study In-Class
Age< 25 yrs.
C o n t r o l l lome Study
I n - C l a s s
Age >_ 2Syrs. C o n t r o l llome Study I n - C l a s s
S o c i a l D r i n k e r s
Control Home Study In-Class
M i d r a n g e Pr .ob lem Drinkers
C o n t r o l itome Study I n - C l a s s
S e v e r e Problem • Drinkers
C o n t r o l H o m e s t u d y I n - C l a s s
Outcome Measu res . :
Accidents D U I ' R e c k l e s s
240 360 480
. 9 3 8 6 . 9 1 5 6 . 8 8 9 9
. 9 3 0 7 . 9 0 7 8 . 8 8 6 9 . 9 4 3 1 •9037 •8744
9259 . 8997 . 8 8 5 7 9028 . 8 7 9 5 ~ 8 5 1 0
. 9 1 0 6 . 8 6 8 0 . 8 1 7 8
. 9 4 6 2 . 9 2 5 2 . 8 9 2 2
9469 •9244 . 9 0 8 0 9621 . 9305 . 9 0 ? 4
,9674 .9472 . 9 2 9 6 • 9243 . 9166 . 9 0 7 6 • 9484 .9269 . 8901
9332 . 9 0 9 6 •8898 9310 •9061 , 8 8 5 2 9380 . 8997 . 8 6 2 6
240 360 480
• 9426 . 9 2 6 6 . 9 1 2 8 .94:36 . 9 3 1 6 . 9 2 4 8 9 4 9 8 • 9 3 4 0 • 9 2 8 0
• 9385 . 9 1 9 6 •8996 .!)255 . 9 1 8 7 •9006 9320 . 9 2 0 4 •9088
. 9 4 4 9 • 9 3 0 8 . 9 2 0 8
. 9 5 4 0 •9.389 •9389
. 9 6 0 3 • 9 4 1 9 •9390
• 9686 . !)686 . 9 3 4 2 • 9346 . 9 3 4 6 9346 • 9702 . 9 6 3 9 . 9 4 5 7
• 9 3 9 8 91 ,'~3 . 9 0 7 0 . 9 5 2 1 . 9371 . 9 3 3 6 • 9497 . 9 3 6 0 . 9 2 6 8
9200 .8944 . 8 4 2 6 9368 .9045 •8730 9566 ' 9 1 ! 3 8 . 9 0 0 9
j ' ,
9172 9220 9245
• 9002 . 9002 • 9066 . 8 8 3 5 • 8877 . 8 8 7 7
Moving V i o I . - A / R O f f .
2ao 360 480
• 85{)1 .8024 .783! ; • 8420 . 8098 .7901 • 8453 •8028 . 7 7 0 7
• 8031 • 7444 . 7234 • 7766 . 7 5 0 2 . 7 1 2 0 . 7 9 1 2 . 7 4 8 9 •7137
. 8 7 8 6 . 8 3 7 8 . 8 2 0 8
. 8 7 9 6 • 8 4 4 1 . 8 3 4 5
. 8 7 6 9 .8544 •8040
. 8 6 9 2 . 8206 . 7 9 8 3 • 8493 .819,i •81!)4 . 8 7 0 5 •8489 • 8 2 1 2
.844"7 .7991 .7814 • 8432 , 056 7889 • 8389 • 7979 .7661
, 8458 •7911 . 7 7 5 5 • 8 2 7 8 . 8 1 2 6 .7( ,a7 8386 7636 ~ 5 9
izs-

• Of. the 18 overall significance test: conducted, none reached
statistical significance at the 'lOlevel. Moreover,.of the 54 pair-
wise,., comparisons made onlyone, Social drinkers control vs homestudy
for accidents, was statistically significant .(p = .0768). Given that
• ....:. :none of the0verall comparisons~reached statistica-I significance-and
..... conSidering the number0f significancetests cohducted, this Single
statistically significant difference must.be disregarded asspurious.
Complete survival data tables as.well as summaries of all
significance tests conducted for the treatment group analyses are
presented in Appendix B. It shouldbe recalled that the significance
.testsinvolved the c0mparison, of entire survival distributions using
all available data and not just the three survival rates selected
for presentation.in Tab!e2.a. Even a cursory review ofthe material
in Appendix B wil.l give the reader a better impression Of treatment
group survival experience including effective sample size, exposure
time,~ and the. actual number, of accidents and violations.
As an aid to. reviewing Appendix B and interpreting the results
of the statistical-analyses,.the total sample sizes on which the
significance tests were based are summarized below:
.Total Assigned:
Control .Home Study. In-Class Education
Total
Age SubgrouPs:
Total < 2 5 years Total > 25 years
Diagnostic Subgroups:
TotaI Socia i Drinkers Total. Mid-RangeProblem Drinkers Total Severe Problem Drinkers
1,270 1,309 1,286
3,865
i ,434 2,431
781 2,447
637
Non-VolunteerSampie: 3,240
Although the results.of the.statisticalanalyses provided no
evidence that the survival rate differences in Table 2.a were
anything more than chance flucuations in the data, one Should not be
deterred from closely inspecting the survival data for consistent
-26-

p a t t e r n s : a n d t e n d e n c i e s . Tile f i r s t s t e p in t i l l s p r o c e s s was to • , : :. , . . - . .
d e t e r m i n e how the d a t a behave. For example , were t t i e . r . e . !og ica l
and a n t i c i p a t e d d i f f e r e n c e s in s u r v i v a l r a t e s between the age
and d i a g n o s t i c subgroups?
B y S u b t r a c t i n g t h e s e l e c t e d s u r v i v a l r a t e s from' 1.0 tile d a t a
~ere t r a n s f o r m e d to the a c c i d e n t and v i o l a t i o n r a t e s shown in T a b l e
2 .b . Comparing the two age subgroups , i t i s C l ea r t h a t tile younger
o f f e n d e r s between 18 and 24 y e a r s o f age had c o n s i s t e n t l y h i g h e r
a c c i d e n t and DUI o f f e n s e r a t e s than o f f e n d e r s who were 25 y e a r s o f
age or o l d e r This d i f f e r e n c e was even more nronounced f o r t o t a l
~oving v i o l a t i o n s where the younger o f f e n d e r s ' 4 8 0 day r a t e s ranged
from .2766 to .2880, compared wi th .1655 to .1960 f o r t h e o l d e r
o f f e n d e r s . S ince t he s i n g l e most common moving v i o l a t i o n ( o t h e r t han
9UI) w a s speeding, the higher rate of moving Violations among tile
younger, offenders was expected by the authors.
Of the three outcome measures used in this study, DUr-reekless
driving offenses had the greatest degree of alcohol involvement and,
therefore, should show the }ii~hest correlation with drinking problem
severity. Tile data in 'Fable 2.b do in fact show s~nall but consistent
differences between diagnostic subgroups in the anticipated direction.
The 480 day DUI offense rate:; for social drinkers ranged from .054~ to"
.065g., midrange proble m drinkers from .0664 to .0930, and severe
problem drinkers from .0998 to .i165. '
Thus in general, tim data used in this interim report appear to
behave ~!ogically and have enough sensitivity to distinguish major .
s u b g r o u p s o f tile f i r s t o f f e n d e r r e s e a r c h . s a m p l e . While t h i s was
r e a s s u r i n g , o , , r p r imary i n t e r e s t c o n c e r n e d t h e i d e n t i f i c a t : i o n o f
consi, s t en t , between g r o u p d i f f e r e n c e s in s u r v i v a l e x p e r i e n c e .
In Table 2 .c t he c u m u l a t i v e s u r v i v a l r a t e s from "Fable 2~a were
rank o r d e r e d between the t h r e e t r e a t m e n t g roups . The groups were
o r d e r e d a t each t ime i n t e r v a l , I. f o r t h e group wi th the lowes t s u r v i v a l
r a t e ( h i g h e s t a c c i d e n t / v i o l a t i o n r a t e ) , and 3 f o r the group wi th t h e
h i g h e s t s u r v i v a l r a t e . The f i g u r e numbers i n 'Fable 2 . c r e f e r to tile
c o r r e s p o n d i n g graphs of t h e . e n t i r e s u r v i v a l r a r e d i s t r i b u t i o n s ,.4hich.
a re p r e s e n t e d in the f o l l o w i n g t e x t . All f o u r d e c i m a l t ) l aces in t h e
c u m u i a t i v e s u r v i v a l r a t e s were used in bo th t h e . o r d e r i n g and the
-27-

' . . .
T a b l e 2 . b
Summary o f A c c i d e n t and V i o l a t i o n R a t e s a t S e l e c t e d • "rime I n t e r v a l s : ' F i r s t O f f e n d e r T r e a t m e n t g r o u p s
C~utc0me' M e a s u r e s
A c c i d e n t s D U I - R e c k l e s s
# Days From A s s i g n m e n t +
T o t a l A s s i g n e d
C o n t r o l H o m e S t u d y
I n - C l a s s
Age < 25 yrs.
C o n t r o l llome S t u d y I n - C l a s s
Age Z 25 y r s .
Control ftome S t u d y I n - C l a s s
S o c i a l Drinkers
C O n t r o l llome S t u d y I n - C l a s s
b l i d r a n g e P r o b l e m
D r i n k e r s
Control llome Study I n - C l a s s
Severe P r o b l e m D r i n k e r s
Control Ilome Study In.-Class
2,¢0 360 480
.0614 .0844 .1101
.0695 .0922 .1131
.0569 .0963 .1256
. 0741 . 1 0 0 3 . 1 1 4 3 • 0972 . 1 2 0 5 . 1 4 9 0 . 0 8 9 4 . 1 3 2 0 . 1 8 2 2
O53, Q .0531 • o379
.0748 . 1 0 7 8
.0756 .0920
.0695 . 0 9 2 6
.0326 .0528 .0704
.0757 .0834 .0924
.0516 .0731 . i 099
. 0 6 6 8
.069(}
. 0 6 2 0
. 0 8 0 0
. 0 6 3 2
.043a
. 0 9 0 4 . 1 i 0 2
. 0 9 3 9 . 1 1 4 8
. 1 0 0 5 .137,1
. 1 0 5 6 . 1 5 7 4 , 0 9 5 5 . 1 2 7 0 . 0 8 6 2 .0991
2 4 0 3 6 0 480
• 0574 . 0 7 5 4 , 0872 . 0564 0684 . 0 7 5 2 . 0502 . 0 6 6 0 . 0 7 2 0
.0615 . 0804 . 1004
. 0 7 4 5 . 0 8 1 3 .(1994
. 0 6 8 0 . 0 7 9 6 •0912
.0551 . 0 6 9 2 , 0792
. 0 4 6 0 .0611 .0611
. 0397 .0581 . 0 6 1 0
• 0314 .0514 . 0 6 5 8 . 0654 . n654 . 0654 . 0 2 9 8 .0361 , 0 5 4 3
.{16(12 . 0 8 1 7 .093{) 0479 . 0 6 2 9 .0664
. 0 5 0 3 .O(,4(I . 0732
. 0 8 2 8 . 0 9 9 8 . 0998
. 0 7 8 0 . 0954 . 1165
. 0 7 5 5 . 1 1 2 3 , 1 1 2 3
Mov ing V i o l . - A / R OFF.
2 , 1 0 360 480
. 1 4 9 9 • 1976 .2161
. 1 5 8 0 . 1 9 0 2 .2099
. 1 5 4 7 . 1 9 7 2 .•2293
. 1 9 6 9 . 2 5 5 6 . 2 7 6 6
. 2234 . 2 4 9 8 . 2 8 8 0
. 2 0 8 8 . 2511 ~ :,3 • ,~8{ . .
. 1214 . 1.622 . 1792 ' 5 q . • 1204 , . 5. 1655
• 1.231 . 1 6 5 6 . !9hO
. 1 3 0 8 . 1 7 9 4 .2(I1 ~, • 1 . 5 0 7 . 1 8 ¢ 1 6 . 1 8 ~ 6
• 1295 . 1 5 1 1 . 1788
• 1 . , .3 .2¢)09 2186 . 1 5 6 8 . 1 9 4 4 . 2 1 l l . 1 6 l l .2!121 . 2 3 3 9
. 1 5 4 2 . 2 0 8 9 . 2 2 a 5
. 1 7 2 2 .1874 .2353
. 1 6 1 4 . 2 3 6 4 .2741
- 2 8 -

T a b l e 2 . c
R e l a t i v e Order o f C u m u l a t i v e S u r v i v a l R a t e s a t S e l e c t e d , . T i m e I n t e r v a l s : F i r s t • O f f e n d e r T r e a t m e n t Croups
(1 = l o w e s t s u r v i v a l r a t e , 3 = h i g h e s t s u r v i v a l r a t e )
Outcome Measures
# Days From Assignment +
Total A s s i g n e d
Control l{ome Study In-Class
Age < 25 y r s .
Control ilome Study I n - C l a s s
A g e 2 25 y r s .
Control llome Study in-Class
S o c i a l D r i n k e r s
C o n t r o l . ltome S t u d y I n - C l a s s
H i d r a n g e P rob lem D r i n k e r s
Control Home Study In-Class
S e v e r e Prob lem D r i n k e r s
C o n t r o l 1 llome S t u d y t 2 I n - C l a s s , . [ 3
240
2 1 3 .
3 1 2
A c c i d e n t s
360
( F i g . 2)
D U I - R e c k l e s s • blovi.ng Vio l : A / I t O f f .
3 2 1
( F i g . 5)
3 3 2 2 1 1
( F i g . 8)
1 2 l 2 1 3 3 3 2
(Fig. 11)
3 3 3
1 1 2 2 1
( F i g . ] 4 )
3 3 2 2
1 1
480 2 4 0 3 6 0 4 8 0
( F i g . 3)
1 1 1 2 2 2 3 3 .3
.
2 3
( F i g . 17)
I. 1 l 2 2 2 3 3 , 3
( F i g . 6)
(Fie.. 9)
1 O z .
3
(l:i.g. 12)
( F i g . 15]
(Fig. 18)
2 3 1
1 2 3
1 2
3
1 2 3
,
1 2
240 360 480
( F i g . 4)
' 9
3 l
1 2 .5 3 2 1
( F i g . 71)
3 l l 3 2 2
2 ! 3
3 2 1
3
i :
(F i~ . 10)
(r ig . ~3)
%
(Fi,~ 16) , ~ .
. 9
3 1
( F i g . 19)
-29-

p l o t t i n g o f t h e d a t a . This p r e c i s i o n was nec~essar~ , t o r evea i : ~ a t t c r u s • , , . ,
but t he r e a d e r i s Caut ioned t h a t t h e a c t u a l magni tude ,)f between prot:p
d i f f e r e n c e s in s u r v i v a l r a t e a r e f r e q u e n t l y minute .
h ) a t t e r n was d e f i n e d a s c o n s i s t e n t i f : , . . . ~ .
1 . The r e l a t i v e o r d e r o f g r o u p s u r v i v a l r a t e s was ma:i'nta:ined • i
between a l l t h r e e t ime i n t e r v a l s ( i . e . , 240, 360, and
480 d a y s ) .
AND e i t h e r 2 or. 3
2. The o r d e r p a t t e r n o c c u r r e d in two or more a n a l y s e s f o r
t h e same: outcome measure ( e . g . , t o t a l a s s i g n e d age > ~
y e a r s , and s o c i a l d r i n k e r s , f o r a c c i d e n t s ) .
3. T h e o r d e r p a t t e r n o c c u r r e d in tlie same a n a l y s i s f o r two
or more outcome measures (e . , . , . , s e v e r e problem d r i n k e r s
f o r DUI's and a c c i d e n t s ) .
The f i r s t c r i t e r i o n f o r a c o n s i s t e n t p a t t e r n e l i m i n a t e d a l l but
f i v e o f t h e e i g h t e e n a n a l y s e s summarized in Table 2 . c :
1. Severe problem d r i n k e r s / a c c i d e n t s (F ig . 17)
2. T o t a l a ss igned /DUI (F ig .3 )
3. Age > 25 yea rs /DUI (F ig .9 )
4. Midrange problem d r i n k e r s / D U I (F ig .15)
5. Age >_ 25 Years./movJng v i o l a t i o n (F ig . lO)
The f i r s t p a t t e r n l i s t e d above shows i n - c l a s s wi th t h e t~i.ghest
s u r v i v a l r a t e , t hen home s t u d y , fo l lowed by the c o n t r o l group wi th the
lowes t s u r v i v a l r a t e . t towever, t h i s p a t t e r n d id not o c c u r f o r any o f
the o t h e r a n a l y s e s u s ing a c c i d e n t d a t a , nor d id i t Occur in the otl~er
severe problem • drinker analyses using DUI's or moving violations, thus
by definition it was not consistent.
The second pattern identified was for theanalysis of total
assigned groups using DUI's as the outcome measure. In-class education
had the highest survival rate followed by home study and then the control
group with the lowest survival rate. This pattern was. replicated for
the age group 25 years and older with the DUI outcome measure. For
midrange problem drinkers, the control group still had the lowest. DIll
survival rate•but the home study group showed a hi~,her survival rate
than in-class education. Although the results of the midrange problem
drinker analysis did not exactly replicate the findings for total
-30-

a s s i g n e d and 25 y e a r s o r o l d e r , t i le l o w e r s u r v i v a l r a t e - f o r t h e c o n t r o l
g r o u p l e n d s ;it l e a s t some s u p p o r t t o t h e c o n t e n t i o n : t h a t we have
i . d e n t i f i e d a c o n s i s t e n t p a t t e r n in t r e a t m e n t g roup s u r v i v a l --q ..... t . , ~.%2 . 1 .
The l a s t p a t t e r n in T a b l e 2 . c t o p a s s t h e f i r s t c r i t e r i o n o f
c o n s i s t e n c y was f o r t h e age 25 y e a r s o r o l d e r s u b g r o u p u s i n g t o t a l mov:ing
v i O l a t i o n s as t h e ou tcome m e a s u r e . In t h i s a n a l y s i s t h e i n - c l a s s
e d u c a t i o n g roup had t h e l o w e s t s u r v i v a l r a t e f o l l o w e d by .the c o n t r o l
g r o u p and t h e n t h e home s t u d y g roup w i t h t h e h i g h e s t s u r v i v a l r a t e .
l low.ever, t h i s p a t t e r n d i d n o t o c c u r f o r any o f t h e o t h e r analy.'-;e.~ u s i n g
moving v i o l a t i o n s , no r (lid i t o c c u r iln t h e o t h e r age 25 . y e a r s o r o l d e r
a n a l y s e s u s i n g DUI ' s o r a c c i d e n t s as t h e ou t come m e a s u r e . Thus , t h e
p a t t e r n was no t c o n s i s t e n t .
O v e r a l l , t h e r e were o n l y . t w o a n a l y s e s o f t r e a t m e n t e f f e c t i v e n e s <
ou t o f e i g h t e e n which p r o d u c e d a c o n s i s t e n t ( a l b e i t no t s t a t i s t i c a l l y
s i g n i f i c a n t ) ' p a t t e r n o f r e s u l t s . The a n a l y s i s o f t o t a l a s s i g n e d g r o u p s
showed t h e l o w e s t DUI s u r v i v a l r a t e f o r t h e c o n t r o l g roup , and t h e
h i g h e s t DUI s u r v i v a l r a t e f o r t h e i n - c l a s s e d u c a t i o n g r o u p . Th i s
p a t t e r n was r e p l i c a t e d f o r t h e o l d e r o f f e n d e r g r o u p bu t no t f o r t h e
y o u n g e r o f f e n d e r s . One c o u l d a r g u e f o r o r a g a i n s t t h e r a t i o n a l i t y
o f t h i s o b s e r v a t i o n . Al l t h a t c a n r e a s o n a b l y be done a t t h e p r e s e n t
t i m e i s t o s i m p l y r e p o r t t h e f i n d i n g
One migh t .have e x p e c t e d t h e a b o v e p a t t e r n to. have been r e p l i c a t e d
amlong t h e s o c i a l d r i n k e r o f f e n d e r s , l f , h o w e v e r , t l : e o f f e n d e r s
d i a g n o s e d as s o c i a l d r i n k e r s t e n d e d t o be y o u n g e r , a n d . i , f y o u n g e r
o f f e n d e r s t e n d e d t o be l e s s i n f l u e n c e d by o u r e d u c a t i o n a l p r o g r a m s ,
t h e n t h e s o c i a l d r i n k e r s u b g r o u p would n o t n e c e s s a r i l y r e p r e s e n t a
more t r e a t a b l e p o p u l a t i o n . M e t h o d o l o g i c a l l y , t h i s . s u g g e s t s , t h a t
s u b g r o U p s s h o u l d be d e f i n e d usin~g a p r o f i l e o f d e s c r i p t i v e v a r i a b l e s
r a t h e r t han u s i n g c a t e g o r i e s o f a s i n g l e v a r i . a b l e .
The l a s t s e t o f a n a l y s e s a s s o c : i a t e d w i t h . t r e a t m e n t ou t come i n v o l v e d
7a compar ison o f t h e n o n - v o l u n t e e r s ample w i t h t h e c o n t r o l g r o u p
( r e p r e s e n t i n g t h e u n t r e a t e d v o l u n t e e r s ) . I f t h e s e g r o u p s d i f f e r e d
s i g n i f i c a n t l y .in s u r v i v a l e x p e r i e n c e we would have t o be c a u t i o u s in
g e n e r a l i z i n g any p o t e n t i a l t r e a t m e n t e f f e c t s found f o r t h e t o t a l
a s s i g n e d g r o u p s . T a b l e 3 . a shows t h e c u m u l a t i v e s u r v i v a l r a t e s a t
2,10, 360, and 48{~ d a y s from a s s i g n m e n t ( o r f rom s e n t e n c i n g f o r t he
- 3 1 -

T a b 1 e 3 . a
Summary 0 f C u m u l a t i v e S u r v i v a l R a t e s a t S e l e c t e d T i m e I n t e r v a l s : T o t a l C o n t r o l Group A s s i g n m e n t s ~ ,
v e r s u s N o n - V o h m t e e r s
Outcome H e a s u r e s
# Days From A s s i g n m e n t +
T o t a l A s s i g n e d
C o n t r o l N o n - V o l u n t e e r
Accidents
240 3 6 0 480
.9386 .9156 .8899 ,9413 .9183 .9038
! ) U I - R e c k I e s s
.240 360 480
. 9426 ,9266 .9128 ,9527 .9417 .9307
Moving V io l . -A /R O f f .
240 360 4RO
.8501 .8024 .7q39 • 8550 .8258 .~O76
# Days F r o m A s s i g n m e n t ÷
T o t a l .Ass igned
C o n t r o l N o n = V o h m t e e r
Table 3.b
Summary o f A c c i d e n t and V i o l a t i o n R a t e s a t S e l e c t e d Time I n t e r v a l s : T o t a l C o n t r o l Croup A s s i g n m e n t s
v e r s u s N o n - V o h m t e e r s
Outcome M e a s u r e s
A c c i d e n t s D U i - R e c k l e s s Moving V i o l . - A / R O f f .
240 360 480
• 0614 0844 .110] • 0587 .0817 • 0962
240 560 480 f 240 360 480
J . .
.0574 .0734 .0872 ] .1499 .1976 .2161
.0473 .0583 . 0 6 9 3 , . 1 4 5 0 .1742 .1924
# Days From Assignment 4
T o t a l A s s i g n e d
Cont ro 1 Non-Volunteer
Table 3.c
R e l a t i v e O r d e r o f C u m u l a t i v e S u r v i w t l R a t e s a t S e l e c t e d Time I n t e r v a l s : T o t a l C o n t r o l {;roup Assignment~; v e r s u s N o n - V o l u n t e e r s (1 = l o w e s t s u r v i v a l r a t e , 2 = h i g h e s t
s u r v i v a l r a t e )
Outcome M e a s u r e s
A c c i d e n t s DUI-Reckless b/oving V i o l . - A / R O f f .
240 360 480
( F i g . 2)
1 1 1 2 2 2
240 360 480 240 36O 48O . . . . . . . . . . . . . . . . . . . . . . . . . . . . . . . . . I-- .................................................... --
(Fi~,. , ) Il l : i f , . 4 !
1 1 l 1 I I 2 2 2 2 2 2
- 3 2 -

non-volunteers). The corresponding accident and v Lolation rate s d '
a r e shown in T a b l e 3 .b and t h e r e l a t i v e o r d e r • o f s u r v i v a l rathes,
a r e shown in T a b l e 3 . c . O v e r a l l , t h e r e s u l t s i n d i c a t e d no : : ,
statistically significant differences between the control'g~oup
and the non-volunteer sample. There was, however, a consistent
tendency for the n0n-volunteers to have a higher survival rate than
the control group volunteers. This may have been due to:the fact
that the non-volunteer sample Contained a reiatively higher pro-
portion of low BAC cases which were reduced to reckless driving.
In general, low arrest BAC's suggest less severe drinking problems.
• ?
-33-

e~
e~
#J iq
i U
,99
.98
.97
.96
.95
.94
.93
.92
.91
.9C
.8,1 ,88
.87
.86
0 0 6O
,-\
-\ x
k;.
\ , "7\
\ ' \
° , ~
". "%.% %
" ' . ~ '~ ' ,
"" " " " ":.-~ .27.-. 77. ~ . . . . . .
Contro l
l~mc St¢=dy . . . . .
In-Class .........
Non-Voluntoers
120 180 240 300 360 420 480 540 600 660 720 Exposure Time (Days)
F igure 2
Plotof Ctmul~tive Survival Rates for Total First Offender Treatment Groups and the Nonvolunteer Sample: F i r s t Accident
780
• 4
- 3 4 -

i.OG
.9g
.98
.97
.96
.95
.ga
.93
~ .92
ell .91
~ .90 0
o .89
~ • .88
.87
.86
.85
0
° ~ ' ~ l • " ' ' "
">" ~ _ ~ _ . . . . . . . . . . . . . . . .
• !
Control
I~me Study
In-Class . . . . . . . . . . N o n - V o l u n t e e r . . . . . . . . . . .
60. 120 180 240 300 ' 360 . 420 480 540 600 660 720 780
EXl~Sure Time (Days)
Figure 3
Plot of Cu~mlative Survival Pates ForTotal First Offender Treatment Groups and The NonvOlunteer' Sample: First DUI or Reckless Driving Offense
-35-

k
tD
a
• U
1 . 0 0
.99'
"98
.97
.96
.gS
294 . 93
. 92
o9!
. 9 0
, s9
o8B
.87
. 86
,85
. l l4
, 82
. 8 !
.80
, 79
. 78
,77
, 76
°75
.74
• . 73
.72
. 7 !
. 70
. 69
o68
o67
0
"%.° o.
*o
Dm•
'~* * * 4~Sb.m ~ I . m
t. •
~B O
@~eOQ Ot g I t @ @OO"BIOt Q b @ I
C o n t r o l
llome Study ...... In-Class ........ -
Non-Volunteer ...........
0 60. 120 "I'80 240 500 360" 420 480 540 500 660 720 780
Exposure T i . e (Days)
F i g u r e 4
P l o t o f Cummlative ,Surv iva l P ~ t e s For T o t a | F i r s t O f f e n d e r Treatment Groups and [ h e N o n v o l u n t e e r Sample: F i r s t Moving V i o l a t i o n or hny A/R O f f e n s e
• '36-

•1.oo .99
.98
.97
.9S
.93
.g2
.91
.90 " " . R~
•88
,87
. 8 6
~ . .ss ~" .84
.s2
. . ,
~ .77
~ . 7 6 ' U
.75
.74
.73
.72
.71
..70
..69
.67
" . ° , •
,%
%
•.o. Qo.
•o
\
t o . . . . .
• o.o ....o ..o... ..... ...
Control
iJome study .........
In-Class ..........
60 t20 180 240 300 360 420 4~0 540 600 660 720 780
Exposure Time (D~ys) : . , . , ,
:. Figure S
Plot o f Cumulative Survival R a t e s f o r F i r s t Offender Treatment Groups, Age Less Than 25 Years: F i r s t Accident
- $ 7 -

1.00
,99
.98
.97
M .=
.V )
IP
.94
.93
.92
.gL
.s9
.88
'.87
°g6
.85
0 0
• i ̧ ' ' • • " "
4
• ~x ;' . . ~ °. , " .
":-__-"'- ::: . . . . - . . . . .:'..... ....
Control
l~me S t u d y ........
In-Class.~ ........
60 120, 180 240 300. 360 420 48N 540 600 660 72u 780
ExpOsure Time (Days)
Figure 6 '"
Plot ,oN Cu=ulat ive Surv iva l Rates For F irs t Offender Treatment G r o u p s , ARe Loss Than 25 Years: F irs t I~I or Reckless
Driving Offense
/!
- 3 8 -
1 .C~O .99 ~gS -.q7 .96
. 9 0
. 8 9
. 8 8
.87
. 8 6
. 8 5
. 84
. 8 3
.s2
. 81
lu . 79 O
~ .78 ~ .77-
i . , , U
.75
.74;
.7~.; • 72 '
.71 !
. 70
. 69
.68
.67
0
. 9 5
. g z
. 91
C o n t r o l
Ilomo S tudy . . . . . .
l . - C l a s s . . . . . . . . .
.
% % w . . ~ - . . . . . . . . . .
° . ° ° . . . . . ° ° o ° o • ~ . . .
60 120 180 240 300 360 420 480 $40 6~0 - 660 720
" ' " . . . . E x p o s u r e Time (Days) •
F i g u r e 7
Plo~ o f C u m u l a t i v e S u r v i v a i R a t e s F o r First O f f e n d e r T r e a t m e n t C r m l p s , A~e Less T h a n 2 S Y e a r s : F i r s t Moving V i o l a t i o n o r Any A/R O f f e n s e
789
- 3 9 -

.9, \ , X ' . .
.93 ' ~" ~" .
• ~ , , ~ ' , , . . .
= .91 .~ \ h . . . . . . . . . . . . . . . . . . . . . . . . . . [,o \ ' , " ~. " ~ - : - . . . . .
.88
t . J
.87
.86
.85
f I
0 0 60
C o n t r o l
IIo~e Study
I n - C l a s s . . . . . . . . . . .
120 180 240 500 360 4 2 0 480 540 600 660 720 780
E x p o s u r e T i=e (Bays )
F i g u r e 8
P l o t o f C u m u l a t i v e S u r v i v a l R a t e s For F i r s t O f f e n d e r T r e a t m e n t G r o u p s , Age 25 Y e a r s o r ' O l d e r : F i r s t A c c i d e n t i
- 4 0 -

1,0C
.gs
.ga
,97
.9~
.9S
.94
;93
.gz
=i ;91
• +8~
.88
U
o87
.86
.85
0
!
o ~ o " . • •
~ X S~'. .. E
• : : - , . .
. . . . ~x" . . . . . . . . . . . . . .
Cont ro l
Ilome Study ...... ......
I n - C l a s s . . . . . . . . . . . . .
60 [20 180 240 300 360 420 480 540 600 660 720 780
E x p o s u r e Time (Days)
F i g u re 9
P l o t o f Cumala t ive S u r v i v a l Ra te s For F i r s t O f f e n d e r T rea tmen t Croups , .Age 25 years or Older: First Nil or Reckless Driving
O F f e n s e
- 4 1 -

1 . 0 0 ~
.991~
. 9 8
. 9 7
. 9 6
.9$
, 9 4
.93
. 9 2
. 9 1
.gO
.88
.87
. 8 6
.ss
.82
~,.80 • O
.~9
~ . 7 8 ~ .77
.76 u .7S
.74
.73
.72
.'71
. 7 0
. 6 9
. 6 8
.67
~,%%% . . .
. . • . . * . - . X ~ ' . " . .:
" ' . " ~ ~ _ _ ~ . ~ "~ ~__~.~
~ -
% ' ° , * * .
I J Q Q 0
Control
llomc Study " " "
In-Class . . . . . . . . . . .
* ° , ' , o . , , • .. o ° ° ° . ° ° , .
60 120 180 240 300 360 420 480 540 600 660 720 7~0
Exposure Time {Days)
Figure 10
Plot of Cumulative Survival Rates for Firs t offender Treatment Groups, ARe 2S Years or Older: F i r s t Hoving Violation or Any AiR Offense
- 4 2 -

S.oo~...... ' 9 1 I ~ '°~
.9 '~"'"" . \ E
• ~ I e ' .,~.~ , !.. \ . . ' . i • | • " o : .
. , , , . °.i \
.92:
,. .91
u .89 6 J
.SS
. 8 7
. 8 6
. 8 5
0
- - - X
%. . . o ,
o ° * o
% -
%.._ .. . ' . . _ . .
C o n t r o l
Ilome S t u d y
I n - C l a s s . . . . . . . . . . .
. J . o . o g o o • o ° ° • o • I o o • • • • o•
60 120 180 240 300 360 420 480 540 600 660 720 780
Exposure Time (Days) '
Figure 11
Plot o f C~milat ive Surv iva l Rate fo r F i r s t Offender Treatment• Groups, Socia l Drinkers : F i r s t A c c i d e n t
- 4 3 -
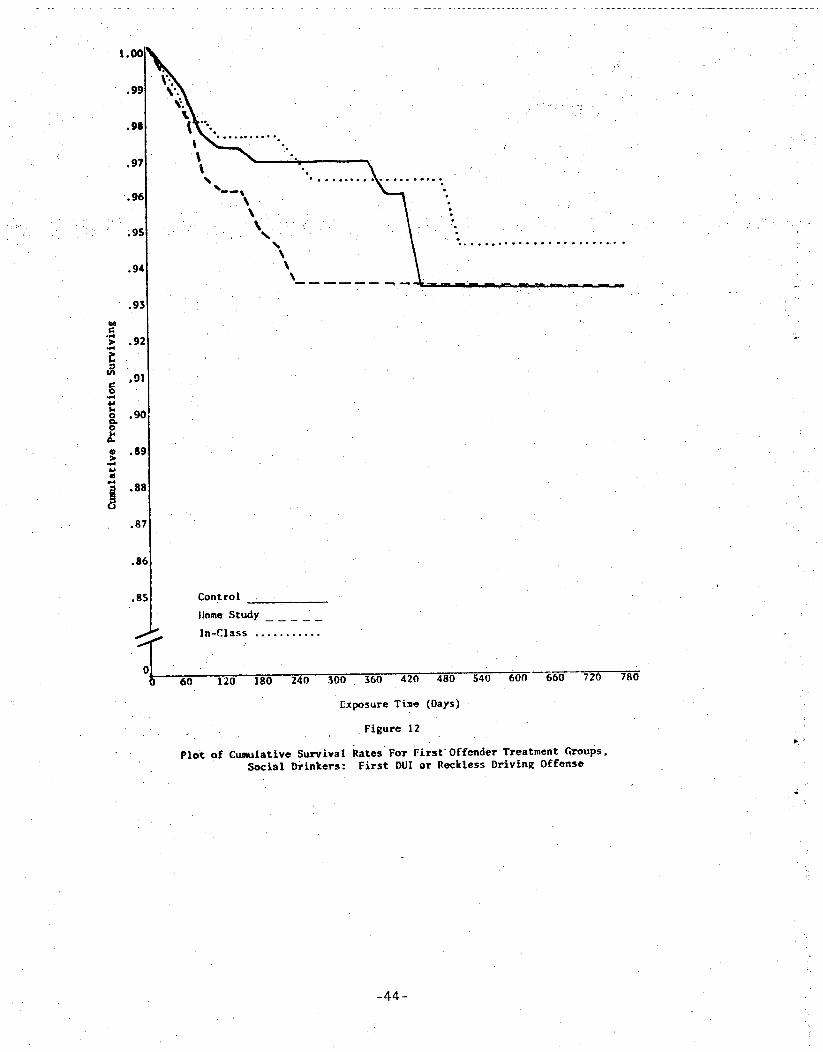
1.00
.99
. g s
W e~
o 4- '
0
1. Q
m4
.97
. 9 6
. 9 S
.94
.93
.92
,oll I
• 90
.89
. s s
.87
.86
• - .. - .
. % .
. . . . . . : ::! ¸ • • ~ ' : o o -
Contro l
Ilome Study
I n - C l a s s . . . . . . . . . . .
60 120 180 240 500 360 420 480 540 600----660 720 780
Exposure Time (Days)
F i g u r e 12
P l o t o f C u m u l a t i v e S u r v i v a l Rates For F i r s t O f f e n d e r Treatment Groups , S o c i a l D r i n k e r s F i r s t DUI or R e c k l e s s D r i v i n g O f £ e n s e
b :'
- 4 4 -
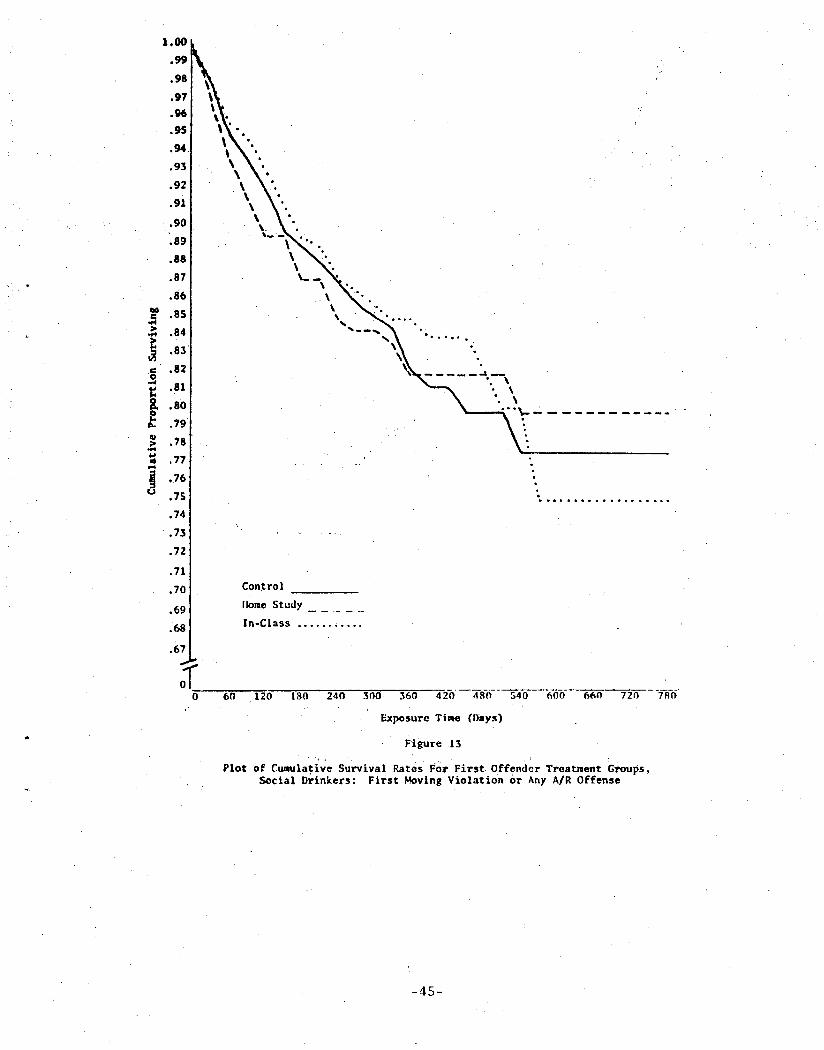
1.00
.99
.98
.97 ,96 .95
• 94~
.93
.92
.91
.90
.a9 .88
•87
.86
.~ . s s • ,~ ,84
~ .82
~ . . s o
~ .79
i, .77
,76
u .75 .74
.73
.72
.71
.70
.69
. ' 6 8
.ii7
0
• .. ~ " .
• % • , ° . . o o ~ •
~\ "..
• * * • . * * o . * o o • • ° • . . .
C o n t r o l
I~me S t u d y
I n - C l a s s ' • . . . . . ~ . . . .
0 60 120 180 2 4 0 5 0 0 360. 4 2 0 ,~80 540 6 0 0 6 6 0 720
E x p o s u r e T i m e ( D i y s )
Figure l~
Plot of CumulaTive Survival Rates For First . Offender Treatment Groups, Soc ia l Drinkers: F ir s t Moving V i o l a t i o n or Any A/R Offense
7RO
- 4 S -

i.ool
,99
.97
.96
: .9S
.s4
.93
,.~ .92
i .9: ~ .90
.89
.88 .87
.86
.8S
.84
.83
0
•'-.%%
q
%% "..
• " k % ' N
" .etjo~.
'-N.. ". .£
% a. ~,
° ° l °
Control
Ilome Study
l . - C l a s s . . . . . . . . .
I I
I l
6 0 1 2 0 i80 240 • 300 3 6 0 420 4 8 0 540 600 660 720 780 Exposure Time (Days)
Figure 14 • Plot of Cumulative Survival Rates For First Offender Treatment Groups,
• " Midrahge Problem Drinkers~: • F i r s t Accident
i
i%• L~,
-46-

'p
IL .00 I
.99
.98
.97
.96
.95
.94
.93
"~ .92 -/ ~ .91
~' . 9 0 g
o . 8 9
• ~ .88
U
.87
.86
.85
0 0
. .~\ •
Control
l~me Study
I n - C l a s s . . . . . . . . . . .
60 120 180 240 .300 360 420 480 540 600 660 720 78(~
Exposuro Time .(I~FS)
• ] : igure 15
P l o t o f Cumulat ive S u r v i v a l R a t e s For F . i r s t O f f e n d e r Treatment~ Groups. Midrsnge Problem D r i n k e r s : F i r s t , DUI o r R e c k l e s s D r i v i n g
O f f e n s e
- 4 7 -
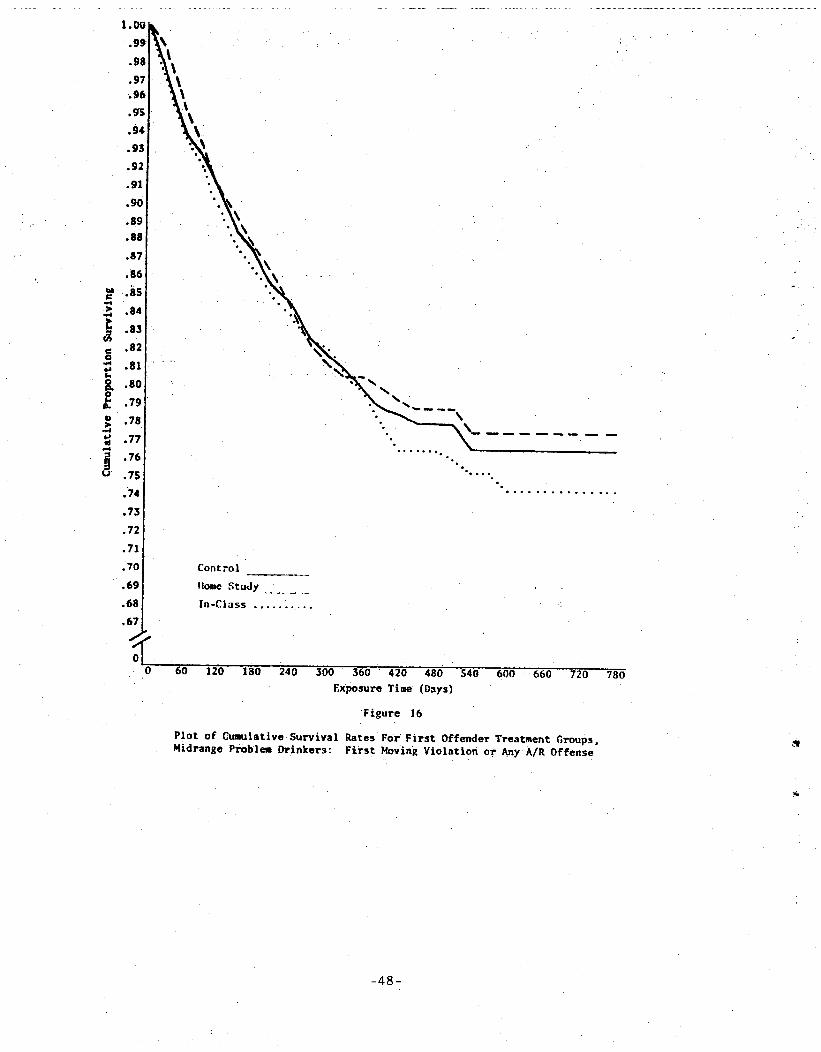
1,00
.99 !
.98
.97 •.96
.95
.94
.93
.92
,91
.90
. 8 9
.88
. 8 7
-..ks
.'~ .84
.S3
~ .82 .o .81 4tJ
~..80 .79
o .78
.77
.76
u~ .75
.74
.73, !
.721
.71
, 7 0
o69
.68
,57
0 0
@a
°o
"..~o i
Control
Ilome Study
In-Class
6 0 1 2 0 180 240 300 360 ' 420 480 540 6 0 0 6 6 0 720 780 EXposure Time (Days)
F i g u r e 16
Plot o f Cumulative Survival Rates For F i r s t r Offender Treatment Groups, Midrange Problem D r i n k e r s : F i r s t HovinR V i o l a t i o n o r Any 'A/R O f f e n s e
-48-

x .OOl~ ,.
b4
_,>
0 .P m
k#
J gJ
i99
.98
. 9 7
.96
.gS
.94
.9~
.92
o91
.90
.&9
.88
.87
.86
.85
D g O " Q O D
Q O
t I t | l ̧ l - - \ .
. m
. o .
l _ - k ' i
° o • ~ • • • • o . o . . o . • . o o _ ~ . o . .
• 8 4
.83
.82
•Control
llome S tudy
I n - C l a s s . . . . . . . . . . .
i 6 0 120 180 240 300 560 420 4801- 540 600 660 ~720 780 E x p o s u r e , T i m e C D a y s )
Figure 17 Plot of Cumulative Survival Rates for First Offender Treatment Groups, Severe
Problem Drinkers: First Accident
-49-

1.d0 ~
.99 •
9s i ! :
.97 ~ . , "'. i
. 9 6 :
% ". .gs ~ .
.g4 ~ -.
.93
. :
, 9 0
l u >
i , J
~ J
.89
.88
.8?'i
.86
.8.5
.B4
0 0
. % . . . . . . . . . \ . . . .
C o n t r o l
Ilome Study _ _ . . . . .
I n - C l a s s . . . . . . : . . . .
6 0
,I ".l
°~ • m • • • of° J , e oo • i •
I t I I I t
I
120 180 24b 300 360 420 480 540 600- 660 720 780 Exposure Time (Days)
F i g u r e 18
Plot of Cumulative Survival Rates For First I offender Treatment Groups, S e v e r e P r o b l e m D r i n k e r s : F i r s t DUI o r R e c k l e s s D r i v i n g O f f e n s e
i ~ .? .
%
• -50-

1 .00
.99
.98 • 971
,96
.95
.94
.93
.92
.91
.90
,89
.88
,87
;86
'85 .84
. 83
~: .82 ©
q,,I .~ .81 lu
- . 80
.79 #a
.Ts
.77
.76 o7S ,74 ,73
.72 ,71
,70
,69 .
'6 i~,
0
I.
%
¶. o
Contro l
llome Study
In-Class ...........
60 120 180 240 300
% %
D
@ N w ~ l,
I l
I • l
i ¸ :
I
360 420 4,q0 540 600 • 660 " 720 78N
Exposure Time (Days)
Figure 19
Plo t o f Cumulat ive Survival Rates For First Offender Treatment Groups, Severe Problem Drinkers : . .Fi rs t Hoving Violation or Any A/R Offense
- $ I -
E f f e c t i v e n e s s of Letter. Monitoring and Fo l low-UpInterv i ews
; .' ' •
.' ,. ,
.]
The s t a t i s t i c a l a n a l y s i s of the quarter ly l e t t e r monitorin~
and fo l low-up i n t e r v i e w procedures was based on the tot:al ass igned
groups, n o s u b g r 0 u p s w e r e : e x a m i n e d . The t o t a l sample"si.zes were as
follows:
Letter V..Ionitoring
' 74o Letter ~.1onitoring
T o t a l
Follow-Up Interviews
No Follow-Up Interviews
Total . . . . . . . . . . . . . . .
/
1 , 9 2 6 .
1 ;939
3,86s
1 ,276
1,673
2,949
l~hile the random assignment of f i r s t o f fenders began in
September, 1977, the Follow-Up Unit was not s t a f f e d and operation,~.l
u n t i l ~ l a y I5, 1978. Consequently~ a l i cases ass igned t o the f o l l o w -
up in terv iew c o n d i t i o n p r i o r to t h i s date did not a c t u a I l y r e c e i v e
an in terv iew, and thus~, were excluded from t h e a n a l y s i s o f fo l l ow-up
e f f e c t i v e n e s s . Noreover, the r e l a t i v e s i z e o f the f o l l o w , u p and
no fo l low-up groups does not r e f l e c t the 50/50 ass ignment :proport ion .
This d i s p a r i t y r e s u l t e d when the eva lua tor was forced to reduce the
proport ion of c l i e n t s randomly ass igned to fo l low-up in terv iews
to 2Q p e r c e n t , f o r , a two month p e r i o d between~r.,~arch 23, 1979 .and
},lay 23, .1979 b e c a u s e - o f de lays in h i r ing add i t i ona l counse lors
to handle both i n i t i a l and ten-month in terv i ews . Unfor tunate ly , • . _ . . ,
t h i s reduct ion co inc ided with a high vo!ume period of court referr:-,.Is. . . . . . . . . . . . . . . , . • • . . . . . . . . . . . . .
Further, the 'as s ignment p r o p o r t i o n had" been -previously. s e t . at 20
percent .during the f i r s t month of u n i t operat io n between May 1 5 ,
1978, and June 20, 1978, in order to aIlow the f i r s t Follow-lip
Counselors and c l e r i c a l s t a f f a per iod of an- the - job t r a i n i n g .
The cumulat ive surv iva l ra tes at the Selected time i n t e r v a l s
are presented in Table 4 .a for both the l e t t e r m o n i t o r i n g and fo l low-up
in terv iew ana iyse s . TabIe 4.b shows the corresponding acc ident and
V i o l a t i o n ra tes and Table 4 .c shows the r e l a t i v e order of the cumulat ive
surv iva l r a t e s .
-52-
# Days From Assignment ÷
T o t a l Ass igned
L e t t e r M o n i t o r i n g
No L e t t e r M o n i t o r i n g
Follow-Up
No Foilow-Up
Day s From Assignment
Total Assigned
l,etter Monitoring
NoLetter Monitoring
F o l l o w - U p
No Follow-Up
Table 4.a
Summary of Cumulative Survival Rates at Selected Time Intervals: Letter Monitoring vs. No Letter Monitoring and Follow-Up vs. No Follow-Up
Outcome Measures
A c c i d e n t s DUI-Reckless Moving V io l . -A /R Off .
240 360 480
.9381 .9060 .8728
. 9 3 6 8 .9145 . 8 9 4 8
. 9441 9237 9 0 6 7
• 9434 .9274 .9108
240 360 480
• 9367 .9178 .9080
. 9 5 4 0 . 9 4 3 7 .9361
. 9667 9 5 8 4
. 9 5 9 9 .9514
.9542
.9431
240 360 480
.8337 .7957 .7691
. 8 5 7 7 . 8145 . 7 9 4 3
.8846 .8620 .8546
.9007 .8815 .8704
Table 4.b
Summary of Accident and Violation Rates at Selected • Time Intervals: Letter Monitoring vs. No Letter Monitoring and Follow-Up vs. No Follow-Up
Outcome Measures :
Accidents DUI-Reckless Moving Viol.-A/R Off.
240 360 480
.0619 .0940 .1272
.0632 .0855 .1052
• 0559 .0763 .0933
.0566.0726 .0892
2 4 0 360 480
• 0653 .0822 • 0920
.0460 .0563 .0639
240 360 480
/1663 .204-3 .2509
• 1423 .1855 .20!;7
.0333 . 0 4 1 6
.0401 .0486
.0458
0569
• 1154 . 1380 . 1454
0993 .1185 .1296
is3 _~

.- , ,
. 3
#.iDays From Assignment
Tota l Assigned
L e t t e r M o n i t o r i n g
No L e t t e r Moni tor ing
Follow-Up
No Follow-Up
Table 4 . c
R e l a t i v e O r d e r o f C u m u l a t i v e Surviva l Rates at S e l e c t e d Time I n t e r v a l s : L e t t e r Monitor in~ vs . No L e t t e r Moni tor i ng
a n d F o l l o w - U p vs . No Fo!low-U p (1 ~ l owes t surviv .al r a t e , 2 = h i g h e s t s u r v i v a l r a t e )
Outcome Measures
A c c i d e n t s l ) l l I - R e c k l e s s D
Moving V i o l . - A / R Off .
240 360 480
1
(F ig . 20)
1 1
2 2
(F ig . 23) 1 1
2 2
240 380 4gO
(F ig . 21)
1 1
~2 2
(Fig . 24) 2 2
1 1
240 560 4 8 0
(F ig . 22)
1 l
2 2
(F ig . 25) • 1 1
2 2
/
'-L
- 5 4 - i ~
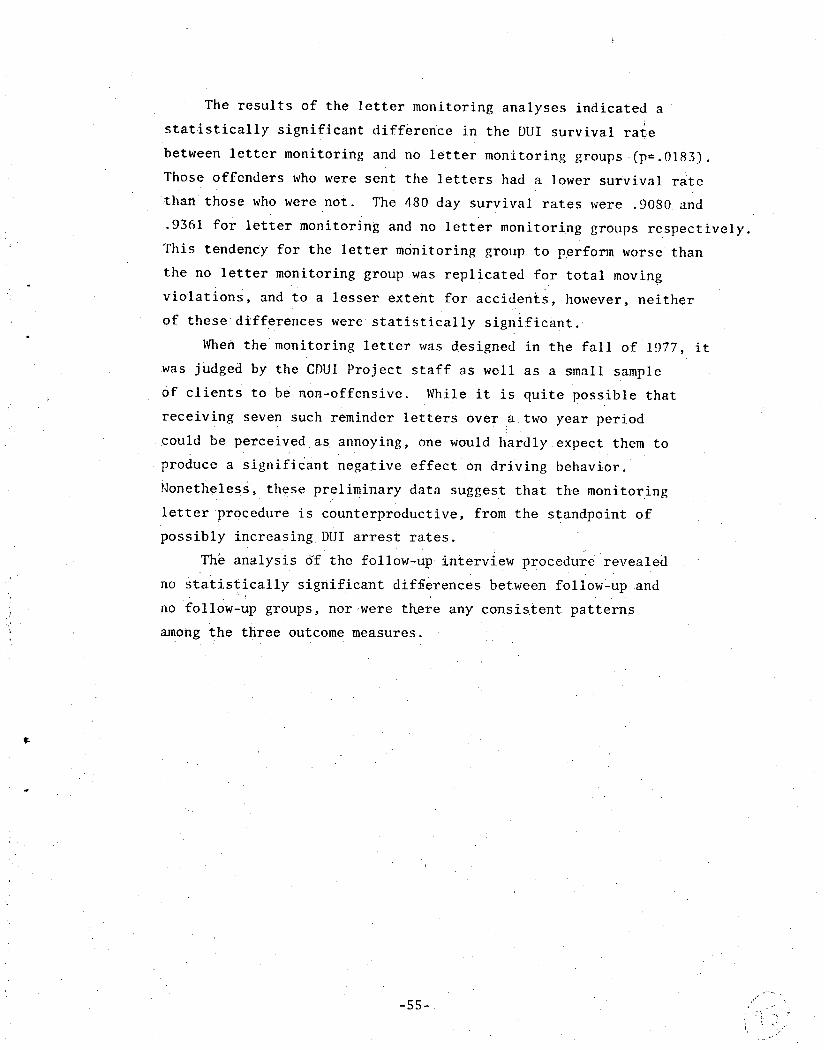
The r e s u l t s o f t h e l e t t e r m o n i t o r i n g a n a l y s e s i n d i c a t e d a
s t a t i s t i c a l l y s i g n i f i c a n t d i f f e r e n c e in t h e DUI s u r v i v a l r a t e
be tw een l e t t e r m o n i t o r i n g and no l e t t e r m o n i t o r i n g g r o u p s - ( p = . 0 1 8 3 ) .
Those o f f e n d e r s who were s e n t t h e l e t t e r s had a lower s u r v i v a l r a t e
t h a n t h o s e who were n o t . The 480 day s u r v i v a l r a t e s were .9080 and
.9361 f o r l e t t e r m o n i t o r i n g and no l e t t e r m o n i t o r i n g g r o u p s r e s p e c t i v e l y .
T h i s t e n d e n c y f o r t h e l e t t e r m o n i t o r i n g g roup t o p e r f o r m worse t h a n
t h e no l e t t e r m o n i t o r i n g g roup was r e p l i c a t e d f o r t o t a l moving
v i o l a t i o n s , and t o a l e s s e r e x t e n t f o r a c c i d e n t s , however , n e i t h e r
o f t h e s e d i f f e r e n c e s were s t a t i s t i c a l l y s i g n i f i c a n t . ~
When t h e m o n i t o r i n g l e t t e r Was d e s i g n e d in t h e f a l l o f 1977 i t
was j u d g e d by t h e CDUI P r o j e c t s t a f f as w e l l as a sma l l sample
o f c l i e n t s t o be n 0 n - o f f e n s i v e . While i t i s q u i t e p o s s i b l e t h a t
r e c e i v i n g seven such r e m i n d e r l e t t e r s o v e r : a two y e a r p e r i o d
c o u l d be p e r c e i v e d as a n n o y i n g , one would h a r d l y . e x p e c t them to
p r o d u c e a s i g n i f i c a n t n e g a t i v e e f f e c t on d r i v i n g b e h a v i o r .
N o n e t h e l e s s , t h e s e P r e l i m i n a r y d a t a s u g g e s t t h a t t h e m o n i t o r i n g
l e t t e r p r o c e d u r e i s c o u n t e r p r o d u c t i v e , f rom t h e s t a n d p o i n t o f
p o s s i b l y i n c r e a s i n g DUI a r r e s t r a t e s .
The a n a l y s i s g f t h e f o l l o w - u p i n t e r v i e w P r o c e d u r e r e v e a l e d
no S t a t i s t i c a l l y s i g n i f i c a n t d i f f e r e n c e s be tween f o l l o w - u p and
no f o l l o w - u p g r o u p s , n o r . w e r e t h e r e any c o n s i s t e n t p a t t e r n s
among t h e t h r e e outcome measu re s
-55-

1,00
.99
. g e
/- /
I i
0
.] U
.97[.96 ' "
.gSi
. 94
, 93
. 92
. 86
.85
0 0 6O
:91
.90
. g 9
. 88
.87
%
\
\
, \
l l l
L e t t e r P l o n i t o r i u g
No L e t t e r ~ h ) n i t o r i u g
120 180 240 300 360 420 480 540 600 660 720 780
Exposure Ti=e (D~ys)
FiguTe 20
P l o t o~ C t m u l a ~ i v e S u r v i v a l Rates For H o n i t o r i n ~ L e t t e r and No . Honi tor ing Letter Groups: F i rs t A c c i d e n t
\
- 5 6 - r,r
, i~: ¸
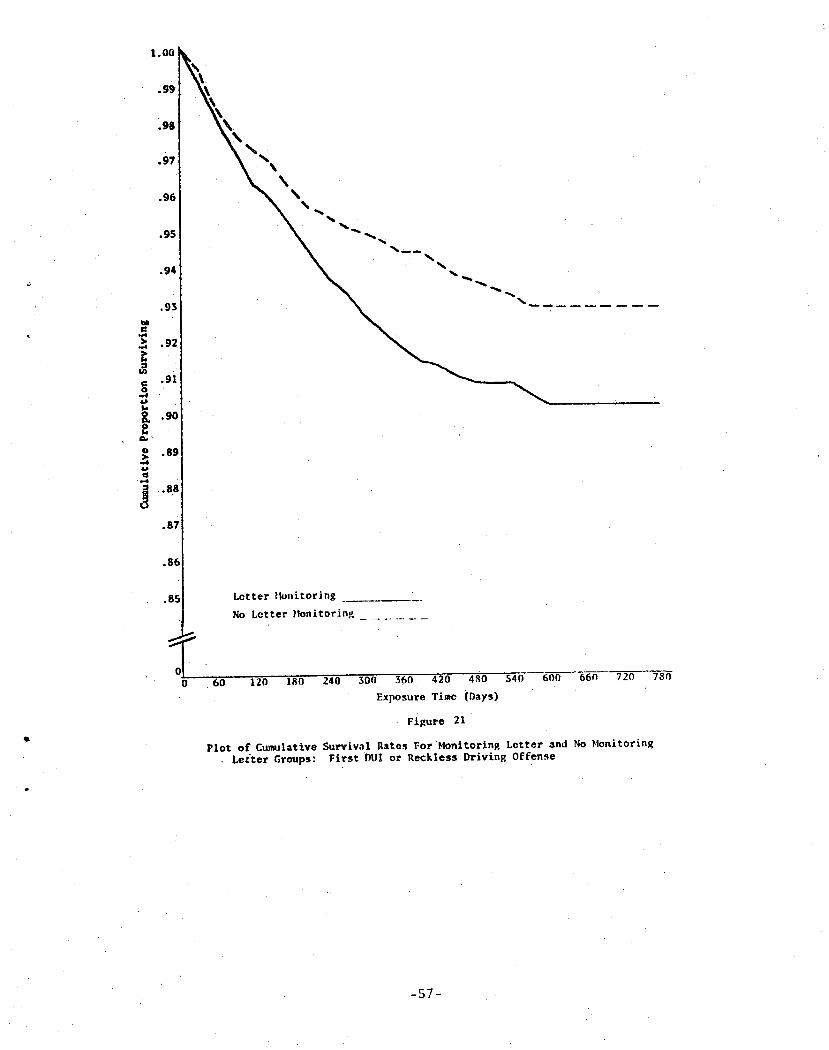
l.O0
,g9
. gS
.97
.96
.95
.94
.93
> .92 ~4
i: " 1 0
~ .90
I~ , ,
o .S9 me
.87
T 0
~qm •
%
Lotter ~ n i t o r i n g .
No Letter ~ n i t o r i n ~
60 120 180. 240 300 3 6 0 420 4S0 540 600 66n 720 780
Exposure T i ~ (Days)
Figure 21
Plot o f Cumulative Survival Rates ForMoni tor ing Let ter and No F~ni tor ing Let ter Groups: F i r s t DUI or Reckless lYrivin~ Offense
- 5 7 -
1.00
.99
.98
.97
.96
.93
.92
.91
.90
.89
,88
.87
.86
~ .84
a .82 0
.81
.80
.79 Q > .78 ~ ..~ ~ 76
u .75
.74
.73
.72
.71
.70
.69
.68
.67
01 o
\
\ \
\ \
\ \x
• ~ \ % %
Letter ~ n i t o r i n g
No Letter FIo. i toring
60 120 IR0 540 300 360 '420 480 540 6 0 0 . 660 720 7 8 0
• Exposure Time COays)
. Figure 22
Plot o f Cumulative Surv iva l , Rates For HonitorLng Let t er and No Monitoring L e t t e r Groups: F i r s t Hoving ViolatLon or Any' A/R Offense
!
- S S -

Q
1 . 0 0
.99
.98
.97
.95
.94
.03
.92
.91
.90
. 89
.88
.87
:86
.85
0 0
I L
Fol low- t ip
No Fo l low-Up
60 120 180 240 300 360 420 480 $40 600 660 720. 780
Exposure Tl~e (Days)
Fizure 23
Plo t o f Cusmlative Surv iva l Rates For FollOw'tip and No Follow-Up Groups: F i r s t Acc iden t ~
- 5 9 -
1 .00
.99
.98
.97
.96
.gs
i:
=::
o 0
-i
.94
.93'
.9Z
.91
.89
.88
.87
.86
.85
0
• . % % ~ _
Follow-Up No Follow-Up
60 120 180. 240 300 3 6 0 . 420 -480 540 600 660 7 2 0 780
Plot o f Cuaulat ive
Exposure Time (D~y~).
Figure 24
Survival: Rates-For Follow-Up and No Fotlow-U p Groups; F i r s t ~JI or Reckless Driving OFfense
- 6 0 -
1.00
.99
.98
.97
. 96
. 9 5
.94
.93
.92
.91
.89
. 8 8
. 8 7
• . 8 6 ~0 = .85
~ .s4
© . 8 2
.81
~..80 I~ 79 ~ ..78
. 77
•. •76 u
.75
.74
.73
• 7 2
.71
.70
• 69 . ( ~ ,
.67
~x x
FoZlo~-up No Fol low-Up
60 120 180 . 240 500 560 420 480 540 600 660 720 7 3 0
Exposure Time (Days)
Fief ure 25
Plot o f Cumulative Surviva l Rates For Fo]lowoUp and No Follow-Up Groups: F i r s t kloving Vio la t ion or Any A/R Offense
-61-
i
CON(; LUS ION
This i n t e r i m a s s e s s m e n t o f tile e f f e c t i v e n e s s o f CDUI f i r s t
O f f e n d e r e d u c a t i o n programs was based on a s e t o f e i g h t e e n 'an;:,lyses
C o n t r o l , home s t u d y ; - a n d i n - c l a s s e d u c a t i o n groups were compared
u s i n g s u r v i v a l r a t e s on t h r e e outcome measures : the f i r s t
a c c i d e n t subse que n t to random a s s i g n m e n t , the f i r s t DllI o r r e c k l e s s
dr iv ing• o f f e n s e , and " the f i r s t ~ moving v i o l a t i o n or any •alcohol•
r e i a t e d o f f e n s e . .Group compar i sons were made f o r the. t o t a l number
o f c l i e n t s a s s i g n e d , as o f Oct.ober, 1979, and f o r two age
s u b g r o u p s , . a n d t h r e e d i a g n o s t i c c l a s s i f i c a t i o n s .
None o f t h e e i g h t e e n a n a l y s e s r e s u l t e d in s t a t i s t i c a l l y
s i g n i f i c a n t d i f f e r e n c e s between the t r e a t m e n t groups . Thus, as
o f O c t o b e r , 1979, t h e r e was l i t t l e ev idence to s u g g e s t . t ha t our
e d u c a t i o n PrOgrams had any e f f e c t on subsequen t d r i v i n g b e h a v i o r .
Ilowever, g iven the p r e l i m i n a r y n a t u r e o f t h e s e r e s u l t s , wi th l e s s
than h a l f o f t he r e s e a r c h sample exposed to the r i s k o f a c c i d e n t
i nvo lvemen t or a r r e s t fo r more than n ine montt~s, t he r e s u l t s cou!d
change wi th t i m e .
Even though t h e between group d i f f e r e n c e s were o f v e r y s m a l l
magn i t u de , an a t t e m p t was made to" i d e n t i f y c o n s i s t e n t p a t t e r n s
among the outcome d a t a . Of t h e e i g h t e e n a n a l y s e s p e r f o r m e d , o n l y
two p roduced a c o n s i s t e n t p a t t e r n o f r e s u l t s . The ana iys i . s o f t he
t o t a l r e s e a r c h sample u s ing subsequen t DU!'s showed t h e h i g h e s t
s u r v i v a l Yate f o r t he i n - c l a s s e d u c a t i 0 n group fo l lowed by t h e
home s t u d y group, and the lowest s u r v i v a l r a t e f o r t h e c o n t r o l
g roup . This o r d e r i n g o f DUI S u r v i v a l r a t e s a l s o appeared f o r t h e
age group 25 y e a r s or o l d e r but not fo r t h e younger o f f e n d e r s
b e t w e e n 18 and 25 y e a r s o f age. While no c la im is made t h a t th. is
o b s e r w ~ t i o n i s i n d i c a t i v e o f a l t r e a t m e n t e f f e c t , i t does sugges t
a more d e t a i l e d a n a l y s i s o f t r e a t m e n t e f f e c t i v e n e s s f o r v a r i o u s
o f f e n d e r subgroups .
In a d d i t i o n t o t h e a n a l y s e s o f t r e a t m e n t e f f e c t i v e n e s s , the
s u r v i v a l e x p e r i e n c e o f a sample o f o f f e n d e r s who d id not v o l u n t e e r
f o r t h e CDUI P r o j e c t was compared wi th the s u r v i v a l e x p e r i e n c e f o r
v o l u n t e e r s , and the c o n t r o l group in p a r t i c u I a r . Air.hough t h e r e
-62- •

were no statistically significant differences in survival rates,
the non-volunteers showed consistently higher survival rates than
the control group volunteers on all three outcome measures. These
results may have been due to the fact that the non-volunteer sample
contained a relatively higher proportion of low BAC cases which . • . • . , . . . ,. "
were reduced to reckless driving, suggesting a higher Proportion
Of persons with less severe drinking problems. If this trend per-
sists, it maybe difficult to generalize the results of our treat-
ment analyses to those clients whodid riot VolUnteer.
The analysis of the quarterly letter monitoring procedure
indicated that the clients who were sent letters had a significantly
lower DUI survival rate than those clients who were not sent letters.
In terms of rearrest rates, 8.2 percent of the letter monitoring•
group versus 5.6 percent of the noletter.monitoring group were
arrested for DUI during the first year following random assignment
to these •conditions. This trend was also observed for moving viola-
ti0ns, and to a lesser extent for accidents, although the differences
were not statistically significant for these outc0me measures. Thus,
the preliminary results suggest that the monitoring letters may be
counterproductive from the standpoint of possibly increasing DUI
arrest rates. If this trend persists, we should at least • consider
changing or abandoning the procedure. It must be emphasized, however,
that the CDUI Project's monitoring letter procedure was an adjunct
to the Summary probation process and no analogy should•be drawn
between the monitoring letter procedure and the standard D~W practice
of sending warning letters to drivers upon an accumulation of negligent
operator points.
Finally, the analysis of clients assigned to receive follow-up
interviews versus those who were not, provided no evidence that
such interviews have an effect on driving behavior. •There were
no •statistically significant differences in survival rate on any
of the outcome measures, nor were there any consistent patterns.
-63-

7
APPENDIX A
A u t o m a t e d D r i v i n g R e c o r d D a t a C o l l e c t i o n P r o c e d u r e s
iiiil!~:~ -
• i i ~ .~'
I::!
!~! •
[ i l '
; ~
~ .~.
. ~ •
.~-
i

PREFAC~.~.
For t h o s e i n t e r e s t e d i n reading t h e following description of the driving record data collection system, several terms should be clarified. The Core DataBase is a large Computer file which contains the master records for every case referred to the CDUI Project; as well as a sample of cases for personswho chose not to volunteer. Each case represents a separate conviction/referral event (or conviction only:for nonvolunteers), and is identified by a CDUI case number; The case number ties together all the data records associated with a particular conviction/referral event, e.-g., arrest and conviction data, diagnostic and assignment data, and participation data.
An individual may have two or more CDUI cases in the Core Data Base representing separate court referral events, or a combination of referral and nOnvolunteer events. -An individual's CDUI cases are tied together by a series.0f characters known as a people key. People keys, CDUI case numbers, court case numbers, driver license numbers, and client names are retained not only in the Core Data Base, but also in a separate file of index records New indeX records are created after~each update of the Core Data Base and functionas a directory for locating.and extracting information f r o m i t h e Core Data Base.
T h e d a t a which p r o v i d e t h e outcome measures f o r impact a n a l y s e s a r e s t o r e d in t h r e e s a t e l l i t e d a t a b a s e s : one fo r . DMV driving records, one for Life Activities Inventory (LAI) interview data,-and one. for-Department.of Justice ffriminal records, In. these satellite systems there is one :set of .records per individual (regardless ofthe number of CDUI cases the individual may, have in the Core Data Base), and each set of records is tied to the Core Data Base by:the people keys. This allows information from the.various data bases to be merged for analysis
-65-

. - . • . , • . . . .
AUTOMATED DRIVING RECORD DATA COLLECTION PROCEDURES -{,
S t e p 1: C r e a t e C a l i f o r n i a DMV record r e q u e s t s for a l l c l i e n t s r e p r e s e n t e d in t h e CDUI Core Data Base.
Core Data Base
Request Maker
P6199
R e q u e s t s by permanent C a l i f o r n i a d r i v e r s l i c e n s e number
Reques t s by name (DL Number Unknown, out o f s t a t e , t emporary , e t c . )
)ii:,S :~ ;i ~
i ~ ! , :v
~ g r ' -
,Ii
:d'r ~
ii. ~ .
S t e p 2 : I n i t i a l p r o c e s s i n g o f DMV r e t u r n t a p e s . These t a p e s c o n t a i n d r i v i n g r e c o r d da ta in p r i n t record format , i . e . , the DMV w r i t e s the i n f o r m a t i o n on tape in e x a c t l y t h e same form t h e y would use tO produce t h e i r o u t - o f - h o u s e p r i n t o u t on a l i n e p r i n t e r . However, t h e DMV has m o d i f i e d t h e i r p r o c e d u r e s to p r o v i d e us d e t a i l e d a c c i d e n t d a t a t h a t are no t n o r m a l l y a v a i l a b l e on t h e o u t - o f - h o u s e p r i n t o u t , number o f i n j u r i e s and f a t a l i t i e s , d r i v e r s o b r i e t y , e t c .
During t h i s s t e p 0 f t h e p r o c e s s t h e r e t u r n t a p e s are c o p i e d ( f o r o f f - s i t e backup) and a sample o f t h e c o n t e n t o f e a c h t a p e i s p r i n t e d . The p r i n t e d r e c o r d s a r e p e r u s e d i n an a t t e m p t t o d e t e c t any c h a n g e s in t h e p r i n t r e c o r d f o r m a t .
'A : '
5I: "
.)
S t e p 3 : , The e s s e n t i a l da ta needed for p r o j e c t e v a l u a t i o n are e x t r a c t e d from the r e t u r n e d DMV p r i n t r e c o r d s . The e x t r a c t i o n p r o c e s s t a k e s the s e l e c t e d d a t a f o r each c l i e n t and b u i l d s a v a r i a b l e number o f f i x e d l e n g t h (80 byte ) t r a n s a c t i o n r e c o r d s . S e p a r a t e t r a n s a c t i o n r e c o r d s are b u i l t f o r each r e p o r t e d a c c i d e n t , d r i v i n g v i o l a t i o n , and DMV l i c e n s i n g a c t i o n . In addition two header transaction records-are builtfor each client Containi~g.iicensenumber, date of birth.,, and other informationfor controllingthe process. Al! transaction r e c o r d s a r e w r i t t e n t o a. t a p e .
- 6 6 - %:
/ :~ i,~ ~

Step 3 : (Cont)
For some c l i e n t s , t he DMV can no t p r o v i d e us wi th tile d r iV ing r e c o r d s we r e q u e s t e d . A c l i e n t ' s r e c o r d was t e m p o r a r i l y u n a v a i l a b l e , t h e l i c e n s e number we used was i n v a l i d , or a c l i e n t ' s r e c o r d was no t y e t in t h e automated Db4V f i l e . In t h e l a t t e r c a s e , the DHV sends us a hand w r i t t e n d r i v i n g r e c o r d . " Tile e r r o r messages f o r - a l l u n s u c c e s s f u l s e a r c h e s a r e p r i n t e d in t h i s s t e p .
As a b y - p r o d u c t o f t he e x t r a c t p r o c e s s , a v a r i e t y o f p e r s o n a l d a t a , e . g . , , h e i g h t , w e i g h t , and AKA's a r e w r i t t e n t 9 a second t a p e . These p e r s o n a l d a t a . a r e Use fu l in c a s e s w h e r e we s u s p e c t t h a t we h a v e n o t r e c e i v e d the c o r r e c t d r i v i n g r e c o r d f o r a p a r t i c u l a r c l i e n t .
D r i v e r s L i c e n s e ~ ~ N ~ / "
Tape . ~ . ~ ]
/ Name Request Re turn T a p e .
E x t r a c t Program
P6399
E x t r a c t Program
P6399
J T r a n s a c t i o n Records f o r DL Returns
Pe r sona l • In format ion Records
~ T r a n s a c t i o n ReCords f o r Name
l R e t u r n s
x ~ P e r s o n a l ~ I n f o r m a t i o n
. ~ R e c o r d s
Step 4: E r r o r c o r r e c t i o n For u n s u c c e s s f u l s e a r c h e s . The e r r o r messages produced in S t e p . 2 a r e examined and where p o s s i b l e , t h e o r i g i n a l r e q u e s t r e c o r d s a r e m o d i f i e d and r e s u b m i t t e d . F o r example, r e q u e s t r e c o r d s wi th i n v a l i d d r i v e r s l i c e n s e numbers a r e r e s u b m i t t e d as name s e a r c h e s .
S t e p 5 ! P rocess e r r o r r e t u r n s t h r o u g h t h e e x t r a c t program as in S t e p 3 .
-67-
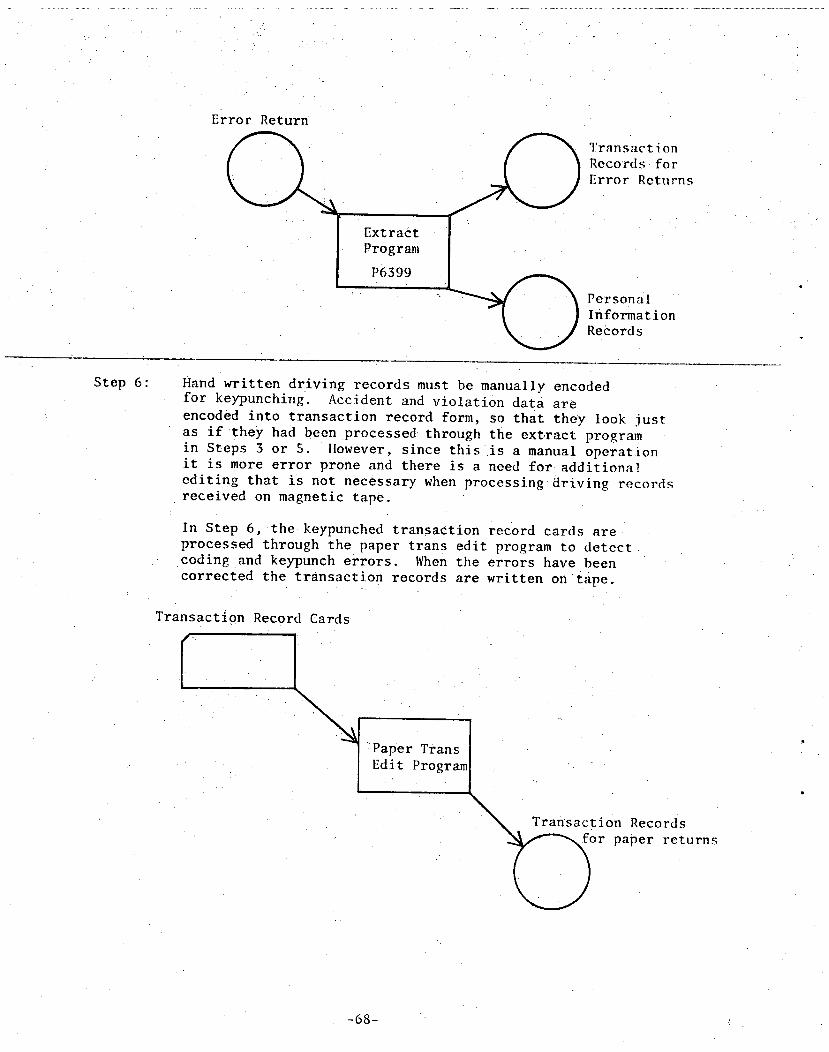
)
Error Return
Q J ExtraCt
Program
P6399
1 'ransact ion Records for Error Returns
Persona l In format ion Records
Q
Step 6 : H a n d w r i t t e n d r i v i n g r e c o r d s must be manually encoded f o r keypunching. Acc ident and v i o l a t i o n data a r e encoded i n t o t r a n s a c t i o n r e c o r d form, so t h a t t h e y look j u s t as i f they had been p r o c e s s e d t h r o u g h the e x t r a c t program in S teps 3 or 5. l towever, s i n c e t h i s i s a manual o p e r a t i o n i t i s more e r r o r prone and there i s a need f o r : a d d i t i o n a l e d i t i n g t h a t i s not n e c e s s a r y when p r o c e s s i n g d r i v i n g r e c o r d s r e c e i v e d on magnet ic t a p e .
In Step 6, the keypunched t r a n s a c t i o n record cards a r e p r o c e s s e d through the paper trans e d i t program to d e t e c t cod ing and keypunch e r r o r s . When the e r r o r s have been c o r r e c t e d the t r a n s a c t i o n records are w r i t t e n on t a p e .
T r a n s a c t i o n Record Cards •
Paper Trans Edit Program
~ . T r a n s a c t i o n Records or paper r e t u r n s
- 6 8 -
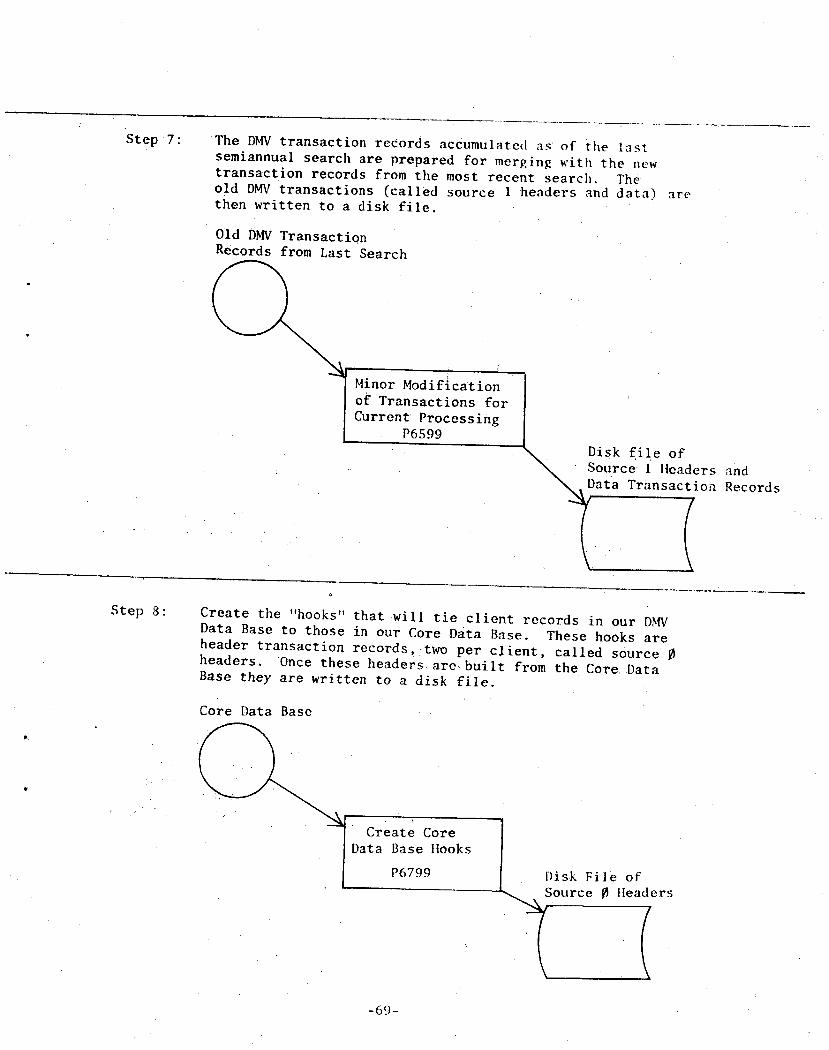
S t e p 7 : T h e DMV t r a n s a c t i o n r e c o r d s a c c u m u l a t e d a s o f t h e l a s t s e m i a n n u a l s e a r c h a re p r e p a r e d f o r me rg ing w i t h t h e new t r a n s a c t i o n r e c o r d s from t h e most r e c e n t s e a r c h , The- o l d DMV t r a n s a c t i o n s ( c a l l e d s o u r c e 1 h e a d e r s and d a t a t h e n w r i t t e n to a disk. f i l e ;
O ld DMV T r a n s a c t i o n Records from Las t Sea rch
Minor of Tra~
, l C u r r e n ~
i
M o d i f { c a t i o n n s a c t i o n s f o r
C u r r e n t P r o c e s s i n g P6599
are
, ~ l a t a T r a n s a c t i o n Records
Step 8 : C r e a t e t he "hooks" t h a t •wil l t i e c l i e n t r e c o r d s in ou r DMV Data Base to t h o s e in ou r Core .Data Base. These hooks a r e h e a d e r t r a n s a c t i o n r e c o r d s , : t w o p e r c l i e n t , c a l l e d s o u r c e ~ h e a d e r s . Once t h e s e h e a d e r s a re , b u i l t f rom t h e Core. Data Base t h e y a r e w r i t t e n to a d i s k f i l e .
Core Data Base
• i • C r e a t e Core Data Base t looks
P6799
• I '
- 6 9 -
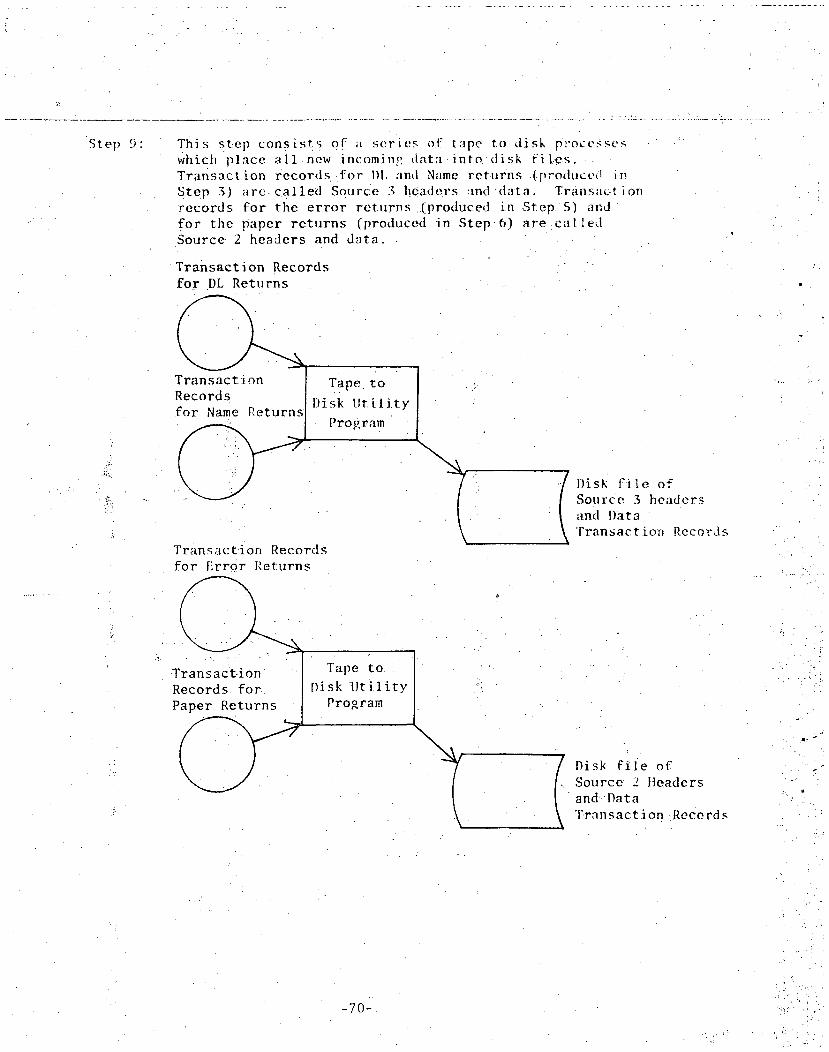
Step 9
/ . ' : - .
7
[
i
f 3-
This step cons i s t~ O[ i, se r i es of tape to d isk p-roce~scs Which place a l l new incom.inp, data i n t o d i s k f i l . e s . . Transac t ion records...for.I)i, aml Name re turns .(.produced ii~ Step 3) are. c a l l e d Source 3 headers rind d a t a . Transac-t ion records For the e r ro r r e tu rns .(produced .in .Step S) and for the paper r e t u r n s (produced in Step-6) are c a l l e d Source 2 headers and data .
Transact; ion Records " for .DL Returns
Transac t ion Tape to Records " for Name Returns Disk l l t i l i t y . ' ~ ' Program
i
Transac t ion Records. for iErrc~r Returns
77 .Transac:t-io":: ~ I " ]'ape t o . , I s k . U t i l i t y ] Records for, I DiProRra m j .
. /
l)isk f : i le of Source 3 headers and Data Transact ior) Records
t . Disk f i i e of Source 2 Iteaders anti-Data Transac t ion Records
-70-
L ,
, !
,:'i ' [>
. . )
i . • . F
. / : .
.,~ .,~ i ~, ~ :,~
: [ . '.(.~ '

S t e p 10: A l l n e c e s s a r y r e c o r d s from s o u r c e s 0, 1 , 2, and 3 a r e s o r t e d t o g e t h e r by t r a n s a c t i o n t y p e ( i . e . , h e a d e r , a c c i d e n t d r i v i n g v i o l a t i o n and l i c e n s i n g a c t i o n ) and by s t a t u t e
• . s e c t i o n numbers . The s o r t e d r e c o r d s a r e t h e n p r o c e s s e d t h r o u g h t h e wash program.
The~wash program c o n t a i n s a l a r g e t a b l e o f V e h i c l e Code Sec t i ' on numbers , as w e l l as s e l e c t e d s e c t i o n s f rom o t h e r s t a t u t e s t h a t a r e commonly r e p o r t e d t o t h e DMV, e . g . ,
B u s i n e s s and P r o f e s s i o n s , H e a l t h and S a f e t y , Pena l Code. The v a r i o u s s t a t u t e s e c t i o n s ( d r i v i n g v i o l a t i o n s ) a r e o r g a n i z e d f o r r e s e a r c h p u r p o s e s i n t o seven o f f e n s e c a t e g o r i e s o f . m o v i n g v i o l a t i o n s and f o u r c a t e g o r i e s o f nonmoving v i o l a t i o n s .
In this step of the process, all the driving violation transaction records are compared with the table and when the section number, in each transaction record matches a section number in the table, the appropriate Offense category value is placed in the transaction record. (Note: All accident transactions are given th~ same category value, licensing action transactions are given one of three values. This is a simple process which is actually accomplished by the extract program in Steps 3 and 5).
If the violation indicated inthe transaction record does not have ,a match in the table, the transaction record is r e j e c t e d and t h u s e l i m i n a t e d from f u r t h e r p r o c e s s i n g . Less t h a n f i v e p e r c e n t o f t h e d r i v i n g v i o l a t i o n t r a n s a c t i o n r e c o r d s a r e e l i m i n a t e d in t h i s manner . These i n c l u d e p e d e s t r i a n and b i c y c l e v i o l a t i o n s , minor e q u i p m e n t v i o l a t i o n s , p a r k i n g V i o l a t i o n s , and a number o f u n i d e n t i f i e d v i o l a t i o n s o f o b s c u r e s t a t u t e s .
-71-

Source ~ Headers
From Core ( "" " ' . " ; t Data Base
. • . . , " •
Source 1 Headers and Data Transac t ion Records
DbtV D a t a ( From Last Search
Source 2 lleaders and . . . . . . . . . Data Transact ion Records ,
" ( (
/Source 3 lieaders and - • / / D a t a Transac t ion Records
/ t " ' ~ sea rch , DL and Name
: / \ - 7 7 \ R e t u r n s " ' ' "
! Sort by " " : 1 .Transac t ion I
[Type and Statute] .[ Section.Numbersj
The Wash Program Attach Offense
" Categor ies fo r V i o l a t i o n Type Transac t ions
P6999
Step 11: In p r e p a r a t i o n fo r t he f i na l s tages of p roces s ing , the t r a n s a c t i o n records are compared with the l a t e s t Core Data Base index records to assure t ha t a l l CDUI case numbers are co r r ec t and have not been changed s ince the DMV reques t tapes were c rea t ed in Step 1. When the CDUI number and assignment date on the t r a n s a c t i o n records f ind a match in the index records , the appropr i a t e people key i s a t t ached t o the t r a n s a c t i o n r eco rds . Matched and unmatched t r a n s - ac t i on records are ~rri t ten on sepa ra te tape f i l e s .
!
- 7 2 -

Q~ From Wash Program
: [ T r a n s a c t i o n
Core Data Base Records a r e Index Records s o r t e d by
~ CDUI Number Index Match and peop le key a t t a c h P7199
Matched T r a n s a c t i o n Records wi th People Keys
Unmatched (bad CDUI Number) T r a n s a c t ion Records
Step 12: The CDUI number and a s s ignmen t d a t e e r r o r s in t h e unmatched t r a n s a c t i o n r e c o r d s a r e c o r r e c t e d . The p r i m a r y method o f c o r r e c t i n g such e r r o r s i s to compare t h e unmatched t r a n s a c t i o n r e c o r d s w i t h our f i l e o f vo ided CDUI numbers . The old vo ided CDUI numbers a r e r e p l a c e d w i t h t h e new c o r r e c t numbers. The CDUI c o r r e c t e d t a p e i s t h e n run back th rough S tep 11 so t h a t t he a p p r o p r i a t e p e o p l e keys can be a t t a c h e d . Then the i n i t i a l l y matched t r a n s a c t i o n r e c o r d s from t h e f i r s t pas s , and the CDUI c o r r e c t e d - m a t c h e d t r a n s a c t i o n r e c o r d s from the second pass a r e w r i t t e n to a d i sk f i l e and a r e s o r t e d by p e o p l e key.
-73-
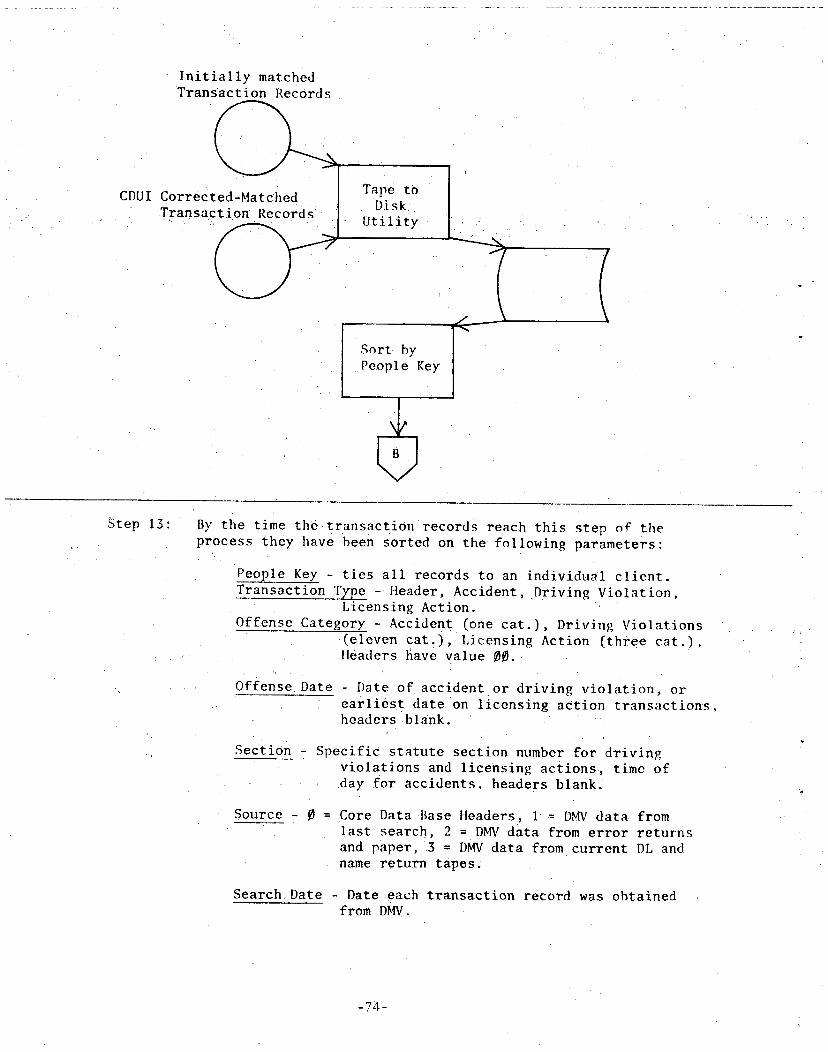
CDUI
I n i t i a l l y matched T r a n s a c t i o n Records
C o r r e c t ' T r a n s a ~ ]
Tape tO Disk ,
U t i l i t y
Sort. by .People Key
( . . . . , . . '
Step 13: By the time tile t r a n s a c t i o n records reach t h i s s tep of the process they have been sor ted on the fo l lowing paramete r s :
.People • Key - t i e s a l l records to an i n d i v i d u a l c l i e n t . T_ransacti0n Type - Header, A c c i d e n t , . D r i v i n g V i o l a t i o n ,
Licens ing Action. Offense Category Accident (one c a t . ) , Driving V i o l a t i o n s
( e i e v e n c a t . ) , L icens ing Action ( th ree c a t . ) , Headers 5ave value ~ . . ..
Offense. Date Date of acc iden t or d r i v i n g v i o l a t i o n , or .. e a r l i e s t date on l i c e n s i n g ac t i on t r a n s a c t i o n s ,
.headers .b lank .
SectiOn Spec i f i c . s t a t u t e s ec t i on number for d r i v i n g ' v i o l a t i o n s and l i c e n s i n g act ions. , t ime of
, • .day for a c c i d e n t s , headers b l ank .
. - . . .
Source - ~ = Core Da ta .BaseHeade r s , 1 = DNIV da t a from l a s t search , 2 = DMV data from e r r o r r e t u r n s and paper, 3 = DMV data from cu r r en t DL and name r e tu rn t apes :
Search. Date - Date each t r a n s a c t i o n record was obta ined from DblV.
-74-
The s o r t e d t r a n s a c t i o n r e c o r d s must now be c o l l a p s e d do~m so t h a t d u p l i c a t e r e c o r d s a r e e l i m i n a t e d , l e a v i n g o n l y one t r a n s a c t i o n r e c o r d p e r u n i q u e a c c i d e n t , d r i v i n g v i o l a t i o n and l i c e n s i n g a c t i o n e v e n t . A c l i e n t ' s t r a n s a c t i o n r e c o r d s a re c o n s i d e r e d d u p l i c a t e when t he t r a n s a c t ' i o n t y p e , o f f e n s e c a t e g o r y , o f f e n s e d a t e and s e c t i o n number a r e i d e n t i c a l ( s o u r c e and s e a r c h d a t e a r e no t used in t h i s
: compar i son) . D u p l i c a t e r e c o r d s a re t h e r u l e n o t t he e x c e p t i o n , b e c a u s e t h e r e c o r d o f a s p e c i f i c o f f e n s e i s c o l l e c t e d a t e v e r y s i x -mon th s e a r c h , u n t i l i t i s e v e n t u a l l y purged from the C a l i f o r n i a DMV a u t o m a t e d d r i v i n g r e c o r d f i l e .
In .cases o f d u p l i c a t e t r a n s a c t i o n r e c o r d s , t he most r e c e n t 0 n e i s r e t a i n e d and t h e o l d e r r e c o r d i s pu rged . The r e a s o n i n g beh ind t h i s i s t h a t t he more r e c e n t v e r s i o n o f t h e r e c o r d may have new or amended i n f o r m a t i o n such as c o u r t d i s p o s i t i o n d a t a .
I f a p r e v i o u s l y c o l l e c t e d t r a n s a c t i o n r e c o r d was purged from t h e C a l i f o r n i a DMV sys tem be tween t h e l a s t s e a r c h and t he c u r r e n t s e a r c h , i t w i l l no t o f Course be r e p r e s e n t e d among t h e c u r r e n t t r a n s a c t i o n r e c o r d s . C o n s e q u e n t l y , t h e r e i s no d u p l i c a t i o n and t h e p r e v i o u s i y c o l l e c t e d r e c o r d . w i l i be r e t a i n e d /
Th i s c o l l a p s i n g p r o c e s s h a s " p r o v e d to be q u i t e a c c u r a t e a n d e f f i c i e n t , however , t h e r e a r e p o t e n t i a l s i t u a t i o n s in which e r r o r can o c c u r . For example , i f a c l i e n t V i o i a t e d t he e x a c t same s t a t u t e s e c t i o n t w i c e on t he same day , i t would appea r to be a d u p l i c a t e r e c o r d and one o f t he o f f e n s e s would be purged . D u r i n g t he deve lopment o f t he D~N d a t a c o l l e c t i o n sys tem l i t e r a l l y hundreds o f o f f e n s e r e c o r d s were examined and not once were two same day., same s e c t i o n V i o l a t i o n s d e t e c t e d . Thus, any l o s s o f d a t a due to t h i s s i t u a t i o n w o u l d be minimal.. N o n e t h e l e s s , s p e c i a l p r e c a u t i o n s are taken with DUI violations.
When two or more Dui transaction records with the same offense date are encountered, the citation/docket number field is examined, lf'the Court docketnumbers are identical for all the transaction records they are considered duplicate and. only the singIe most recent record (in sort order) is retained. On the other hand, if there are different docket numbers each unique docket number is considered a separate DUI event, and the most recent transaction record :is kept for each event. All same day DUI transaction recOrds retained in this manner are displayed for visual confirmation.
The p r o c e d u r e o f u s i n g the c o u r t d o c k e t number in s e p a r a t i n g same .day - same s e c t i o n v i o l a t i o n r e c o r d s i s r e s t r i c t e d to DUI o f f e n s e s o n l y . This i s b e c a u s e t he c i t a t i o n / d o c k e t f i e l d i s s u b j e c t ~ t o change. For example , an o f f e n s e r e c o r d c o n t a i n i n g a p o l i c e c i t a t i o n number may be amended l a t e r t o show a c o u r t docke t number. Th is i s no t uncommon in f a i i u r e t o a p p e a r c a s e s . When the c o l l a p s i n g c r i t e r i a a r e changed bo th new and o ld v e r s i o n s o f a r e c o r d w i l l be r e t a i n e d . a s s e p a r a t e l e v e n t s .
-75-

In f a c t , t he loss . o f un ique even t r e c o r d s d u r i n g t h e c o l l a p s e p r o c e s s i s no t as s e r i o u s a prob!em as r e t a i n i n g two or more r e c o r d s f o r what is a c t u a i l y a s i n g l e e v e n t . Speeding v i o l a t i o n s a r e p a r t i c u l a r l y prone to t h i s t y p e o f e r r o r . The C a l i f o r n i a Veh ic l e Code h a s s e v e r a l s e c t i o n s c o n c e r n i n g e x c e s s i v e speed. When a pe r son i s s topped f o r e x c e s s i v e speed he i s f r e q u e n t l y c i t e d f o r v i o ! a t i n g - t w o s e c t i o n s o f t h e Veh i c l e .Code e . g . t h e . b a s i c s p e e d .law
, ) . . , .
and the " t e m p o r a r y " 55 mi l e s per hour speed law. Both o f t he c i t e d s e c t i o n s r e f e r to one b e h a v i o r a l e v e n t and to count each o f them as unique even t s would d i s t o r t t he d a t a - f o r r e s e a r c h p u r p o s e s .
.To avoid doub le c o u n t i n g s i n g l e speed ing o f f e n s e s i n t h e c o l l a p s e p r o c e s s , t he v a r i o u s Veh i c l e Code s e c t i o n numbers r e f e r r i n g to e x c e s s i v e speed a r e a l l c o n v e r t e d to t h e s e c t i o n number f o r t h e ba s i c speed law. (The c o n v e r s i o n a c t u a l l y t a k e s p l a c e in the e x t r a c t program, S teps 5 and 5) . This p r o c e d u r e f o r c e s t h e m u l t i p I e speed ing c i t a t i o n s t o appear as d u p l i c a t e r e c o r d s and 0 n l y t he most r e c e n t one i s r e t a i n e d .
I t i s a l s o p o s s i b l e to ge t double r e p o r t i n g s o f a c c i d e n t s . For example, a pe r son may f i l e a F i n a n c i a l R e s p o n s i b i l i t y (FR) Acc iden t Report and then the p o l i c e f i l e t h e i r r e p o r t o f t h e same a c c i d e n t . Sometimes both r e c o r d s a r e r e t a i n e d in t h e C a l i f o r n i a I ) ~ f i l e , a l t h o u g h such c a s e s a r e . i n f r e q u e n t . In m o s t c a s e s , i n f o r m a t i o n from t h e FR and P o l i c e r e p o r t s a r e combined i n t o one a c c i d e n t r e c o r d .
in t he p r o c e s s o f C o l l a p s i n g d u p l i c a t e a c c i d e n t r e c o r d s , t ime o f a c c i d e n t i s s u b s t i t u t e d f o r s t a t u t e s e c t i o n number. S ince FR r e p o r t s do n o t c a r r y t ime o f (lay, p o l i c e and FR
. : . . r e p o r t s o f t h e same a c c i d e n t do not appear a s d u p l i c a t e s . An a t t e m p t i s made to c o n t r o l t he d o u b l e c o u n t i n g o f a c c i d e n t s by d i s p l a y i n g a l l same day a c c i d e n t r e c o r d s . I f a f t e r i n s P e c t i n g t h e s e a c c i d e n t s r e c o r d s t h e r e a p p e a r s ' t o be a d u p l i c a t i o n prob lem, we l a t e r remove one o f t h e d u p l i c a t e ~eco rds . through a s p e c i a l p r o c e s s .
I t a l s o should be no t ed t h a t t he c o l l a p s i n g o f l i c e n s i n g a c t i o n t r a n s a c t i o n r e c o r d s i s somewhat more c o m p l i c a t e d than f o r a c c i d e n t a n d d r i v i n g v i o l a t i o n r e c o r d s . S ince l i c e n s i n g a c t i o n s . c a n be s t a y e d , r e i n s t a t e d , t e r m i n a t e d , and o t h e r w i s e m o d i f i e d over t ime , i t becomes even more d i f f i c u l t t o p r e v e n t t h e r e t e n t i o n o f - m u l t i P l e r e c o r d s f o r un ique e v e n t s . S u f f i c e i t to s a y t h a t e v e r y r e a s o n a b l e e f f o r t Was made to m a i n t a i n t he i n t e g r i t y o f . l i c e n s i n g a c t i o n d a t a .
in a d d i t i o n to e l i m i n a t i n g d u p l i c a t e r e c o r d s , a t - e a c h s i x - month u p d a t e , t h e c o l l a p s e . p r o g r a m p roduces a nUmber o f
U s e f u l " e r r o r " messages . When the d r i v e r s l i c e n s e . n u m b e r in t h e C a l i f o r n i a DMV-records i s d i f f e r e n t f r o m t h e l i c e n s e number in o u r C o r e Data Base r e c o r d s , a message .i s p r i n t e d
-76-

and bo th l i c e n s e numbers a r e w r i t t e n t o a t a p e so t h e i n f o r m a t i o n i s a v a i l a b l e f o r r e s e a r c h a t a l a t e r d a t e . The same p r o c e s s o c c u r s when b i r ~ h d a t e s c o n f l i c t . . The DMV l i c e n s e numbers a r e assumed t o be C o r r e c t and l a t e r
. i n . S t e p 1S t h e Core Data Base r e c o r d s a r e u p d a t e d w i t h t h e new l i c e n s e numbers . B i r t h d a t e s a r e n o t u p d a t e d b u t
l a r g e . d i s c r e p a n c l e s a r e i n v e s t i g a t e d .
F i n a l l Y , t h e c o l l a p s e p r o g r a m p r o v i d e s i n f o r m a t i o n c o n c e r n i n E t h e s u c c e s s o f ofir s e a r c h e s • In most c a s e s we r e c e i v e d r i v i n g r e c o r d s f o r e v e r y r e q u e s t , However , in some c a s e s we n e v e r r e c e i v e t h e d r i v i n g r e c o r d f o r a c l i e n t even a f t e r s e v e r a l r e q u e s t s have been made ( m i s s i n g d a t a ) , o r we may ]lave r e c e i v e d a d r i v i n g r e c o r d on t h e l a s t s e a r c h
b u t t h i s t i m e we d i d n o t ( l o s t c o n t a c t ) . Such p rob lem s i t u a t i o n s a r e i n d i c a t e d by t h e c o l l a p s e p r o g r a m .
- . L ~r~mber and ~ The Coilapse]
S o r t e d T r a n s a c t i o n Reco rds
/ C o l l a p s e d [ ' r r a n s a c t i o n
~ Records
S t e p 14: The c o l l a p s e d t r a n s a c t i o n r e c o r d s a r e s o r t e d by c o u r t d o c k e t number and o f f e n s e c a t e g o r y . The d o c k e t numbers f o r a l l DUI and R e c k l e s s D r i v i n g t r a n s a c t i o n r e c o r d s a r e t h e n ma tched w i t h t h e d o c k e t numbers on t h e Core Data Base c o u r t i n d e x • r e c o r d s . When a match o c c u r s a f l a g i s s e t i n t h e t r a n s a c t i o n r e c o r d : i n d i c a t i n g t h a t we have i d e n t i f i e d an i n d e x a r r e s t , i . e ~ , an a r r e s t t h a t e v e n t u a l l y l e d t o t h e C l i e n t ' s r e f e r r a l t o t h e CDUI P r o j e c t .
Tlle Cour t m a y h a v e made one r e f e r r a l t o t h e CDUI P r o j e c t ~s tl~e r e s u l t o f two or more o f f e n s e s . T y p i c a l l y , t h e s e o f f e n s e s o c c u r r e d o n l y a few d a y s o r weeks a p a r t . In such c a s e s t h e CDUI E v a l u a t i o n s t a f f i n d i c a t e s t h e d o c k e t number
f o r t h e most r e c e n t o f f e n s e as t h e p r i m a r y c o u r t c a s e and t h e o t h e r d o c k e t numbers as s u p p l e m e n t a l c o u r t c a s e s .
-77-
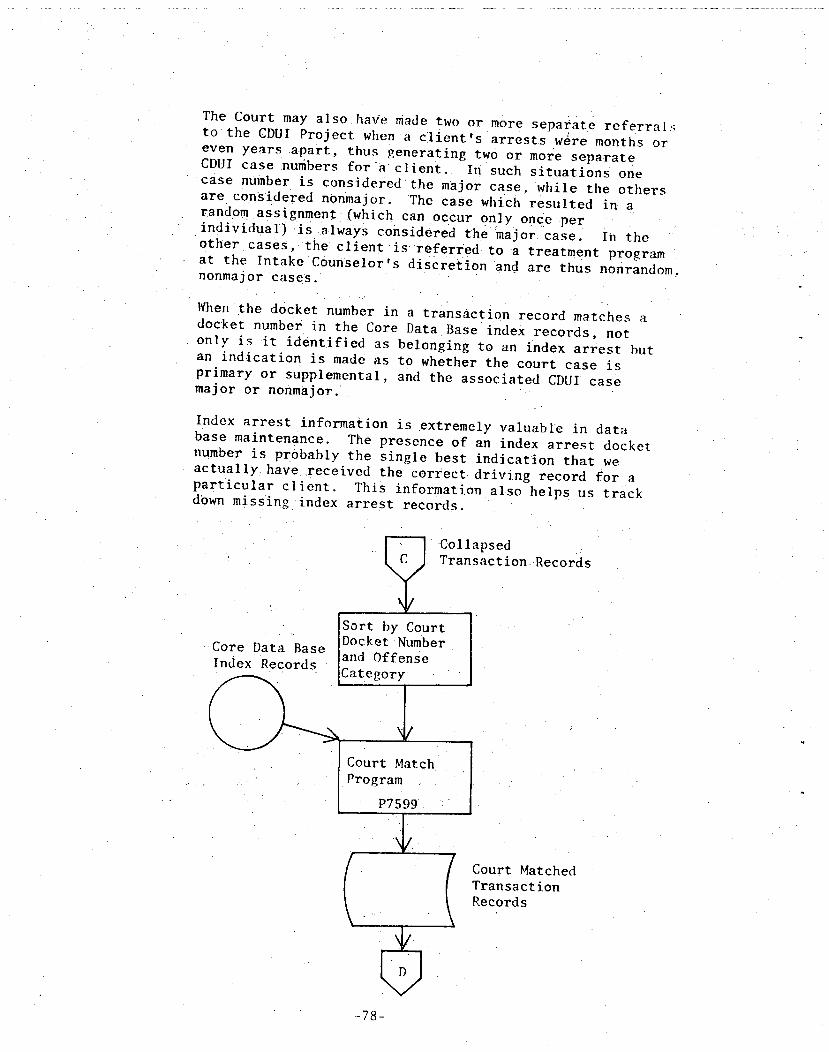
The C o u r t may a l s o have made two o r m o r e s e p a r i t e r e f e r r a l s ; t o t h e CDUI P r o j e c t w h e n a c l i e n t ' s a r r e s t s w e r e months o r even y e a r s a p a r t , t h u s R e n e r a t i n g two o r more s e p a r a t e CDUi c a s e .numbers f o r a c l i e n t . . I l l Such s i t u a t i o n s one
• Case number i s c o n s i d e r e d t h e m a j o r c a s e , w h i l e t h e o t h e r s a r e c o n s i d e r e d n o n m a j o r . The c a s e which r e s u l t e d in a random a s s i g n m e n t - ( w h i c h can o c c u r o n l y once p e r '
. i n d i v i d u a I ) " i s - a l w a y s c o n s i d e r e d t h e m a j o r , c a s e / i n t h e o t h e r c a s e s , t h e c l i e n t i s r e f e r r e d , t o a t r e a t m e n t p r o g r a m
• a t t h e I n t a k e C O U n s e l o r , s d i s c r e t i o n and a r e t h u s nonrandom, n o n m a j o r c a s e s . "
Nhen t h e d o c k e t number in a t r a n s a c t i o n r e c o r d m a t c h e s a d o c k e t number in t h e Core Data Base i ndex r e c o r d s , n o t o n l y i s i t i d e n t i f i e d as b e l o n g i n g t o an i n d e x a r r e s t b u t an i n d i c a t i o n i s made a s t o w h e t h e r t h e c o u r t c a s e i s p r i m a r y o r s u p p l e m e n t a l , and t h e a s s o c i a t e d CDUI c a s e major or n o n m a j o r . . -.
Index a r r e s t i n f o r m a t i o n i s e x t r e m e l y v a l u a b l e in d a t a b a s e m a i n t e n a n c e . The p r e s e n c e o f an i n d e x a r r e s t d o c k e t
n u m b e r i s p r o b a b l y t h e s i n g l e b e s t i n d i c a t i o n t h a t we a c t u a l l y . . h a v e . r e c e i v e d t h e c o r r e c t • d r i v i n g r e c o r d f o r a p a r t i c u l a r c l i e n t . Th i s i n f o r m a t i o n a l s o h e l p s u s t r a c k down m i s s i n g - i n d e x a r r e s t r e c o r d s
i-
. [ S o r t by C o u r t . . . . , l Docke t Number C o r e Da ta ~ase I . . . . .
• ' _ , [ana u t t e n s e Index R e c o r a s [~ . • . [ ~ a t e g o r y • •
[ u r t M a t c h . . . . . . . " [ Program . . .
• " : [ P7599
( (
" C o l l a p s e d T r a n s a c t i o n . . R e c o r d s
C o u r t Matched T r a n s a c t i o n R e c o r d s
--78-
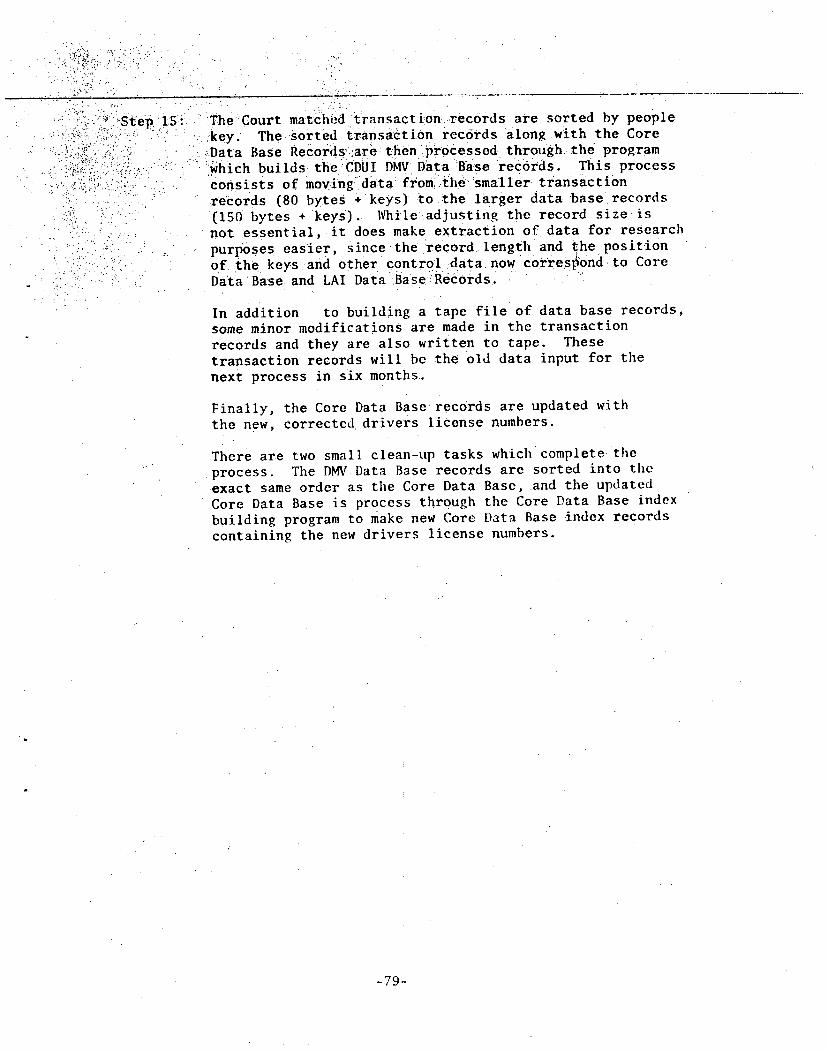
~.-:":'i!i:~i:~."-!:i~::i:~-:Step :15. ~:. T h e : C o u r t matchi~d:"~ransact i o n - . records a r e s o r t e d by p e o p l e .~::~:..:ii~.::~ ,~!:¢;~:.:~.: ::5~ ". : . k e y The s o r t e d i r a n s a e t i . o n r e c o r d s a l o n g w i t h t h e Core ~:'.::!::!~i~: ~ ~i." :::~3: ( ~ : ~Data Base Re6or i i s : . : a re ; then . . p r o c e s s e d t h r o u g h t h e p r o g r a m
. ::-/~i:JY:~-i~:ii<:(::;(-~.,,..:..- : - ' ' :which b u i l d s - t h e : CDUI, DMV Data :Base r e c O r d s . T h i s p r o c e s s -...-:,< .~.~ ~..,..:::. ~/:)?:. =. c o n s i s t s o f moving"da. t a : from.. the: ~smal 1 e r t r a n s a c t i on
r e C o r d s (80 b y t e s + k e y s ) t o t h e l a r g e r d a t a b a s e r e c o r d s (150 b y t e s + k e y s ) . W h i l e - a d j u s t i n g t h e r e c o r d s i z e i s n o t e s s e n t i a l , i t does make e x t r a c t i o n o f d a t a f o r r e s e a r c h p u r p o s e s e a s i e r , s i n c e t h e r e c o r d , l e n g t h and t h e p o s i t i o n of. t h e k e y s and o t h e r c o n t r o l d a t a now c o r r e s p o n d t o Core Data Base and LAI Data B a s e : R e c o r d s .
In a d d i t i o n t o b u i l d i n g a t a p e f i l e o f d a t a b a s e r e c o r d s , some mino r m o d i f i c a t i o n s a r e made in t h e t r a n s a c t i o n r e c o r d s and t h e y a r e a l s o w r i t t e n t o t a p e . These t r a n s a c t i o n r e c o r d s w i l l be t h e o l d d a t a i n p u t f o r t h e n e x t p r o c e s s in s i x m on t hs .
F i n a l l y , t h e Core Data B a s e r e c o r d s a r e u p d a t e d w i t h t h e new, C o r r e c t e d d r i v e r s l i c e n s e n u m b e r s .
T h e r e a r e two sma l l c l e a n - u p t a s k s w h i c h c o m p l e t e , t h e p r o c e s s . The DMV Data Base r e c o r d s a r e s o r t e d i n t o t h e e x a c t same o r d e r as t i le Core Data Base , a n d t h e u p d a t e d Core Data Base i s p r o c e s s t h r o u g h t h e Core Da ta Base i n d e x b u i l d i n g p rogram to make new Core Da ta Base i n d e x r e c o r d s c o n t a i n i n g t h e new d r i v e r s l i c e n s e n u m b e r s .
- 7 9 -
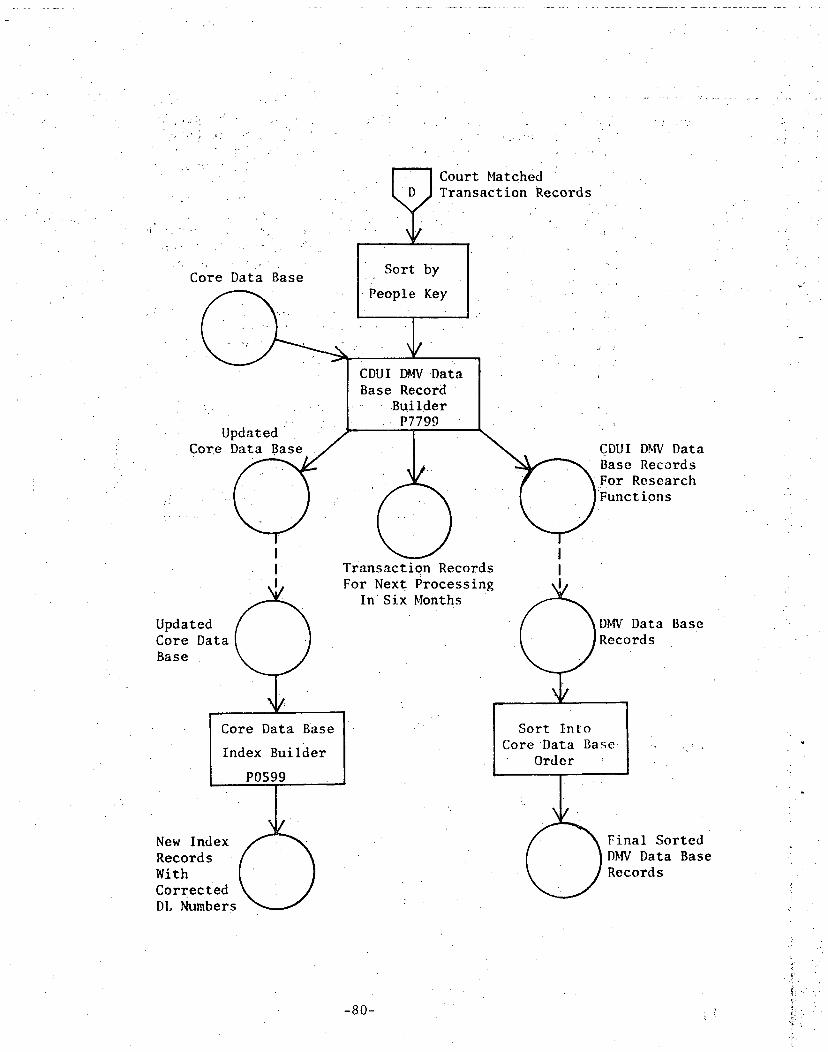
• , . - • . .
Core Data Base
Updated
'i. Come D ~
l l
Updated Core Data Base
Core Data Base
Index B u i l d e r
P0599
New Index " ~ Records [ With ~ ] Corrected k x . J DI, N u m b e r s ~
- ' -" " " ; L
~ Court M a t c h e d : Transaction Record s '
• . . . '
i I CDUI DMV,Data Base Record . . . . • Builder
P7799
Transaction Records For Next Processing
I n S i x Months
.- {
~ t A " CDUI D ~ Data 3 ~ - - ~ Base Records
I I ~ DMV Data Base
Records
Sort Into CoreData Base, ,, . ' •
Order '
: Final S o r t e d D~W Data Base Records
-80- " i ! "~ •
<;

APPENDIX B
Survival Data and Test Statistic Summary Tables
for First Offender Treatment Group Analysis
-81-

APPENDIX g DIRECTORY
Page
Total Assigned Groups (and Non-Volunteer Sample) ............. 83
Accident ................................................ 83
DUI/Reckless ......................................... ..... 90
Moving Violation 97
Age Less Than 25 Years 104
Accident 104 • . , • .
DUI/Reckless .............................................. 108
Moving Violation ..................................... ...112
Age 25 Years or Older ......................... ..... ; ......... 116
Accident ........................ • .............. ......... 116
DU!/Reckless ......... ...! ................ .............. •..120
Moving Violation .... ....... ; ..... ....................... 124
Social•Drinkers .;. ....................... ............. ........ 128
Accident ............. ................................... 128
DUI/Reckless ........... : ...... ....................... ..-132
Moving Violation 136
Midrange Problem Drinkers ............... ..................... 140
Accident ................................................ 140
DUI/Reckless ...144 * * o * . * . , o . , . * . . * o , , . * * . * * . . ~ . , o o * * * . . o , . . o
I loving Violation ................ . ........ ........... .... 148
Severe Problem Drinkers ....... - .... . .... ~ ...................... 152
AccidEnt 152
DUI/Reckless 156
Moving Violation .................... . ........ ~... ....... 160
-82-

I oo t,4 !
, ' Q -
I n t v l S t a r t Time (Days)
0 :0 3 0 . 0 60.0 9020
120.0 150.0 !8o.o 2.10.0 240.0 2 7 0 . 0 300.0
3 3 0 . 0 360.0 390.0 42O.0 450.0
4 8 0 . 0 s i o . o . 5 4 0 . 0 5 7 0 . 0 ' 600 .0 630 .0 660 .0 69O.O 720.O 750.0+
Number En t rng This Intvl
C o n t r o l
Number Wdrawn During Intvl
Table B l . a
Group S u r v i v a l Da ta : F i r s t A c c i d e n t
Number Exposd
t o Risk
Number of Propn
Termnl , T e r m i - Events nating
1270.0 1244.0 1192.0 1144.0 1091.0 1037.0
949 .0 872 .0 775 .0 695;0 645.0 588.0 533.0 459.0 401.0 354.0 313.0 267.0 234.0 192.0 156.0 127.0 101.0
68 .0 48.0 1 4 . 0
1 3 . 0 43.0 36.0 45.0 47.0 79.o 7O.O 93;0 75.0 48.0 51.0 52/0 68.0 57.0 44.0 39.0 45.0 32.0 4 2 . 0 3 5 . 0 2 9 . 0
2 6 . 0 33 .0 1.9.0 34 .0 14 .0
1263.5 1222.5 1174.0 !121.5 1067.5
997.5 914 .0 825.5 737:S 671.0 619.5 562.0 499.0 430.5 379 .0 334.5 290."5 251.0 213.0 174.5 141.5 114:0
84.5 58.5 31.0 7.0
13.0 9.0
12.0 8.0 7,0 9.0 7.0 4.0 :5.0 2.0 6.0 3.0 6.0 1.0 3.0 2.0 1.0 1.0 0.0 1:0 0.0 0.0
0 . 0 1.0 0.0 0.0
0.0103 0.0074 0 0102
• 0 0071 0 0066 0 0090 0 0077 0 0048 0 0068 O. 0030 0.0097 O. 0053 0 0120 0 0023 0 0079 0 0060 0 0034 0 0040
O 0 0 0057 O 0 O 0 0 0 0 0171 0 . 0 0 .0
Propn Survi- ving
Cumul Propn Surv At End
S E o f Cumul S u r v i - v i n g
0 .9897 0.9926 0.9898 0.9929 0.9934 0.9910 0.9923 0.9952 0,9932 0.9970 0.9903 0.9947 0.9880 0.9977 0.9921 0.:9940 0.9966 0.9960 1.0000 0.9943 1.0000 1.0000 1.0000 0.9829 1.0000 1 .0000
0.9897 0:9824 0.9724 0.9654 0.9591 0 . 9 5 0 5 0.9432 0 . 9 3 8 6 0.9322 0;9295 0.9205 0.9156 0.9045 O.9O24 0.8953 0.8899 0.8869 0.8834 0.88~4 0.8783 0.8783 0.8783 0.8783 0.8633 0.8633 0.8633
0.003 O. 004 O. 005 0.005 O. 006 0.006 O. 007 O. 007 0.008 O. 008 0.009 0.009 0.010 0 .010 0.011 0 .012 0 .012 0 .012 0.012 0.013 n.013 0.013 0.013 O. 020 0 .020 O. 020

Intvl Start Time (Days)
[ .
Number Entrng Thi s
I n t v !
Home Study
Number Wdrawn During I n t v l
T a b l e g l . b
Group S u r v i v a l Data: F i r s t
Number Exposd
To Risk
Number o f
Termn 1 Events
Acc iden t
Propn Termi- n a t i n g
Pro )n Surv i v ing
Cumul Propn
S u r v At End
SE o f Cumul S u r v i : r i n g
I
0 , 0 3 0 . 0 60 ,0 90.0
120.0 150.0 180.0 210.0 240.0 270.0 300.0 330.0 360.0 390~0 420.0 450,0 480.0 510.0 540.0 $70.0 6OO.O 630.0 660.0 690.0 720,0 750.0+
1309 .0 1286.0 1226.0 1165.0 i i i l .O 1048 ; 0
975.0 889 .0 809 .0 733.0
6 7 2 . 0 623.0 562 .0 490 '0 418.0 376.0 339.0 289.0 253.0 2is.o 167 .0 120.0 98.0 77.0 51.0 16.0
12 0 43 0 47 0 4 4 0 55 0 61 0 8 1 0 76 .0 70 ,0 56 .0 48.0 s6.o
7 1 . 0 66 .0 41.0 35.0 47,0 3s:o 37.0 48.0 47.0 2 2 . 0 21.0 25.0 35.0 16.0
1303.0 1264% 5 1202 ; 5 1143.0 1083.5 1017:5
934.5 851.0 7 7 7 . 0 705.0 648.0 595.0 526.5 457,0 397.5 358;5 315.5 271 .5 234.5 191.0 143.5 109,0
87.5 6 4 . 5 33.5
8 .0
11.0 17.0~ 14.0 10.0 •8.0
12.0 5 .0 4 .0
6 . 0 S, 0
1 . 0 5 ;0 1 .0 6 .0 1 .0 2 .0 3 .0 1 .0 1 .0 O.0 0 .0 0 .0 0 .0 1 .0 0 .0
0 . 0
O. 0084 0.0134 0.0116 O. 0087 0;0074 0.0118 0.0054 0. 0047 0.0078 0. 0071 o. oo i s O. 0084 0. 0019
0.01.31 0.0025 0.0056 O. 0095 0. 0037 O. 0043 0.0 0.0
.0.0 0.0 0.0155 0 .0 0 .0
0 .9916 0 . 9 8 6 6 0.9884 0.9913 0.9926 0.9882 O. 9946 0.9953 0.9922 0.9929 0,9985 0.9916 0.9981 0 .9869 0.9975 0.9944 0.9905 O. 9963 O. 9957 1. 0000 1 . 0 0 0 o 1.0000 1.0000 0.9845 1. 0000 1.0000
' 0 . 9 9 1 6 0'.9782 O. 9668 0.9584
0 . 9 5 1 3 O. 9401 O. 9351 0. 9307 0.-9234 0.9169 O. 9155 0. 9078 •0.9061 0. 8942 0 .8919 0 .8869 0.8.785 0.8753 O. 8715 0,8715 0.8715
0. .8715 0,8715 0 .8580 o.8s80 o. 858o
o . o o 3 O. 004 0.005 0 .006 0 .006 0 , 0 0 7 O,OO7 0.007
.0.008 0.008 o.oo9 0.009 O. 0O9 0 . 0 1 0 0.011 0.011 0.012
0 . 0 1 2 " 0.01.3 0.Ol.3 0.013 0.013 0,013 0.018 0.01R O.O1S
" l l • I
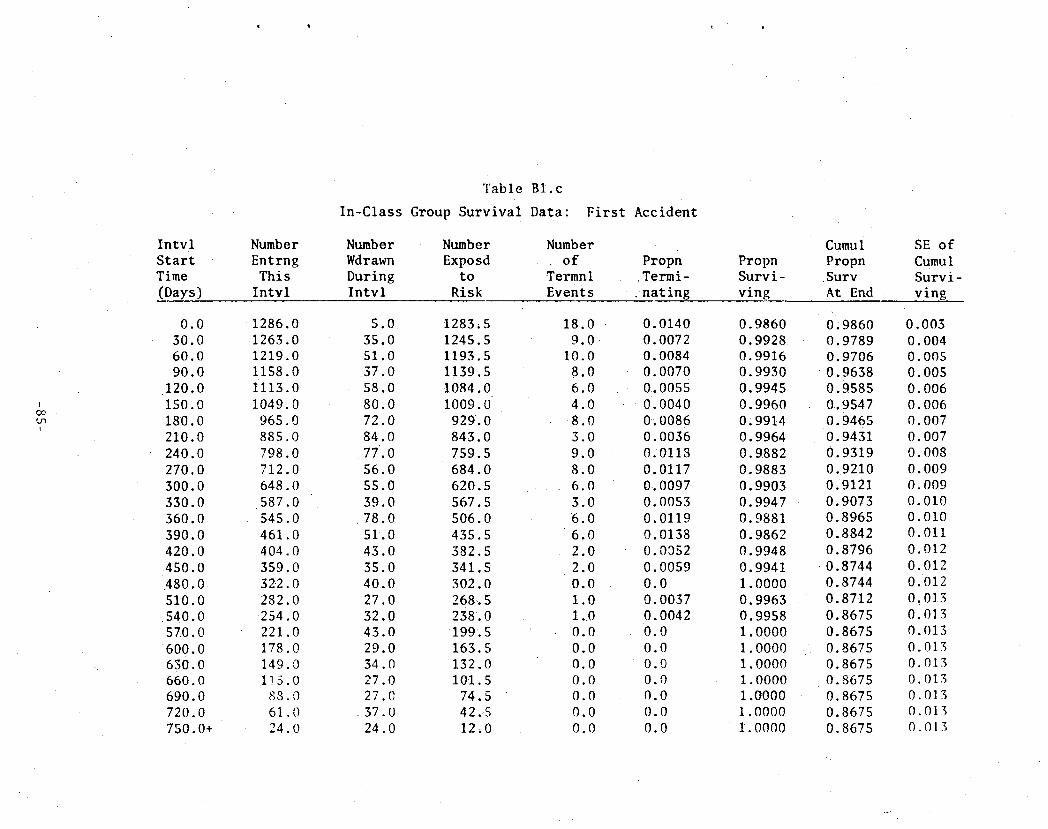
I n t v ! S t a r t Time (Days)
Number E n t r n g
T h i s Intvl
T a b l e B l . c
I n - C l a s s Group S u r v i v a l Da ta : F i r s t
Number Number Number Wdrawn Exposd o f Dur ing t o Termnl I n t v l R i sk Even t s
Accident
Propn , Te rmi -
. , n a t i n g
Propn Survi- ving
Cumul Propn
S u r v At End
S E o f Cumul S u r v i - v i n g
OC
0 .0 30 .0 60 .0 90 .0
120.0 150.0 180.0 210 .0 240 .0 270.0 300 .0 330 .0 360 .0 390 .0 420.0 450.O 480.0 510.0
540 .0 57.0.0
600 .0 630 .0 660,0 690.0 720.0 750.0+
1286 1263 1219 1158 1113 1049
965 885 798 712 648 587 545 461 404 359 322 282 254 221 178 149 1!5
88 61 24
.0 0 0 0 0 0 0 0 0
.0
.0
.0
.0
.0
.0
.0
.0
.0
.0
.0
.0
.0
.0
.0
.0
.0
5 . 0
35 .0 51 .0
3 7 . 0 5 8 . 0 80 .0 72 .0 84 .0 77 .0 56 .0 55 .0 39 .0 78 .0 Sl.O 43.0 35.0 40.0 27.O 32.O 43.0 29.0 34.0 27.0 27.0 37.0 24.0
1283,5 1245.5 1193.5 1139.5 1084.0 1 0 0 9 . 0
929 .0 843 .0 759 .5 684 .0 620 .5 567 .5 506 .0 435 .5 382 .5 341 .5 302 .0 268.-.5
2 3 8 . 0 199,5 163.5 132,0 101.5
74.5 42.,5 12,0
18.0 9 . 0
10.0 8 .0 6 .0 4 . 0 8 .0 3 .0 9 .0 8 .0 6 . 0 3 .0 6 . 0 6 .0 2 .0 2 .0 0 .0 1 .0 1 .0 0 .0 0 .0 0 .0 0 .0 0 .0 0 .0 0 .0
:0.0140 0.0072
0 . 0 0 8 4 o.oo7o 0.0055 o.oo4o 0.0086 0 .0036 0 .0118 0 .0117 0..0097 0 .0053 O. 0119 0 .0138 0 .0052 0 . 0 0 5 9 0 .0 0 .0037 0.0042 0.0 0.0 0.0 0.0 0.0 0.0 0.0
0.9860 0.9928 0,9916 0.9930 0.9945 0.9960 0.9914 0.9964 0.9882 0.9883 0.9903 0.9947 0.9881 0 .9862 0 .9948 0.9941 1 .0000 0 .9963 0.9.958 1.0000 1.0000 1.0000 1.000o 1.0000 1.00oo 1.0000
0;9860 0.9789 0.9706 0;9638 0.9585 0.9547 0.9465 0,9431 0.9319 0,9210 0.9121 0.9073 0,8965 0.8842 0.8796 0.8744 0.8744 0.8712 0.8675 0.8675 0.8675 O.8675 0,8675 0.8675 0.8675 0.8675
0.003 0.004 0.005 0.005 0.006 0.006 0.007 0.007 0.008 0.009 0.009 0.010 0.010 0.011 0.012 0.012 0.012 0.013 0 .013 0.013 0.013 0.013 0.013 0 .013 0 .013 0 .013

CO G, I
S u r v i v a l D a t a for t h e
Intvl Number Start Entrng Time This
. . . . . . .
0.0 30.0 60.0 90.0
120 .0 150.0 180.0 210.0 240.0 270.0 300.0 330.0 360 .0 390.0 420 .0 450 .0 480 .0 510.0 540.0 C ~Q J/ ~. 0
600.0 6 3 0 . 0 660 .0 690 .0 72o. c -50 . O+
3240.0 3212.0 3122.0 2984. (; 2819.0 2 6 6 9 , 0 2502.0 2367.0 2232.0 21•32.0 1935.0 1766.0 1604.0 1447.0 1318.0
1 2 1 1 . 0 1073.0 960.0 816..o, 722 ,0 617 .0 537.0 430.0 314 .n 208:(:
.-) ~- . , .~,-) . N
Number WdraWn During Intvl
1.0 68.0 112.0 143.0 126.0 146.0 120.0 121.0
91.0 182.0 i 6 1 . 0 147..0 15i .~0 123.0 104.0 132.0 107.0 138.0
87.0 102 .0
79 .0 t 0 7 . 0 114 .0 106.0
g3.0 125 .~
T a b l e B l . d
Sample o f N o n - V o l u n t e e r s : First
Number Number Exposd Of Propn to Termnl Termi
Ris_k - ...... Event s n a t in~
3239 .5 3178,0 3066.0 2912.5 2756.0 2596.0 2442.0 2306.5 2186.5
2 0 4 1 . 0 1854.5 1692.5 1528.5 1385.5 1 2 6 6 . 0 1145,0 1019,5
: 8 9 1 . 0 772•.5 671.0 577.5
. 4 8 3 . 5
a , 3 . O 261 .0 166.3
62 .5
27 22 26 22 24 21 15 14 0
9 0 1 5 0
8 0 15.0
6 .0 , 6 . 0
3.0 6 .0 6 .0
6 . 0
7..q 3 .0 1 .0 O. 0 2.0 () 0 0 .0 c}. (,,
0 0 O 0 0 0 0
O. 0083 O. 0069 0 .0085 0 .0076 0 .0087 0 .0081 0.0061 0 ,0061 O. 0041 0 .0073 0 .0043 0.0089 0 .0039 0.0043 O. 0024 0~0052 0.0059 0.0067 0.0091 0. 0045 O. 0017
O. 0O54 0%0 0 .9 0 .0
Accident
Propn Survi- ving
C u m u l Propn Surv
: At End
0.9917 0 . 9 9 3 1 0 .9915 0 .9924 0 .9913 0 . 9 9 1 9 0 .9939 0 .9939 0 .9959 0.9927 • 0 .9957 0 .9911 0 .996 ! 0~9957 0 .9976
0.9.917 0 .9848 0.9764 0 . 9 6 9 1 0 .9606 0 .9529 0 .9470
0 1 9 4 1 3 O. 9374
0 . 9 3 0 5 0.9263 0..9183 0 .9147 0 .9107
• 0 .9086 0. §§4'8 . . . . . . 0 . 9 0 3 8 0.9941 0.8985 0.9933 0.8924• 0 .9909 0 .8843 0 .9955 0 .8804
• Q O O. 9, (~3 0 .8789 1. 0000 O. 8789
"Td 0.9946 0 .8 ,~ 1 1 .0000 0.8741 1.O00C} 0.8741 1.0C;00 .0. 8741
SE o f Cumul Surv- iving.
0 . 0 0 2 0 . 0 0 2 0 . 0 0 3 0.003 O. 004
0 . 0 0 4 o. 004 O. 0O4 0 . 0 0 5 0 . 0 0 5 O . o o s
0 . 0 0 5 0 . 0 0 6 o: o 06 0 . 0 0 6 0 . 0 0 6 o .ooy 0 . 0 0 7 0 ~008 ~ 0 . 008 0 . 008 0.008 0 .009 0.009 0.009 0,009
I
g L 0
Table B l . e
Comparison of F i r s t Offender Treatment Groups Using the Lee,Desu S t a t i s t i c : First Accident
I GO - . j
Overal l Comparison
Group Name
Control, Home .Study In -Class
Pai rwise Comparison
Group Name
Control Home Study
Pai rwise Comparison
Group Name
Control In-Class
Pairwise Comparison
Group Name
Home Study In-Class
Statistic
Total N
1270 1309 1286
S t a t i s t i c
Tota l N
1270 1309
Statistic
Total N
1270 1286
Statistic
Total N •
1309 1286
0.637
Uncen
101 114
I I 0
0;640
Uncen
101 114
•0.129
Uncen
101 110
0.182
Uncen
114 !10
D o F ,
Cen
1169 1195 I176
D.F.
Cen
1169 i195
D.F.
Cen
1169 1176
D:. F.
Cen
1195 1176
2 : Prob.
Pet Cen
92.05 91.29 91.45
I Prob.
Pct Cen
92.05 91.29
1 Prob.
Pct Cen
92.05 91.45
1 Prob.
Pct Cen
91.29 91 .45
0 .727 i , NS
Mean Score
13.176 -13.756 0;98989
0.4238, NS
Mean Score
9.1850 -8 .9114
0.7190, NS
Mean Score
3.9906 -3.9409
0.6700, NS
Mean Score
-4.8442 4.9308

I OO OO
I
Table B l . f
Compar ison Of First O f f e n d e r T r e a t m e n t Group"and . t h e N o n - V o l u n t e e r Samnle Using t h e Lee-Desu S t a t i s t i c " F i r s t Acc iden t
Overall Comparison
Group Name
Non-Vol~mteer Control Home Study In-Class
P a i r w i s e Compar ison
Croup Nmme
Non-Volunteer Control
Pai~wi~e romnarison
Group Name
Pairwise
Group
PMrwise
~rouD
Statistic 2.949 D.F.
T o t a l N I~CEN CEN
32~.0 204 2976 1270 101 1169 1309 114 1195 !296 ii0 1176
S t a t i s t . i c
Total N
3240 !270
O..~4.,
UNCEN
264 ioi
D.F.
CEN
2976 1169
3 Prob.
PCT CEN
91.85 92.05 9 1 . 2 9
91.45
! Prob.
0.3996,NS
Mean Score
30"..845 10.68110 -50.72Q -25:~4.12
0;5546,NS
PCT CEN Mean Score
91.85 5~4315 92.05 -13,857
Statistic
Total N
2.445
UNCEN
D.F.
CEN
I Prob. 0.!179,NS
PCT CEN blean score
Non-Volunteer llome Study
Comparison
Name
Control Home Study
ComParison
<Name
Non-Volunteer •In-Class
324O 1309
Statistic
Total N
1270 IZq9
Statistic
Total N
3240 286
26,~ 114
f).640
UNCEN
101 114
1.25~4
!:!NCEN
~264 ] 10
2976 1195
D.F.
CEN
1169 1i95
D.F,
CEN
2976 176
91.85 91.29
:
1 Prob.
14.934 - 3 6 9 6 4
O. 4238 ,NS
PCT CEN ~!ean Score
92.05 9.1850 91.29 -8.9114
1 Prob. O. 26~ 9,NS
PCT CEN Mean Score
91.85 10:479 9!. 45 .-26.402
,i • :~
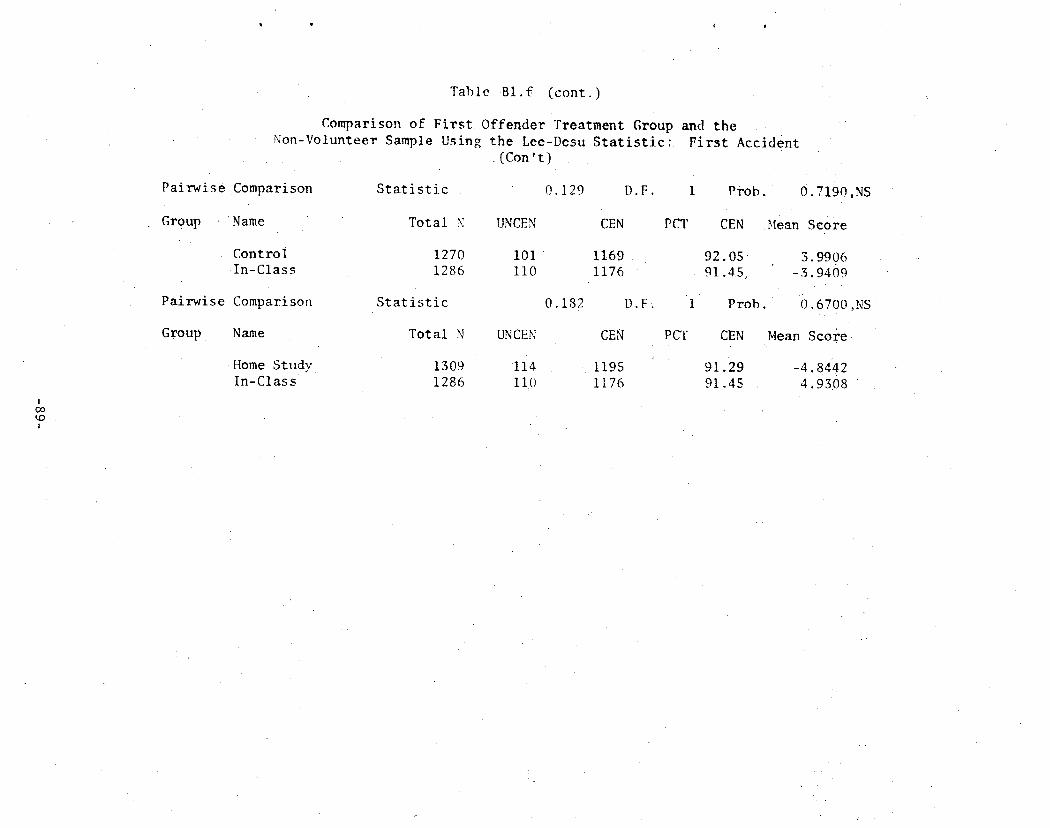
I OO ~D
I
Comparison of Non-Vohmteer Sample
Pai rwiseCompar ison
Group Name
Control . In-Class
Pairwise Comparison
Group. Name
-Home Study In-Class
Table B l . f (cont . )
F i r s t Offender Treatment Group S t a t i s t i c : Using the Lee-Desu
( t o n ' t )
0.129
UNCEN
I01 II0
0.182
UNCEN
I14 ii0
Statistic
Total N
1270 1286
Statistic
Total N
1309 1286
D.F.
CEN
1169 1176
D.F~
CEN
1195 l176
1
PCT
1
PCT
and the First Accident
Prob.: 0.7190,NS
CEN Mean Score
9 2 . 0 5 • 3.9906 91.45 -3.9409
Prob. 0.6700,NS
CEN Mean Score
91.29 -4.8442 9 1 . 4 5 4 . 9 3 . 6 8

". ' .
I ~D CD I
l n t v l
Table B2.a
Control Group Survival Data: First DUI or Reckless Driving
Number Number Number Number Start " Entrng Wdrawn Exposd Of Time This During to Termnl
( p a y S_~ ............. I__nZYi ' _ .... INY~i! ............. ~ _ k _ . . . . . . . . . _ _ E v e n t s
0.0 30.0 60.0 90.0
120.0 150.0 180.0 210.0 240.0 2 7 0 . 0 3 0 0 . 0 3 30 . 0 3 6 0 . 0 390.0 420 0 4 5 0 0 480 0 510 0 540 0 570 0 600 0 630 0 66O 0 690.O 7 2 0 . 0 750. O+
1 2 7 0 . 0 1245 . 0 1 1 8 7 . 0 1140 . 0 1 0 8 9 . 0 1036 . 0
9 4 7 . 0 8 7 1 . 0 7 7 3 . 0 694.0 639.0 5 8 1 . 0 5 2 6 . 0
4 6 2 . 0 403.0 356.0 3 8 0 . 0 2 6 6 . 0
, 2 3 5 . 0 1 9 4 . 0 1 5 5 . 0 1 2 4 . 0
9 6 . 0 6 4 . 0 4 5 . 0 15.0
13 .0 4 4 . 0 3 7 . 0 4 5 . 0 4 7 . 0 8 1 . 0 71 0 94 0 76 0 52 0 55 0 53 0 62 0 5 9 . 0 4 4 . 0 47.0
4 2 . 0 31.0 41.0 39 .0 31 .0 28.0 3 2 . 0 1 9 . 0
3 0 . 0 15.0
1 2 6 3 . 5 1223~.0 1168 .5 1117 .5 1065 .5
995 .5 9 1 1 . 5 8 2 4 . 0 7 3 5 . 0 6 6 8 . 0 6 1 1 . 5 554.5 4 9 5 . 0 4 3 2 . 5 3 8 1 . 0 3 3 2 . 5 2 8 7 , 0 2 5 0 . 5 214 .5 174:•5 139.5 110 .0
8 0 . 0 5 4 . 5
3 0 . 0 7 . 5
12 .0 14 .0
1 0 . 0 6 . 0 6 . 0 8 .0 5 . 0
4 . 0 3 .0 3 . 0
3 .0 2 . 0
2 . 0 0 . 0 3 ; 0 1 . 0 0 .0
. 0 . 0
o.o 0 . 0 0 . n 0 .0 0 . 0 O. f) 0 . 0 0 . 0
P r o p n Termi - Nating
0~0095 0 .0114 0 .0086 0.0054 0 . 0 0 5 6 0 . 0 0 8 0 0 .0055 0.0049 O. 0041 0,0045 0.0049 O. 0036 0.0040 0 . 0 - 0.0079 o. 0630 0 . 0 : . 0 . 0 0 . 0 0 . 0 0 . 0 0 , 0 0 . 0 0 .0 0 .0 0 . 0
O f f e n s e
Propn s u r v i - v i n g
0.9905 0':9886 0.9914 0.9946 0.9944 0.9920 0.9945 019951 0.9959 0..9955 0.9951 0.9964 0.9960 1.0000 0.9921 0 .9970 1.0000 I;0000 1 / 0 0 0 0 1 . 0 0 0 0 1.0000 1 . 0 0 0 0 1 . 0 0 0 0 1.0000 1 .0000 1.0000
Cumul P ropn
8 u r v At End
0.9905 0 . 9 7 9 2
O. 9708 0 . 9 6 5 6
0 . 9 6 0 1 0 .9524 0 . 9 4 7 2 0 . 9 4 2 6 0 . 9 3 8 7 0 . 9 3 4 5 0 , 9 2 9 9 0 . 9 2 6 6
. 0 . 9 2 2 9 0 . 9 2 2 9 0.9156 0.9128
: 0 . 9 1 2 8 • 0-.9128
0 : 9 1 2 8 0 . 9 1 2 8 0 . 9 1 2 8
0 . 9 1 2 8 0 . 9 1 2 8 0 .912o
:0 a~28 . . , 1
0 . 9 1 2 8
SE o f Cumu 1 SurVi - v i n g
0.003 • O. 004
O. 005 0.005 0.006 0.006 0.007 -0.007 . 0.007
" 0 . 008 0 . 0 0 8 0;008 0.009 0. 009 0.010 .0.010 0 . 0 1 0 0 .010 •0.010 0.010 O. 010 0.010 0.. Ol 0 0.010 0 . 0 1 0 0.010

I '( ( #
ltome Study Group Survival
T a b l e B2.b
Data : F i r s t DUI o r Reckless D r i v i n g O f f e n s e
I '.D F- .*
I
Intvl Start Time
( D aZS_) . . . . . . .
0 .0 30 .0 60 .0
9 0 . 0 120.0 150.0 180.0 2 1 0 . 0 240 .0 270.0 300 .0 330 .0 360-.0 390.0 420.0 450.0 480; 0 510,0 540 .0 570 .0 600 .0 630.0 660 .0 690 .0 720.0 750. O+
Number Number Number E n t r n g Wdrawn Exposed T h i s Dur ing t o
I n t v l I n t v l Risk
1309 .0 1288.0 1231.0 1172.0 1120.0 1062.0
993 .0 90410 823 .0 745.0 687 .0 639 .0
5 7 7 . 0 505 .0 431.0 390.0 352.0 306.0 268.0 224,.0 180~0 1 2 9 . 0 103.0
81:0 55 .0 19.o
12.0 43 .0 47 .0 44 .0 56 .0 63 .0 81 .0 75 .0 75 .0 55 .0 47.0 60.0 72 :0 73.0 40 .0 37 .0 46.0 38.0 42.0 43.0 5 1 . 0 26 .0 22 .0 26.0 36.0 19.0
1303.0 1266.5 1 2 0 7 . 5 1 1 5 0 . 5 1092 .0 1030.5
952.5 866 .5 785.5 717.5 663 .5 609 .0 541.0 468 .5 411 .0 371.5 .329.0 287 ,0 246 .0 202 .5 154.5 116.0
92 .0 68 .0 37 .0
9 .5
Number o f Propn Propn
Termnl Te rmi - S u r v i - E v e n t s n a t i n g _ v i n e ___
9 .0 14.0 12.0 8 . 0 2 .0 6 0 8 .0 6 .0 3 .0 3 .0 i : 0 2 .0 0 . 0 ! . 0 1 .0 1 .0 0 . 0 0 . 0 2 .0 1 .0 0 . 0 0 .0 0 . 0 0 .0 0 . o 0 .0
0. 0069 0.0111 0 .0099 0 .0070 0 .0018 0 . 0 0 5 8 0.0084
• 0 . 0 0 6 9 O. 0038 0.0042 0 .0015 0 .0033
0 . 0 0.0021 0 .0024 O. 0027 0 .0 0 .0 0.0081 0. 0049 0.0 0.0 0.0 0 .0 o.0 0 .0
0 .9931 0 ,9889 0 .9901 0 . 9 9 3 0 0 .9982 0 .9942 0 . 9 9 1 6 0 .9931 0 .9962 0 .9958 0 ,9985 0.9967 1 .0000 O,9979 0 .9976 0:9973 1.0000 1.0000 0.9919 0.9951 1.0000 ! , 0 0 0 0 1 .0000 1 .0000 1 .0000 1.000o
Cumul Propn Surv At End
SE o f Cumul S u r v i - Ving
: ' 0 . 9 9 3 i 0 .9821
" 0 . 9 7 2 4 0 ; 9656
0 . 9 6 3 8 0 .9582 0 .9502 O.9436 0 . 9 4 0 0 0.9360 0.9346
~0.9316 0:.9316 0.'9296 0.-9273 0.9248 O. 924.8
0 . 9 2 4 8 0.9173
••0.9128 •0 .9128
0 .9128 0:9128
.0 .9128 .0.9128 0 .9125
0.002 0.004 O.OOS 0.005 0 .005 0 . 0 0 6
0 .006 0 .007 0 .007 0 .007 0 .008 0 .008 0 .008 0 .008 0 .008 0 .009 0 .009 0 .009 OJOlO 0.011 0:.011 0.011 0 . O l l o .011 0 . 0 l l 0 .011
t4D tx3
I
. , ~ ;
I n - C l a s s Group S u r v i v a l
Intvl Start Time (Days)
Tab I e
0.0 30.0 60.0 90,0
120 .0 150.0 180.0 210, O. 240.0 270 .0 300.0 330.0 360. '.'3 390.0 420.0 450,0 480.0 510.0 540.0 570; 0 600,0 630.0 660.O 690.0 720.0 750. O+
Data: First
B2 c
DU! o r Reck less
Ntmber Number Number Number Entrng Wdrawn ExPosed of Propn This During to Terml Termi- Intvl I n t v l Risk Events - n a t i n g
1286.0 1271.0 !223.o
1167 .0 1119,0 1057.0 964.0 889.0 801.0 722.0 660.0 600.0 354.0 478.0 418.0 374.0 3•37. O 290.0 258.0 227.0 184.0 150.0 1 ] 4 . 0
88.0 5 9 . 0 2 2 . 0
.5 ̧ . 0 35. ') 5i .o 37.0
58.0 85.0
7 1 . 0 85:. 0 76.0 60.0 57.0
4 3 . 0 7 5 . 0 58,0 44.0 37.0 46.0 31 0 31.0 43.0 34.0 36.0 26.0 29.0 37.0 22.0
1283.5 1253.5 1197.5
! 1 4 8 . 5 1 0 9 0 . 0 1014 .5 928;5 846.5 763.0 692.0 631.5 578.5 516.5 449.0 396.0 355,5 3i4.0 274.5 242.5 20s,s 167.0 132.0 101.0
73.,5 ,40.5 i! .0
lO.O 13.0
5.0 11 .o
4.0 8.0 4 .0 3,0 3 . 0 2.0 3.0 3 .0 1.0 2.0 0.0 0.0 1.0 1.0 1.0 0.0 0.0 0 .0
0 . 0 O.O 0 . 0 0.0
0.0078 0,0104 0.0042
0 . 0 0 9 6 0 .0037 0.0079
•:0.0043 0.0035 0,0059 0.0029 0.0048 0.00S2 0.0019 0.0045 0 . 0 0.0 0 .0032 0;0036 0 . 0
0 .0 0.0 0. e 0.0 0 . 0
o.O
Driv ing Of£ense
Propn SUrvi- v ing
: Cumul P r o p n Surv A t End
oi9922 0.9896 0.9958 O. 9904 0.9963 0.9921 0.9957
0.9965 0.9961 0.9971 0 ; 9952 0.9948 0.9981 0.9955 1 .ooon 1.0000 0.9968 0.9964 ] "oooo 1, O000 1. 0000 1.0000 1.0o00 1.0000 1.0000 }. ~000
0 .9922 O .9819 0 . 9 7 7 8 0_,9685 0.9649
0 . 9 5 7 3 0.9532 O. 9498
-O. 9461 0 . 9 4 3 3
0 .9388 ' O. 9340 0.9322 0,9280 0.9280 0.9280 0 .9251 0.9217 0 .9217 o.9217
0.9217 0.921: 0.9217 0 .92!7 0.9217
SE Of Cumu 1 Surv i - r i n g
O. 002 0.004
,0,004 :0. 005 0 . 005 0.006 0.006 0.006 0.007
0 . 0 0 7 O. 007 0.008 0.008 0 ; 009 0 . 0 0 9 0 .009 O. 009 0.010 0,010
>0.010. 0 .0I O O. 0 I0 0.010 0.010
0 . 0 1 0 0.010

I 4 I •
Survival Data fo r the Sample
Table B2.d
o f N o n - V o l u n t e e r s : First DUI Or Reckless Driving O f f e n s e
I ~D Oq
Intvl Start Time (Days)
0.0 30.0 60.0 90.0
120.0 150.0 180.0 210.0 240.0
270.0 300;0 330.0 360.0 390.0 420 .0 450.0 480.0 510.0 540.0 570.0 600. O 630.0 660. i~ 690.0 720.0 750.04
Number Entrng This Intvl
Number Wdrawn During lntvl
Number Exposd to
Risk
3240.0 • 3205.0
3119.0 2991.o 9 . 8 3 0 ; 0 2691.0 2521.0 2391.0 2261.0 2160 O 1965 0 1801 0 1644 0 1487 O 1354 0 1234.0 1089.0 •977.0 835 .0 753:0 654.0 57 ! . 0 447.0 331.0 227.0 134.0
1.0 67 .0
113.0 145.0 124.0 148.0 122 .0 120.0
96 .0 186.0 160.0 152.0 151.0 130.0 117.0 .141.0 ili .0 140.0
81.0 98.O 83.0
124.0 116.0 104.0
93.0 13a .0
3 2 3 9 . 5 3171.5
3 0 6 2 . 5 2918.5 2771 .0
2 6 1 7 . 0 2460.0 2 3 3 i i 0 2 2 1 3 . 0 2067 .0 1885.0 1725.0 1568.5 1422.0 1295.5 1163.5 1033.5
907.0 794.5 704.0 612.5 509.0 389.0 279.~ 180.5
67.0
Number of Propn
Termnl " Termi Events. hating
Propn Surv i - ring
34.0 19.0 15.0 I 3 . n ] 8 . n
22.0 8:.0
i 0 . 0 5,0 9 .0 4 .0 5.0 6.0 3 . 0 3.0 4 .0 4 . 0 2.0 1.0 1.0 O,O 0 . 0 0.0 0.0 0.0 0.0
0.0105 0.0060 0.0049 0 .0045 0. 0065 0.0084 0.0033
• O. 0043 0.0023 O. 0044 0. 0021 0 . 0 0 2 9 0.0038 0.0021 0.0023 O. 0034 O. 0010 0:0022 0.0013 0.0014 0 .0
0 . 0 O.r, 0. O 0.0 n F~
0.9895 0.9940 0.9951 0 .9955 0 .9935 0 .9916 0 .9967 0'.9957 0 .9977 0 .9956 0.9979 0.9971 0.9962 0.q979 •0.9977 0.9966 0 ;9990 0.9978 0.9987 0.9986 1.0000 1.0000 1.000o 1.000o i . 0 0 0 0 1.O00O
Cumul Propn Surv At End
0.9895 0.9836 0.9788 0.9744 0.9681 0.9599 0.9568 0.9527 0.9506 0.9464 0.9444 0.9417 0.9381 0.9361 0.9339 0.9307 0.9298 0.9278 0.9266 0.9253 0.9253 0 .9253 0.9253 ~.9253 0.9253 0 .9253
SE oF Cumul Surv- zvlng
O, 002 0.002 0.003 0.003 0.003 O. 004 O, 004 0.004 O. 0O4 O. 0O4 O. 004 0.005 0. 005 0.005 0.005 O. 005 0.005 0.005 O. 006 0. 006 0.006 0.006 0.006 0.006 0.006 O. 006

I
4~ I
Table B2 e
Comparison Of F i r s t O f f e n d e r Trea tment Groups Using the Lee-Desu S t a t i s t i c : . " i "
First DUI or Reck le s s Driving Offense
O v e r a l l Comparison
Group Name
Con t ro l Home Study I n - C l a s s
Statistic
Total N
1270 1309
:1286
' 0.646 D.F.
Uncen Cen
82 1188 80 1229 74 1212
2
PCT CEN
93.54 93.89 94.25
PROB. O.7239,NS
Mean Score
-12.892 0 . 7 9 6 7 9
11,921
Pairwise CompariSon Statistic O. 194 D. F 1 PROB, 0.6598,NS
Group Name. Total N Uncen Cen PCT CEN Mean Score
Control Home Study
1270 1309
82 80
1188 9 3 . 5 4 1229 93.89
-4.6457 4..5073
Pairwise Comparison
Group Name
Control In-class
Pairwise Comparison
Group Name
Home Study In -C la s s
Statistic
Total N
127o 1286
S t a t i s t i c
Total N
1309 1286
O. 642
Uncen
82 74
0. 136
Uncen
80 74
D.F.
Cen
1188 1212
D.F.
Cen
1229 1212
1 •PROB.
PCT. CEN
93.54 94.25 :
1 PROB.
Pcr c E N
93.89
0.423n,NS
btean-Score
:8.2465 8.1439
0.7126,NS
~4ean Score
"3.7105 3,7v68
&

Table B2. f
Comparison o f F i r s t O f f e n d e r Trea tment Group and t h e Non-Volun tee r Sample UsJ.nR the Lee-Desu Statistic" First DUI or Reckless Driving Offense
I
I
Overa l i
Group
Pairwise
Group
Pairwise
Group
Pairwise
Group
Pairwise
Group
Comparison
Name
Non-Volunteer Control HomeStudy In-Class
Comparison
Name
Non-Volunteer Control
Comparison
Name
Non-Volunteer . Home Study
Comparison
Name
Cont ro l Home Study
Comparison
.Name
;qon-Vohm~eer I n - C l a s s
Statistic 2. 814
Total N UNCEN
3240 183 1970 "~ __ , . 0 /
1309 80 1286 74
Statistic 2.461
Total N UNCEN
3240 i83 1270 82
Statistic I. 073
Total N UNCEN
3240 183 1309 80
Statistic 0. 194
Total N UNCEN
1270 82 1309 80
Statistic O. 346
Total N [~CEN
32 ,I 0 18.3 "~ • 7 d 1 ~,.86 , .
D , } 7 ,
CEN
3057 118~
1229 1212
D.F.
CE.Y
3057 1188
D.F.
CEN
3057 1229
D.F.
CEN
1188 1229
P,F.
CEN
• -r "7 .~05, 12!2
3 Prob. 0.4212,NS
PCT CEN Mean Score
94.35 26.865 93.54 -46.494 93.89 -20.975 94.25 -0.41991
i Prob. 0.I167,NS
PCT CEN Mean Score
94.35 13.071 93.5a -33:602
1 Prob. 0.3003,NS
PCT CEN ~.lean Socre
94.35 8.7960 93.89 -21.772
0.6598,NS
Mean Score
-4 ,5457 4.5073
1 Prob.
PCT CEN
93.54 93.89
] Prob. 0.5563,NS
PCT CEN .Hean Score
94.35 4.8981 94.25 -12. 341

Table B2.f (Cont.)
comparison o f F i r s t Offender Treatment Group and the Non-Volunteer Sample • ~ Reckless Driving Offense Usin~ the Lee-Desu Statistic: Fa.r..~ Dill or (Con t inued)
!
~D Ox I
Pairwise Comparison
Group Namle
Control In-Class
Pairwise Comparison
Group: Name
Home Study In-Class
S t a t i s t i c
Total N
1270 1286
Statistic
Total N
1309 1286
0.642
UNCEN
82 74
0.136
UNCEN
80 "4
D.F.
CEN
1188 1212
D.F.
CEN
1229 1212
PCT
PCT
1 Prob. 0.4230,NS
CEN Mean Score
93.54 -8.2465 94,25 8.1439
I Prob. O.7126,NS
CEN blean Score
93.89 -3.210S 94.25 3.?768
!.
l
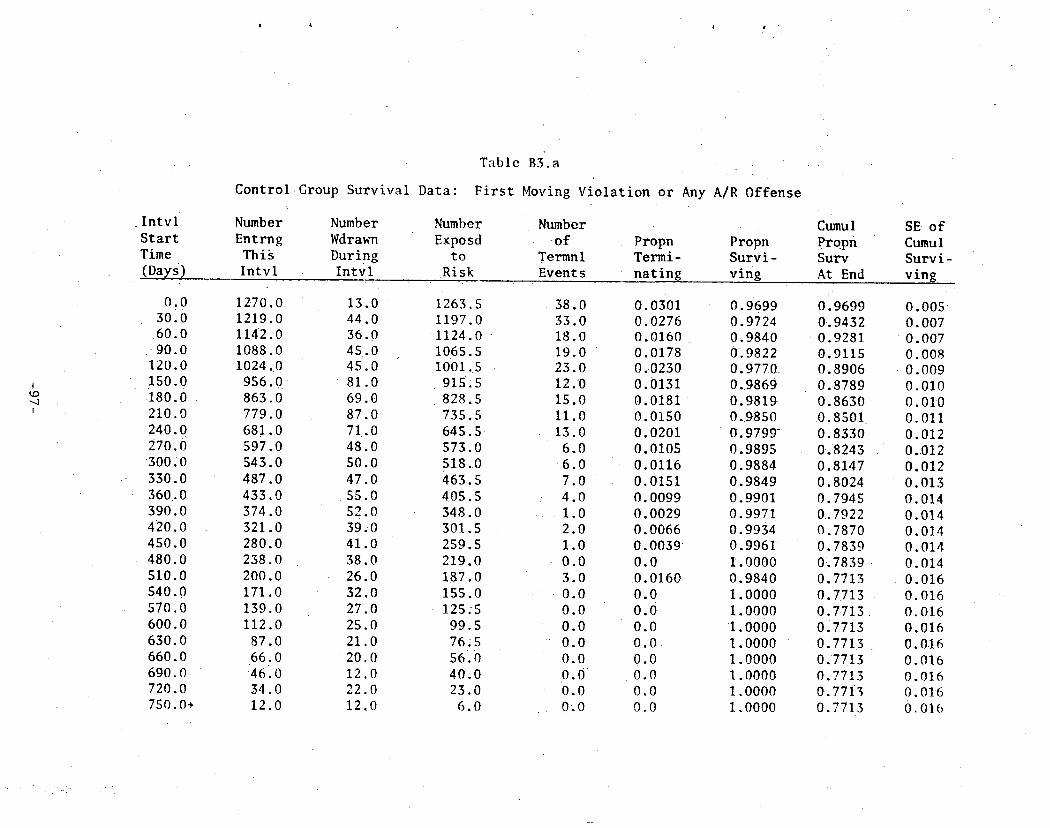
I n t v l S t a r t Time
.. (Days)
C o n t r o l G r o u p S u r v i v a l
Number Number Entrng Wdrawn
Thig During I n t v l I n t v l
Data:
Table BD.a
First Moving Violation or Any A/R O f f e n s e
Number Exposd
to R i s k
Number -of
Termnl Events
Propn Termi - n a t i n g
Propn Survi- ving
Cumul Propn Surv At End
SE o f Cumul S u r v i - v ing
I
"-.I I
o.o 30.0
•60.0 9 0 . 0 120.0 150.0 1 8 0 . 0 210.0 240.0 270.0 30010 330.0 360..0 390.0 420 .0 450.0 480.0 510.0 540.0 570.0 600.0 630.0
660 .0 690.0 720.0 750.0+
1270.0 1219.0 11.42.0 1088.0 1024..0
956.9 863.0 779.0 681.0 597.0 543.0 487 .0 433 .0 374.0 321.0 280.0 238.0 200.0 171.0 139.0 112.0
87.0 66 .0 4 6 . 0 34.0 12.0
13.0 44.0 36.0 45 0 45 0 81 0 69 0 87 0 71 0 4 8 0 5 0 0 47.0 55.0 52.0 39.,0 41;0 38.0 26.0 32 .0 27.0 25.0 21.0 20.0 12.0 22.0 12.0
•1263.5 1197.0
•1124.0 1065.5 1001..5
915:5 828.5 735.5 645 .5 573.0 518.0 463.5 405.5 348.0 301.5 259.5 219.0 187.0 155.0 125:5
99 .5 76;5 56.0 40.0 23.0
6.0
1 1
38.0 33 .0 18.0 19.0 23 .0 12.0 15.0
.0 13.0
6 .0 6 . 0 7 .0 4 .0 1 .0 2 .0 1 .0 0 .0 3 .0 0 .0 0 .0 0 .0 0 .0 0 .0 0 o 0
0 .0 0 .0
0,0301 O. 0276 0 .0160 0.0178 0,0230 0.0131 0.0181 0.0150 0.0201 0. 0105 0 .0116 0.0151 0. 0099 0 .0029 0. 0066 0 . 0 0 3 9 0 .0 •0.0160 0 .0 0 .0 0.0 0 .O 0 . 0 0 .0 0 .0 0 .0
0.9699 0.9724 0.9840 0.9822 0 . 9 7 7 0 0.9869 0.9819 0.9850 0.9799- 0.9895 0.9884 0.9849 0.9901 0.9971 0.9934 0.9961 1.0000 0.9840 1.0000 1.0000 1.0000 1.0000 1.0000 1.0000 1.0000 1.0000
019699 0.9432 0.9281 0,9115 0.8906 0.8789 0.8630 O.8501 0:8330 0 .8243 0 .8147 O. 80.24 0.7945 0.7922 0.7870 0.7839 0%7839 0.7713 0 7.713 0.7713 0 7 7 1 3 0.7713 0.7713 0.7713 0 .77 i3 0:7713
0 .005 0.007 O.OO7 0.008 0.009 0.010 O. 010 0.011 0.012 0.,012 0 .012 0 .015 0 .014 0.014 0.014 0.014 0.014
0 .016 0.016 0.016 0.016 0.0.16 0.016 0 .016 0. 016 0.01.6

I n t v l S t a r t Time (Days)
T a b l e B3.b
ttome S t u d y Group S u r v i v a l D a t a : - F i r s t Moving
Number Number Number Number E n t r n g Wdrawn Exposd : o f
T h i s Dur ing t o Ternml I n t v l I n t v l R i s k E v e n t s
V i o l a t i o n o r
P r o p n T e r m i - n a t i n g
Any ~ / R O f f e n s e
Propn Survi - ving
Cumul ; P r o p n S u r v
At End
SE of Cumul Survi- ving
I
Oo '1
0 . 0 30..0 6 0 . 0 9 0 . 0
1 2 0 . 0 150 .0 180.0 2 1 0 . 0 2 4 0 . 0 2 7 0 . 0
.300 ,0 3 3 0 , 0 360 .0 390.0 420.0 450.0 480 .0 5 1 0 . 0 540.0 570.0
: 600 .0 6 3 0 . 0 6 6 0 . 0 6 9 0 . 0 7 2 0 . 0 75O .0+
1 3 0 9 . 0 1 2 7 0 . 0 1 1 8 8 . 0 1 1 1 5 . 0 1 0 4 6 . 0
9 7 4 . 0 8 9 4 . 0 803.0 714.0 629.0 574.0 525.0 468.O 400 .0 332.0 296.0 262.0 219.0 1 8 7 . 0 1 5 3 . 0
1 2 1 . 0 8 4 . 0 66.0 5 3 . 0
3 7 . 0 I0.0
12.0 43.0 47.0 43.0 56.0 62.0 7 7 . 0
• 73.0 •72.0 5 0 . 0
4 5 . 0 5 5 . 0 65:.0 64.0 35.0 33.0 43.0 29.0 3 1 . 0 3 2 , 0 3 7 , 0 18 .0 13.0 16.0 27.0 10 .0
1 3 0 3 ; 0 1248 .5 1164 .5 1093~5 1 0 1 8 . 0
9 4 3 . 0 8 5 5 ; 5 7 6 6 . 5
• 6 7 8 . 0 6 0 4 . 0 551 .5 . 4 9 7 . 5 435 .5 368.0 314.5 279.5 240.5 204.5
1 7 1 . 5 1 3 7 . 0
1 0 2 , 5 7 5 ; 0 59.5 . 4 5 : 0 2 3 . 5 SiO
2 7 . 0 : 39 .0 2 6 . 0 2 6 . 0 16 .0 1 8 . 0 14.0 1 6 . 0 13 .0
5 . 0 4 . 0
2 . 0 3 , 0 4 . 0 1 . 0 1 .0 0 . 0 3 . 0 3 . 0 : 0 . 0 0 . 0 0 . 0
0 . 0 0 . 0 0 . 0
• 0 . 0
0.0207 0.0312 0 .0223 0.0238 0.0157 0.0191 0.0164 0,0209 0.0192
:0.0083 0.0073 0.0040 O. 0069 O. 9109 0 .0032 0 .0036 O. 0 0.0147 0 . 0 1 7 5 O . 0 0 . 0 0 . 0 0 . O 0 . 0 0 . 0 0 . 0
0.9793 0.9688 0.9777 O. 9762 0.9843 0.9809 0.9836 0.9791 0.9808 0.9917 0.9927 0.9960 0.9931 0.9891 0.9968 0 . :9964
1 . 0 0 0 0 0.9853 •0.9825 1 .0000
: ' 1 . 0 0 0 0 1 . 0 0 0 0 1.0ooo 1.0000 1 . 0 0 0 0 1 .0000
•'0.9793 0 . 9 4 8 7 0 .9275 0.9055 0 .8912 0 . 8 7 4 2 0..8599 0,8420 0 .8258 0 . 8 1 9 0 0 . 8 1 3 0 0~8098 0.804•2
•.'.-0.7954 0 . 7 9 2 9 0.7901
•:0.7901 .0.7785 •0.7649 0,7649
.0 .7649 •0,•7649 0 : 7 6 4 9
0.7649 0.7649 0.7649
0; 004 O. 006 0 ~ 007 O. 008 O. 009 0.010 0:010 0.011 0 .012 0 .012 0 .012 0 .012 0 .013 0 . 0 1 3 0 .013 0.014 0.014
0 . 0 1 5 0 .017 0 . 0 1 7 O. 017 0.017 0.017 0 .017 0 .017 0 .017
:
T - ' :

Jl • l •
. I n t v l Start Time (Days)
"Fable B3.c
I n - C l a s s Group S u r v i v a l Da ta : F i r s t Moving
Number Number Number Number E n t r n g Wdrawn Exposd o f T h i s Dur ing t o Ternml Intvl Intvl Risk Events
V i o l a t i o n or Any
P r o p n T e r m i - n a t i n g
A/R O f f e n s e
Cumul P r o p n Propn Survi- Surv ving At End
SE o f Cumu 1 Surv i - v i n g
I
0 .0 30 .0 60 .0 90.0
120.0 150.0 180.0 210.0
240.0 270.0 300.0 330.0 360.0 390.0 420.0 450.0 480.0
• 510.0 540.0 570.0 600 .0 630.0 660.0 690.0 720.0 750. O+
1286.0 1242.0 1174.0 1105.0 1042.0 960.0 861.0 780.0 689.0 608.0
5 5 0 . 0 492.0 451.0 376.0
321 .0 284.0 250.0 209.0 181.0 156.0 123.0
98.0 68 .0 50 .0 33 .0 11.0
" 5 .
35, 51. 37. 58. 84. 68. 81. 70. 53. 50. 36. 67. 50. 36. 33. 39. 26. 23. 32. 25 30. 18 17 22 11.
0 1283.5 0 1224.5 0 1 i 4 8 . 5 0 1086.5 0 1013.0 0 918 .0 0 827;0 0 739.5 0 654.0 0 581.5 0 525.0 0 474.0 0 417.5 0 351.0 0 303 .0 0 2 6 7 . 5 0 230 .5 0 196,0 0 169.5 0 140.0 .0 110.5 0 83.0
.0 59 .0
.0 41 .5
.0 22 .0 0 5 . 5
39 ;0 33 .0 18 .0 26 .0 24 .0 I 5 . 0 13.0 10 .0 11 .0
5 .0 8 .0 5 .0 8 .0 5 .0 1 .0
1 . 0 2 . 0 2 .0 2 .0 1 .0 0 .0 0 .0 0 .0 0 .0 0 .0 0 .0
O. 0304 O. 0269 0 .0157 0 .0239 0 .0237 0 .0163 0 .0157 0 .0135 0 .0168 0 .0086 0 .0152 0 .0105 O. 0192 0 .0142 0 .0033 O. 0037 O. 0087 0 . 0 1 0 2 0 .0115 0.0071 0 .0 0 .0 0 .0 0 .0 0 .0 0 . 0
0 .9696 0 .9731 0 .9843 0.9761 0 .9763 0 .9837 0 .9843 0 ,9865 0..9852 0.9914 0.9848 0.9895 0.9808 0.9858 0 .9 9 6 7 0 .9963 0 .9913 0 .9898 0 .9882 0 .9929 1 .0000 1.0000 1.0000 1.0000 1.0000 1.0000
0.9696 0.9435 0.9287 0.9065 0.8850 0,870S 0.8569 0.8453 0.8310 0 .8239 0 .8113 0.8028 0 .7874 0 .7762
0 . 7 7 3 6 0 . 7 7 0 7 0 .7640
0 . 7 5 6 3 0 .7473
0 . 7 4 2 0 0 .7420 0 .7420 0 . 7 4 2 0 0 .7420 0.7420 0.7420
0.005 0.006 0.007 0.008 0.009 0.010 0.010 0.011 0.011 0.012
0 . 0 1 2 0 .013 0.014 0.014 0 .015 0.015 0.015 0 .016 0 .017 0~018 0 .018 0:018 0.018 0 .018 0 .018 0 .018

/
Tab le B 3 . d
I
C I
S u r v i v a l
Intvl Start Time (Days)
0.0 30.0 60.0 90.0
120.0 iSO.O 180.0 210:0 240.0 270.0 3 0 0 . 0 330 .0 360 .0 390.0 420 .0 450.0 480.0 510.0 540:. 0 S70.0 600 .0 630.0 660.0 690.0 720.0 750.0+
Data
Number Entrng
This In tVl
3240.0 3143.0 2999:0 2836.0 2635.0 2463.0 2276.0
2 1 2 7 . 0 1990 .0 1866.0 1681.0 1528.0 1386.0
1 2 4 5 . 0 1122.0 1009.0
893.0 794.0 667..0 595.0 515 .0 4 5 6 . 0 363.0 2 6 5 . 0 184.0 1 0 6 . 0
For The Sample of
Number Wdrawa During
! n t v l
Non'Volunteers" F i r s t Moving V i o l a t i o n or Any A/R O f f e n s e
Number Number Exposd of P r o p n
to Termnl • Termi- Risk Events n a t i n g
O. 0296 O. 0248 0 .0170 0 .0206 0.0198 0.0172 0.0149 0.0111 0. 0154 0.0101 O. 0056 O. 0034 O. 0068 O. 0076 O. 0047 0.0031 •0.0036 0.0082 O. 0016
"0. 0054 0 .0 0.0024 O.OO32 O. 0044
0 . 0 0.0
P r o p n Survi- ving
0 . 9 7 0 4 0.9752 0 .9830 0.97-94-
0 . 9 8 0 2 0.9828 0.9851 0.9889 0 .9846 0 .9899 0 .9944 -:. 0 . 9 9 6 6 0 .9932 .... 0 .9924 0.9953 0.9969 0.9964 0.9918 0 .9984 0 .9946 1 .0000 0 .9976 0.9968 0.9956 1.0000 1.0000
1 .0 • 67.0
113.0 144.0 1 2 1 . 0 146.0 1 1 6 . 0 114.0
94 .0 167.0 1 4 4 . 0 137.0 134.0 112.0 108.0 113.0
96 .0 121.0 7 1 . 0 77.0 59.0 92.0 197.0 80.0
7 8 . 0 106.0
3239.5 3109.5 2942.5 2764.0 2574.S 2390.0 2218.0 2070.0 1943.0 1782.5 1609.0 1459.5 1319.0 1187.0
1 0 6 8 . 0 952.5 845.0 733.5
6 3 1 . 5 556.5 485~5 410.0 314-:5 225,0 14S.0
53.0
96.0 77.0 SO.O $7.0 51.0 41.0 33.0 23.0 30.0 18.0
9.0 5.0 •9.0 9.0 5.0 3.0 3.0 6.0
1 . 0 •3.0 0.0 1.0
•.1.0 1.0 0.0 0.0
Cumul P r o p n S u r v At End
0 .9704 0.9463 0~9303 0 . 9 i l l 0.8930 0.8777 0.8646 0.8550 0;8418 0.8333 0.8287 0.82S8 0:8202 0.8140 0.8102 :0.8076 0.8048 0~7982
"0 .7969 0.7926 0.7926 0.7907 O:.7882 0 .7847
0 . 7 8 4 7 0%.7847
SE of Cumul Survii ving
0 .003 0.004 0.005 0.005 0.006 0.006 0.006 0.007 0.007 0 .007 0.007 0,007 0.007 0 .008 0.008 0.008 0.008 0 .008 0.009 0 .009 0.009
O.0O9 0.009 0.010 0.010 0.010
? .
. . /
- L
L

| i i •
Table B3.e
Comparison o f F i r s t O f f e n d e r Trea tmen t Groups Using t h e Lee-Desu S t a t i s t i c i V i o l a t i o n or Any A/R Of fense
First Hoving
I
C
I
Overall Comparison Statistic
Group Name Total N
Control 1270 Home Study 1309 In-Class 1286
Pairwise Comparison Statistic
Group Name Total N
Control 1270 Home Study 1309
Pairwise Comparison Statistic
Group Name Total N
Control . 1270 In-Class 1286
Pairwise Comparison Statistic )
Group Name Total N
Home Study 1309 In-Class 1286.
0.204 D.F.
Uncen Cen
212 1058 221 1088 229 1057
O.001 D.F.
Uncen Cen
212 1058 221 1 0 8 8
0,170 D.F.
Uncen Cen
212 1058 229 I057
0.134 D.F.
Uncen Cen
221 1088 229 1057
2 Prob. 0.9030, NS
Pct Cen Mean Score
83.31 7.'3543 83.12 5.4347 82.19 ~12.795
1 Prob. 0.9727, NS
Pct Cen Mean Score
83.31 0.56614 83:12 -0.54927
1 Prob. 0.6800, NS
Pct Cen Mean Score
83.3! 6.7882 82.19 -6.7037
1 Prob. 0 .7147, NS
Pct Cen Mean Sco~e
83.12 5.9840 82.19 -6.0910
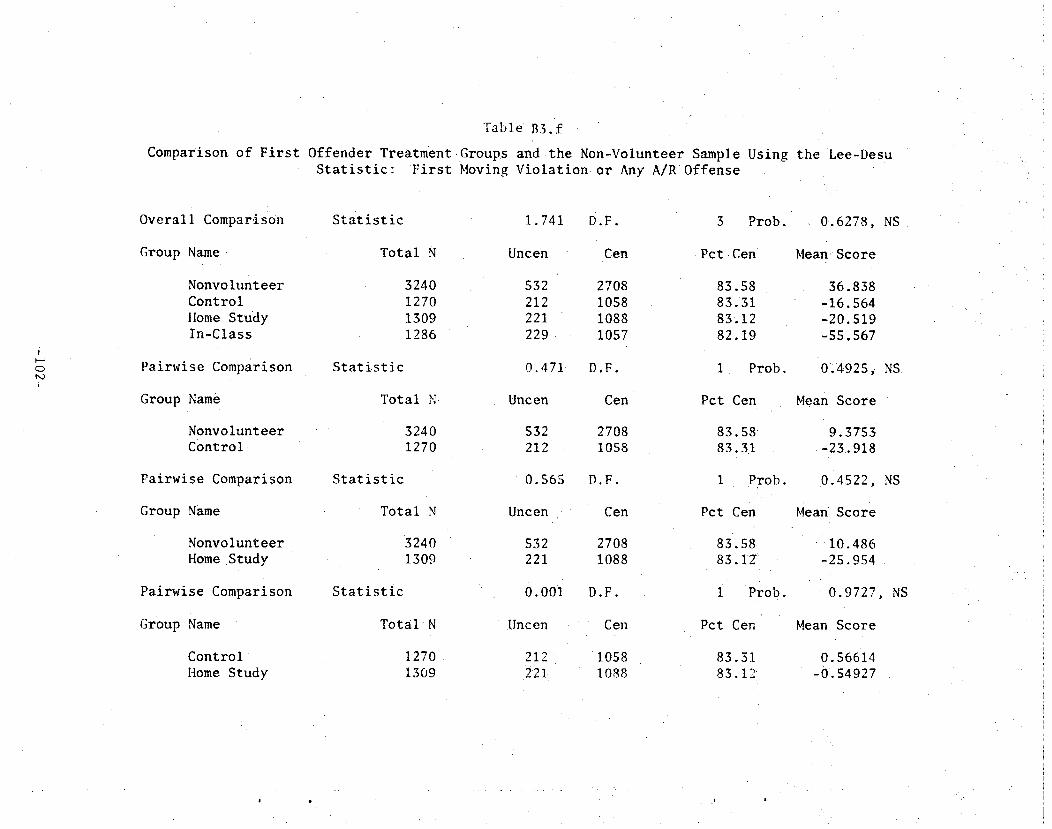
i
fD b O
i
Table B3 . f
Compar i son o f F i r s t O f f e n d e r T r e a t m e n t , G r o u p s and t h e N o n - V o l u n t e e r Sample Us ing t h e Lee-Desu S t a t i s t i c : F i r s t Moving V i o l a t i o n o r Any A/R O f f e n s e
f .
O v e r a l l Compar i son S t a t i s t i c 1.741 D.F. 3 Prob . 0 . 6 2 7 8 , NS
Group Uncen Name. Total N
Nonvolunteer 3240 Control 1270 Home S tudy 1309 I n - C l a s s 1286
532 212 221 229
Cen
2708 1 0 5 8 1088 1057
Pct Cen Mean S c o r e
83.58 83.31 83.12 82.19
36.838 -16 .564 -20 .519 -55 .567
Pairwise Comparison Statistic 0 . 4 7 1 D.F. 1 Prob. 0:4925,. NS.
Group Name Total N- Uncen Cen P c t Cen Mean Score
N o n v o l u n t e e r C o n t r o l
P a i r w i s e Compar i son
Group Name
N o n v o l u n t e e r Home S tudy
P a i r w i s e Compar i son
3240 1270
Statistic
Total N
3240 1309
Statistic
532 2708 212 1058
0 . 5 6 5 D.F.
U n c e n Cen
532 2708 221 1088
o . o o l D .F .
8 3 . 5 8 83.3.1
1 Prob .
Pct Cen
83.58 83. I Z
i P r o b .
9.3753 - 2 3 . 9 1 8
0.4522, NS
Mean Score
1 0 . 4 8 6 - 2 5 . 9 5 4
0 .9727 , NS
Group Name
C o n t r o l Itome S tudy
Total N
1270 1309
Uncen
212 •221.
cen
I058 1088
Pct Cen
83.31 83.12
Mean Score
0.56614 -0.54927
I t ~ " •
Table B3.f (Cont.)
Comparison of First Offender Treatment Groups and the Non-Volunteer Sample Using the Lee-Desu Statistic: First Moving Violation or Any A/R Offense (Continued)
I
Pairwise Comparison
Group Name
Nonvolunteer I n - C l a s s
P a i r w i s e C o m p a r i s o n
Group Name
C o n t r o I I n - C l a s s
P a i r w i s e Compar i son
Group Name
Home S tudy I n - C l a s s
S t a t i s t i c
T o t a l • N
3240 1286
Statistic
Total N
1270 1286
Statistic
Total N
1309 1286
1.502
Uncen
532 229
0 .170
Uncen
212 229
0 .134
Uncen
221 229
D.F.
Cen
2708 1057
D.F.
Cen
1058 1057
D.F.
Cen
1088 1057
1 Prob. 0 . 2 2 0 4 , NS
Pct Cen Mean Score
83 .58 16.977 82 .19 -42 . 772
1 Prob • 0 . 6 8 0 0 , NS
Pct Cen Mean Score
83.31 6 .7 8 8 2 8 2 . 1 9 - 6 . 7 0 3 7
1 Prob . 0 . 7 1 4 7 , NS
P e t C e n ' Mean Sco re
83.12 5 . 9 8 4 0 82 .19 -6 . •0910

I
Q
Intvl S t a r t Time (Days)
0 . 0 3 0 . 0 6 0 . 0 9 0 . 0
1 2 0 . 0 1 5 0 . 0
1 8 0 . 0 2 1 0 . 0 2 4 0 . 0 2 7 0 . 0 3 0 0 . 0 3 3 0 . 0 3 6 0 . 0 3 9 0 . 0 420.0 450.0 480.0 5 1 0 . 0 5 4 0 . 0 570.0 600.0 650.0 660.0 690;0 72i3.0 750. O+
Control Group S u r v i v a l Data
q 'ab le Bd .a
f o r Age Less Than
Number Number Number Entrng Wdrawn Exposd This During to Intvl . . . . ! n ~ v l Risk
Number of
Termnl Even t s
25 Years:
P ropn Survi- ving
5 .0 1 5 ; 0 11 .0 16 .0 1 0 i 0 3 7 . 0 2 0 , 0 3 0 . 0 2 9 . 0 1 7 . 0 16.0 25.0 26.0 2 0 . 0 20.0 13.0 1 7 . 0 1 1 . 0 i 8 . 0 11 :0 1 1 . 0 14 .0 1 6 . 0
5 .0 12 .0
6 . 0
4 7 2 . 5 4 5 4 . 5 4 3 6 . 5 4 1 6 . 0 4 0 0 , 0 3 7 4 . 5 3 4 4 . 0 3 1 6 . 0 2 8 4 . 5 2 5 9 . 5 2 4 3 . 0 2 1 9 . 5 1 9 2 . 0 166.•0 1 4 6 . 0 129 .5 1 1 4 . 5 100 .5
8 6 . 0 71.5 5 9 . 5
4 7 . 0 32.0 21.5 12.o 3.0
820 5 . 0 7 . 0 3 . 0 2 .0 2 . 0 3 .0
2 . 0 2 . 0 0 . 0 3 . 0 2 . 0
3 . 0 0 . 0 O. 0 0 . 0 0 . 0 •0.0 0 . 0 1 . 0 0.0 0.0 0.0 1.0 0.0 0.0
Propn T e r m i - n a t i n g
Accident
Cumul P r o p n Surv AtEnd
4 7 5 . 0 4 6 2 . 0 4 4 2 : 0 4 2 4 . 0 4 0 5 . 0 3 9 3 . 0 3 5 4 . 0 3 3 1 . 0 2 9 9 . 0 2 6 8 . 0 2 5 1 . 0 2 3 2 . 0 205.0 i 7 6 . 0
1 5 6 . 0 1-36.0 1 2 3 . 0 1 0 6 . 0
9 5 . 0
7 7 . 0 6 5 . 0 54.0
40 .0 24.0 18 .0
6 . 0
0 . 0 1 6 9 0 . 0 1 i 0
0 . 0 1 6 0 0 . 0 0 7 2 0 . 0 0 5 0 0.0053 0 .0087
0 . 0 0 6 5 0 . 0 0 7 0 0.0 0 . 0 1 2 3 O. 0091 •0 .0156 0 . 0 0 . 0
0 . 0 0 . 0 0 . 0 0 . 0 0 . 0 1 4 0 0 . 0 : 0 . 0 0 . 0 0 .0465 0 .0 0 . 0
First
0 .9831 0 . 9 8 9 0 0 . 9 8 4 0 0 . 9 9 2 8 0 . 9 9 5 0 0 .9947 0 .9913 0 . 9 9 3 7 0 . 9 9 3 0 I~0000 0 . 9 8 7 7 0..9909 0.9844 1 . 0 0 0 0
1.0000 I. 0000 1. 0000 L0000 1, 0000 0,9860 1.0000 1 . 0 0 0 0 1.0000 0 .9535 1 . 0 0 0 0 1.0000
, " 0 . 9 8 3 1 01.9723
: 0 .9567 • 0. 9498
0 . 9 4 5 0 0 . 9 4 0 0 0 . 9 3 1 8 0 . 9 2 5 9
0 i 9 1 9 4 0 .9194 0.9080 0.8997 0.8857 0.8857 0 . 8 8 5 7
• 0.8857 0.8857 0.8857 0 . 8 8 5 7
' 0 . 8 7 3 3 ' 0 , 8 7 3 3 0 . 8 7 3 3 0 . 8 7 3 3 0 .8327 0 . 8 3 2 7 0 .8327
sE of Cumu i S u r v i - v ing
0.006 0 . 0 0 8
O. 009 0 . 0 1 0 O.Oi l 0 .011 0 .012 o~o13 0 .013 o.o~3 0.015 0,016 0.017 0.017 o.o17 O. 017 0.017: 0 .017 O. Ol 7 0.021 0;021 0.021 0.021 0. 045
O. O45 O. 045
• ' i

i e ! )
I
t~q I
I n t v l S t a r t T i m e (Days)
0 . 0 30.0 60.0 90.0
120 .,0 150.0 180.0 210.0 240.0 270.0 300.0 330.0 360.0 390.0 420.0 450.0 4 8 0 . 0 510.0 540.0 570.0 600.0 650.0 660.0 690.0 720.0 750.0+
ltome S t u d y Group S u r v i v a l
Number Number Entrng Wdrawn
This• During Intv~ Intvl
Table B4.h
Data for Age Less Than
Number Number Exposd o f
t o Termn i Risk Events
484.0 471 .0 444 .0 418 .0 401.0 3 7 4 . 0 3 5 1 . 0 322.0 294.0 260 .0 238.0 219.0 199.0 1 7 3 . 0 147.0
1 3 4 . 0 117.0 1 0 2 . 0
89.0 79.0 61 .0 45.0 37.0 34.0 21.0 9.0
5 .0 20.0 20.0 11.0 21,0 19.0 25.0 27.0 29.0 20.0 19.0 20 .0 2 5 . 0 24,0 12.0 16.0 14.0 13.0 9 . 0 18.0 16.0
8 .0 3 . 0 12.0 12.0
9 .0
481.5 461 .0 434 .0 412.5 390.5 364; 5 338.5 308.5 279.5 250.0 228.5 209.0 186.5 161.0 141.0 126.0 110.0
95.5 84.5 70.0 53.0 41 .0 35.5 28 .0 15.0
4 . 5
.
7 .
6 .
6. 6. 4.
" 4 .
1.
0 0 0 0 0 0 0 0
5 . 0 2 .0 0 .0 0 .0 1 .0 2 ,0 1 .0
1 . 0 1 .0 O. 0 1 .0 0 .0 0 .0 0 .0 0 .0 1.0 0 .0 0 .0
25 Y e a r s :
Propn Termi- n a t i n g
0 .0166 0 . 0 i 5 2 0.0138 0.0145 0 , 0 1 5 4 O. 0110 0.0118 0.0032 0.0179 0.0080 0.0 0.0 O. 0054 0.0124 O. 0071 0.0079 0.0091 0 .0 0:0118 0 .0 0 .0 0 .0 0 .0 0 .0357 0 ,0 0 .0
F i r s t Accident.
Propn Survi- ving
.Cumul Propn
S u r v At End
SE of Cumul Survi- ving
0.9834 0.9848 0,9862 0.9855 0,9846 0.9890 0.9882 0.9968 0,9821
0 . 9 9 2 0 1 .0000 1.0000 0,9946 0,9876 0.9929 0,9921 0,9909 1.0000 0.9882 1.0000 1.0000
1 . 0 0 0 0 1 . 0 0 0 0 0.9643 1 . 0 0 0 0 1.0000
0.9834 0 . 9 6 8 5
0 .9551 0.9412 0.9267 0.9165 0.9057 O.9O28 0 .8866 0;8795 048795 0'.8795 0.8748
0 . 8 6 3 9 0 . 8 5 7 8 0 . 8 5 1 0
0.8433 0 . 8 4 3 3
0,8333 0.8333
0 . 8 3 3 3 0 . 8 3 3 3
• 0 . 8 3 3 3 0.8035
o . 8 o 3 5 0.8035
0 . 0 0 6 O.O08 0 .010 0.011 0 .012 0 .013 0,014 0.014 0.016 0.016 0.016 0.016 0.017 0.018 0 .019 0 .020 0 .022 0 .022 0.024 0.024
0 . 0 2 4 0.024 0.024 0.037 0 .037 0.037

I
I
Intvl Start. Time (Days)
0 . 0 5 0 . 0 60 .0 9 0 . 0
120 .0 150 .0 180.0 210 .0 240 .0 270 .0 3 0 0 . 0 330 .0 360.0 390-O 420.0 450 .0 480.0 510.0 540.0 570 .0 600 .0 6 3 0 . 0 660.0 690.0 720.0 750.0+
In-Class Group S u r v i v a l
Number Number E n t r n g Wdrawn
T h i s Dur ing I n t v l I n t v I
Tab 1 e
Data For Age
Number Exposd
to Risk
B4 .c
Less Than 25
Number o f
Termn i E v e n t s
475 ,0 463.0 445.0 415.0 393.0 376.0 346.0 316.0 289 .0 261 .0 233 .0 212 .0
1 9 3 . 0 t 6 1 . 0 136 .0 119 .0 108 .0
95 .0 85 .0
' •74:0 62.0 52.0 41.0 33~0 23.0
9.0
1.0 ii. 0 24.0 16.0 14;0 29.0 26.0 26 0 21 0 27 0
1 8 0 18 0 29 0 21 .0 i 5 . 0 11.0 13.0
9.0 I0.0
12.0 10.0 11.0 8.0
10.0 14.0 9.0
474,5 457.5 433.0 407.0 386.0 361 .S 333.0 303.0 278.5 247 .S 224.O 203.0 178.5 150.5 128.5
113.5 101.5 90.5 80.0 6 8 . 0 57.0 46.5 37.0 28.0 1 6 . 0
4.5
I I . 0 7.0 6.0 6 . 0 3.0 1.0 4.0 1.0 7.0 1.0 3.0 1.0 3.0 4.0 2.0 0.0 0.0 1.0 1.0 0.0 0.0 0.0 0.0 0.0
-0.0 :0.0
Years :
Propn Termi - • n a t i n g
• O. 0232 0.0153 0.0139 0.0147 0.0078 O. 0028 0 .0120 O. 0033 0.0251 O. 0040 O. 0134
• O. 0049 0.0168
O. 0266 0.0156 0.0 O. 0 0.0110 0 .0125
0 . 0 0 . 0 0 .0 0 . 0
0 . 0 0 .0 0 .0
F i r s t A c c i d e n t
Propn Surv i - v i n g
0.9768 O. 9847 0,9861 0.9853 O. 9922 0.9972 0 . 9 8 8 0 0.9967 0.9749 0.9960 9 . 9866 0.9951 0.9832 O. 9734 O. 9844 i . 0000 1. 0000 0.9890 0.9875 1 . 0 0 0 0 1 .0000 1. 0000 1 . 0000 1. 0000 1 .0000 1. 0000
: Cumul P r o p n
S u r v At End
0 .9768 0 . 9 6 1 9 0.9485 0.9346 0.9273 O. 9247 0.•9136 0 .9106_ 0 .8 8 7 7 0.8841 0 .8723 O. 8680 0.8534 0.8307 0.8178
0 . 8 1 7 8 0 .8178 0 .8088 O. 7987 O. 7987 0 '7987 O-.7987 O. 7987 0.7987 0.7987 0.7987
SE of Cumul Survi- ving
0.007 O. 009 Q~010 0.012 0.012 0.012 0.013 O. 014 O. 016 0.016 O. 017 0 .018 0 .019 0.022 0.023 0 . 0 2 3 0.023 0.025 0.027• 0:027 0.027 0.027 0.027 0.027 0.027 0.027

0 • ! •
Tab le B4.d
C o m p a r i s o n o f F i r s t O f f e n d e r Trea tment Groups For Age Less Than 25 Years Using The Lee-Desu S t a t i s t i c : F i r s t Acc iden t
I
O --d I
Overall Comparison Statistic
Group Name Total N
Control 475 }[ome Study 484 In-Class 475
Pairwise Comparison Statistic
Group Name Total N
Control 475 Home Study 484
Pairwise Comparison Statistic
Group Name T o t a l N
c o n t r o l 475 I n - C l a s s 475
Pairwise Comparison Statistic
Group Name To ta l N
Home Study 4 8 4 I n - C l a s s 475
2.681
Uncen
44 57 62
1.563
Uncen
44 57
2.482
Uncen
44 62
0.104
Uncen
57 62
D . F .
Cen
431 427 413
D.F.
Cen
431 427
D.F.
Cen
451 413
D.F.
Cen
427 413
2 Prob .
Pct Cen
90.74 88.22 86.95
1 Prob.
Pct Cen
90.74 88..22
1 Prob.
Pct Cen
90.74 86.95
1 Prob .
Pet Cen
88.22 86.95
0 .2618 , NS
M e a n S c o r e
2 2 , 5 8 9 - 7 . 1 1 7 8 =15.337
0 .2113 , NS
Mean Score
9 . 9 8 7 4 -9 .8017
0 .1151 , NS
Mean Score
12.602 -12 .602
0 . 7 4 6 5 , NS
Mean Score
2 . 6 8 3 9 , 2 . 7547

I
0 O0
Intvl Start Time (Days)
0.0
30.0 60.0 90.0
120.0 150.0 180.0 210.0 240.0 270.0 300.0 330.0 360.0 390.0 420.0 450.0 480.0 510.0 540.0 570.0 600.0 630.0 660.0 690.0 720.0 750.0+
Control
Number Entrng T h i s
, i n t v l !
Table BS.a "
Group~Survival Data For Age Less Than 25 Years : DUI or Reck le s s Dr iv ing Of f ense
Number Wdrawn During Intvl
Number Exposd
t o Risk
Number of
Termnl Events
Propn -Termi- nating
First
Propn Survi- ving
475.0 463.0 442.0 426.0 407.0 396.0 352.0 332.0 300.0 269.0 249.0 229.0 202.0 178.0 157.0 133.0 114.0
99.0 88.0 7 1 . 0 s8.o 48.0 33.0 19.0 IS.O 4.0
5.0 16.0 I i . 0 16.0 I 0 .0 39.0 19.0 32.0 30.0 19.0 18:o 26.0 24.0 21 .'0 22.0 1 8 . 0 15.0 11.0 17.0 134.0
1 0 . 0 15.0 14.0 • 4,0
II.0 4.0
472.5 455.0 436.5 418.0 402.0 376.5 342.5 316.0 285.0 259.5 240.0 216.0 190.0 167.5 146.0 124.0 106.5
93.5 79,5 64.5 53.0 40.5 26.0 17.0
9.5 2.0
7 . 0
5.0 5 . 0 3.0 1 . 0 5.0 1.0 0.0 i . 0 1.0 2.0 1 . 0
0.0 0.0 :2.0 1.0 0.0 0 . 0
0 . 0 0,0
0 . 0 0.0 0.0 0.0 0.0 0.0
0 ,0148 O. 0110 0:0115 0.0072 O. 0025
0 . 0 1 3 3 0.0029 o,o 0;0035 0.0039 0.0083 O' 0046 0.0 0.0 0.0137 0.0081 0.0 0.0 0 . 0 0 . 0 0.0 0~0 0.0 0:0 0.0 0.0
0.9852 0.9890 0.9885 0.9928 0.9975 0.9867 0.9971 1.0000 0.9965 0,9961 0.9917 0.9954 1.0000 1.0000 0.9863 0.9919 1.0000 llOOOO 1.0000 1 . 0 0 0 0 1.0000 1.0000 1.0000 1.0000 1.0000 1.0000
Cumul propn Surv At End
SE of • Cumul Survi- ving '
0.9852 0.9744 0,9632 0.9563
0 . 9 5 3 9 0 .9412 0.9385 0.9385 0.93;52 0.9316 0.9238
0 . 9 1 9 6 0 . 9 1 9 6 0 .9196 0.9070 0.8996 0.8996
0 . 8 9 9 6 0.8996 0 .8996 :0:8996 0.8996
0 . 8 9 9 6 0 . 8 9 9 6
0.8996 ~0.8996
. ..
0.006 O. 007 O. 009 0 .010 0.010 0.011 0.012 0.012 0.012 0.012 0 .013 o.o14 0.014 0 .014 o.o16 0.018 0.018 o.o18 0.018 0.018 0.018 0.018 0.018 0.018 0.018 0.018
L
i t . .
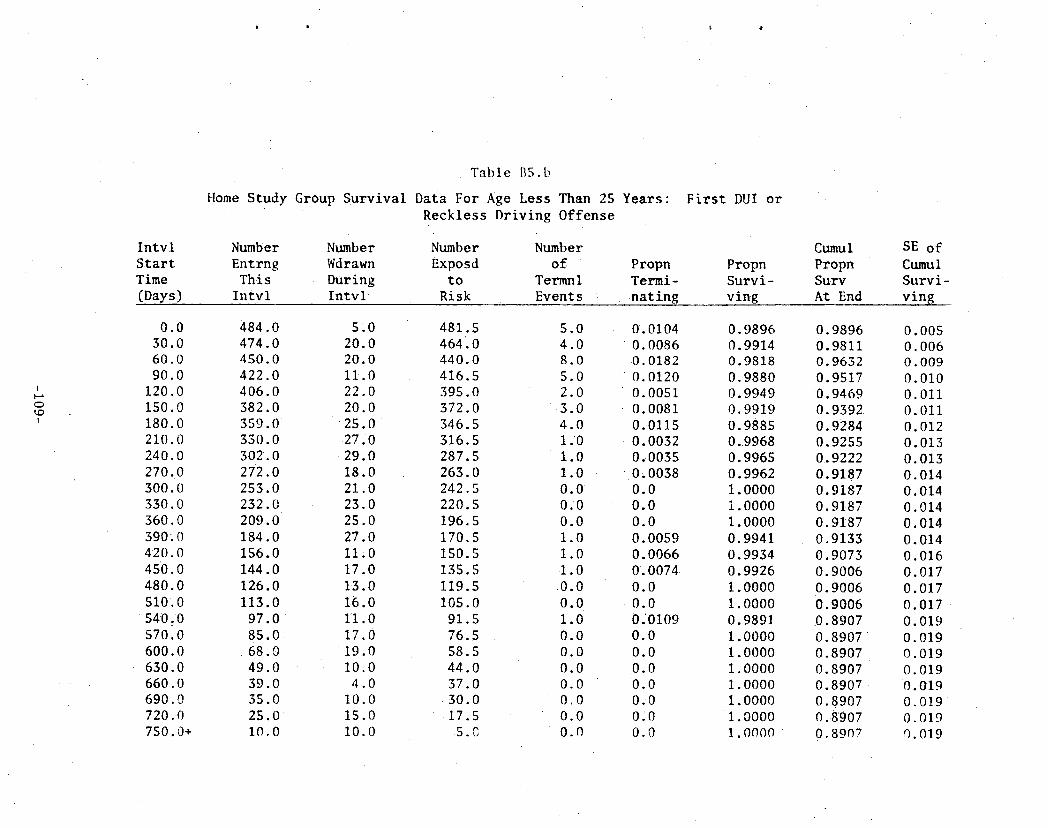
a t •
Intvl Start Time (Days)
Home
T a b l e BS.b
S t u d y Group S u r v i v a l Da ta For Age Less Than 25 R e c k l e s s D r i v i n g O f f e n s e
Number Number Number Entrng Wdrawn of This During Termnl Intvl I n t v l E v e n t s
Number Exposd
t o Risk
Years:
Propn Termi - • nat ing
F i r s t DUI or
Propn Survi- ving
Cumul Propn Surv At End
SE o f Cumul S u r v i - v i n g
I
0 t,O I
0 . 0 4 8 4 . 0 5 . 0 3 0 . 0 4 7 4 . 0 2 0 . 0 6 0 . 0 4 5 0 . 0 2 0 . 0 9 0 . 0 4 2 2 . 0 11 .0
120 .0 4 0 6 . 0 2 2 . 0 150 .0 3 8 2 . 0 2 0 . 0 180 .0 3 5 9 . 0 2 5 . 0 210 .0 3 3 0 . 0 2 7 . 0 240 .0 3 0 2 . 0 2 9 . 0 2 7 0 . 0 2 7 2 . 0 1 8 . 0 3 0 0 . 0 2 5 3 . 0 2 1 . 0 330 .0 2 3 2 . 0 2 3 . 0 3 6 0 . 0 2 0 9 . 0 2 5 . 0 390 :0 1 8 4 . 0 2 7 . 0 4 2 0 . 0 1 5 6 . 0 11~0 450.0 144.0 17.0 480.0 126.0 13.0 510.0 113.0 16.0
540.0 97.0 11.0 570 .0 8 5 . 0 1 7 . 0 6 0 0 . 0 6 8 . 9 19 .0 630 .0 4 9 . 0 10 .0 660 .0 3 9 . 0 4 . 0 690.0 35.0 I0.0 720.0 25.0 15.0 750.0+ 1 0 . 0 I0.0
4 8 1 . 5 4 6 4 . 0 4 4 0 , 0 4 1 6 . 5 3 9 5 . 0 3 7 2 . 0 346 .5 316 .S 2 8 7 . 5 2 6 3 . 0 242.5 2 2 0 . 5 196 .5 170 .5 150.5 135.S 119.5 105.0 91.S 7 6 . 5 58.5 44-.0 37.0 3 0 . 0
1 7 . 5 S . 0
5.0 4.0 8.0 5.0 2.0 3.0 4.0 1.0 1.0 1.0 0.0 0.0 0.0 1.0 1.0 1.0 0.0 0.0 1.0 0.0 0.0 0.0 0 , 0
0.0 0.0 0.0
0 .0104 O. 0086 0 .0182 0 . 0 1 2 0 0 .0051 O. 0081 0 . 0 1 1 5 0. 0032 O. 0035
• O. 0038 0.0 0 .0 0.0 0.0059 O. 0066 0.0074 0.0 0.0 0.0109 0.0 0.0 0.0 0.0 0.0 0.0 0.0
0.9896 0.9914 0.9818 0.9880 0.9949 0.9919 0.9885 0.9968 0.9965 0.9962 1.0000 1.0000 1.0000 0.9941
0.9934 0.9926 1.0000 1.0000 0.9891 1.0000 1.0000 1.0000 1.0000 1.0000 1.0000 1 . 0 0 0 0
0,9896 0.9811 0.9632 0.9517 0.9469 0.9392 0.9284 0 .9255 0..9222 0 .9187 0 .9187 0 .9187 0 .9187 0 .9135 0 .9073 0.9006 0.9006 0.91006 0.8907 0 . 8 9 0 7 0.8907 0.8907 0 . 8 9 0 7 0 .8907 0.8 '907 0 .8907
0.005 0.006 0 009 0 010 0 011 0 011 0 012 0 013 0 013 0.014 0.014 0.014 0.014 0.014 0.016 0 . 0 1 7 0 . 0 1 7 0 . 0 1 7 0 . 0 1 9 0 . 0 1 9 0.019 0.019 0.019 0.01.9 0 . 0 1 9 9 . 0 1 9
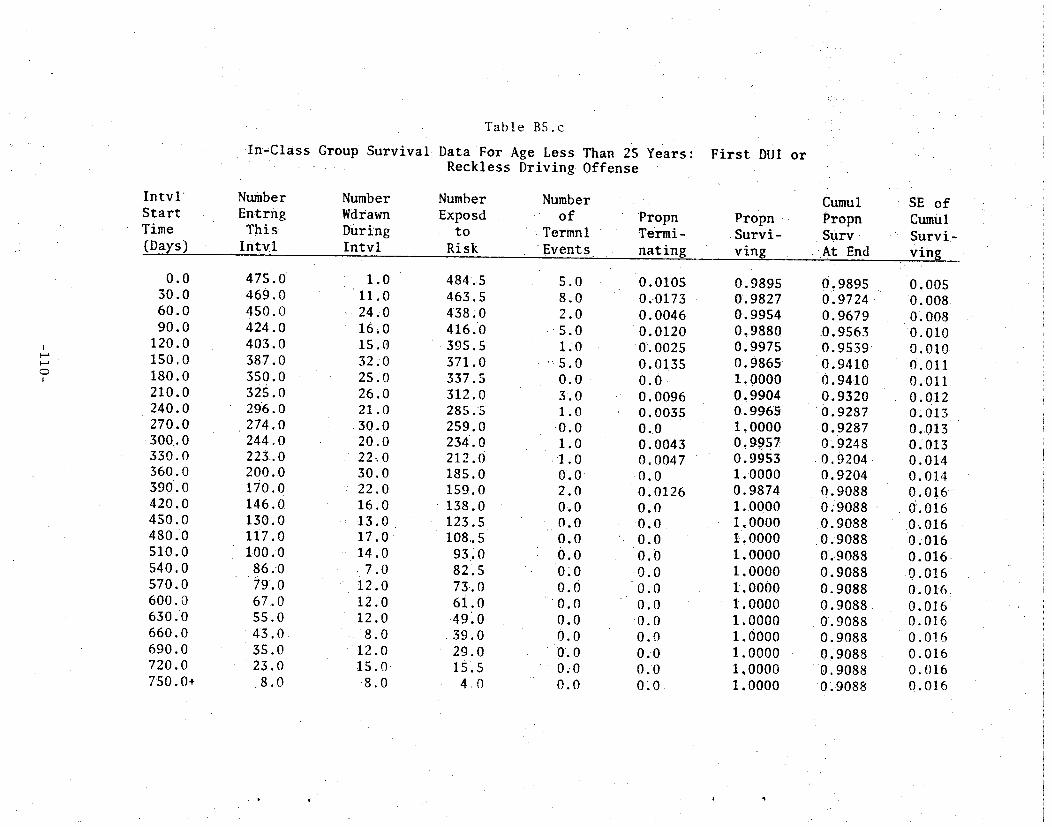
Intvl Start Time (Days)
Table B5.c
I n - C l a s s Group S u r v i v a l Data For Age Less Than 25 " RecklessDriving Offense
Years
Number Number Ent rng Wdrawn
T h i s During I n t ~ l I n t v l
Number Exposd
to Risk
Number of Propn
Termnl Termi- Events nating
First DUI
Propn Survi- ving
or
t
Cumul Propn Surv
A t End
SE of Cumul Survi- ving
I
I
0.0 30.0 60.0 90.0
120.0 150.0 180.0 210.0 240/0 270.0 300.0 330.0 360.0 390.0 420.0 450.0 480,0 510.0 540.0 570.0 600.0 630.0 660.0 690.0 720.0 750.0+
475.0 469.0
450.0 424.0 403.0 387.0 350.0 32s.o 296.0 274.0 244,0 223.0 20O.0 170.o 146,0 130.0 117.0 I00.0
86:0 79.0 67.0 55.0 43. O. 35.0 23,0 8 , 0
I.O 11.o 24.0 16,0 15.0 32;0 25.0 26.0 21.0 30.0 20.0 22,0 30.0 22.0 16.0
• 1 3 . 0
17.0 14.0 7 . 0 12.0 12.0 12.0 8 . 0
1 2 . 0 15.0 8.0
484.5 463.5 438;0 416.0 395.5 371.0 337.5 312.0 285 S
259 0 2 3 4 0 212 0 185 0 1590 138.0 123.5
1 0 8 . 5 93.0 82.5 73..0 6 i . 0 .49;0
3 9 . 0 29.0 15;5 4 0
5 . 0 8 . 0 2.0
5 . 0 1,0
• ' 5 . 0
0 . 0 3.0 1.0
.0 .0 1.0
. 1 . 0
0 . 0 2.0 0~0 0.0
0 . 0 0.0
"0.0 0.0
0 . 0 0.0 0.0 "0 ~. 0
0;0 0.0
0.0105 0,0173 0. 0046 0.0120
O. 0025 0.0135 0 . 0 0. 0096 0.0035 0.0 0.0043 0.0047 0.0 0.0126 0.0 0 . 0 0,0 0.0
0 . 0 0 . 0 0.0 0 . 0 0.0 0.0 o;o 0 ; 0
0.9895 0.9827 0.9954 0,9880 0.9975 0,9865 1,0000 0,9904 01.9965 1,0000 0,9957 0.9953 1,0000 0.9874 1.0000 1,0000 1;0000 1.0000 1,0000 1.oo0o 1.0000 1,0000 1.0000 1.0000 1,0000 1,0000
0.9895 0.9724 0.9679 10.9563 0.9539 0.9410 0.9410 0.9320 0.9287
0 . 9 2 8 7 0,9248 0 . 9 2 0 4 O, 9204 0.9088 0;9088 0.9088 0.9088 0.9088 0,9088 0.9088 0 . 9 0 8 8 0.9088 0.9088
0,9088 0,9088 0;9088
i > .
O,OOS 0 ,008 O, OO8 0.010 0,010 0,011 0,.011 O, 012 0,013 0,013 0.:013 0.014 0.014 0.016 0.016 0L016 0.016 0.016 .0.016 O. 016 0.016 0.016 0.016 0.016 0.016 0.016

) l I ~"
I
I
Table BS.d
Comparison o f F i r s t O f f e n d e r T rea tmen t Groups For Age L e s s T h a n .25 Years , t h e Lee-Desu S t a t i s t i c : . F i r s t DUI or Reck les s Dr iv ing Of f en s e
Ove ra l l Comparison
Group Name
C o n t r o l ltome S t u d y I n - C l a s s
P a i r w i s e Comparison
Group Name
Control Home Study
Pairwise Comparison
Group Name
Control In-Class
Pairwise Comparison
Group Name
Home Study In-Class
S t a t i s t i c
To t a l N
475 484 475
Statistic
Total N
475 484
Statistic
Total N
475 475
Statistic
Total N
484 475
0.128
Uncen
35 38 34
0.091
Uncen
35 38
0.000
Uncen
35 34
0.098
Uncen
38 34
D. F.
Cen
44O 446 441
D.F.
Cen
440 446
D.F.
Cen
440 441
D.F.
Cen
446 44!
2 Prob.
Pct Cen
92.63 9 2 . 1 5 92.84
1 Prob.
Pct Cen
92.63 92.15
1 Prob.
Pet Cen
92.63 92.84
1 Prob.
Pct Cen
92.15 92.84
Using
0.9382, NS
Mean Score
'2.1368 -4 .2810
2.2253
0.7628, NS
Mean Score
2 . 1 3 8 9 -2 .0992
0.9998, NS
Mean Score
-0.21053E-02 0.21053E-02
0.7540i NS
Mean Score
-2.1818 2.2232

i'J
Intvl Start Time (Days)
0.0 30 .0 6O.O 90.0
120.0 150.0 180.0 210.0 240.0 270.0 300.0 3 3 0 . 0 360 .0 390 .0 420.0 450:0 480 .0 510.0 540.0 570.0 600.0 630 .0 6 6 0 . 0 690 .0 720: 0 750.0+
Tab le B6.a
C o n t r o l G r o u p Survival Data for Age Less Than 25 • First Moving Violation or Any A/R Offense
Number E n t r n g This Intvl
Number Number Wdrawn Exposd
D u r i n g t o Intvl Risk
Number of
Ternml • E vent s
Propn Termi -
N a t ing 475.O 450.0 420.0 401.0 375 .0 353.0 308 .0 281 .0 248.0 217.0 196.0 177.0 152:0
" 134.0 16.0 98.0 80.0 68 .0 58 .0 46.0 38.0 32. o 22..0 13:0 10;0 4 . 0
5 . 0 16 .0 I 0 . 0 16 .0 9 . 0 39 .0 i 9 . 0 29.0 25 ,0 19 .0
1 6 . 0 21 .0 1 8 . 0 17 .0 1 7 . 0 17 .0 12 .0
8 .0 12 .0
8 .0 6 .0
I0.0 9 . 0 3 . 0 6 . 0 4~0
472 .5 442 .0 415.0 395.0 370 .5 3 3 3 . 5 298 ,5 266 .5
235,5 207.5 188.0 166.5 143.0 125.5 107.5 89.5 74.0 64.0 52.0 42.0 35.0 27.0 17.5 Ii .5 7.0 2.0
20.0 14.0 9.0
I0.0 1 3 . 0
6 .0 8.0 4.0 6.0 2.0 3.0 4io• 0.O I.O I.O 1.0 0.0 2.0 0.0 0.0 0.0 O. 0 0.0 0.0 0.0 0.0
0 . 0 4 2 3 0 .0317 0.0217 0.0254 0.0351 0.0180
0 . 0 2 6 8 oTo15o 0.O255 0.0096 0,0160 0.0240 0.0 0.0080
0.0093 0.0112 0.0
0.0313 0.0 0.0 0.0 0.0
0 .0 0.0 0.0 0.0
Years :
Propn Survi- ving 0.9577 0.9683 0.9783 0.9746 0.9649 0.9820 0.9732 0.9850 0.9745 0.9904 0.9840
Cumul Propn Surv At End
0 1 0 0
0 I
0 I 1 1 1 1 I
1 1
0.9577 0 . 9 2 7 3
0 .9072 0 . 8 8 4 1 0 . 8 5 3 1 0 .8378 0.8153 0.8031 0 .7826 0 .7751 0 .7627
.9760 0.7444 • 0000 .9920 .9907 .9888 .0000
.9688
.0000
• 0000
.0000
.0000
.0000
.0000
.0000
.0000
O. 7444 0 .7385
• 0 .7316 O. 7234 0 . 7 2 3 4 0 .7008 O. 7008 O. 7008 O. 70O8 0 .7008
0 . 7 0 0 8 0.7OO8 O.7OO8 0 .7008
SE ~of Cumul Surv- i v i n g 0.009 0.012 0.013 0.015 0.017 0.018 0.019 0. 020 0.021 0.021 0.022 0 .023 O. 023 O. 024 O.O25 O. 026 O. 026 0.029 0.029 0,029 0.029 o o29 0. 029 O. 029 0. 029 0. 029
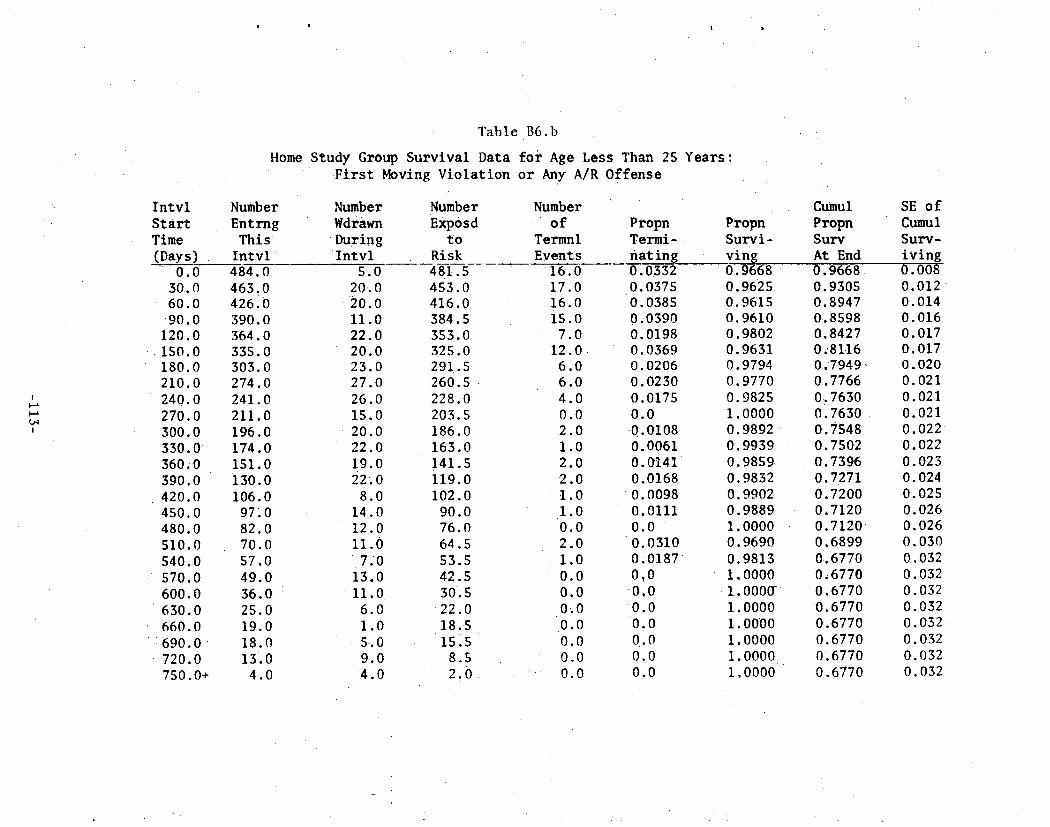
I • t ;
% .
I
V - J
I
I n t v l S t a r t Time (Days)
0 . 0 3 0 . 0 60 .0
9 0 . 0 120.0 150.0 180.0 210.0 240.0 270.0 300.0 3 3 0 . 0 360.0 390.0 420.0 450 .0 480.0 510.0 540.0 570.0 600.0 630 .0 660.0 690.0 720.0 750. O+
Tab le B6.b
Home Study Group S u r v i v a l Data f o r Age Less Than 25 Yea r s : • F i r s t Moving V i o l a t i o n o r Any A/R O f f e n s e
Number Number Number Entrng Wdrawn Exposd This During to
I n t v l I n t v l Risk
Number o f
Termnl Events
Propn Termi nat ing
Propn S u r v i - v ing 0,9668 484.0
463.0 42610 390.0 364.0 335.0 303.0 274.0 241.0 211.o 196.0 174.0 151.0 130.0 106.0
97 .0 82.0 70.0 57 .0 49 .0 36.0 25.0 19.0 18.0 13.0 4.0
5.0 20.0 20.0 I I .0 22 .0 20 .0 25 .0 27 .0 26 .0 • 15.0 20.0 22 .0 19.0 22 .0
8 . 0 14.0 12.0 I I .0 7 . 0 13.0 11.0 6.0 1.0 5.0 9.0 4.0
481.5 453.0 416.0 384.5 353;0 325.0 291.5 260.5 228 .0 203.5 186.0 163.0 141.5 119.0 102.0 90.0 76.0 64.5 53.5 42.5 30.5 22.0 18.5 15.5
8.5 2.0
16.0 17.0 16.0 15.0 7.0
12.0 6.0 6.0 4.0 0.0 2.0 1.0 2.0 2.0 1.0 1.0 0.0 2.0 1.0 0.0 0.0 0.0 0.0 0.0 0.0 0.0
O. 0352 O. 0375 O. 0385 0 .0390 0.0198 O. 0369 0 .0206 O. 0230 0.0175 0 .0 0 . 0 1 0 8 O. 0061 0.0141 0.0168 O. 0098 0.0111 0 . 0 O. 0310 0.0187 0,0 0 , 0 0 . 0 •0.0 0 . 0 0,0 0,0
0;9625 0.9615 0.9610 0.9802 0.9631 0.9794 0 .9770 0.9825 1.0000 0.9892 ' 0 .9939 0 .9859 0.9832 0.9902 0 .9889 1,0000 0.9690 0.9813 1,0000 1 . 0 0 0 f f 1 .0000 1.0000 1.0000 1.0000 1.0000
cum ul P r o p n Surv At End 0.9668 0.93.05 0.894.7 0.8598 0.8427 0.;81.16 0.7949, 0,7766 0.7630 0.7630 0 . 7 5 4 8 0.7502 0.7396 0.7271 0 .7200 0,7120 0 . 7 1 2 0 0 .6899 01.6770 0 ,6770 0 .6770 0 . 6 7 7 0 0 .6770 0 .6770 0 .6770 0 .6770
SE o f Cumul S u r v - i v i n g O. 008 0.012 0 014 0 016 0,017 0 017 0 020 0 021 0 021 0.021 0 . 0 2 2 0.022 O. 023 O. 024 0 .025 0 .026 0 .026 0 .030 O. 032 0 .032 0 .032 0 .032 O. 032 0 .032 0.032 0 .032

#
I
Intvl Start Time (Days} 0.0 30.0 60 .0 90.0
120.0 150.0 180.0 210.0 240.0 270.0 300.0 330.0 360.0 390.0 420.0 450.0 480 .0 510.0 540.0 570.0 600 .0 630. 0 660 .0 690 .0 72O.0 750. O+
Number Entrng This intvl :
Tab le
I n - C l a s s Group S u r v i v a l Data F i r s t Moving
Number Wdrawn During I n t v l
475.0 454.0 425 .0 391.0 363.0 336.0 298.0 271.0
2 4 2 . 0 220.0 191 .0 171.0 149 .0 119.0 100.0 88.0 77.0 64.0 52..0 46.0 38.0 30.0 21 .0 I 6 . 0
9 .0 3 . 0
1.0 :11.0 24.0 16.0 15.0 31.0 25 .0 " 23.0 17.0 27 .0 18 .0 20.0 26.0 17.0 12 .0 1 1 . 0 13 .0 11.0 4 . 0 8. 0 8.0 9.0 5.0 7.0 6.0 3."0
B6.C
For Age Less Than 25 Years : V i o l a t i o n o r Any A/R O f f e n s e
Number Number ' Expos d o f ' Propn
t o Te~mnl Te rmi - Risk E v e n t s n a t i n g
20 .0 18 .0 10.0 12.o 12.0 7.0 4.0 6.0 5.0 2.0 2.0 2.0 4.0 2.0 0.0 0.0 o.oi I ~o 2.0 0 .0 0~0
0 . 0 0 .0 0 . 0 0 . 0 0 .0
0 .0421 0 .0401 0 .0242
0 . 0 3 1 3 ' 0 :0338
0.0218 0..0140 0.0231 0 .0214 0 . 0 0 9 7 0 . 0 1 1 0 0.0124 0,0294 0.0181 0.0
i0.0 0,0 0.0171 0.0400 0.0 0.0 0.0 0.0 0.0 0.0 0;0
474.5 448.5 413.0 383.0 355.5 320.5 286.5 259.5 233.5 206.5 182.0 161.0 156 .0 110. S •94.0 82.5 70 .5 58.5 50 .0 42 .0 34.0 25 .5- 18.5 12. S 6.0
- i .5
Propn Su rv i - r i n g 0 .9579 0 .9599 0 .9758 0 . 9 6 8 7 0.9662 0.9782 0 .9860 0 .9769 0 .9786 0 .9903 0 ; 9 8 9 0 0 ,9876 0 . 9 7 0 6 0.9819 1 .0000 1.0000 1.0000 0 .9829 0 .9600 1.0ooo 1.0000 I.OOOO 1.0ooo 1.0000 1.0000 1.0000
i".
/ - i
Cumul P r o p n Surv
A t End
SE o f Cumul Surv- iving
0.9579 0 .9194 0;8971
• :0.8690 O. 8397 0.8214 O. 8099
0 . 7 9 1 2 0. 7742
0 . 7 6 6 7 0.7583 0. 7489 0.7269 0 . 7 1 3 7 0 .7137 0.7137
0 , 7 1 3 7 0 . 7 0 1 5
0 . 6 7 3 4 0.6734
-0.6734 0,6734
0 .6734 0.6734 O. 6734
• ~ 0 . 6 7 3 4
0.009 0.013 O. 014 0..016 0.017 0.018 0.019 O. 020 0.021 0.021 0.022 0.023 O. 02~ 0 ~ 026 O. 026 O. 026 0.026 O. 028 0.033 0.033 0.033 O. 033 01;033 0.033 0.033 0.033
6 '
. . . : . . .
" !
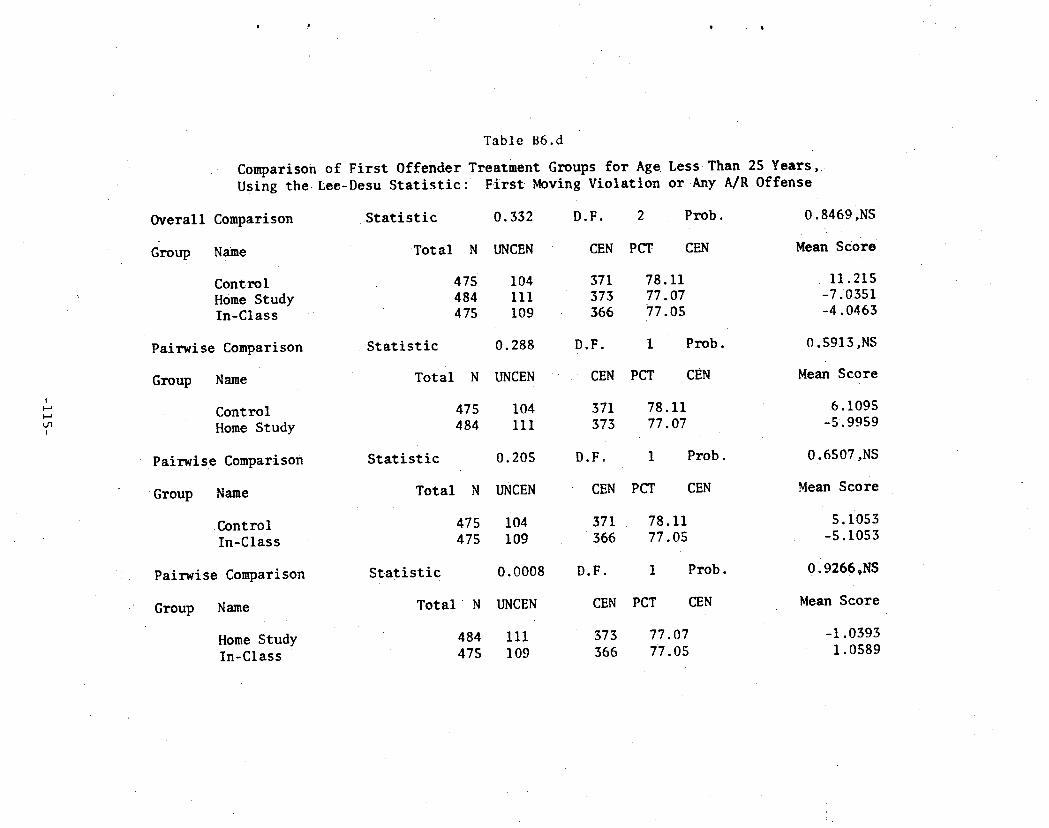
D s |
t , q
Tab le B6.d
Comparison o f F i r s t O f f e n d e r T r e a t m e n t Groups f o r Age L e s s T h a n 25 Y e a r s , . Us ing t h e hee-Desu S t a t i s t i c : F i r s t Moving V i o l a t i o n o r Any A/R O f f e n s e
O v e r a l l Compar ison
Group Name
Control Home S tudy I n - C l a s s
Statistic 0.332
T o t a l N UNCEN
475 104 • 484 111 475 109
D.F.
CEN
371 373 366
2 Prob.
PCT CEN
78.11 77.07 77.05
0.8469 ,NS
Mean S c o r e
11.215 -7 .O351 -4 . 0463
Pairwise Compar ison
Group Name
Control Home Study
Pairwise Comparison
Group Name
C o n t r o l I n - C l a s s
Pairwise Comparison
S t a t i s t i c 0 .288
T o t a l N UNCEN
475 104 484 iii
Statistic 0.205
Total N UNCEN
475 104 475 109
Statistic 0.0008
D.F. 1 Prob.
CEN PCT CEN
371 78.11 373 77.07
D.F. 1 P rob .
CEN PCT CEN
371 78.11 366 77.05
D.F. 1 Prob.
0.5913.NS
Mean Score
6.1095 -5.9959
0.6507,NS
Mean Score
5.1053 -5.1053
0.9266,NS
Group Name
Home Study In-Class
T o t a l N UNCEN
484 IIi 475 109
CEN PCT CEN
373 77.07 366 77.05
Mean Sco re
-1.0393 1.0589

%:
Intvl Start Time (Days)
C o n t r o l Group
Number E n t r n g T h i s In>w1
T a b l e B7.a .
Survival Data For Age
Number Number Wdrawn Exposd During t o I n t v l R i sk
25 Years o r
Number o f
Termnl , . E v e n t s
O l d e r : First
Propn Termi- nating
A c c i d e n t
P r o p n S u r v i - v i n g
,f.
. - . . Cumul • Propn "
:Surv At End
SE of Cumul Survi- ving
1
I
0.0 30.0
6 0 . 0 90.0
120.0 150.0 180:0 210.0 240.0 270.0 300 .0 330 .0 3 6 0 . 0 390 .0 420.0 450.0 480.0 510.0 540.0 570.0 600.0 630.0 660.0 69O. 0 72O.0 750.0+
795.0 782.0 750.0 720.0 686.0 644.0 595.0 541.0 476.0 427.0 394;0 356.0 328;0 283.0 245.0 218.0 190.0 161.0 139~0 1 1 5 . 0
91 .0 73.0 61.0 44.0 30.0
8.01
8.0 28.0 25.0 29.0 37.0 42.0 50.0 63.0 46.0 31.0 35.0 27.0 42 .0 37.0 24.0 26.0 28.0 21.0 24.0 24 .0 18.0 12.0 17.0 14.0 22.0 8.0
79110 768;0 737.5 705.5 667.5 623.0 570.0 509 .5 4 5 3 . 0 411.5 376.5 342 .5 307.0 264.5 233.0 205.0 176.0 150.5 127.0 103.0
8 2 . 0 6 7 . 0 52 .5 37 .0 19 .0 . 4 . 0
5.0 4.0 5.0 5.0 5 .0 7 . 0 4.0 2 .0 3.0 2.0 3.0 1.0 3.0 1 . 0 3.0 2.0 1.0 1 . 0 0.0 0.0 0.0 0.0 0.0 0 . 0 O. 0 O. 0
O. 0063 0;0052 O. 0068 0 . 0 0 7 1 O. 0075 0 .0112 0 .0070 0.0039 O. 0066 0.0049 O. 0080 0.0029 0.0098 0.0038 0.0129 O. 0098 0.0057 O. 0066 0 .0 0 .0 0 .0 0 . 0 0 . 0 0 .0 0 .0 0 .0
0.9937 0.9948 0 . 9 9 3 2 0 . 9 9 2 9 0.9925 0.9888 0 .9930 0.9961 0.9934 0 . 9 9 5 1
0 . 9 9 2 0 0.9971 0 .9902 0.9962 0.9871 0 . 9 9 0 2 0 .9943 0 .9934 1 .0000 1 .0000 1 .0000 1 .0000 1 .0000 1 .0000 1 .0000 1 .0000
8
. ' . . - .
, 0.9937 0:9885
' :0:9818 0:9748
0 , 9 6 7 5 0.9567 0.9500
0 .9462 0.9400
-0 .9354 0 . 9 2 7 9 "0.9252 0.9162 0.9127 0...9010 0.-8922
:.0.8871 0 . 8 8 1 2
0,8812 .<
0.8812 0 .8812
0 . 8 8 1 2 , 0 . 8 8 1 2 0 . 8 8 1 2
0 : 8 8 1 2 5"0. 8812
i i
2[
0.003 O. 004 0 .005 O. 006 O. 007 0.008 0 .008 0 .009 0 .009 0.010 0.011 0,011 0.012 0.012 0.014 0.015 0 .016 O. 017 0 .017 0.017 0 .017 0 .017
0 . 0 1 7 0 . 0 i 7 0 .017 0.017

| J • •
T a b l e B7. b
Home S t u d y Group S u r v i v a l Data For Age 25 Years o r O l d e r :
Intvl Number Number Number Number Start Entrng Wdrawn Exposd of Time This During to Termnl (Days) I n t v l I n t v l Risk Events
Propn Termi- nating
First A c c i d e n t
Propn Survi- ving
Cumul Propn Surv At End
SE of Cumul Survi- ving
I l - a
---d
I
0 . 0 3 0 . 0
60 .0 90 .0
120.0 1 5 0 . 0 180.0 210.0 240.0 270.0 300.0 330.0 360.0 390.0 420.0 450.0 480.0 510.0 540.0 570.0 600.0 630.0 660.0 690.0 72,0:0 750,0+
825,0 815.0 7 8 2 . 0 747.0 710.0 674.0 624.0 567.0 515 .0 473 .0 434.0 404 .0 363.0 317.0 271.0 242.0 222.0 187.0 1 6 4 . 0 136.0 106.0
75 .0 61 .0 43.0 30.0 7.0
7.0 821.5 2 3 . 0 803.5 27 .0 768.S 33 .0 730.5 34..0 693 .0 42 .0 653 .0 56 .0 596.0 49 .0 542.5 41 .0 494 .5 36 .0 455 .0 29 .0 419.5 36 .0 386.0 46 .0 340.0 42 .0 296.0 29 .0 256.5 19 .0 232.5 33 .0 2 0 5 . 5 22 .0 176.0 28.0 150.0 30 .0 121.0 31 .0 90 .5 1 4 . 0 68 .0 18.0 52 .0 13.0 36 .5 23.0 18.5
7 .0 3 .5
3 .0 10.0
8 .0 4'.0 2.0 8 .0 1 .0 3 .0
1 . 0 3 .0 1 .0 5 .0
0 . 0 4 .0 0 .0 1 .0 2 .0 1 .0 0 .0 0 .0 0 .0 0 .0 0 .0 0 .0 0 .0 0 .0
0 .0037 0 .0124 0.0104 0 .0055 0 .0029 0 .0123 0 .0017 0.0055 0 .0020 0. 0066 0.0024 0.0130 0.0 0.0135 0.0 0.0043 O. 0097 O. 0057 0 :0 0 .0 0 . 0 0 .0 0 . 0 0 .0 0 .0 0 .0
0.9963 0.9876 0.9896 0.9945 0.9971 0.9877 0.9983 0.9945 0.9980 0.9934 0.9976 0.9870 1.0000 0.9865 1 0000 0 9957 0 9903 0 9943 I 0000 I 0000 1 0000 I 0000' 1 0000 1 0000 1 0000 1 0000
0 .9963 0 .9839 0 .9737 0.9684 0 .9656 0.9537 0.9521 O.9469 0 .9450 0 .9387 0 .9565 0 .9244 0.9244 0 .9119 0 .9119 0 .9080 0.8991 0 .8940 0 .8940 0 .8940 0 .8940 0 .8940 0 .8940 0 .8940 0 .8940 0 .8940
O. 002 0 .004 O. 0O6 0.006 O. 007 0.008 O. O08 O. 008 0 .009 O. 009 O. 009 0.011 0.011 0.012 0 .012 0.013 0.014 0.015 0.015 0 .015 0 .015 0.015 0.015 0 .015 0 .015 0.015

I n t v l S t a r t T i m e (Days)
I n - C l a s s
Number E n t r n g T h i s
I n t v l
T a b l e B7.c
Group Su rv iva l Data For Age 25 Years
Number Wdrawn 'During Intvl
Number Exposd
t o R i sk
Number of
Termnl Events
or O l d e r :
Propn : Termi- nating
First A c c i d e n t -
Cumul Propn Propn Survi- Surv ving At End
SE of Cumul Survi- ving
b-a
O0 I
.0 3 0 . 0 60 .0 90 .0
1 2 0 . 0 150.0 180.0
2 1 0 . 0 240 .0 270.O 300.0 330 .0 3 6 0 . 0 390.0 420.0 450.0 480.0 510.0 540.0 570.0 600 .0 630 .0 660.0 690.0 72O.O 750.0+
811.0 800.0 774 .0 743.0 720.0 673.0 619.0 569.0
509~0 451.0 415.0 375.0 352.0 300.0 268.0 240.0 214.0 187.0 169.0 147,0 116.0
97.0 74.0 55.0 38 .0 15 .0
4 . 0 24 ;0 27.0
2 1 . 0 44 .0 5 1 . 0 46.0 58,0 56 .0 29.0 37.0 21.0 49.0 30.0 28.0 24.0 27.0
~18.0 : 2 2 . 0
31 .0 19.0 23.0 19.0 17.0
2 3 . 0 15.0
809,0 788.0 760.5 732.5 698.0 647..5 596.0 s4o~o 481.0 436.5 396.5 364.5 327.5 285.0 254.0 228.0 200.5 178 .0 158 .0 131.5 106.5 85.5 64.5 46;5 26.5 7:5
7 .0 2 .0 4 .0 2 .0 3.O 3 .0 4 . 0 2 .0
2 . 0 :7 .0 3 .0 2 .0 3 . 0 2 .0 0 .0
2 . 0 O.0 0 .0 • 0 .0
:0 .0 0 . O 0 .0 0 .0 0 .0 0 .0 0 .0
,0.0087 0.0025 O. 0053 O. 0027 O. 0043 O. 0046
• O. 0067 O. 0037: 0.0042 O. 0160 0.0076 0;0055
O. 0092 .... 0.0070
0 . 0 :0 . 0088
0.0 0 . 0 0.0 0.0
0 . 0 0.0 0.0 0.0 0.0 0.0
0.9913 0.9975 0.9947 0.9973 0.9957 0.9954 0.9933 0.9963 0,9958 0.9840 0..9924 0 .9945 0 .9908 0 .9930 1 .0000 0 .9912 1 .0000 1 .0000 1 .0000 1.0000 1 .0000 1 .000o 1 .0000 1.0000 1.0000 1.0000
0:9913 0:9888
0;9836 0..9809 0 : 9 7 6 7 0.97,22 0.9657 0,9621 0.9581 09427 0.9356 0.93os 0~9219 0;9155 0.9155 0 .9074
0 . 9 O 7 4 .... 0 ,9074
0~9074 0,9074
0" .9074 0.9074 0.907'4 0.9074 0.9074 O~ 9074
O. 003 0. 004 O. 005 0 .005 0 .005 O. 006 O. 007 O. 007 O. 008 0 .010 0 .010 0.011 0 .012 0 .013 0 .013 0 .014 0 . 0 1 4 0 . 0 1 4 0.014 0. 0 1 4 0 .014 0;014 0.014 0.014 0 . 0 1 4 0.014

) J • •
Tab le B7.d
Comparison o f F i r s t O f f e n d e r Trea tment Groups For Age 25 Years or .Older, Using The Lee-Desu S t a t i s t i c : F i r s t Acc iden t
|
tO !
O v e r a l l Comparison S t a t i s t i c 1.440
Group Name T o t a l N Uncen-
Control 795 57 Home Study 825 57 In-Class 811 48
Pairwise Comparison Statistic 0.007
Group Name Total N Uncen
Control 795 57 Home Study 825 57
Pairwise Comparison Statistic 1.243
Group Name Total N Uncen
Control 795 57 In-Class 811 48
Pairwise Comparison Statistic 0.995
Group Name T o t a l N Uncen
Home Study 825 57 In-Class 811 48
D.F. 2 Prob.
Cen Pct Cen
738 92.83 768 93.09 763 94.08
D.F 1 Prob.
Cen Pct Cen
738 92.83 768 93.09
D.F 1 Prob .
Cen Pct Cen
738 92.83 763 94.08
D,F. 1 Prob .
Cen Pct Cen
768 93.09 763 94.08
0 .4868 , NS
Mean Score
-9 .1862 -7 .0085 16.134
0.9344, NS
Mean Score
= 0 . 6 7 5 4 7 0.65091
0 .2648 , NS
Mean Score
-8 .5107 8.3428
0 .3186 , NS
Mean Score
- 7 . 6 5 9 4 7 .7916
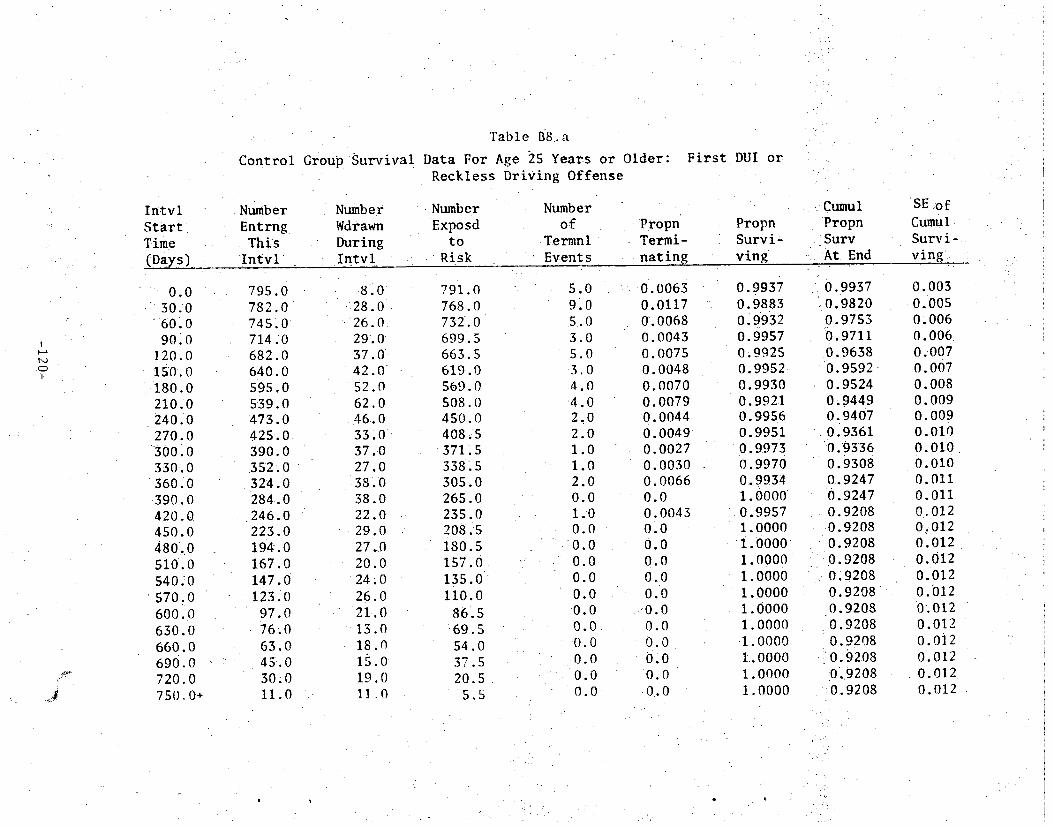
I
• 0
I n t v l S t a r t Time ( D a y s )
0.0 " 30 .0 60. o
9o o 120.0 150.0 180.0 210.0 240.0 270.0
3oo. o 330,0 360.0 3 9 0 . 0 420 .0 450 .0 480 .0 510.0 540 i O 570.0 600.0 630.0 660.0 690.0 720.0 750.0+
Con t r o l
Number Entrng This
Intvl
795.0 78.2.0 745.0 71410 682.0 640.0 595.0 539.0 473.0 4 2 5 . 0 390.0 352 .0 324.0 284.0
2 4 6 . 0 223.0 194.0 167.0 147.0 123~0
97.O 7 6 ; 0
63.0 45.0 30;0 1i.o
|
Table B8.a
Group S u r v i v a l Data For Age 25 Years or Older : Reck l e s s Dr iv ing Of f ense
Number Wdrawn During Intv!,
Number Exposd
t o
Risk
Number of
Termnl Events
8~0: : 2 8 . 0 ' 2 6 . 0 2 9 . 0 3 7 . 0 42,07 52.0 62.0 46 .0 3 3 . 0 37.0 27.0 38.0 38.0 22.0
2 9 . 0 27~0 20.0
2 4 . 0 26 .0
2 1 . 0 • 1 3 . 0
18.o is .o 19.0 11.0
791.0 768.0 732.0 699.5 663.5 619.0 569.0 508.0 450.0 408J5 371:5 338:5 305.0 265.0 235.0 208.5 1 8 0 . 5 1 5 7 . 0 1 3 5 . 0 110.0 86.5 ~69.5 54.0 37.5 2 0 . 5
5 . 5
5.0 9.0 5 . 0 3.0 5.0 :3.0 4.0 4 . 0 2~0 2.0 1.0 1.0 2 .0 0 .0 1 .0 0 .0 0 .0
~ ' - 0 . 0 0 .0
0 . 0 0 . 0 0 . 0 0 . 0
' 0 .0 " 0 .0
" 0 . 0
. . :~.
F i r s t
Propn T e r m i - n a t i n g
DUI or
Propn S u r v i - v i n g
Cumul Propn Surv At End
O. 0063 0.0117 0.0068 0.0043 0.0075 O. 0048 0.0070 0.0079 O. 0044 O. 0049 O. 0027 0.0030 O. 0066 0.0
0 . 0 0 4 3 0 ,0 0 .0
0 . 0 0 .0 OLO
' 0 . 0 0 .0 0 .0
' 0 . 0
0 .0 0 .0
0.9937 0.9883 0.9932 0.9957 0.9925 0.9952 0.9930 0.992.1 0.9956 0.9951 0.9973 0.9970 0.9934 1.0000 0.9957 1.0000 1.0000 1.0000 1.0000 1.0000 1.0000 1.0000 1 .0000 1.0000 1 .0000 1 .0000
0.9937 0.9820 0.9753 0.9711 0.9638 0 . 9 5 9 2 0.9524 0.9449 0.9407 0.9361 0.9336 0.9308 0.9247 0,9247 0.9208 0.9208 0.9208 0.9208 0~9208 0.9208 0.9208 0.9208 0.9208
0 . 9 2 0 8 0.9208 0 .9208
SE o f Cumu 1 S u r v i - v i n g .
0.003 O. 005 0 : 006 O. 006 O. 007 O. 007 0.008 O. 009 0.009 0.010 0.010 0.010 0.011 0.011 0..012 o,o12 0.012 0.012 0.012 0.012 0. 012 0.012 0.012 0.012 0.012 0.012
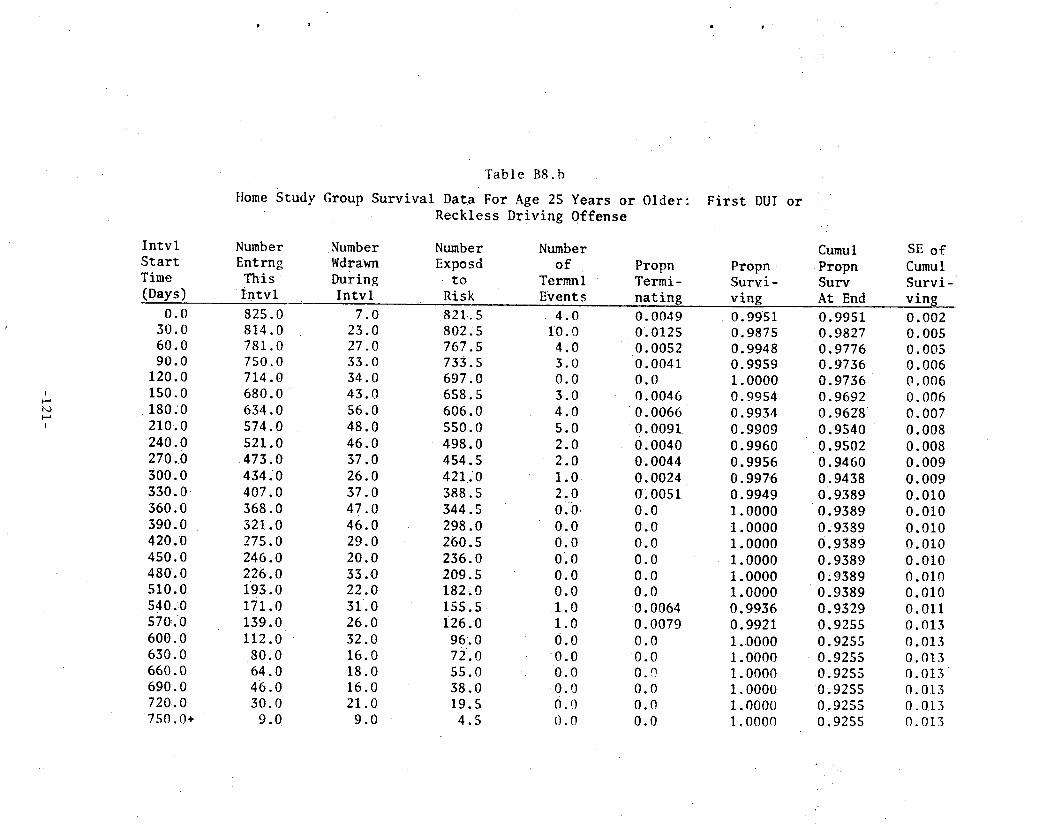
I n t v l S t a r t Time (Days)
Home
Table B8.b
S tudy Group S u r v i v a l Da ta For Age 25 Years o r O l d e r : R e c k l e s s D r i v i n g O f f e n s e
Number Entrng This ~ intvl
Number Number Number Wdrawn Exposd o f Dur ing to .Termni I n t v l Risk E V e n t s
Propn Termi- nating
F i r s t DUI
Propn Survi- ving
or
i . L
Cumul Propn Surv At End
SE o f Cumul S u r v i - v i n g
I
I
0 .0 30 .0 60 .0 90 .0
120.0 150.0 180:0 210.0 2 4 0 . 0 270.0 300.0 3 3 o . o 360.0 590.0 420.0 450.0 480.0 510.0
• 540:-0 570.0 600.0 630.0 660.0 690.0 720.0 750.0+
825.0 814 .0 781 .0 750 .0 714 .0 680 .0 634 .0 574 .0 521 .0 473 .0 434:0 407 .0 368 .0 321.0 275.0 246.0 226.0 193.0 171.0 139.0 112.0 8 0 . 0 64.0 46.0 30.0
9.0
7.0 821.5 23.0 802:5 27.0 767.5 33.0 733.5 34.0 697.0 43.0 658.5 56.0 606.0 48.0 550.0 46.0 498.0 37.0 4S4.S 26.O 421:0 37.0 388.5 47.0 344.5 46.0 298..0 29.0 260.5 20.0 236.0 33.0 209.5 22;0 182.0 31.0 155.5 26.0 126.0 32.0 96.0 16.0 72 .0 18.0 55 .0 16.0 38 .0 21 .0 1 9 . 5
9.0 4.5
4 . 0 10.0 4.0 3.0 0.0 3.0 4.0 5.0 2.0
• 2.0 1.0 2.0 0.0, 0.0 0.0 0.0 0,0 0.0 1.0 1.0 0.0 0.0 0.0 0.0 0.0 0.0
O. 0049 O.OI2S 0.0052 0.0041 0.0 0. 0046 0. 0066 O. 0091 0.0040 O. 0044 O. 0024 O. 0051 0.0 0.0 0.0 0.0 0.0 0.0 O. 0064 0.0079 0.0
0 . 0 0.0 0.0 0.0 0.0
0.9951 0.987S 0.9948 0.9959 1.0000 0.9954 0.9934 0.9909 0.9960 0.9956 0.9976 0.9949 1.0000 1.0000 1.0000 1.0000 1.0000 1.0000 0.9936 0.9921 1.0000 1.0000 1.0000 1.0000 1.0000 1.000o
0.9951 0.9827 0.9776 0.9736 0.9736 0.9692 0.9628 • 0.9540 0.9502 0.9460 0.9438 0.9389 0.9389 0.9389 0.9389 0.9389 0;9389 0.9389 0.9329 0'.9255 0.9255 O.9255 0.9255 0.9255 0.9255 0.9255
0.002 0.005 O. 005 O. 006 0.006 0.006 0.007 0.008 0. 008 0.009 0.009 0.010 0.010 0.010 0.010 0.010 0.010 0.010 0.011 0.013 0.013 0.013 0.013 0.013 0.013 O. 013
- /

I n t v l Start Time (,Days)
In=Class G r o u p S u r v i v a l Reck le s s
Table B8.c
Data For Age'25 Years or Driv ing Of fense
Number Number Number Entrng Wdrawn Exposd
T h i s During t o I n t v l I n t v l - Risk
Number o f
Termnl Events
Older :
Propn T e r m i - :nat ing
First DUl-or
Propn S u r v i -
v i n g
Cumul :P roPn S u r v
At"End
SE o f Cumu! S u r v i - v i n g :
I N-a•
bO
I
0.0 3 0 . 0 60.0 90.0
120,0 150.0 180.0 210.0 240.0 270.0 300.0 330.0 360.0 390.0 420.0 450.0 480.0 510.0 540.0 570.0 600.0 630.0 660.0 690.0 720.0 750.0+
811.0 802.0 773.0 743.0 716.0 670.0 6 1 4 , 0 564.0 505.0 448.0 416.0 377.0 354.0 308.0 272.0 244.0 220.0 190.0 172.0 148.0 117.0 95 :0 71.0
:53.0 36.0 14.0
4 . 0 24.0 27 0 21.0
43 0 53.0 46.0 59.0 55~0 30.0 37.0 21.0 45.0 36.0 28.0 24.0 29,0 1 7 . 0
• 24.0 3 1 . 0 22.0 24.0 18.0 17.0 22.0 14.0
. • ' . . ' . : : % . " L .
809.0 790.0 759.5 7 3 2 . 5 694. S 643.5 591.0 534.5 477.5 433.0 397..5 366.5 331.5 290.0 2 5 8 . 0 232.0 205 .S 181.5 160.0 132.5 106.'0
83.0 62.0 44i5
2 5 . 0 7.0
L ' , • • •
5.0 5.0 3.0 6.0 3.0 3.0 410 0.0 2.0 2.0 2.0 2.0 I .0 0 . 0 0.0 0.0
1 . 0 I .0 0.0
0 . 0 0.0 0.0 0.0 0 . 0 0.0 0.0
O. 0062 • 0. 0063 0.0039 0:0082
O. 0043 O. 0047 O. 0068 0 .0 O. 0042 O. 0046 O. 0050 0.0055 0.0030 0.0 0 . 0 •
0:0 O. 0049 O. 0055 0.0
: 0.0 0.0 0.0 0.0
0 . 0 0 . 0 0 . 0
g •
' . ' , "
0.9938 0.9937 0.9961 0.9918
0.9957 0.9953 0.9932 1.0000 0.9958 0.9954 0.9950 0.9945 0.9970 1.0000 i .0000 1;0000 0.9951 0.994S 1.0000 1.0000 1.0000 1.0000 1.0000 1.0000 1.0000
1.OfiO0
0 .9938 : 0 . 9 8 7 5
0.9836 0.9756
' :0 .9714 0 . 9 6 6 8
Q.9603 , 0.9603
,0.9563 0 , 9 5 1 8
••0•.9471 0.9419 0.9390
, 0 . 9 3 9 0 0 . 9 3 9 0 ,0.9390 •0.9345
;0 ,9293 0.9293 0.9293 0.9293 0.9293 O. 9293 0:9293
• 6.9293 O. 9293
7
0.003 0 .004 o,oos O. 006
0 . 0 0 6 O, 0O7 o. oo7 0,007 0 . 0 0 8 0.008 O. 009 0.010 o. o lo 0.010 0.010 0.010 0.011 o.012 0.012 0,012 0.012 0.012 0.012 0.012 0.012 0 .0 t2

I • 9
Table BS.d
Comparison of F i r s t Offender Treatment Groups For Age 25 Years or Older , U s i n g the Lee-Desu S t a t i s t i c : F i r s t DUI or Reckless Driving Of fense ,
. I
b O
!
Overal l Comparison"
Group Name ..
Control Home Study In-Class
Pa i rwise Comparison
Group Name
Control Home Study
Pai rwise Comparison
Grou p Name
Control In-Class
Pa i rwise Comparison
Group Name
Home Study In-Class
Statistic
Total N
795 825 Sll
Statistic
Total N
795 825
Statistic
Total N
795 811
Statistic
TotalN
825 811
1:323
U n c e n .
47 4 2 40
0.757
Uncen
47-. 42
1;150
Uncen
47 40
0 . 0 3 9
Uncen
42 40
D.F.
Cen
748 783 771
D.F.
Cen
748 783
D.F.
Cen
748 771
D.F.
Cen
785 771
2 Prob.
P c t C e n
9~.09 94 .9 i
9 5 . 0 7
1 Prob.
Pct Cen
94-.09 94,91
1 Prob.
Pet C e n
94 .09 95.07
1 Prob.
Pct Cen
94.91 95.07
0.5161, NS
Mean Score
' 14 .941 5 . I i 0 3 9.4476
0.3842, NS
Mean Score
:6.7849 6.5382
0.2835, NS
Mean Score
=8~ 1560 • 7. 9951
• 0.8439, NS
Mean• Score
-1.4279 1.4525

t O
I n t v l Start Time (Days) •
0 .0 30.0 60.0 90.0
120.0 150.0 180.0 210.0 240.0 270 .0 300, 0 330.0 360 .0 390.0 420.0 450.0 480.0 510.0 540.0 570 .0 60O. 0 630 .0 660; 0 690.0 720.0 750.0+
C o n t r o l Group S u r v i v a l F i r s t Moving
Table B9.a
Data For Age
Number E n t r n g
T h i s . I n t v i
Number " Wdrawn Dur ing Intvl
25 Years or O l d e r :
795 .0 .0
V i o l a t i o n or Any A/R Offense
Number o f
Termnl Event s
P r o p n T e r m i - ,~nat~ag
0 .0228
769 • 0
722.0 687.0 649;0 603.0 555.0 498.0 433.0 380.0 347 ; 0 310.0 281.0 240.0 205 .0 182 .0 158.0 1 3 2 . 0 1 1 3 . 0
93 .0 7 4 . 0 53.0 44.0 33 ..0 24.0
8.0
28.0 26.0 29.0 3 6 . 0 4 2 . 0 SO.O 5 8 . 0 46 .0 2 9 . 0 34.0 26.0 5 7 . 0 35 .0 22 .0 .24.0 26.0 18.0 20.0 19.0 19.0 i l .0 11.0 9.0
16.0 8.0
Number Exposd
t o Risk •
18 .0 0 .0252 0 .0127 0 .0134 0..0158 0 . 0 1 0 3 0 . 0 1 3 2 0 .0149 0 .0171
0 . 0 1 0 9 0 . 0 0 9 1 0 .0101 0 .0152 0.0• O. 0052 0 .0 0 .0 0.0081 0.0 0.0 0.0 0.0 0.0 0.0 0,O 0;0
7 9 1 0 755.0 709.0 672 .S 631.0
5 8 2 . 0 530.0 469.0 410.0 3 6 5 . 5 330~0 2 9 7 , 0 2 6 2 , 5 222 ,5 194.0 170.0 145.0 123.0 103.0
83 .5 64~5 49.5 38.5 28.5 16.0 4.0
19.0 9.0 9.0
I 0 . 0 6.0 7:0 7.0 7.0 4.0 3.0 3.0 4 . 0 0~0 1.0 0.0
0 . 0 1.0 0 . 0
0 ; 0 0 ,0 0 . 0 0.0 0.0 0.0 0.0
Propn . Survi- ving. 0.9772 0 .9748 0 .9873 0 . 9 8 6 6 0 .9842 0 .9897 0 .9868 0.9851 0 .9829
0 . 9 8 9 1 0 .9909 0~9899 0.9848 1. 0000 0.9948 1.0000 1.0000 0.9919 1.0000 1~0000 1.0000 1:0000 1.0000 1.0000 1.O000 10000
/ , ' . .
%. .
• i Cumul :p ropn
.... S u r v A% End
SE o f Cumul Surv = i v i n g
0 . 9 7 7 2 0 . 9 5 2 7 0.9406 o,,928o 0.9133 0.9038 0.8919 0 . 8 7 8 6
0 . 8 6 3 6 0 . 8 5 4 1
O. 8464 0 .8378 0 .8251 ~ 0;8251 0,8208 0 .8208 0.8208
0.8141 0.8141 0.8141
: 0. 8141 .~ " 0. 8141
O.8141 0.8141
i 0.8141 i 0 . 8141
0,O0s 0. 008 0. 009 0. 009 0.010 0.011 0.012 0. 013 0.014 0.014 0. 015 0.015 0.016 0.016 0.017 0.017 0.017 0.018 0.018 0.018 0.018 0.018 0.018 O. 018 0.018 0.018

" I " J •
intvi S t a r t Time. (Days)
Home
Number: E n t r n g
Thi s I n t v l
"Fable Bg.b
S t u d y g r o u p S u r v i v a l Data For Age 25 Years o r O lde r : F i r s t Moving V i o l a t i o n or Any A/R Offense
Number Wdrawn During Intvl
Number Exposd 'to
Risk
Number of Propn Termnl Termi- Events n a t i n g
Propn S u r v i - v ing
Cumul Propn Surv- At End
SE o f Cumu 1 Surv- iving
I
I ' 0 t a l
I.
0:0 30. o 60.0 90.0
120.0 150..0 1 8 0 . 0 2 1 0 . 0 2 4 0 . 0 270.0 300.0 330 .0 360.0 390.0 420.0 450..0 480.0 510.0 540.0 s7o.o 600.0 630.0 660.0 690.0 720.0 750, 0~,
825.0 807.0 262 .0 725 .0 682.0 639 .0 591.0 529.0 473.0 418.0 378.0 351;0 317.0 270.0 226 .0 199.0 180.0 .149.0 1 3 0 . 0 104.0 85.0
,59.0 47 .0 35.0 24.0
6.0
7.0 .
23.0 '27.0 32.0 34.0 42.0 54 .0
4 6 . 0 46.0 35.0 25.0 33.0 46..0 42.0 27,0 19.0 3 1 . 0 18.0 24.0 19.0 26.0 1 2 . 0 12.0 11.0 18.0
6.0
821.5 795.5 748.5 709:Q 665.0 618.0 564.0 506.0 450;0 400.5 375.5 334.5 294.0 249.0 212.5 189..5 164.5 140.0
1 1 8 . 0 94.5 72.0 53.0 41.0 29.5 15.0 3.0
I I .0 22.0 I 0 . 0 I i .0
9,0 6.0 8.0
i 0 . 0 9 . 0 5.0 2.0 1.0 i ; 0 2.0 0.0 0.0 0.0 1.0
2 . 0 0.0
0 . 0 0.0 0.0 0.0 0.0 0.0
0.0134 0.0277 0.0134
O. 0155 0 .0135 0..0097 •
0 . 0 1 4 2 0.0198 0.02OO 0.0125 O. 0055 0.0030 O. 0034 0.0080 0 . 0 0.0 0 . 0
O.0071 0.0169 0.0 0.O 0.0 0.0 0.0 0.0 0.0
0.9866 0.9723 0.9866 0.9845 0.9865 0.9903 0.9858 0.9802 0.9800 0.9875 0.9945 0.9970 0.9966 0.9920 1.0000 1.0000 1.0000 0.9929 0.9831 1.0000 1 .0000 LO000 1.0000 1.0000 1.0000 1.0000
0%9866 O. 9593 0.9465 0.9318 0.9192 0.9103 0.8974 0.8796 0.8620 0.8513 0.8466 0.8441 0.8412 0.8345 O. 8345 0.8345 0.8345 0.8285 0.8145 0.8145 0.8145 0.8145 0.8145 0.8145
•0:8145 0.g145
0.004 0.007 0. 008 0. 009 0.010 0.010 0.011 0.012 0.013 0.014 0.014 0.015 0.015 0.015 0.015 0.015 o.015 0.016 0.019 0 ..019 0.019 0.019 0.019 0.019 0.019 0.019

I b..a
t O (7",
I n t v l S t a r t T i m e (Days)
0.0 30 .0 60.0 90.0
120.0 150.0 180.0 210.0 240.0 270.0 300.0 330.0 360.0 390.0
4 2 0 . 0 450.0 •480.0 510.0 540.0 570.0 600 .0 630.0 660.0 6 9 0 . 0 720. o 750.0+
Tab le B9.c
I n - C l a s s G r o u p S u r v i v a l Data f o r Age 25 Years o r F i r s t Moving V i o l a t i o n o r Any A/R O f f e n s e
Number Number Number E n t r n g Wdrawn Exposd This Druing t o
• I n t v l . I n t v t Risk 811.0 788.0 749.0 714.0 679.0 624.0 563.0 509 .0 447.0 388.0 359 .0 321.0 302.0 257.0 221.0 196.0 173.0 145.0 129.0 110.0
85 .0 68 .0 47.0 34.0 24.0 8 . 0
Number o f Propn
Termnl Termi Event s n a t i ng
4 , 0 24.0 27,0 21.0 43.0 53 .0 4 5 . 0
5 8 . 0 53.0 26 .0 3 2 . 0 16 .0 41.0 33.0 24.0 22.0 26.0 15.0 19.0 24.0 17.0 21.0 13.0 10.0 16.0
8.0
809.0 776.0 735.5 703.5 657.5 597.5 540.5 480.0 420.5 375.0 343.0 313i0 281.5 240.5 209.0 185.0 160.0 137.5 119.5 98.0 76.5 57.s 40.5 29.0 16.0 4.0
19.0 15.0
8.0 14.0 12.0
8.0 9.0 4.0 6..0 3 . 0 6.0 3.0 4 .0 3.0 1.0 1.0 2.0 1.0 0.0 1.0 0.0 0.0 0.0 0.0 0.0 0;0
0.0235 0.0193 0.0109
• O. 0199 0.0183 0.0134 0,0167 O. 0083
• O. 0143 0.0080 0.0175 O. 0096 0.0142 0 .0125 0. 0048 O. 0054 0.0125 0.0073 0.0 0.0102 0 . 0 0.0 0,0 0 . 0 0.0 0.0
O l d e r :
P r o p n Survi- ving 0,9765 0.9807 0.9891 0.9801 0.9817 0~9866 0.9833 0.9917 0.9857 0.9920 0.9825 0.9904
0 .9858 0.9875 0.9952 0.9946 0.9875 0.9927 1.0000 0.9898 1.0000 1.0000 1.0000 1.0000 1.0000 1.0000
: Cumul - P r o p n
S u r v ' A t End
SE of Cumul Su rv - i v i n g
0.9765 O. 9576 O. 9472 O. 9284
0 . 9 1 1 4 0.8992 O. 884 3
0.8769 O. 8644 0.8575 0.8425 O. 8344 ~0.8225 0,8123
0 .8084 0.8040 0.7940 0.7882 O. 7882
• O. 7801 0.7801
0 .7801 0 .7801 0.7801 0.7801 0.7801
O. 005 0.007 O. 008 O. O09 0.010 0.011 0.012 0.012 0.01.3 0;014 0.015 0,015 0.016 0.017 0.017 0.018 0.019 O. 020 O. 020 O, 021 0.021 0.021 0.021 0.021 0.021 0.021

I
I x h
I
' r ab te B91d
Comparison ofFirst Offender Treatment Groups for Age 25 Years or Older, Using the Lee ,Desu S t a t i s t i c : F i r s t Moving V i o l a t i o n o r Any A/R O f f e n s e
.Group
Overal I Comparison
Group .Name "
Control Home Study In-Class
Pairwise Comparison
Group - Name "
Control Home Study
Pairwise Comparison
Name
C o n t r o l I n - C l a s s
Pairwise Comparison
S t a t i s t i c 0 .381
T o t a l N UNCEN
795 108 825 110 81i 120
S t a t i s t i c 0.152
Total- N UNCEN
795 108 825 110
S t a t i s t i c 0~047
Total N UNCEN
795 i08 811 120
Statistic 0.369
D , F .
CEN
687 715 691
D.F.
CEN
687 715
D.F.
CEN
687 691
D.F.
2 P r o b .
PCT
86.42 8 6 . 6 7
85.20
PCT L
8 6 . 4 2 86.67
PCT
. >
0.8266,NS
Mean Score
-2:o39o 11.573
-9.7744
Prob. 0.6966,NS
• Mean S C o r e
1 Prob .
-4 .6226
86 ,42 • 8 5 . 2 0
Prob .
4.4545
0.8277,NS
Mean S c o r e
2 . 5 8 3 6 -2 .5327
0.5436,NS
:Group N a m e ' •
Home Study I n - C l a s s
T o t a l N UNCEN
825 1 1 0 811 1 2 0
CEN
7 1 5 691
PCT
86.67 85.20
• M e a n S c o r e
7 .1188 -7 ;2417

I n t v l S t a r t Time (Days)
Control
Number Entrng This
I n t v l
Table BlO.n
Group Survival Data For Social Drinkers:
Number Wdrawn During Intvl
Number Number Exposd of
to- Termnl Risk Events
First Acc iden t
Propn Termi- nating
Propn Survi- ving
Cumul . ~ropn S u r v :At End
SE of • Cumu 1 Survi- ving
I - ' - '
r..,-o I
0.0 30.0 60.0 90.0
120.0 150.0 180.0 210.0 240.0 270.0 300.0 330.0 360.0 390.0 420.0 450..0 480.0 510.0 540.0 570.0 600.0 630.0 660.0 690.0 720.0 750.0+
270 .0 266.0 258.0 25 ! .0 238.0 228.0 211.0 200.0 176.0 159.0 145.0 133.;0 119.0
94.0 78.0 72.0
6 1 . 0 53.0 45~0 37.0 33,0 29,0
2 5 . 0 19.0 15.0 4.0
I".0 6.0
. 7 .0 13.0 10:0 16.0 ,9.0 24; 0 16.0 14.0
1 1 . 0 13.0 23.0 !6 0 6 0 11 0
8 0 7 0 8 0 4 0 4 0
1.4.o 6.0 4 . 0
11.0 4.0
269.5 263 .0 254.5 244.5 233.0 220.0 206.5 188.0 168.0 152.0 139.5 1 2 6 . 5 107.5 .86.0- 75,0 66:5 57.0 49.5 41,0 35.0 31.0 27.0 22.0 17.0
9.'5 2:0
3 . 0 , 2 ~ . 0
0.0 0 . 0 0.0 1.0
2 . 0 0.0 1.0 0.0 1.0 1.0 2.0 0.0
0 . 0 0.0 0.0 1.0
~0.0 0 . 0 0.0 0 .0 0 . 0 o. 0
; 0.o 0 . 0
0.0111 O. 0076 0.0 0.0 0 . 0 O. 0045 0.0097 0.0 0.0060 0.0 0.0072 -0 ~ 0079 0.0186 0-.0 0.0 0 . 0 O. 0 0.0202 0 . 0 0 . 0 0.0 0.0 0.0 0.0 0.0 0.0
0.9889 0.9924 1,0000 1.0000 1.0000 0.9955 0.9905 1.0000 0.9940 1.0000
.... 0.9928 0.9921 0.9814 1.0000 1.0000 • 1.0000 1..0000 0.9798 1,0000 1.0000 1:0000 1.0000 1.0000 1.0000 1.0000 1.0000
10.9889 0:9813 0.9813 0.9813 0.9813 0.9769 0.9674 0.9674 0:9617 :0.9617 0 ' .9548 0 . 9 4 7 2 0.9296 0.9296 0 .9296 0.9296 0.9296
0 . 9 1 0 8 "0.9108 0,9108 0:.9108 0.9108 0 .9108 0 . 9 1 0 8 0.9108 0.9108
. • .
0.006 0.008 0.008 0.008 0.008 0.009 0.011 0.0!1 0.013 0.013 O. 014 0.016 0.020 0.020 0;020 0.020 0.020 0.027 0.027 0.027 0.027 0.027 0.027 0.027 0.027 0.027

I n t v l S t a r t Time ( D a y s )
Home S t u d y
Number Entrng This Intvl
T a b l e
Group Survival Data For
Number Number Wdrawn Exposd During t o Intvl Risk
BlO.b
S o c i a l D r i n k e r s : First Accident
Number o f P ropn Propn
Termnl T e r m i - S u r v i - E v e n t s n a t i n g r i n g
Cumul Propn S u r v At End
SE o f Cumul Surv i - v i n g
t ~ ~D
0 . 0 3 0 . 0 6 0 . 0 9 0 . 0
120 .0 150.0 180.0 210.0 240.0 •270.0 300.0 330.0 360.O 390.0 420.0 450..0 480.O 5 1 0 . 0 540.0 570.0 600.0 630.0 660.0 690,0 720.0 750.0+
2 5 7 . 0 250 .0 2 4 3 . 0 2 2 8 . 0 216 .0 202 .0 194 .0 1 8 2 . 0 163 .0 1 4 5 . 0 1 3 4 . 0 128 0 111 0
90 0 73 0 66 0 59 0 5 3 . 0 4 7 . 0 4 3 . 0 3 6 . 0 3 0 . 0 2 6 . 0 24.0 1 7 . 0
6 . 0
4 . 0 4 . 0 11 .0
8 . 0 11 .0
8 . 0 11 .0 1 9 . 0 18 .0 1 1 . 0
6 . 0 16 .0 2 0 . 0 17 .0
7 . 0 7 . 0 6 . 0 6 . 0 4 . 0 7 . 0 6 . 0
4 . 0 2 . 0 7 . 0
11 .0 6 . 0
2 5 5 . 0 2 4 8 , 0 237 .5 224 .0 210 .5 1 9 8 . 0 188 .5 172 .5 1 5 4 . 0 139 .5 1 3 1 . 0 120 .0 101 .0 81.5 69.5 62.5 56.0 50.0 45.0 39.5 33.0
2 8 . 0 25.0 20.5 ll~.S
3 . 0
3.0 3.0
4 . 0 4.0 3.0 0.0
1 , 0 0.0 0.0 0.0 0 '0 1.0 1.0 0.0
0 . 0 0.0 0.0 0.0 0.0 0.0
0 . 0 0.0 0.0 0,0 0.0 0.0
0.0118 0.0121 0.0168 0 . 0 1 7 9 0,.0143 O . O 0.0053 0.0 0.0 0.0 0.0 0.0083 O. 0099 0 . 0 0.0 0.0 0.0 0.0 0.0 0.0 0.0 0.0 0.0 0.0 0.0 0.0
0.9882 0 . 9 8 7 9 0 .9832 0 . 9 8 2 1 0.9-857 1 .0000 0 . 9 9 4 7 1.o0oo 1 .0000 1 .0000 1 .0000 0 . 9 9 1 7 0 .9901
1 . 0 0 0 0 1 .0000 1 .0000 1.0000 1.0000 1.0000 1.0000 1.0000 1 . 0 0 0 0 1 .0000 1.0000 1.0000 1 .0000
0 , 9 8 8 2 0 . 9 7 6 3 0.9598 0.9427 0.9293 0.9293 0;9243 0.9243 0.9243 0.9243 0.9243 0.9166 0.9076 0.9076 0.9076 0.9076 0.9076 0.9076 0.9076 0;9076 0.9O76 0.9076 0.9076 0.9076
0 . 9 0 7 6 0.9076
.L
0 .007 0 . 0 1 0 0 .012 0 .015 0 . 0 1 7 0 .017 0.01.7 0 .017 0 .017 0 . 0 1 7 0.:017 0 . 0 1 9 0 . 0 2 1 0.02.1 0 .021 0 .021 0 .021 0 .021 0.021 0.021 0.021 0.021 0.021 0.021 0.021 0.021

Intvl Start Time (Days)
I n - C l a s s
Number Entrng This Intvl
Group Survival
Number Wdrawn During Intvl
Table BlO.c
Data For Social
Number Exposd
to Risk
Drinkers:
Number Of
Termnl Events
Propn Te rmi - n a t i n g
F i r s t Accident
Propn Survi- ving
Cumul . Propn Surv ~iAtEnd
SE o£ Cumul Survi- ving
I
CD
0.0 30.0
6 0 . 0 90.0
120.0 150.0 180.0 210.0 240.0 270.0 300.0 3 3 0 . 0 360.0 390.0 420.0 450.0 480.0 510.0 540.0 570.0 600.0 630.0 660.0 690.0 720,0 750.0+
254.0 252.0 249.0 235.0 224.0 208.0 190.0 1 7 8 . 0 158 .0 140.0 130.0 117.0 106.0
86.0 72.0 61.0 52 .0 45.0 4 3 . 0 38.0 36.0 32.0 29.0 23.0 15.0 8.0
: 1 . 0 3.0
i i . 0 I 0 , 0 16.0 16.0 9 . 0 19.0 • 17.0 I0.0 II +0 II .0 19.0 1 4 . 0 9 . 0 9.0 7 . 0
2 . 0 5.0 2.0 4.0
3 . 0 6 . 0
8.0 7.O
~ . 0
2 5 3 . 5 250.5 243.5 230.0 216.0 200.0 185:5 168.5 149.5 135.0 124.S 111.5 96.S 79.0 6 7 . 5 56.5
4 8 . 5 4~.0 40.5 37.0 34.0
3 0 . 5 26.0 19:0
1 1 . 5 4 .0
1.0 0.0 3.0 1.0 0.0 2.0 3.0 1.0 1 . 0 0.0 2.0 0.0 -I.0 o~o
.o 0.0 0.0 0.0 0.0 0.0 0.0
0 .0 O.O 0.0 0.0 0 .0
0 .0039 0 .0 0 . 0 1 2 3 0:0043 0 ,0 0 .0100 0 .0162 0. 0059 O. 0067 0 .0 0;0161 O. 0
0 . O104 0.0 0.0296 O.O 0.0 O.O 0.0 0.0 0.0 0~0
~0.0 0.0
0.0 0.0
0.9961 I.O000 0.9877 0.9957 1.0000 0.9900 0.9838 0.9941 0.9933 1.0000 o.9839 1.0000 0.9896 1.0000 0.9704 1.0000 i.0000 1.0000 1.0000 1.0000 1.0000 1.0000 1,0000 1.0000 1.0000 1.0000
0.9961 0..9961 0.9838
.0.9795 0.9795
0 .9697 0.9540 0. 9484 0.9420 0.9420 0 . 9 2 6 9 0.9269 0.9173 0.9173 0.8901 0.89oi 0.8901 0.8901 0.8901 0:8901 0 .8901
+0.8901 0.8901
0 . 8 9 0 1 0 . 8 9 o i
0 .8901
" .
i! ') ~ .+
O. 004 O. 004 0.008 O. 009 0.011 0.014 0.015 0,016 0.016 O. 019 O. O19 0 .021
• 0 . 0 2 1
0. 0 2 8
0.028 0.028 0 . 0 2 8 0 . 0 2 8 0 ,028 0.028 0 .028 0;028 0 .028 0 .028 0.028 0 028

I
G q
Table glO.d
Comparison of F i r s t O f f e n d e r Trea tmen t Groups For S o c i a l D r i n k e r s , Using t h e Lee-Desu S t a t i s t i c : F i r s t Acc iden t
Ove r a l l Comparison
Group Name
• Cont ro l Home Study I n - C l a s s
P a i r w i s e Comparison
Group Name
Control . Home Study
P a i r w i s e C o m p a r i s o n
Group Name
Cont ro l I n - C l a s s
Pa i rw i se Comparison
Group Name
itome Study I n - C l a s s
S t a t i s t i c
To t a l N
270 257 254
S t a t i s t i c
To t a l N
270 257
S t a t i s t i c
To t a l N
270 254
S t a t i s t i c
To t a l N
257 254
3.511 D.F. 2 Prob.
Uncen Cen Pct Cen
14 256 94.81 20 237 92.22 17 237 93.31
3,131 D.F. i Prob.
Uncen Cen Pct Cen
1 4 2S6 94~81 20 237 92.22
0.535 D.F. 1 Prob.
Uncen Cen Pct Cen
14 256 94.81 17 237 93.31
1.315 D.F. I Prob.
Uncen Cen Pct Cen
20 237 92.22 17 237 93.31
• /
0.1728, NS
Mean Score
11.226 ~14,339
2.5748
0,0768, Sig
Mean Score
8.3037 '8,7237
0.4646, NS
Mean Score
•2.9222 ' 3 .1063
0.2515, NS
Mean Score
- 5 . 6 1 4 8 5.6811
i
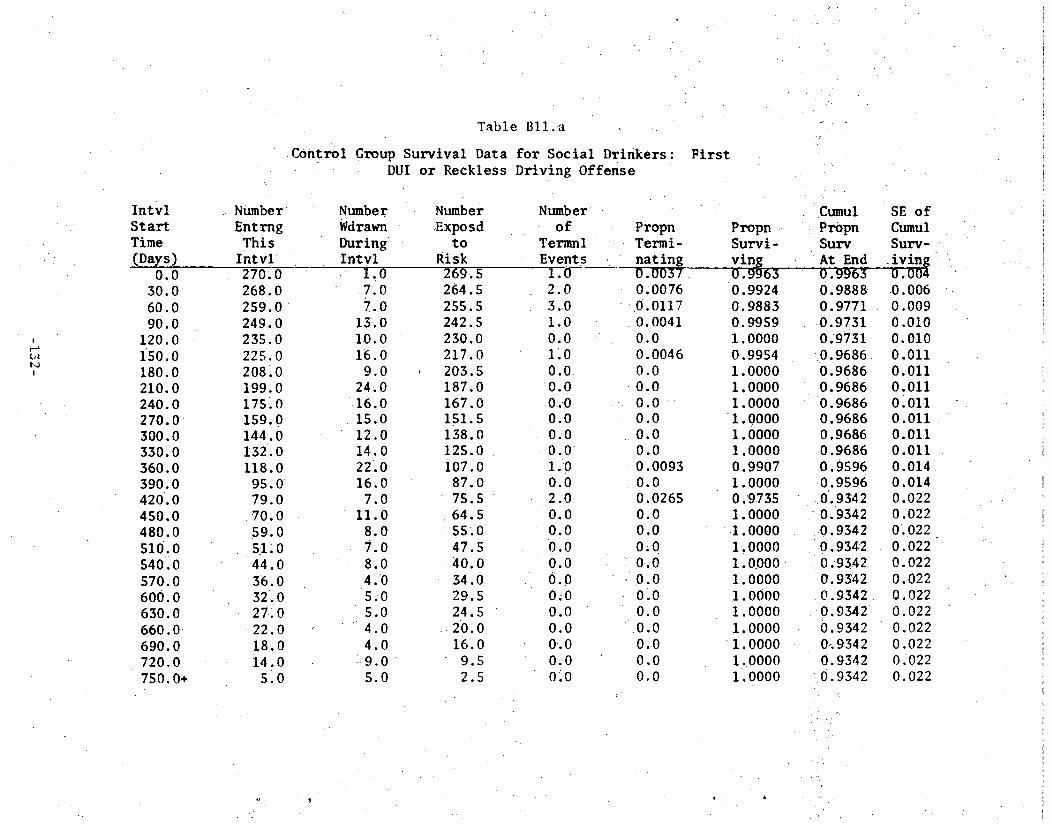
I
t,q bO
I n t v l S t a r t Time (Days)
Number Ent rng
This I n t v l
0.0 30.0 60.0 90.0
120.0 150.0 180.0 210.0 240.0 270 .0 300.0 330.0 360.0 390.0 420.0 450.0 480.0 510.0 540.0 570.0 600.0 630.0 660. O 690.0 720.0 750. O+
270.0 268.0 259.0 249.0 235.0 225.0 208.0 199.0 175.0 159.0 144.0 132.0 118.0 95.0 79.0 70.0 59.0 5:I. 0 44.0 36.0 32".0 27~0 22.0 18.0 i4.0 slo
Table B l l . a
C on t r o l Group S u r v i v a l Data f o r S o c i a l D r i n k e r s : DUI or Reckless Driving Offense
Number Wdrawn During I n t v l
1 . 0 7 . 0 7.0
13.0 10.0 16.0
9 .0 24.0
•.16.0 15.0 12.0 14.•0 22.0 16.0 7.0
11.0 8 . 0 7.0 8.0 4.:0 5.0
• 5,0 4 . 0
4.0 ~9.0
S.O
Number Exposd
t o Risk 269.5 264.5 255.5 242.5 230.0 217.0 203.5 187.0 167.0 151.5 138.0 125.0 107.0
87.0 75.5 64.5 55.0 47.5 40.0 34.0 29.5 24.5 20.0 16.0
9.5 2.5
Number o f Propn
Termnl Events
2 .0 3.0 1.0 0.0 1.0 0 . 0
~0.0 0 . 0 0.0 0 . 0
0 . 0 1"~0
0 . 0 2.0 0.0 0.0 O. 0 0.0 0.o 0~0 0.0 0 .0 0.0 0.0 0~.0
Termi- nating 0.0037 0;0076
•.0.0117 0.0041 0.0 O. 0046 0.0 0.0 0 . 0 0.0 0 .0 0.0 O. 0093 0.0 0.0265 0.0 0.0 O. 0 0.0
"' " . 0 . 0
- o.o 0.0 0.0 0.0 0.0 0.0
F i r s t
Propn Survi - vin g 0.9965 0.9924 O. 9883 0.9959 1. 0000 0.9954 1. 0000 1. 0000 1. 0000 1. 0000 1. 0000 1. 0000 0.9907 1. 0000 0.9735 1. 0000 1. 0000 1.0000 i . 0 0 0 0 "
!.. 0000 1. 0000 1. 0000 1. 0000 1. 0000 I . 0000 1. 0000
. . . ' • .
Cumul .Propn Surv A t End 0 . 9 9 6 3
0 . 9 8 8 8 O. 9771
0.9731 o . 9 7 3 1
.0.9686. 0 .9686 0:. 9686 O. 9686 o.9686 0.9686 0.9686 0.9596 0.9596 • O. 9342
' 0. 9342 0.9342 O. 9342 0 . ,9342
O.9342 • O. 9342 O. 9342 O. 9342 O, 9342 0.9342 0,9342
SE o f Cumul Surv- i v i n g 0.004 • 0.006 . • 0.009 0.010 0.010 0.011 0.011 0.011 O. 011 0.011 0.011 0.011 0.014 0.014 0.022 0.022 O. 022 O. 022 0.022 0.022 0.022 0 . 0 2 2 0.022 0.022 0.022 0.022
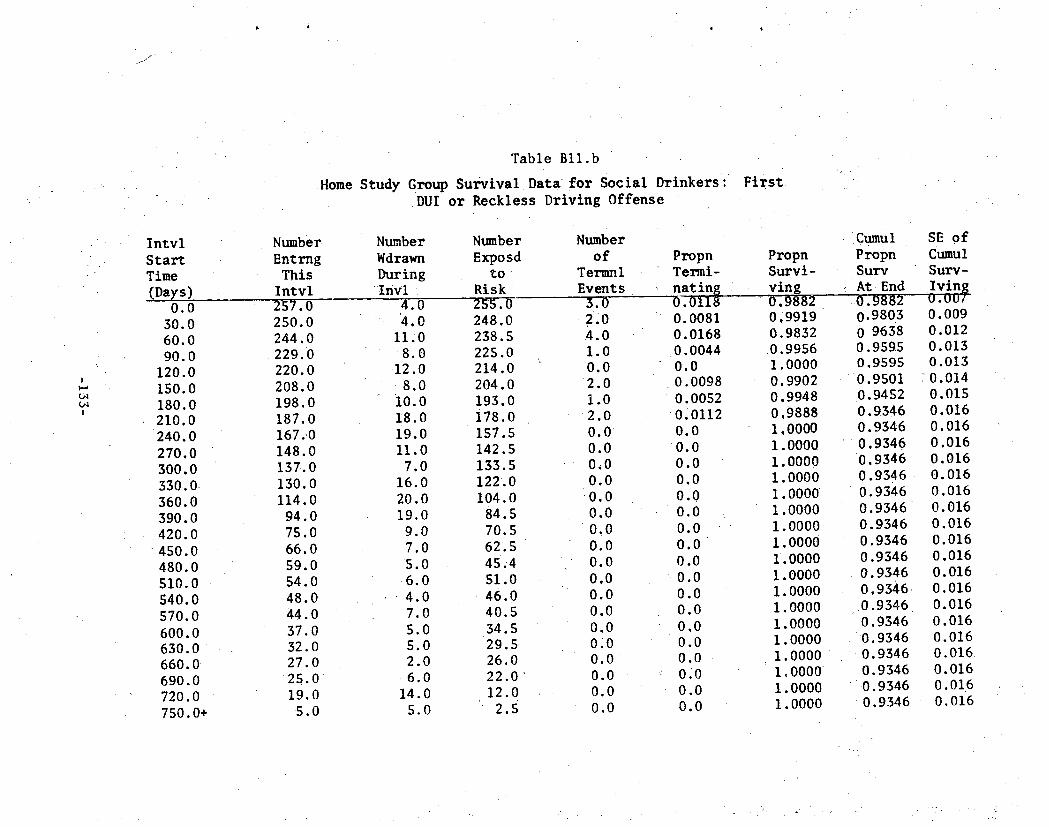
L ̧ A G .
/- jJ
I
t#4
04
Home Study
Table B l l . b
Group Survival Data for Social Drinkers First DUI or Reckless Driving Offense
Intvl Start Time (Days)
0.0 30.0 60.0 90.0
120.0
Number Entrng This Intvl
150.0 180.0 210,0
2 4 0 . 0 270.0 300.0 330.0 360.0 390.0 420.0
450.0 480.0 510.0 540.0 570.0 600.0 6 3 0 . 0 660 .0 690.0 720.0 750.0+
257.0 250.0 244.0
2 2 9 . 0 220.0
Num.ber Wdrawn During Invl :
4.0 '4.0 II;0 8.0 -12.0 8.0
i0.0 18.0 19.0 II.0 7.0
16.0 20.0 19.0 9.0 7.0 5.0 6.0 4.0 7.0 5.0 5.0 2.0 6.0 14.0 5.0
208.0 198.0 187.0 167.,0 148.0 137.0 130.0 114.0 94.0 75.0 66.0 59.0 54.0 48.0 44.0 37.0 32.0 27.0
2 5 . 0 19.0
5 .0
Number Exposd
t o Risk 255.0 248.0 238.5 225.0 214.0 204.0 193.0 178.0 157.5 142.5 133.5 122.0 104.0 84.5 70.5 62.5 45;4 51.0 46.0 40.5 34.5
2 9 . 5 26.0 22.0 12.0
2.5
Number of
Termnl Events 3.0 2 .0 4 . 0 1.0
Propn Termi- nat ing 0.0118 0. 0081 0.0168 O. 0044
0 . 0 2 . 0 1.0
2 , 0 0 . 0 0.0 0.0 0 .0
0 . 0 0.0
0 . 0 0.0 0 .0 0.0 0 .0 0,0 0.0 0 .0 O. 0 0.0 0.0 0.0
0.0 O. 0098 0.0052 0,0112 0.0 0 .0 0 .0 0.0 0 .0 O. 0 0.0 0 . 0 0.0 0.0 0 .0 0 .0 0.0 0.0 0.0 0.0 0 .0 0 .0
Propn Survi- ving 0.9882 0,9919 0.9832 0.9956 1,0000 0.9902 0.9948 0,9888 1.0000 1.0000 1.0000 1.0000 1.0000 1.0000 1.0000 1.0000 1.0000 1.0000 1.0000 1.0000 1.0000 1.0000 1.0000 1.0000 1.0000
1.0000
• Cumul Propn Surv
• : A t . End 0.9882 0.9803 0 9638 O. 959.5
0.9595 •0.9501 0,9452 O. 9346 O. 9346
: 0.9346 0 .9346 0.9346 O. 9346 0.9346 0.9346 0.9346 0.9346 O. 9346 0 , 9 3 4 6
0 . 9 3 4 6 • O. 9346
O . 9346 O. 9346 O. 9346 O. 9346 0.9346
SE o f Cumul Surv-
I v i n g O.uu7 O. 009 0.012 0.013 0.013 0.014 0,015 0.016 0.016 0.016 0.016 0,016 0,016 0,016 0.016 0.016 0.016 0.016 0.016 0.016 0,016 0.016 0.016 0,016 0.016 0.016

~ q
I
Intv l Start Time (Days}
0.0 3 0 . 0 6 0 . 0 9 0 . 0
1 2 0 . 0 1 5 0 . 0 180.0 210.0 240.0 270.0 3 0 0 . 0 3 3 0 . 0 3 6 0 . 0 390..0 420.0 45.0.0 480.0 510.0 540..0 5 7 0 . 0 6 0 0 . 0 6 3 0 . 0 6 6 0 . 0 6 9 0 . 0 7 2 0 . 0 750 .0÷
Number Ent rng T h i s I n t v l
254.0 251 .0 245.0 234 .0 223.0 207 .0 190.0 182.0 1 6 2 . 0 1 4 3 . 0 1 3 3 . 0 1 2 2 . 0 110.0 91.0 7 7 . 0 6 7 . 0 5 7 . 0 48.0 46.0 41.0 3 9 . 0 3 3 . 0 2 8 . 0 2 2 . 0 1 3 . 0
6 . 0
I n - C l a s s
Table Bll .c
Group S u r v i v a l Da ta f o r S o c i a l D r i n k e r s : DUI o r R e c k l e s s D r i v i n g O f f e n s e
N u m b e r Wdrawn Dur ing
I n t v l 1 . 0 3 . 0
1 1 . 0 1 0 . 0 1 6 . 0 1 7 . 0
8 . 0 1 9 . 0 18.0 10.0 11.0 12.0 19.0 14.0 10.0 10.0 8 . 0 2.0 5.0 2.0 6.0 5.0 6.0 9.0 7.0 6.0
Number Exposd
t o R i s k
• 2 5 3 . 5 2 4 9 . 5 2 3 9 . 5 2 2 9 . 0 2 1 5 . 0 1 9 8 . 5 186~0 1 7 2 . 5 1 5 3 . 0 138.0 127.5 i16.0 100.5
84.0 7 2 . 0
6 2 . 0 5 3 . 0 47.0 43.5 40.0 36.0 3 0 . 5 2 5 . 0 1 7 . 5
9 . 5 3 . 0
Number o f
Termnl • E v e n t s , 2 . 0
3 . 0 0 . 0 1 . 0 0 . 0 0 . 0 0 . 0 1 . 0 1 . 0 0 . 0 0 . 0 0 . 0 0 . 0 0 . 0 0 . 0 0 . 0 1 . 0 0 . 0 0 . 0 0 . 0 0 . 0 0 . 0 0 . 0 0 . 0 0 . 0 0 . 0
• P ropn ' T e r m i - • n a t i ng 0.0079 0.0120
0 . 0 O. 0044 0.0 0.0 0.0 O. 0058 O. 0065 0.0 0.0 0.0 0.0 0.0 0 .0 0,0 0.0189 0.0 0.0 0.0 0.0 0.0 0.0 0.0 0.0 0.0
F i r s t
P ropn S u r v i - Ving 0 . 9 9 2 1 0 . 9 8 8 0 1 . 0 0 0 0 0 . 9 9 5 6 1 . 0 0 0 0 1.0000 1.0000 0.9942 0.9935 1.0000 1.0000 1.0000 1.0000
• 1 . 0 0 0 0
1.0000 1.0000 0.9811 1.0000 1.0000 1.0000 1.0000 1.0000 1.0000 1.0000 1.0000 1.0000
C u m u l P ropn
Su rv A t End O.9921 oi.98o2 0 . 9 8 0 2
• 0 . 9 7 5 9 0 . 9759 0. 9759 0 . 9 7 5 9 O. 9702 0. 9639 0. 9639
• 0. 9639 0. 9639 0 ; 9 6 3 9 0. 9639 0. 9639 0. 9639 0. 9457 0. 9457 0.9457 0.9457 0.9457 0.9457 0.9457 0.9457 0.9457 O. 9457
!
SE of Cumul Surv-
0.009 0. 009 0.010 0.010 0.010 0.010 0.011 0 . 0 1 3 0 . 0 1 3 0 . 0 1 3 0 . 0 1 3 0 . 0 1 3 0 . 0 1 3 0.013 0.013 0 . 0 2 2 0 . 0 2 2 0 . 022 0 . 0 2 2 0. 022 0 . 0 2 2 0 .022 0 . 0 2 2 0 .022 O. 022

Table B l l . d
Comparison of First Offender Treatment Groups for. Social Drinkers, Using Loe-Dosu Statistic: First DUI o r Reckless Driving. Offense
I
Ln. )
Overal l Comparison
Group Name
Con t ro l Home S t u d y In-Class
Pairwise Comparison
Group Name
Cent re I Home Study
Pairwise Comparison
Group Name
Cont ro l In-Class
Pairwise Comparison
Group Name
Home Study In-Class
S t a t i s t i c
T o t a l N
270 257 25,1
Statistic
TotaI N
270 257
Statistic
Totai, N
270 254
Statistic
TotaI N
257 254
2. 639
Uncen
11 15 9
1.708
Uncen
1 1 1 5
0.021
Uncen
11 9
• 1.886
Uncen
1 5 9
D.F,
Cen
259 242 245
D.F.
Cen
259 242
D.F.
Cen
259 245
D,F•
Cen
242 245
2
Pct
95 94 96
1
Pct
Cen
.93
.16
.461
Prob.
Cen
95 .93 94.16
1 Prob.
Pct Cen
95 9.6
1
Pc t Cen
94.16 96.46
Prob. 0.2672, NS
Mean Score
5.0481 -11.700 6.4724
0.1913
Mean Score
5.5741 -S .8560
o .883s
Mean Score
.93: -0.52593 • 46 0. 55906
Prob. 0. 1697, NS
Mean Score
, NS
, NS
-5 .-8444 5.9134

I
Gq
Intvl Start Time (Days)
0.0 3 0 . 0 60.0 90.0
120.0 150.0 180.0 210.0 240.0 270.0 300.0 330.0 360 .0 390.0 420.0 450.0 480.0 510.0 540.0 570.0 600 .0 630.0 660.0 690.0 72O.0 750.0+
Table Bl2.a
Con t r o l Group S u r v i v a l D a t a For S o c i a l D r i n k e r s : or Any A/R Of fense
Number Entrng This
- . In tv!
Number Wdrawn During Intvl
Number Exposd
t o R i s k
Number o f
Termnl Event s
270.0 263 .0 249.0 238.0 221.0 206;0 188.0 178.0
.156 .0 139.0 125.0 114.0 i00.0
79.0 64.0 5 8 . 0 47.0 39.0 32.0 26 .0 2 4 . 0 19.0 15.0 14.0 ii.0 3.0
1.0 7 . 0 7.0
13.0 10.0 16.0
8:0 20.0 1 5 . 0
1 3 . 0 I0.0 11.0 20.0 15.0
5.0 11.0
8.0 6 . 0 6 . 0 2 . 0 5.0 4.0 1.0 3.0 8.0 3.0
269.;5 259.5 245.5 231.5 216.0 198.0 18,4.0 i 6 8 . 0 148 .5 132.5 120.0 108.5 • 90.0 7 1 . 5 61.5 52.5 4370 36,0 29.0 25.0 21.5 17.0 14.5 12.5
7.0 1 . 5
6.0 7 . 0
4 . 0 4.0 5.0 2.0 2.0 2:0 2 . 0
1 . 0 1.0 3.0 1.0 0.0 1.0 0.0 0.0 1.0 070 0.0 0.0 0.0 0.0 0.0 0 .0 0.0
First Moving Violation
P r o p n Propn Termi- S u r v i - n a t i n g v ing
0 .O223 0.0270 0.0163 0.0173 0.0231 0.0101 0.0109 0.01191 0.0135 0 ;0075 0.0083 -- 0.0276 0.0111
0 . 0 0.0163 0.0 0 .0 0.0278 0.0
0 . 0 0 . 0 o, 0 0.0 0.0 0.0 0 . 0
0.9777 0.9730 0.9837 0.9827 0.9769 0.9899 0.9891 0.9881 0.9865 0.9925 0.9917 0.9724 0.9889 1.0000 0.9837 1.0000 1.0000 0.9722 1.0000 1.0000 1.0000 1.0000 1.0000 1.0000 1.0000 1.OOOO
Cumul Propn Surv At End
0.9777 0 . 9 5 1 4 0.9359
0 . 9 1 9 7 0 . 8 9 8 4
0.8893 0.8797
0 . 8 6 9 2 0 . 8 5 7 5
0.85-10 0.8439
: 0 . 8 2 0 6 0.8115 0.8115 0.7983 0.7983 0.7983 :0.7761 0.7761 0 .7761
0 . 7 7 6 1 0 . 7 7 6 1
0.7761 0.7761 0 . 7 7 6 i
: 0 . 7 7 6 1 i :
SE of Cumu 1 Survi- ving
0.009 0.013 0.015 0.017 0 . 0 1 9 0.020 0.021 0.022 0.023 0.024 0.025 O. 027 0.029 0.029 0.031 0.031 0.031 0.037 0.037 0:037 0.037 0.037 0.037 0.037 0.037 0.037
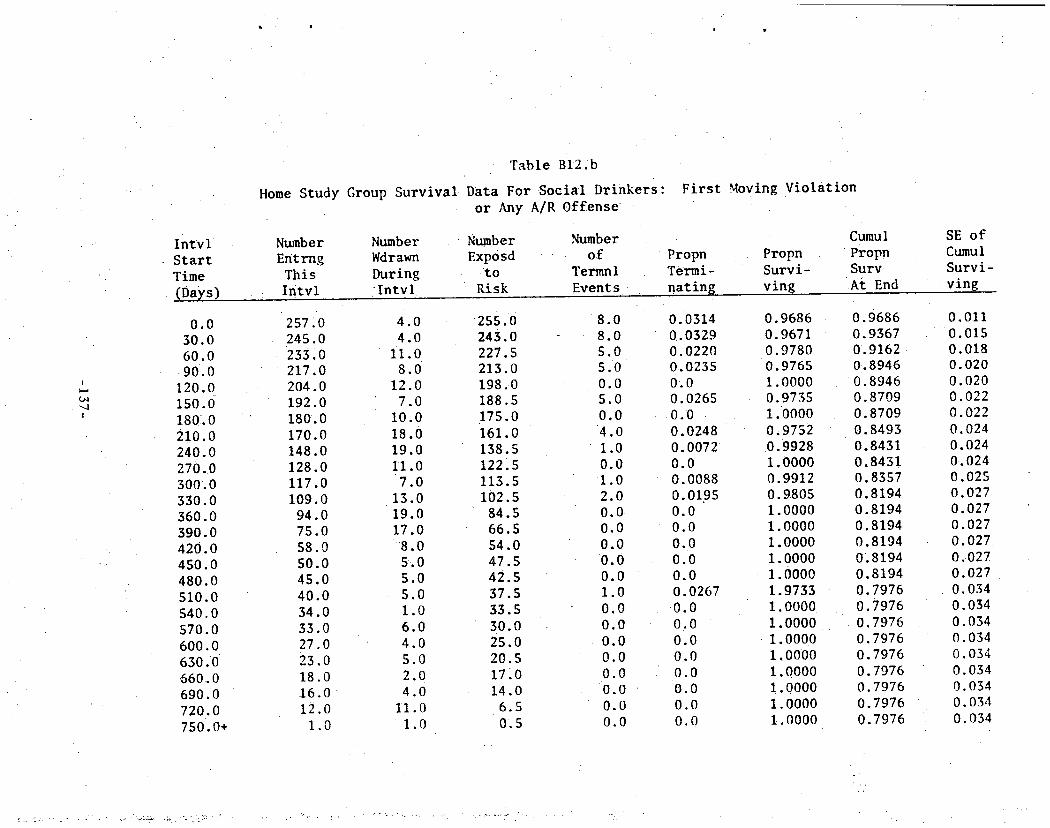
|
I n t v l S t a r t Time (Days)
Home Study
Number Ent rng
This I n t v l
'Fable Bl2.b
Group Surv iva l . Data For S o c i a l D r i n k e r s : o r Any A/R O f f e n s e
Number Wdrawn During I n t v l
Number Number Exposd " of
to Termnl Risk Events,
F i r s t M o v i n g V i o l a t i o n
Propn Termi- nating
Propn Survi- ring
Cumul Propn Surv At End
SE of Cumul S u r v i - v ing
I
L~
I
.0 30.0 60.0
9 0 ; 0 120.0 lSO.O 180.0 210.0 240.0 270.0 300.0 330.0 360.0 390.0 420.0 450.0 480.0 510.0 540,0 570.0 600.0 630.0 660.0 690.0 7 2 0 . 0 750.0+
257.0 245.0 233.0 217.0 204.0 192.0 180.0 170.0 148.0 128.0 117.0 109.0
94.0 75.0 58.0 50.0 45.0 40.0 34.0 33.0 27.0 23.0 18.0 16.0 12.0
1.0
4 . 0 4.0
11.0 8.0
12.0 7.0
I0.0 18.0 19.0 11.0 7.0 13.0 19.0 17.0 8.0 5.0 5.0 5.0 1.0 6.0 4.0 5.0 2.0 4.0 II.0 1.0
2ss.o 2 4 3 . 0 227.5 213.0 198.0 188 .S 175.0 161.0 138.5 122.5 113.5 102.5 84.5 66.5 54.0 47.5 42.5 37.S 33.5 30.0 25.0 20.5 17~0 1 4 . 0
6.5 0.5
8.0 8 .0 5.0 5.0 0.0 5.0 0.0 4 . 0 1.0 0.0
1 . 0 2.0 0 . 0 0.0 0.0 0 . 0 0.0 1.0 0.0
0 . 0 0.0 0.0 0 .0 O. 0 0.0 0.0
O. 0314 0.0329 0.0220 0.0235 o.0 0.0265 0.0 O. 0248 O. 0072 0.0 0.0088 0.0195 0.0 0.0 0.0 0.0 0.0 0.0267
0 . 0 0.0 0.0 0.0 0.0 0.0 0.0 0.0
0.9686 0.9671 0.9780 0.9765 1.0000 0.9735 1.0000 0.9752 0.9928 1.0000 0.9912 0.9805 1.0000 1.0000 1.oooo 1.0000 1.0000 1.9733 1.0000 1.0000 1.0000 1.0000 1.0000 1.0000 1.0000 1.0000
0.9686 0.9367 0.9162 0.8946 0.8946 0.8709 0.8709 0.8493 0.8431 0.8431 0.8357 0.8194 0.8194 0.8194 0.8194 0.8194 0,8194 0.7976 0.7976
0 . 7 9 7 6 0.7976 O.7976 0.7976 0.7976 0.7976 0.7976
0.011 0 . 0 1 5
0.018 0.020 0.020 0.022 O. 022 0.024 0.024 0.024 0.025 0.027 0.027 0.027 0 .027 0.027 0.027 0.034 O. 034 O. 034 0.034 0.034 0.034 0.034 0.034 O. 034
~ . "~:.,:" * ! " : ' " ' " " - " ~ ) ' r ' : : ~ " : ~ . ' L ~ :" ~:': " ' : . ' " / - .~ ~ , . . . . . . . 4 . " : . . / . , ~

Intvl Start Time (Days}
In=Class
Number Entrng
This I n t v l
Group Survival Data or
Table B12.c
For Social Drinkers: Any A/R Offense
Number Wdrawn During Intv!
Number Exposd
~o Risk
Number o f
Termnl E v e n t s
F i r s t Moving V i o l a t i o n
P ropn Termi - , h a t i n g
Propn Survi- ving
Cumu 1 Propn Surv At End
SE of Cumu 1 Survi - v ing
(a , ]
o o i
0.0 30.0 60.0 90.0
120.0 150.0 180.0 210.0 240.0 270.0 300.0 330.0 360.0 390.0 420.0 450.0 480.0 510.0 540.0 570.0 600.0 630.0 660,0 690.0 720.0 750.0+
254.0 248 .0 239.0 226.0 212.0 191.0 171.0 162.0 140.0 124.0 115.0 104.0 93.0 74.0 61:0 51.0 43.0 35.0 34.0 28.0 27.0 22.0 18.0 1310 8.0 S.O
1.0 3.0
I I .0 10.0 16.0 17.0 8.0 •
•19.0 15.0 8.0
I0.0 11.0 18.0 13.o 10.0 7.0 7.0 1.0 4 . 0 1.0 5.0 4.0 S.O S.O 3,0 5.0
253.5 246.5 233.5 221.0 204.0
1 8 2 . 5 167.0 152.5 132.5 120.0 i i0~0
98.5 84.0 67.5 56.0 47.5 39.5
3 4 . 5 32.0 27.5 2 4 . 5 20.0
1 5 . 5 10i5 6.S 2.5
S.O 6.0 2.0 4.0 S.O 3.0 1.0 3.0 1.0 i . 0 1.0 0.0 1.0 0.0 0.0 1.0 1.0 0.0 •2.0 0.0 0 .0 0.0 0.0 0.0 0.0 0.0
0.0197 0.0243 0.0086
0 . 0 1 8 1 0 .0245 O. 0164 O. 0060 0.0197 0.0075
0 . 0 0 8 3 O. 0091
0 . 0
0.0119 0 . 0 0 . 0 0.0211 0.0253 0 .0 0.0625
0 . 0 0 . 0 0 .0 o.o 0~0 0 .0 0 . 0
0.9803 0.9757 0.9914 0.9819 0.9755 0.9836 0.9940 0.9803 0.9925 0.9917 0.9909 1.0000 0.9881 1.0000 1.oooo
0 . 9 7 8 9 0.9747 1.0000• 0.9375 1.0000 1.0000 • 1.0000 1.0000 1.0000 1.oooo 1.0000
o.98o3 0.9564 0.,9482 0.9311 •0.9082 O. 8933 0.8880 0.8705
• 0.8639 0.8567 0 .8489 O. 8489 0.8388 O. 8388 O. 8388 0.8212 O. 8004 O. 8004 Q. 7504 0.7504
.~ 0.7504 i O. 7504
. 0,7504 0.7504 • 0:. 7504
0.7504
i V
.,-.:¢;.:.
0.009 0.013 0.014 0.016 0.019 0.020 0.021 0.023 0,024 0.024 0.025 0.025 0.027 0.027 0.027 0.032 0.037 0.037 O. 049 O. 049 O. 049 0.049 O. 049 0.049 O. O49 0,049
-, .• >

\
~q ~D I
• Tab le B12.d
Comparison of.First O f f e n d e r Treatment GroupsFor SocialDrinkers, Using the Lee-Desu : Statistic: FirstMoving Violation or Any A/R OffenSe
O v e r a l l Comparison
Group Name
Control Home Study In-Class
Pairwise Comparison
S t a t i s t i c
Total N
270 257 254
S t a t i s t i c
0 .597
Uncen "
42 40 37
0.185
D.F. 2 Prob,
Cen Pct Cen
• - 2 2 8 •84.44 217 84.44 217 85.43
D.F. 1 Prob.
i.
-0 .7419 ,
Mean Score •
0f66667 , 8 . 5 7 2 0
7 .9646
NS
Group Name
C o n t r o l Home Study
Total N
270 257
Uncen
•42 40
Cen Pct Cen
228 84,44 217 84.44
P a r i w i s e Comparison Statistic 0.126 D.F. 1 Prob.
Pct Cen
84,44 85.43
1 Prob.
Pct Cen.
84.44 85:43 •
Group Name T o t a l N Uncen Cen
Control In-Class
Pairwise Comparison
Group N a m e . .
270 254
Statistic
Total N-
2 -
37- . •
0 .588
Uncen
228 217
D.F.
cen
Home Study I n - C l a s s
257 254
0 :
•37 217 2i7
0 .6671 , NS
Mean Score
3 .0556 -3 .2101
0 .7229 , NS
Mean Score
- 2 . 3 8 8 9 2 .5394
i 0 .4431 , NS
M e a n S c o r e
-5 .3619 5 : 4 2 5 2

L -
I
4~ O• I
: ,I?,Z '. ,!
In~vl S t a r t Time (Days)
0.0 30.0 6 0 . 0 90.0
120.0 150.0 180.0 210.0 240.0 270.0 300.0 330.0 360.0 390.0 420.0 4SO.O 480.0 510.0 s4o,o 570.0 600.0 630.0 660.0 690.0 720.0 750.0+
• Control Group Survival
• Number Entrng This Intvl
Number
Wdrawn During Intvl
Table B13.a
DataFor M£drangeProblem Drinkers
Number Number Exposd o£ : Prop n
t o Termnl T e r m i - Risk Events natin~
798.0 782.0 750.0 723.0 693.0 655.0 599.0 542.0 483.0 430.0 398.0 3 6 1 . 0 330.0 287.0 251.0 219.0 195.0 161.0 i40.0 I12.0 8 4 . 0 68.0 53.0 33.0 21.0
7 .0
" " 7 . 0
27.0 20:0 24.0 32..0 50.0 53.0 55.0 51.0 30.0 33.0 29.0 39.0 36.0
3 1 . 0 23.0 33.o 21.0 28.0 28.0
: 16.0 :15.0
20.0 ' . ! 1 . 0
14.0 • 7.0
794.5 768.5 740.0 711.0 677.0 630.0 57 2.5 5 i4.5 457.5 415.0 381.5
. 346.5 310.5 269.0 23:5.0 207.5 178 .5
! so .s : 126.0
:98.0 76.0 60.5 43.0 27.5
1 4 , 0 3.5
9.0 S.O 7.0. 6.0 6 . 0 6.0 4.0 4 .o 2.0 2.0 4.0
2 . o
4 . 0 0.0
- 1.0 1 . 0
1.0 0.0
0 . 0 i ~ 0 .0
; 0.0 0 , 0
0.0 1.0 0.0 0.0
0.0113 0;0065 0.0095 0.0084 0.0089 0.0095 0.0070 0.0078 0.0044
F i r s t
Propn Survi- ving
O.9887 0,9955 0.9905 0.9916 0.9911 0.9905 0.9930 0.9922 0,.9956
i ̧ .
Accident
. Cumul Propn SUTV AttEnd
0 . 9 8 8 7 0.9822 0.9729 0i9647 0.9562 0.9471 0,9405 0.9332 0.9291
O, 0048 0.0105 0: 0058 0:0129 0.0 O. 0042 0.0048 0.0056 0.0 0 ~ 0 -
0.0 0.0 0.0
, 0
0.0364 0.0 0.0
0 , , 9 9 5 2 0;9895 0~9942 o.9871 1.0000 0,9958 0.9952 0 . 9 9 4 4 1.0000
L 0 0 0 0 ~ . 0 0 0 0 !.0000
1.0000 !;oooo .0,9636 1.0000 1.0000
0.9246 01.9149 0 . 9 0 9 6
" 0 . 8 9 7 9 0,8979 0.8941 0.8898 0.8848 0.8848 0.8848
0 . 8 8 4 8 0.8848 0.8848 0.8848 0..8526 0.8526 0,8526
SE o£ Cumul Surv i -
. , . ' . .
.V l n g
0:004 ~0.005 0~006 o;o07 o~oo7 0.008 • 0.009 0.:010 0'.010 0 . 0 1 0 .0.=,011 0.012 0.013 0.013 0.014 0.014
0,015 0 : : . ' 0 " 1 5
0..015 0,015 0,015 0.015 0,015 0.035 0~035 0~035
i
~ - . Z ~ "~:;.'; ~ i~ i~Ci- .? : ! ;~- ! ' !~ !~!C~, ,~ ~ :., -~: ~ :~ '~ :~- .~ ;~ . '~ , r " ~ ~;, ,~:~, ' ! ,~" ~ " ~ ~.~;-~:;~.:L"- . " ? ~ ' ~ L ~ ' ~ ' ~ , , ~ V - ' L ~ - ~ ~ ,-,~i/:~-;F ~ , ~ i ~ . ~ ". ~ ~ c ~ ` ~ :`.`~ : % È ~ e ~ - ~ ' . ~ z ~ . . ~ % ~ È ~ . ~ . % ~ : ~ ~ v~ < : - ~ ; , ~ f ! ~ ! ~ , i ~ " ='~'L~"~7 ~ i ! ' ~ ! !~ ,~ :~ , .~ ~
-~: ~:~:~L-~:~'<"~,:~C~ >: :~:;': ' " ~!~'='~; ~: ~ : ~ : :~7: 7 ~ ! ~ ! ~ r ' ~ ? , " ; • ~;~: -%,';~-.~ • ,~ : • : ! :~,: • ;~,~T,!~'~! ~§~/~ ~ : ~ , : ~ z ~ i ~ ? ~ ~;~ : ,~ ,: , ~ ~ :~ "~:: ~;~ . ~ . " ~ c ~ •-~ ~i~,~i ! ~ i ~ : ~ : "~ L ,61 : ~:~&~:~i:~:;~ ~ :C, ~ : ? ~;~:i~ "~ - ~ : ~ ".~i:i~;~:~,~:~;~:~% ' '~,~ ~ : % ~ ' , - ~ ; ~ ! i , ~ ' : , " : ; / . ; ~ - ~ , ~ " , ~ :', ~ : ~ . ~ , / ~ : ~ ' ~ , ~ < ; ~ . ~ : : : -.'~J.~!,~. ~ ~ ~ i ~ . ~ ~ , ~ . ~ ' ~ : ~ - ~ ; ~ : ~ , ~ . ~ , ~ , ' " ~C~i~ i ,~ :~ ? ~ - ~ : -. " c : ~ : ~ ~ ; ~ ; ~ ' - ' : ~ : ~ ' ~ " ~'~'..AL" , ~ ' ~ ' , ~ L : ~ ? ~ ' ~ ' ~ - ~ v'~:
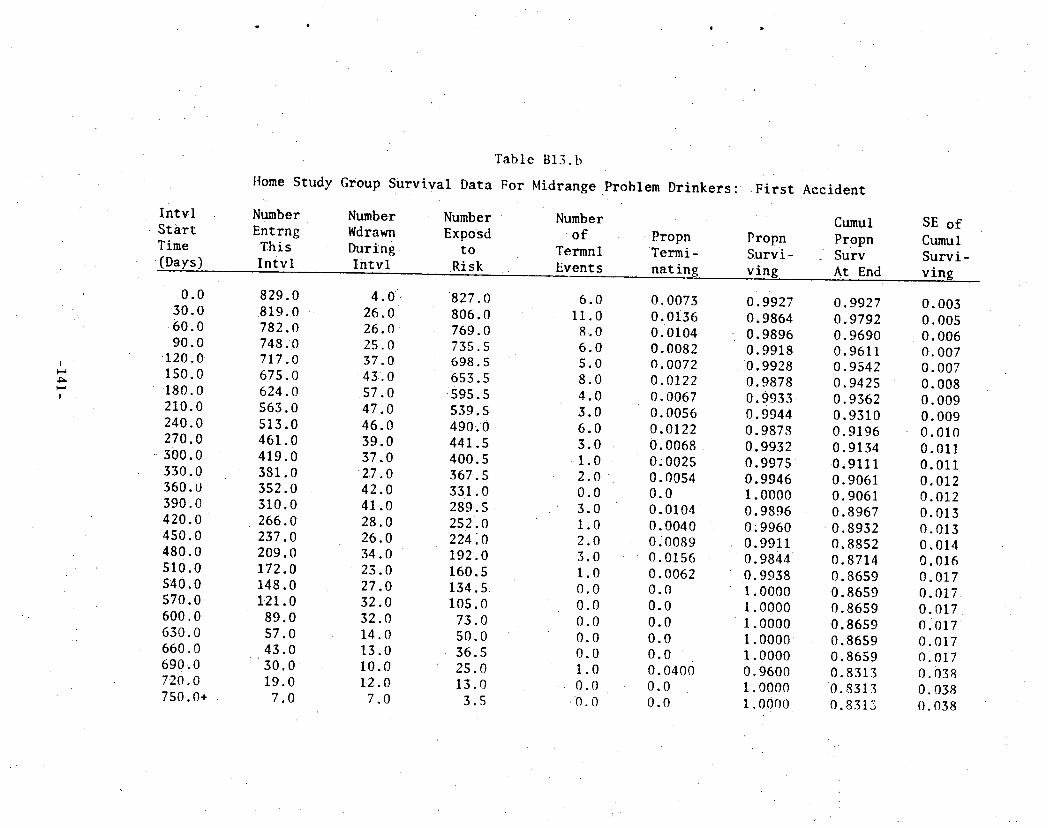
4~
I
Intvl S t a r t Time (Days )
0.0 3 0 . 0 6 0 . 0 90.0
120.0 i50 .0 t 8 0 . 0 210.0 240.0 270.0 300.0 330.0 360.0 390.0 420.0 450.0
4 8 0 . 0 SlO.O 540.0 570.0 600.0 630.0 660.0 690.0 720.0 750.0+
Table
Itome Study Group S u r v i v a l Data
Number Number Number Entrng Wdrawn Exposd This During to I n t v l I n t v l R i sk
B13.b
For Midrange Problem D r i n k e r s :
Number
o f Propn Termnl T e r m i - Events n a t i n g
829.0 819 .0 782.0 748 .O 717.0 675.0 624.0 563.0 513.0 461.0 419.0 381.0 352.0 310.0 266.0 237.0 209.0 172.0 148.0 121.0
89.0 57.0 43.0 3 0 . 0 19.0
7.0
4 . 0 'i 2 6 . 0 2 6 . 0 25.0 37.0 43.0
5 7 . 0 47.0 46.0 39.0 37.0
2 7 . 0 42.0 41.0 28.0 26.0 34.0 23.0 27.O 32.0 32.0 14.0 13.0 10.0 12.0
7.0
827 .0 806.0 769.0 735.5 698.5 653.5
5 9 5 . 5 539.5 49O.0 441.5 400.5 367.5 331.0 289.5 252.0 224.0 192.0 160.5 134.5 105.0
75,0 50.0 36.5 25.0 13.0
3.5
6.o 11.0
8.0 6.0 5.0 8.0 4 .0 3 .0 6.0 3.0 1.0 2.0 0.0 3.0 1.0 2.0 3.0 1.0 0.0 0.0 0.0 0.0 0.0 1.0
~ 0.0 O. 0
0.0073 0.0136 0. 0104 0.0082 0.0072 0.0122 O. 0067 0.0056 0.0122 0.0068 0;0025 0. 0954 0.0 0 .0104 0.0040 0.0089 0.0156 0.0062 0.0 0.0 0.0 0.0 0.0 0.0400 0.0 0.0
F i r s t Acc iden t
Propn S u r v i - v ing
0.9927 0.9864 0.9896 0.9918 0 .9928 0 . 9 8 7 8 0 .9933 0.9944 0.987S 0.9932 0 . 9 9 7 5 0.9946 l.OOO0 0.9896 0~9960 0.9911 0.9844 0.9938 1.0000 1.0000 1.0000 1 .0000 1.0000 0.9600 1.0000 1.0000
Cumul Propn Surv At End
0.9927 0 .9792 0.969O 0.9611 0.9542 0.9425 0.9362 0.9310 0.9196 0.9134 0.9111 0.9061 0.9061 0.8967 0.8932 0.8852 0.8714 0.8659 0.8659 0.8659 0.8659 0.86S9 0.8659 0.8313 0.8313 0.8315
SE of Cumul Su rv i - ving
O. 003 O. 005 O. 006 O.007 0.007 O. 008 0.009 O. 009 0.010 0,011 0.011 0.012 0.012 0.013 0.013 0.014 0.016 0.017 0 .017 0 . 0 1 7 o.o17 O.017 O. 017 O. 038 0.038 0.038

I
4~ bo
I n t v l Start Time
(Days)
0.0 30.0 60.0 9o o
120.0 150.0 180.0 210.0 240.0 270.0
300.0 330.0 360.0 390.0 420.0• 450.0 480.0 510.0 540.0 570.0 600.0 630.0 660.0 690.0 720.0 750.0+
In-Class . Group
Number Entrng Th~s I n t v l
Table B13.c
Surviva l Data For Midrange Problem Drinkers.:
820.0 802.0 773.0 741.0 712.0 671.0 624.0 566.0 512.0 462.0 413.0 372.0 350.0 295.0 253:0 226.0 201.0 174.0 151.0 127.0 95.0 79.0 54.0 44.0 32.0 12.0
Number Wdrawn During In tv l
4.0 21.O 26.0 22.0 35.0 46.0: 55-.0 52 .0 4 5 . 0 41.0 38. O. 20.0 50.0 36.0 2 7 . 0 24.0 27.0 22.0 23,0 32.0 16.0 2 5 . 0 10.0 12.0 20.0 12.0
Number Exposd
tO Risk
818.0 791.5"
•760.0 730.0 694.5 648.0 596.5 540 •. 0 489.5 441.5 394.0 362.0 325.0 277.0
239.5 214.0 187.5 163.0 139.5 111.0 87.0 66.5 49.0 38.0 22.0 6 .0
Number of
Termn 1 Events
14.0 8.0 6.0 7 .0 6.0 1.0 3.0 2.0 5.0 8.0 3 .0 2 . 0 5 . 0 6 .0 0.0
. 1 - 0
0 . 0 1.0 : I ,0
• 0 ~ 0
" ' 0 . 0
0.0 0.0 0.0 O. 0 0 . 0
Propn Termi~ nating
0.0171 0.0101 0.0079 0.0096 0. 0086 0.0015 0.0050 0.0037 0.0102 0.0181 0-.0076 0.0055 0.0154 O. 0217
0 . 0 .0.0047 0 . 0 0.0061 0.0072 0 . 0 0.0 -0.0 0 . 0 0.0 0.0 0 .0
F i r s t A c c i d e n t
Propn Surv i - v i n g
o.9829 0.9899 0.9921 0.9904
0..9914 0.9985 0.9950 0.9963 0.9898 0.9819 0.9924 0.9945 0.9846 0.9783: 1.0000 0.9953 1 .0000 0.9939 0.9928 i.0000 1.0000 1.0000: 1 . 0 0 0 0 1.0000 1.0000 1.0000
Cumul Propn Surv At End
•0.9829 0.9730 0.9653 0.9560 0.9478 0.9463 0.9415 0.9380 0.9285 0.9116 0.9047 0.8997 0.8859 0.8667 0.866? 0 .8626 0.8626 0.8573 0.8512 0.8512 0.8512 0.8512 0:8512 0.8512 0.8512 0.8512
SE o f Cumul Survi- ving
o. o057 O.006 0 .006 0.007 O. 008 0.008 O. 008 0.009 0.010 0.011 0.012 0.012 0.0i4 O.015 0.015 0.016 0.016 0. 017 0.018 0.018 0.018 9. 018 0.0!8 0.018 0.018 0.0IB
• . • •.
?..
L
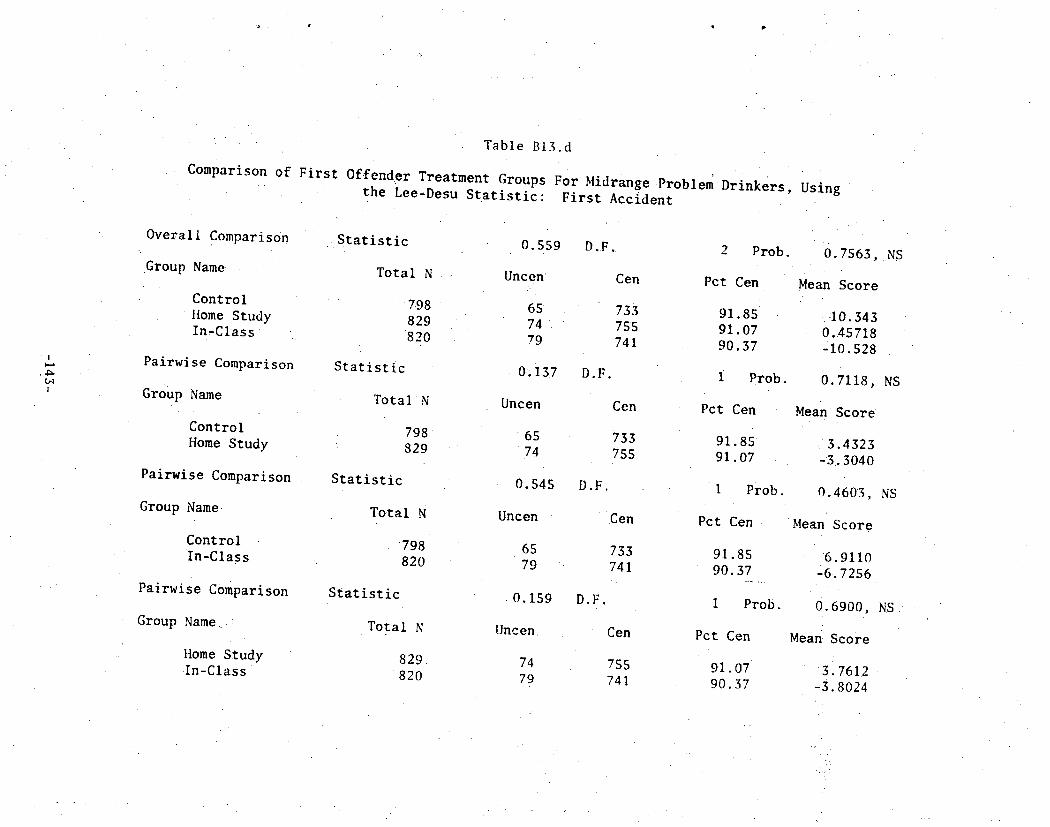
/
• I
4~ ~q
!
Compar ison o f
O v e r a l l Comparison
.Group N a m e
C o n t r o l Home Study In-Class
Pairwise Comparison
Group Name
Control Home Study
Pairwise Comparison
Group Name
Control In-Class
Pairwise Comparison
Group Name:
Home Study . In -C las s '
F i r s t
Tab le B13.d
O f f e n d e r T r e a t m e n t Groups For H i d r a n g e P r o b l e m D r i n k e r s , t h e Lee-Desu S t a t i s t i c : F i r s t A c c i d e n t
Statistic
Total N
798 829 820
S t a t i s t i c
T o t a l N
798 : 829
Statistic
Total N
798 820
Statistic
Total N
8 2 9 8 2 0
0 .559
U n c e n
65 7 4 . 79
0;137
Uncen
6 5 74
0,545
Uncen
65 7 9 .
0 . 1 5 9
Uncen
74 79
Cen
733 755 741
D.F.
Cen
733 755
D.F.
Cen
733 741
D.F.
Cen
755 741
2 Prob.
Pct Cen
91.85 91.07 90.37
i p rob .
Pct Cen
9 1 . 8 5 91.07
1 Prob.
Pe t Cen
91.85 •90 .37
1 Prob.
Pc t Cen
9 1 . 0 7 90.37
Using
0 . 7 5 6 3 , NS
Mean Score
4 0 . 3 4 3 0.~.45718 , 10 .528
0.7118, NS
MeanScore
3 . 4 3 2 3 -3.3040
0.4603, NS
Mean Score
6 . 9 1 1 0 -6 .7256
0.6900, NS j.
Mean ̀• Score i
•3.7612 -3.8024
f .

I n t v l Start Time .(.Days)
0.0 30.0 60.0 90.0
120.0 150.0 180.0 210.0 240.0 270.0 300.0 330.0 360. 0 3 9 0 . 0 420.0 450.0 480.0 510.0 540.0 570.0 600.0 630.0 660 ~ 0 690.0 720.0 :" 750. O+
C o n t r o l
Number En t rng
This I n t v l 7 9 8 . 0 782.0 746.0 721.0 692.0 657 .0 600.0
5 4 2 . 0 4 8 4 . 0 4 2 9 . 0 394.0 356.0 325.0 289.0 252.0 221.0 191.0 160.0 1 4 i . 0 114 .0 83.0 66.0 51.0 30.0 19.0
6LO
Table Bl4 .a
GroupSurvival Data for Mid-rangeProblem Drinkers: First DUI or Reckless Driving Offense
Number Exposd
to Risk
794.5 768.5
7 3 6 . 0 709.0 676.0 631.0 573.5 514.0 ss7.s 412.5 376.5 341.s 307.5 270-5 237.0 206.5 175.5 lSO.S 127.5 • 98 .5 7 4 . 5 ss.s 40.5 24.5 12 .5 :3,0
Number of
Terml Even t s - - 9 . 0
9 .0 5.0 5 .0 3.0 5 .0 5.0 2.0 2 .0 2.0 3.0 2 .0 1 .0 0,0 1,0 1.0 0 . 0 0 .0
: 0 . 0
~ 0.0 : 0.0
0.0 0.0 0.0 0.0 0",0
Propn Termi -
n a t i n g O. 0113 0.0117 O. 0068 O. 0071 O. 0044 O. 0079 O. 0087 O. 0039 O. 0044 O. 0048 O. 0080 O. 0059 O. 0033 0.0 O. 0042 0.0048 0.0 0.0 0.0
0 . 0 0 . 0 0.0 0 . 0 0 . 0 , 0.0 0 . 0
Number Wdrawn : During I n t v l
7 . 0 27.0 20.0 24.0 32 .0 52.0 53.0 56. 0 53.0 33.0 35.0 29.0 35.0 3 7 . 0 30.0 29.0 31.0
1 9 . 0 27.0 31.0 17.0 1 S . 0 21.0
1 1 . 0 13.0 6 .0
Propn Survi- ving 0 .9887 0.9883 0.9932
0 . 9 9 2 9 0.9956 0.9921 0.9913 0.9961 0.9956 0.9952 0.9920 0.994i 0.9967 0.9961 1.0058 0.9952 1.0000 1.0000 1.0000 1.0000 1.0000 1.0000 1.0000 1.0000 1..0000 1.0000
Cumul Propn Su~r - At End 0.9887 0.9771 0.970S O. 9636 0.9593 0.9517 O. 9434 0.9398 O. 9357 0.9311 0.9237 0.9183 0,9153 0.9153 0.9114 O. 9070 O. 9070 O. 9070
0 . 9 0 7 0 O. 9070 O. 9070 O. 9070 O. 9070 O. 9070 0.9070
O. 9070
/
SE o f cumul Surv i v i n g O. 004 0.005 O. 006 0.007 O. 007 0.008 O. 009 O. 009 O. 009 0.010 0.011 0.011 0.012 0.012 O. 012 0.013 0.013 0.013 0.013 0.013 0.013 0.013 0.013 0.013 0.013 0.013

I
Intvl S t a r t Time (pays)
0 . 0 30:0 60 .0 90.0
120.o 150.0 180.0 2 1 0 . 0 240.0 270.0 3 0 0 . 0 3 3 0 . 0 3 6 0 . 0 390 .0 420.0 450.0 480.0 5 1 0 . 0 540.0
_ 5 7 0 . 0 600.D 630.0 660.0 690.0 720.0• 750.0+
Home
Number E n t r n g
T h i s I n t v l ,
S t u d y S u r v i v a l
T a b l e B14.b
Da ta f o r Mid-range DUI
8 2 9 ; 0
P rob l em o r Reckless D r i v i n g Offense
Number Number N u m b e r Wdrawn E x p o s d o f Dur ing t o Termnl I n t v l R i sk , E v e n t s
827.0 3 . 0 4 . 0
. r
822.0 789.0 7 5 7 . 0 726 ;0 6 8 8 . 0 6 3 9 . 0 5 7 6 . 0 5 2 7 . 0 474.0 435.0 399.0 366 .0 3 2 3 . 0 2 7 7 . 0 250.0 223.0 189.0 163.0 131:.0 102.0 66.0 51.0 3 7 . 0 25.0 12.0
2 6 . 0 2 6 . 0 2 5 . 0
3 7 . 0 45.0 5 7 . 0 47.0 5 0 . 0 3 8 . 0 35.0 3 1 . 0 43.0 46 .0 26.0 27.0 34.0 26.0 32.0 29.0 36.0 15.0 14.0 12.0 13.0 12.0
809.0 776.0 744.5 707.5 665.5 610.5 552.5 502.0 455.0 417.5 383.5 344.5 3 0 0 . 0 2 6 4 . 0 236.5 206.0 1 7 6 . 0 1 4 7 . 0 116 .5
84.0 5 8 . 5 4 4 . 0
31.0 18.5 6.0
7 . 0 6.0
6 . 0 1.0 4 .0 6.0 2.0 3.0 1.0 1.0 2.0 0.0 0.0 1.0 0.0 0 . 0 0 . 0
0 . 0 0.0 0.0 0.0 0.0 0.0 0.0 0.0
D r i n k e r s :
P ropn T e r m i , n a t i n g 0 , 0 0 3 6 O. 0 0 8 7 0 . 0 0 7 7 0 .0081 0.0014 0 . 0 0 6 0 0. 0098 0 . 0 0 3 6 0 . 0 0 6 0
• 0. 0022 0.0024 O. 0052 0 . 0 0 , 0 O. 0038 0 . 0 0 . 0 0 . 0 0 . 0 • 0 . 0 0 . 0 0 . 0
0 . 0 0 . 0 0 . 0 0 . 0
F i r s t
P r o p n S u r v i - v i n g 0 . 9 9 6 4 0 . 9 9 1 3 0 . 9 9 2 3 0 . 9 9 1 9 0 . 9 9 8 6 0 . 9 9 4 0 0 . 9 9 0 2 0 . 9 9 6 4 0 . 9 9 4 0 0 . 9 9 7 8 0 . 9 9 7 6 0 . 9 9 4 8 1 . 0 0 0 0 1 .0000 0.,9962 1 . 0 0 0 0 1 .0000 1 . 0 0 0 0 1.oooo 1,0000 1.0000 1.0000 1.0000 1.0000 1.0000 1.0000
c~.ul Propn Surv At End O. 9964 0 .9878 0.9801 0.9722 0.9708 0.9650 0.9555 0.9521 0.9464 0. 9443 0 .9420 0.9371 0.9371 0.9371 O, 9336 0.9336 • 0.9336 O . 9336 O. 9336 0 . 9 3 3 6 O. 9336 O. 9336 0 9336 0 . 9 3 3 6
•0 .9336 O. 9336
SE of Cumul Surv- ivin~ O.UOZ O. 004 O. 005 O. 006 0 . 0 0 6 O. OO7 0 . 0 0 8 O. 008 O. 009 O. 009 0.009 0 . 0 1 0 0.010 0,010 0.010 0.010 0.010 0.010 0.010 0.010 0.010 0.010 0.010 0 . 0 1 0 0.010 0.010
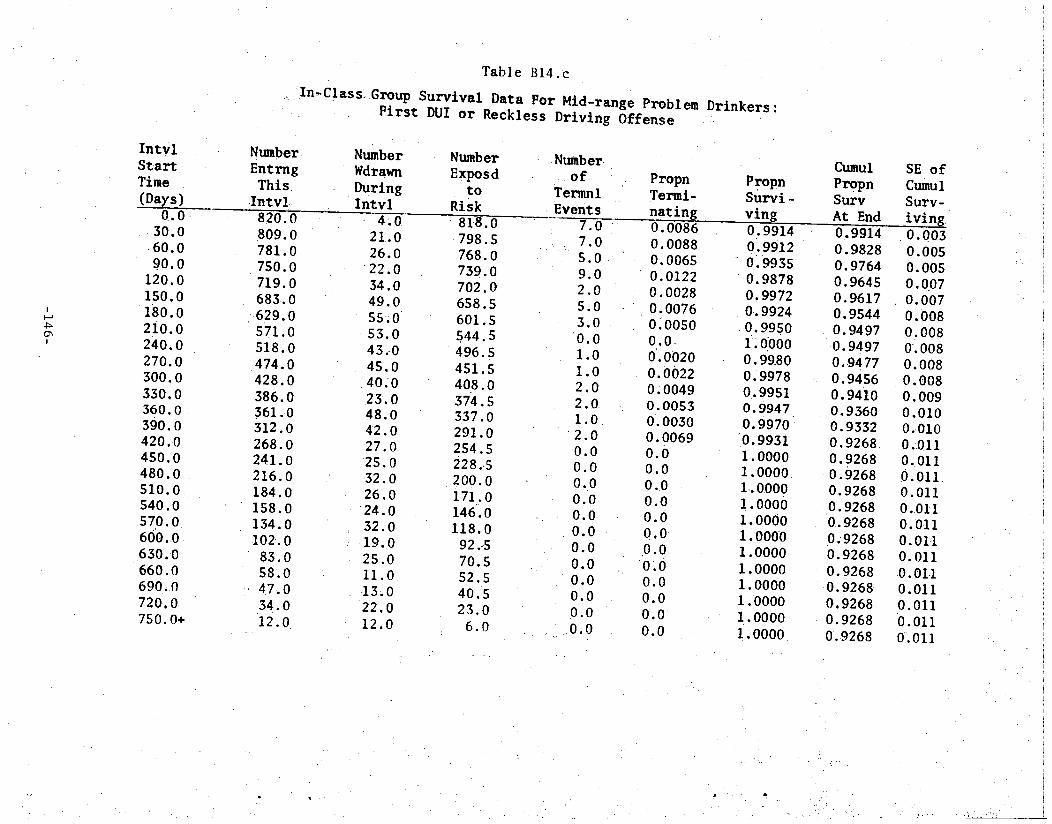
I I - - . l
o', I
Intvl Start Time (Daxs)
0.0 • 30.0 6 0 . 0 90 .0
120.0 150.0 180.0 210 .0 240 .0 2 7 0 . 0 300 .0 330,0 360 .0 390 .0 420,.0 45:0.0 480.0 510.0 540.0 5 7 0 . 0 600 .0 6 3 0 , 0 660 .0 690 .0 720 .0 750. O+
Tab le B14.e
.In'C!ass~Group Survival Data For Mid-range Problem . First DUI or Reckless Driving Offense
Number E n t r n g This.
, In tv l ,
Number Wdrawn During I n t v l
8 2 0 . 0
8 0 9 . 0 781 .0 750 .0
7 1 9 . 0 683 .0
6 2 9 . 0 571.0 518 .0 474 .0 428 .0 386 .0 361 ,0 312 ,0 268 ,0 241 .0 216 .0 184 .0 158.0 134.0 102.0
83 .0 58 .0
47 .0 34 .0 1 2 . 0
4.0 21.0 26.0 22.0 34.0 49.0 55.0 53.0 43.0 45.0 40:0 2 3 . 0 48 .0 4 2 . 0 2 7 . 0 25.0 32 .0 26 .0
2 4 . 0 32.0 19.0 2 5 . 0 1 1 . 0 13,0 2 2 . 0 12 .0
Number Exposd
t o Risk
818.0 798.5 768 .0 739.0 702 .0 658 .5 601 .5 544 .5 496 .5 451 .5 408 ,. 0
374.5 337.0 291 .0 254.5 228.5 200.0 171.0 146.0 118.0 92 .,5 70 .5 52.5
40.5 23 .0
6 . 0
,Number of
Termnl Events
Propn Termi - n a t ing
. 0 ' '
7 .0 5 . 0 9 .0 2 .0 5 .0 3 . 0
0 . 0 1 . 0
1 .0 2 .0
2 . 0 1 . 0
2 . 0 0 .0 0 .0 0 .0 0 .0 0 .0 0 .0 0 . 0
0 . 0 0 .0 0 .0 0 .0 0 .0
O. 0086 0 .0088 O. 0065 0 .0122 O. 0028 O. 0076 0~0050 0 . 0 0 .0020 0.0022 0; 0049 0 .0053 O. 0030 O. 0069 0 .0 0 .0 0 .0 0 .0 0 . 0 0o0 O. 0 0 . 0 0 .0 0 .0 0 . 0 0 .0
D r i n k e r s :
Propn Survi - ving
Cumul Propn Surv At End
0~9914 0.9912 0.9935
0 . 9 8 7 8 0 ,9972
• 0 .9924 •0 .9950 1.0000 0.9980 0.9978 0..9951 0.9947 0i9970
0 , 9 9 3 1 1 . 0 0 0 0 1.0000 1'0000 1.0000 1.0000 1.0000 1.0000 1.0000 1,0000 1.0000 1.0000 !.0000
0.9914 O. 9828 O. 9764 O. 9645 0 .9617 0 .9544 O. 9497 O. 9497 O. 94 77
- O. 9456 O. 9410 0 . 9 3 6 0 O. 9332 O. 9268 O. 9268 O. 9268 0 .9268
O . 9268 O. 9268 0 .9268 0 .9268 O. 9268 O. 9268 O. 9268 O. 9268
0 . 9 2 6 8
SE o f Cumul Surv- i v i n ~ 0 .003 O. 005 O. 005 0,0.07 0 ,007 0 .008 0.008 0.008 0 .008 0 .008 O, 009 0.010 0,010 0.011 0..011 O . O l l 0 , O l l 0.011 O. O11 O. 011 0'011 0.011 0.011 0.011 O. 011 0.011
. , ..
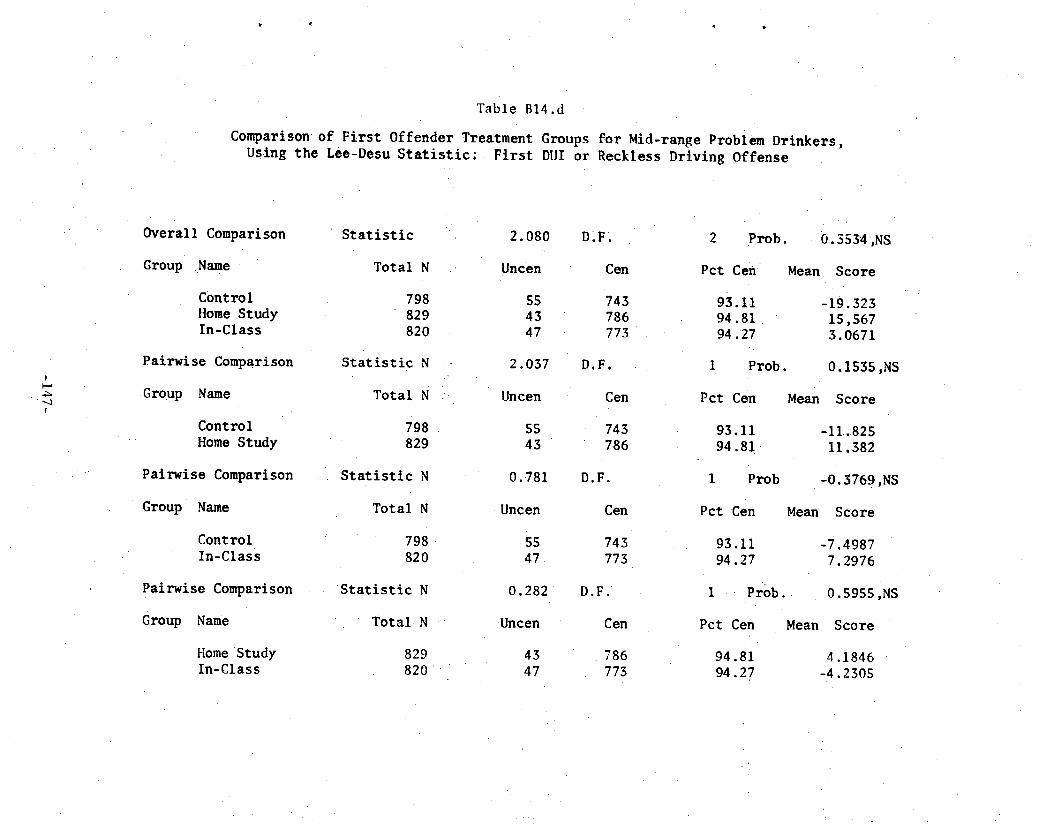
• • • qF
Table B14.d
Comparison of F i r s t Offender Treatment Groups f o r M i d - r a n g e Problem Dr inker s , Uslng the Lee-Desu Stat ist ic: First DUI or Reckless Driving Offense
I
4~
I
Overal l Comparison
Group .Name
Control Home Study In-Class
Pairwise Comparison
Group Name
Control Home Study
Pa i rw i se Comparison
Group Name
Control In-Class
Pairwise Comparison
Group Name
Home Study In-Class
S t a t i s t i c
T o t a l N ,
798 829 820
Statisti c N
Total N :-
798 • 829
S t a t i s t i c N
Total N
798 820
Stat is t ic N
Total. N
829 82O
2.080
Uncen
55 43 47
2.037
Uncen
55 43
0. 781
Uncen
55 47
O.282
Uncen
43 47
D.F.
Cen
743 786 773
D.F.
Cen
743 786
D.F.
Cen
743 773
D.F.
Cen
786 773
2 Prob. 0.35~4,NS
Pct Cen Mean Score
93.i l -19.323 9 4 . 8 1 15,567 94.27 3.0671
I Prob. 0.1535,N5
Pct Cen Mean Score
93.11 -11.825 94.81 11.382
1 Prob -0.3769,NS
Pct Cen Mean Score
93.11 -7.4987 94.27 7.2976
1 •Prob.• 0.5955,NS
Pct Cen Mean Score
94.81 4.1846 94.27 -4.2305

I n t v l S t a r t Time (Days)
Control
,Number E n t r n g
T h i s I n t v l
Table B1S.a
Group S u r v i v a l Data For Midrange Problem D r i n k e r s : V i o l a t i o n o r Any A/R Of fense
Number Wdrawn During Intvl
Number Exposd
to Risk
Number o f Propn
Termni Termi- Events nating
F i r s t Moving
Propn S u r v i - v ing
Cumul Propn Surv At End
SE o f Cumul Survi - v ing
)=.=~
GO
0.0 30.0 60.0
9 0 . 0 120.0 150.0 180.0 210.0 240.0 270.0
3 0 0 . 0 330.0 360 .0 390.0 420.0 450.0 480.O 510.0 540.0 570.0 600.0 630.0 660.0 690.O 720.0 750;0+
798.0 7 6 7 . 0 717.0 687.0 650.0 604.0 544.0 481.0 423.0 365,0 329.0 292.0 263 .0 230.0 197.0 168.0 145.;0 118.0 100.0
78.0 56 .O 43.0 32.0 19.0
1 3 . 0 6,0
7 . 0
27 .0 19.0 24.0 30.0 52.0 52.0 53.0 50.0 32.0 33.0 26.0 30.0 32.0 28.0 23.0 27.0 16.0 22.0 22,0 13.0 11.0 13.0 6.0 7.0 6.0
794 .5 753.5 707.5 675.0
6 3 5 . 0 578.0 518.0 454. S 398 ; 0 349.0 312.5 279.0 248.0 214.0 183.0 156.5 1 3 1 . 5 110.0 89 .0 67.0 49.5
3 7 . 5 25.5 16:. 0
9.5 3 . o,
24.0 2 3 . 0 I I .0
1 3 . 0 16.0
8.0 i i . 0 5.0
8 . 0 4.0 4 .0 3.0 3.0 1.0 1.0 0.0 0.0 2 .0 0 . 0 0.0 0.0 0.0 0.0
0 . 0 0 . 0 0 . 0
0.0302 0.0305 0 . 0 1 5 5 0.0193 0.0252 0.0138 0.0212 0.0110 0.0201 0 ,0115 0.0128 0.0108 0..0121 0.0047 0.0055 0 .0 0.0 0 . 0 1 8 2 0,0 0.0 0.0 0.0 0.0 0.0 0.0 O 0
0.9698 0 .9695 o.984s 0.9807 0.9748 0.9862 0.9788 0.9899 0.9799 0.9885 0.9872 0,9892 0.9879 0.9953 0.9945 1.oooo 1.0000 0.9818 1.0000 1 . 0 0 0 0 1.0000 1.0000 1.0000 1.0000 1.oooo
=~ 1.0000
0.9698 0.9402 .... 0.9256 0.9077 0. .8849 0.8726 0.8541 0 .8447 0.8277 0.8182 0.8078 0.7991 0.7894 0.7857 0.7814 077814 0~7814 0.7672 0.7672 0'7672 0.7672 0.7672 0.7622 0.7672 0,7672 0 . 7 6 7 2
O. 006 0.008 O. OO9 0.010 0..012 0.012 0.013 0.014 0.015 0.015 0.016 0.017 0.017 0.018 0.018 0.018 0.018 0.020 0.020 O. 020 0.020 0.020 0.020 0.020 0.020 0.020
. . . . "

L ~D i
In tv l S ta r t Time (Days)
0.0 30.0
60 .0 90.0
120.0 150.0 180.0 210.0
240.0 270.0 300.0 330.0 360.0 390.0 420.0 450.0
480.0 510.0 540.0 570.0 600.0
• 630.0 660.0 690. fl 720.0 750. O÷
.-Home Study Group Table BiS.b
Survival Data For Midrange Problem Drinkersi: V i o l a t i o n or Any A/R ,Offense,
Number Number E n t r n g Ndrawn This During
I n t v l In tv l
Number Number Exposd of
to Termnl Risk Events
Propn T e m i - na t ing
829.0 811.0 761.0 717.0 676.0
6 2 7 . 0 571 .0 509.0 454.0 397.0 359.0 323.0 293.0 253.0 212.0 188.0 163 .0 132.0 110.0 8 6 . 0 65.0 40.0 31.0
23.0 15.0 7.0
4.0 26.0 26.0 24.0 37.0 45.0 53.0 45.0 47.0 33.0 33.0 30.0 38.0 39.0 23.0 25.0 31.0 20.0 24.0 21.0 25.0 9.0 8.0 8.0 8.0 7.0
827.0 • 798.0
748.0 705.0 657.5 604.5
• 5 4 4 . S
486,5 430.5 380.5 342.5 308.0 274.0 233.5 200.5 175.5 147.5 122.0 98.0 5.5
$2.5 35.5 27.0 19.0 11.0 3.5
• 14.0 24.0 1 8 . 0 17:0 12.0 11 .0 9 '0
10.0 :~i0,0
5.0 3.0 0.0 2.0 2.0
1 . 0 0.0
0 : 0 2.0
0 . 0 ~0.0 0 . 0 0.0 O. 0
0 . 0 0.0 0.0
0.0169 O . 0301 0.0241 0.0241 0.0183 O. 0182 0.0165 O. O206 O. 0232 0.0131 O. 0088
0 . 0 0.0073 O. 0O86 O. OO50 0.0 0 .0 0.0164 0.0
. 0
0 . 0 0.0
. 0
0.0 0.0 0.0
F i r s t Moving
Propn SurVi- v i n g
Cumut Fropn:
S u r v At End
0 . 9 8 3 i 0.9699 0.9759 0,9759 0.9817 0.9818 0.9835 0.9794
• 0.9768 0.9869 0.9912 1.0000 0.9927 0.9914 0.9950 1.0000 1.0000 0.9836 i.oooo 1,0000 1.0000 1.0000 1.0000 1.0000 1.0000 1:0000
0.9831 0.9535 0.9306 0.9081 0.8915 0.8753 0.8609 0.8432 0:8236 o.8t28 0.8056 0.8056 0.7998 0.7929 0.7889
0 .7889 0.7889 0.7760: 0,7760 0.7760 0.7760 0.7760 0.7760 0.7760 0.7760 0.776O
SE of Cumu 1 Surv- r i n g _
O. 004 O. 007 0.009 0.010 0.011 0.012 0.013 0.014 0.015 0.015 0.016 0.016 • 0.016 0.017 0,017 0.017 ~ 0,017 0.019 0.019 0.019 0.019 0.019
0 . 0 1 9 0.019 O. 019 0.019

).
!
I n t v l S t a r t Time (Days.)
0.0 ~: 30,0
6 0 . 0
90.0 t 2 0 . 0 :150.0 180.0 210.0 240 .0 270.0 300.0 330.0 360,0 390.0 420.0 450.0 480.0 510.0 540.0 570,0 600.0 630.0 660.0 690.0 720.0 750.0+
In-Class
Number Ent rng
T h i s . Intvl
Table B1S.c
G r o u p S u r v i v a l Data For Midrange Problem D r i n k e r s : V i o l a t i o n or Any A/R Offense
Number Wdra~m Dur ing ~ I n t v l
Number Exposd . to
Risk
Number o£
Termnl Events
Propn Termi- nating
F i r s t Moving
propn ' Survi- vinz~
820.0 789.0 745.0 705.0 666; 0 616.0 559.0 498.0 442.0 395.0 352.0 311.0 289.0 242. 0 202;0 181.0 157.0 130.0 I07.0 90.0 65.0 53 .'0 31.0 26.0 18.0 4 .0
4 , 0
121.o 126.0 22.0 34.0
48.0 52.0 5I .0 40,0 41.0 35.0 19.0 41.0 36.0 21.0 24.0 26.0 22.0 17.-0 24.0 12.0 22.0
5.0 8.0
I 4 . 0 4.0
818.0 778.5 732.0 694.0 649.0 592.0 533.0 472.5 422.0 374.5 334.5 301.5
2 6 8 . 5 224.0
191.5 169.0 144.0 119.0 98.5 78.0 59,0 42,0 28:5 22..0 I I . 0 2.0
27.0 23.0 14.0 17.0 16.0 : 9 . 0
9.0 S.O 7 .0 2.0
6 . 0 3 .0 6.0 4 .0 0.0 0.0 1.0 1.0 0:0 1.0 0 .0 0 .0
:0.0 0.0 0.0 0.0
0,0330 0.0295 0.0191 0.0245 0.0247 0.0152 0.0169 0.0106
0 .0166 0.0053 0,0179 0.0100 0.0223 0.0179 0.0 OiO 0. 0069 0.~0084 0.0 0.0128 0.0 0.0 0.0 0.0: OLO 0.0
0.9670 0.9705 0.9809 0'.9755 0.9753 0.9848 0.9831 0.9894 0.9834 0.9947 0.9821 0.9900 0 .9777 0,9821 1.0000 1.0000 0.9931 0.9916 1.0000 0.9872 1.0000 1.0000 1.0000 1.0000 1.0000 1.0000
Cumul Propn Surv At End
0.9670 0:9384 0.9205 0.8979 0.8758
0 .8625 0.8479 0.8389> 0.8250 0,8206 0.8059 0.7979 0.7801 0.7661 0.7661 0 . 7 6 6 I 0.7608 0.7544 0.7544 0~744,7 0.7447 O. 744,7 O. 744:7 0.7447 O. 7447 O. 7447
SE o£ Cumul Survi. ving
0.006 0.008 0.:010 0.011 0.012 0.012 O. 013 0.014 0.014 O.OlS 0.016 0.016 o.oi7 01018 O. 018 0:018 0.019 0.020 0.020 0.022 0.022 0.022 0.022 0.022 0. 022 0.022
[ :~:i
1
= - - ' - ~ , . ~ J , ~ : ~ : ; t . ~ - ~ F i £ = - ~ - : ~ . . . . . . . . . . . ' , : : = : . , ~ = ~- . . . . . . " " ~ - " - J ~ , ~ ' ~ , . ~ ? ~ : ~ : 7 ~ . ' ~ : : : . ' ~ C . . . . . : > ~ ~ T o ' " : V : : " ~ . . . . . . " ~ . ~ ~ ' . . : - ; . ~ : - . ~ - , - , : - = v , ' . ~ , ~ . : ~ - - ~ - . ~ . . . . . . . . ~ , . ~ - ~ . ' ~ : ~ 2 " ~ - > ; ~ . . . . - . . . . . . [ ~ - : . ~ : = . ~ ( -- , ~ - ~ : ~ : - ~ - . ; . : . : , : ~ . . . " . . . . . . - ~ : s = - : . . . . . L ' , ,: " 7 . . . . . : - . 2 - _ % - . _ \ . . . . . . . . . . . . . . . . .
. . . . . : : .... ! . . . . . . . . . . . . . . . . . . . . . . . .

• I u
Un
Comparison
Tab le B i 5 ' d
o f F i r s t O f f e n d e r : T r e a t m e n t Groups For Midrange P rob l em D r i n k e r s , Us ing t h e L e e - D e s u S t a t i s t i c : F i r s t Moving Violation or Any A/R O f f e n s e
O v e r a l l C o m p a r i s o n
Group Name
Control Home Study In-Class
Pairwise Comparison
Group .Name • .L+~
Control " Home Study
Statistic
Total N
798 829 820
Statistic "
Total N
7 9 8 829
o.sst
Uncen
137 140 151
0.115
Uncen
137 140
D:F.
Cen
66! 689 669
D.F.
Cen
661 689
2 Prob . 0 . 7479 ,
Pe t Cen. Mean Score
8 2 . 8 3 : 1 .0489 83.11 14.526 8 1 . 5 9 -15 .706
1 Prob . 0 .7342 ,
Pc t Cen Mean Score
8 2 . 8 3 -4 .5439 8 3 . 1 1 4 . 3 7 3 9
NS
P a r i w i s e Compar i son
Group Name
. C o n t r o l In-Class
Statistic
Total N
: 798 820
0 .170
Uncen
157 151
D.F.
Cen
661 669
NS
Pairwise Comparison
Group Name
Statistic
T o t a l N
0.577 D.F.
Uncen Cen
1 Prob. 0 . 6 8 0 1 , NS
Pc t Cen Mean Score
82.83 5 .5927 8 1 . 5 9 -5 .4427
Home S tudy I n - C l a s s
829 820
140 1S1
1 Prob. 0 ;4475 , NS
Pet Cen M e a n S c o r e
689 83.11 10.152 669 81.59 -10.263
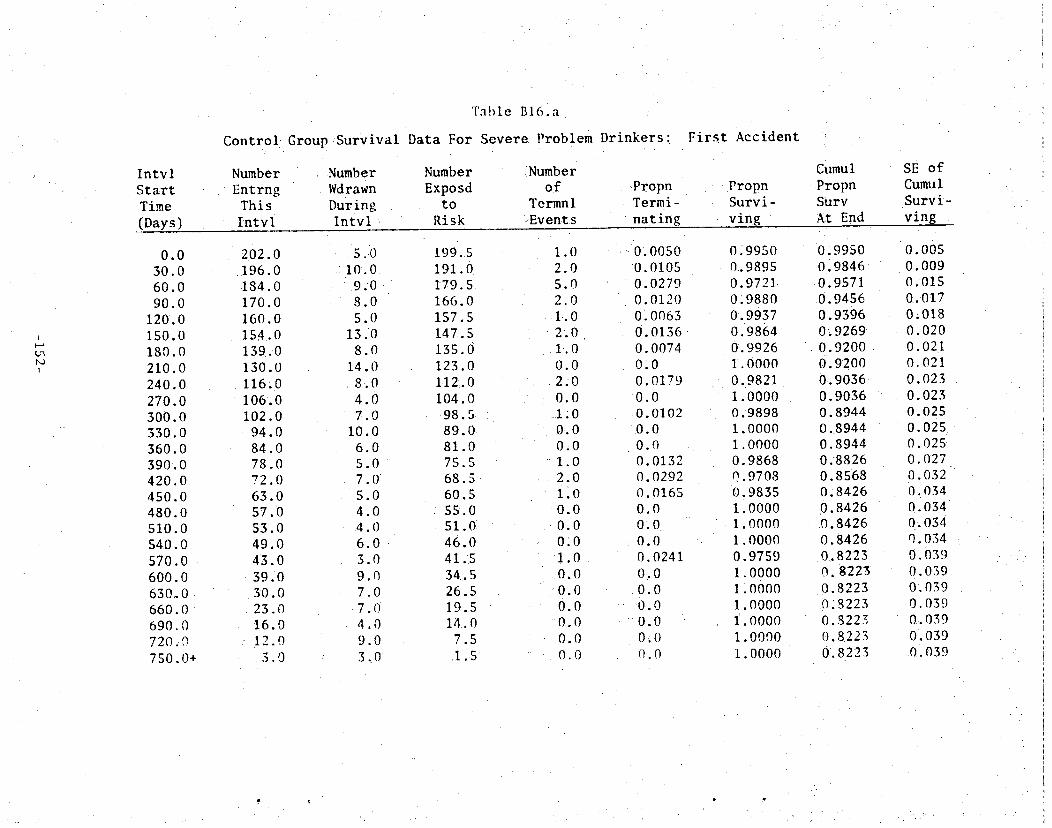
Intvl Start Time (Days)
C o n t r o l • G r o u p , S u r v i v a l
Number Number E n t r n g Wdrawn
T h i s During I n t v l I n t v l
T a b l e
Data For
Number Exposd
to Risk
B161a
S e v e r e P rob l em
Number o f
Termnl <-Events
Drinkers :
P r o p n T e r m i -
n a t i n g
First A c c i d e n t
Propn • Survi-
ving
Cumul P r o p n Surv At End
SE of Cumul S u r v i - v i n g
I
t O
I
0.0 30.0 60.0 90.0 120.0 150.0 180.0 210.0 240.0 270.0 3 0 0 . 0 3 3 0 . 0 3 6 0 . 0 3 9 0 . 0 420.O 450.0 4 8 0 . 0 510.0 540.0 5 7 0 . 0 600.0 630.0 660.0 6 9 0 . 0 720,,0 750.0+
2 0 2 . 0 196.0 1 8 4 . 0
170 .0 1 6 0 . 0 154.0
• 139..0 130.0 1.16,0 1 0 6 , 0
102 .0 94.0 84.0 78.0
7 2 . 0 6 3 . 0 5 7 . 0 53.0 49.0 43.0 39.0 30.0 23.0 16.0 12.0 3.0
• 5 ..0 .: 1 0 . 0
• 9 : 0
8 . 0 5 . 0
13.o 8 . 0
14.0 8.0 4.0 7.0 I0.0 6.0 5.0 7.0 5.0 4.0 4.0 6.0 3.0 9.0 7.0 7.0 4,0 9.0 3.0
199.5 191.0 179.5 166.0 157.5 147.5 135.0 123.0 112:.0 104.0 9 8 . 5 89 .0 81.0 7 5 . 5 68.5 60.5 55.0 51.0 46,0 41.~5 34.5 26.5 19.5 14 .0
7 . 5 1 . 5
1 .0 2.0 S.O
2 . 0
1 . 0
2 . 0 1-.0 0 . 0
2 . 0 0.0
...i ; 0 0 . 0 0 , 0
.... 1 . 0 2 . 0 1~o
0 . 0 0 . 0
0 : 0 1 . 0 : 0 . 0 ' 0 . 0 0 . 0 "0 .0
0 . 0 0 . 0
• O . 0050 0.0105 0.0279 0.0120 0 L 0063 0.0136 0 .0074 OLO 0.0179 0.0 0.0102 i0.0 0.0 0.0132 0.0292 0.0165 0.0 0.0 0.0 0.0241 O, 0 0.0 0.0 0.0 O~ 0 O. 0
0.9950 0.9895 0.9721• 0;9880 0.9937 0 .9864 0.9926 1 .0000 0 .9821 1 .0000 0 . 9 8 9 8 1 .0000 1 .0000 0 .9868 0 .9708 0 .9835 1 .0000 1 .0000 1.0000 0.9759 1.0000 1.0000 1 .0000
i . 0 0 0 0 1.0000 1.0000
0:9950 0.9846 0.9571 O.9456 0.9396 0;9269 0.9200 0.9200 0 .9036 0.9036 0.8944 0.8944 0.8944 0.8826 0.8568 0,8426 0 . 8 4 2 6 0 . 8 4 2 6 0 . 8 4 2 6
0 : .8223 0 . 8 2 2 3
0 . 8 2 2 3 0:8223 0 .8223 0.8223 0.8223
• O. 005 O. 009 0.015 0.017 0.018 0.020 0.021 0.021 0 .023 0 .023 0 . 0 2 5 0.025 0.025 0 .027 0 .032 0 .034 0.034 • O. 034 ").034 0.039 0.039 0.039 O. 039 0•.039 O. 039 0 . 0 3 9
• . .

I ~ . a •
t d 3 •
I .
I n t v l s t a r t Time (Days)
0.0 3 0 . 0 60 .0 90 ;0
120.0 150.0 180:0 2 1 0 . 0 240 .0
2 7 0 . 0 300 .0 330 .0 360 ; 0 390 .0 420 .0 450 .0 480.0
5 1 0 . 0 540.0
.S70.O 600 .0 6 3 0 . 0 660 .0 6 9 0 ' 0 7 2 0 . 0 750,0+
Home Study
Number E n t r n g
T h i s InZvi
T a b l e
Group S u r v i v a l Data For
Number Number Wdrawn EXposd D u r i n g t o I n t v l R i sk
B l 6 . b
Severe• P rob 1 em
Number o f
Te rmnl E v e n t s
223.0 217.0 201.0 189.0 178.0 171.0 157.0 144.0 133.0 127.0 119:0 :114.0 99.0 90.0 79.0 73.0 71•.0 64 .0 5 8 . 0 51.-0
142.0 33.0 29 .0 23 .0 15 .0
3 . 0
4 . 0 13.0 10,0 ll .0 7.0
i0.0 13 .0 I 0 . 0 6.0 6.0 5.0
• 13.0 9 .0 8 . 0 6 . 0 2 .0 7 .0 6 . 0 6 . 0 9 .0 9 . 0 4 . 0
6 . 0 8 .0
12 ,0 3 . 0
221 .0 21015 I 9 6 . 0 183.5 174.5 166.0 150,5 139.0
13o.o 124.0 116.5
• 107.5 94.5 86.0 76 .0 72 .0 67.5 61 .0 55 :0 -46.5 37.5 31 .0 2 6 ' 0 1 9 . 0
9 . 0
2 . 0
:3 .0 2 . 0 0 . 0 0.O 4 .0 0 .0 1 . 0 0 .0 2 . 0 O. 0 2 . 0 0 .0
3 . 0 0 .0 0 .0 0 .0 0 .0 0 . 0 1 .0 0 .0 0 .0 0.0 O.0
0 . 0 ..... 0 . 0
D r i n k e r s :
P r o p n T e r m i - n a t i n g
O. 0090 0.0143
:0 .0102 . : 0 .
0 .0 0.0241 0 .0 0 .00?2 0 .0 0 .0161 0 . 0
0 . 0 1 8 6 0 .0 0 .0349 0 .0
0 . 0 0 . 0 O. 0
0 . 0 1 8 2 0 .0
0 . o 0 .0
0 . 0 0 . 0 0 . 0 0 . 0
First Accident
Cumul Propn Propn S u r v i - Surv
r i n g At End
SE o f Cumul Surv i - ving
0. 919 i 0 0.9857 0.9898 1 . 0000 1 . 0 0 0 0
0.9759 1. 0000 0.992.8 1 .0000 O. 9839 1. 0000 0.9814 1.0000 0.9651 1 .0000 1.0000 I . 0000 1. 0000 0 .9818 1. 0000 1.0000 1. 0000 1 .0000 i .0000 1.0000 1 0ooo
0,9910 0.9768 0.9669 0 .9669 0 .9669 0~9436 0. 9436 0.9368 0 .9368 0 . 9 2 1 7
0 . 9 2 1 7 0.9045 0 .9045 0:8730 0 .8730
•0 .8730 0 .8730 0 .8730 0.8571 0.8571 0.8571 0.8571 0.8571 0.8571 0.8571 0 .8 5 7 !
O. 006 0 .010 0 .012 0 . 0 1 2 0.012 0.017 0.017 0 .01 ,q 0 .018 0.021 0.021 0 .023 0 .023 0 .029 0 .029 0 .029 9 .029 0. 029 0.032 0 .032 0 .032 0 .032 0 .032 0.032 0.032 0.032
' ~ , . • . ~ , : . , . . • . . . . . • • • . , - - , , . ~ . .
"~: :":-~:::~ : :,: : ...... ~L::; ~ - ; , -C ~ ........ :~" ::,,:" : ~:- : : ~. :~>~v:~ • : -~' ~ ..... C / : ~&:/~: :~,i: .... -:i• :<:i: ::, IC~:>:: >: 7•~ ::-, : .... :

I n t v l S t a r t Time (Days)
In C l a s s
Number Entrng
This I n t v l
Tab le B16.c
Group S u r v i v a l Data f o r Seve re P r o b l e m - D r i n k e r s :
Number Number Number -: Wdrawn Exposd o f Propn During t o Termnl Termi- I n t v l Risk Events-. n a t i n g
F i r s t A c c i d e n t
Cumul Propn Propn S u r v i - Surv v ing A t E n d
SE of Cumu I Surv i - ring.
I .
0 .0 30 .0
6 0 . 0 9 0 . 0
1:20.0 150.0 180.0 210.0 240.0 270.0 300, O 330.0 360 ,0 390.0 420.0 450.0 480.0 510.0 540.0
' 570 .0 600-, 0 630 ,-0 '660.0 6 9 0 . 0 720.0 750.0
212. 0 209.0 197.0 182,o 177.0 170.0 151.0 141.0 128.0 I I 0 . 0 105.0
98.0 89.0 80.0 79.0 72.0 69.0 63..0 60.0 56.0 a7.0 38.0 32.0 21..0 14.0
4 , ~
. 0 -
11,0 1 4 . 0
5 .0 7 .0
18;0 8 .0
13.0 15.0
5 .0 6 .0 8 .0 9 .0 1 .0 7 .0 2 , 0 6 .0 3 . 0 4 ,0 9 . 0 9 .0 6 .0
11.0 7,0
I 0 . 0 4 , 0
212.0 203.5 190.0 179.'5 173;5 161.0 147.0 134.5 120.5 107.5 102 .0 94.0 84.5 79 .5 75.5 71;0
6 6 . 0 61/5 58 .0 51.5 42.5 35.0 26.S 17.5 °9,0 2.0
3.0 1.0 1 .0 0 .0 0 .0 1 .0 2 ,0 0 .0 3 .0 0 .0 1 .0 1 ,0 0 0 0 0 ' 0 0 1 0 0 0 0 0 0 0 0 0 0 0 0 0 0 0 0 .0 0 .0 0 ,0
0,0142 O. 0049
0 . 0 0 5 3 . 0 - '
0.0 0.0062 0.0136 : 0.0 0.0249 0 . 0 0.098 0;0106 0 , 0 ' 0 .0 0:0 0.0141 0.0 0.0 O. 0 olo 0.0 0.0 0.0
0 . 0
0.0 0.0
0 .9858 0.9951 0.9947 1.0000 1.0000 0.9938 0,9864 1.0000 0:9751 1.0000 0.9902 0.9894 1.0000 1.0000 1.0000 0:9859 1.0000 1.0000 1.0000 1.0000 1.0000 1.0000 1.oooo
. I . 0 0 0 0 I ; 0 0 0 0 1.0000
0;9858 0.9810 0.9758 0.9758 0.9758 0.9698 0.9566 0.9566 0/9328 0.9328 0.92'36 0'.9138 0.913'8 0.9138 0.9138 0.9009 0.9009 0.9009 0~9009 0.9009 0.9009 O:9009 0.9009 0.9009 0.9009 O. 9009
/
.?!
o.003 0.009 0.011 0.011 0.011 0.012 O. 015 0.0!5 0.020 0.020 0.022 0.024 0.024 0.024 0.024 O, 027 0,027 0.027 0;027 0/027 0.027 0:027 0,027 0.027 0.027 0.027

Ln
)
Tab le .B16.d
Comparison o f F i r s t O f f e n d e r Trea tment G r o u p s F o r Seve re Problem D r i n k e r s , Using the Leo-Desu S t a t i s t i c : F i r s t Acc iden t
O v e r a l l Compar.lson S t a t i s t i c 1 9 8 2 D.F. 2 Prob.
Group Name Total N Uncen
0 . 3 7 1 2 , NS
Cen Pct Cen Mean Score
Control 202 22 Home Study 223 20 In-Class 212 14
" 180 203 198
89 .11 - 9 . 5 3 4 7 91.03 -0 .31839 93.40 9 .4198
Pairwise Compariso n
Group Name
Statistic
TOtal N
0.406
Uncen
D.F.
Cen
1 Prob. 0 .5238 , NS
Pct Cen Mean Score
Control 202 22 Home Study 223 20
Pairwise Comparison statistic 2.045
180 89.11 -3.1139 203 91.03 2.8206
D.F, 1 Prob. 0 .1527 , NS
Group Name Total N Uncen Cen Pct Cen Mean Score
Control In-Class
202 212
22 14
180 89.11 -6.~208 198 93.40 6.1179
Pairwise Comparison Statistic 0.575 D.F. 1 Prob. 0.4484, NS
Group Name Tota l N Uneen Cen Pct Cen Mean Score
Home Study In-Class
223 212
20 203 91.03 -3.1399 19,~ 93.40 3.301q
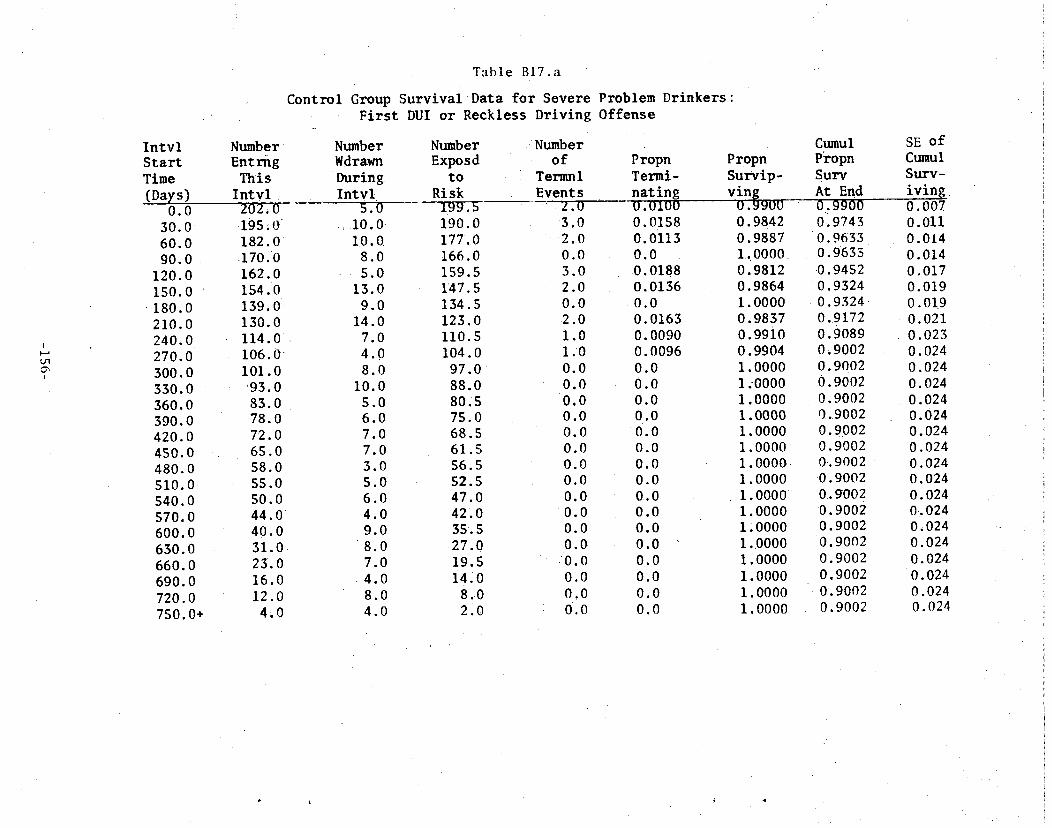
I
o~ I
I n t v l S t a r t Time (Days)
0.0 3 0 . 0 60.0 90.0
120.0 150.0 180.0 210.0 240.0 270.0 300.0 330.0 360.0 390.0 420.0 450.0 480.0 510.0 540.0 570.0 600.0 630.0 660.0 690.0 720.0 750.0+
Number Entrng This Intvl
2 0 2 . 0 195;0 1 8 2 . 0 170 .0 162.0 154.0 139.0 130.0 114.0 1 0 6 ; 0 101.0 9 3 . 0 83.0 78.0 72.0 65.0 5 8 . 0 55.0 50.0 44.0 40.0 31.0 23.0 16.0 12.0
4 . 0
Table B17.a
C o n t r o l G r o u p S u r v i v a l D a t a f o r Severe Problem D r i n k e r s : First DUI or Reckless Driving Offense
Number Wdrawn During I n t v l
5 .0 I 0 . 0 I0.0 8.0 5.0
13.0 9.0
14.0 7.0 4.0 8.0
10.0 5.0 6.0 7.0 7.0 3.0 5.0 6.0 4.0 9.0
8 . 0 7.0
4 . 0 8.0 4.0
Number Exposd
to R i s k
190.0 177.0 166.0 159.5 147.5 134.5 123.0 I I0.5 104.0
9 7 . 0 88.0 80,5 75.0 68.5 61.5 56.5 52.5 47.0 42.0 35.5
2 7 . 0 19.5 14.0 8.0 2~0
• . Number o f
Termnl Events
2 . O 3 . 0 2 . 0 0.0 3.0 2.0 0 .0 2 .0 1.0 1.0 0.0 0.0 0.0 0 .0 0 . 0 0.0 0.0 0.0 0.0 0.0 0 . 0 0 .0
:0 .0 0 . 0 0,0 0.0
Propn Termi- n a t i n g O.OlO0 0.0158 0.0113 0.0 0.0188 0.0136 0.0 0.0163 O. 0090 O. 0096 0.0 0.0 0.0 0.0 0.0 0.0 0 .0 0.0 0.0 0 .0 0 .0 0.0 0.0 0.0 0 . 0 0.0
Propn S u r v t p - v ing
0.9900 0.9842 0.9887 1,.0000 0.9812 0.9864 1.0000 0.9837 0.9910 0.9904 1.0000 1:0000 1.0000 1.0000 1.0000 1.0000 1.0000 1.0000 1.0000 1.0000 1,0000 1,0000 1.0000 1.0000 1.0000 1.0000
Cumul Propn S u r v
At End 0.9900 0.9743 0.9633 0.9635 0.9452
0.9324 0.9324 0.9172 0.9089 0.9002 0.9O02 0.9002 0.9002 0.9002 0.9002 0.9002 0-.9002 0,9002 0.9002 0,9002 0.9002
0 .9002 0.9002 0..9002 O.90O2 0.9002
SE of Cumul Surv- iving.. O. 007
0.011 0.014 0.014 0.017 0.019 O. 019 0.021 O. 023 O. 024 0.024 O. O24 0.024 O. 024 O. 024 O. 024 O. 024 O. 024 O. 024 0.024 O. 024 0.024 0.024 O. 024 0.024 0.024

I n t v l s t a r t Time.. (Days)
070
Home
Number Entrng This Intvl.
Study Group - First
Number Wdrawn Druing I n t v l
Table B17.b
S u r v i v a l Data For Severe Problem DUI or Reckless Driving Offense
Number Number '~ Exposd o f P r o p n
to T e r m l Termi- Risk Events " nating
D r i n k e r s :
Propn Survi- ving
223.0
Cumul propn
s u r v At End
4 . 0 221.0 3 . 0 0.0136 0.9864 0.9864
SE o f Cumul Surv - iving o.oo8
I
O~ "-d
¸0.0 60.0 90.0
120;0 150.0 180.0 210.0 240.0 270.0 300.0 330.0 360.0 390.0 42.0.0 450.0 480.0 510.0 540.0 570.0 600.0 630.0 660.0 690.0 720.0 750.0+
216.0 198.0 186.0 174.0
1 6 6 . 0 156.0 1 4 1 . 0 129.0 123.0 115.0 110.0
97.0 88.0 79.0 74.0 70.0 63.0 57.0 49.0 41.0 31.0 25.0 19.0 11.0 2.0
13.0 I0.0 11.0
7.0 I0.0 14.0 i0.0
6.0 6 .0 5.0
13.0 9.0 8.0 5.0 3.0
7 .0 6.0 6.0
7 . 0 10.0 6.0 6.0 8.0 9.0 2.0
209.5 193.0 180.5 170.5 161.0 149.0 136.0 126.0 120.0 112.5 103.5
9 2 , 5 84.0 76.5 72.5 66.5 60.0 54.0 45.5 36.0 28.0 22..0 15.0 6.5 1.0
, 4
S. 0 2 .0 1.0 1.0
0 , 0 1 . 0
2 . 0 0.0 2.0 0.0 0 .0
0 , 0 1.0 0,0 1.0
0 . 0 0 .0 2 .0 1.0 0.0 0.0 0.0 0.0 0.0
0 . 0
0.0239 0.0104 O. OOS5 O. 0059 0.0 O. 0067 0.0147 0.0 0.0167 0.0 0.0 0.0 0,0119 0.0 0.0138 0.0 0.0 O. 0370 0.0220 0.0 0 . 0 0.0 0.0 0.0 0 . 0
0 . 9 7 6 1 0.9896 0.9945 0.9941 1 . 0 0 0 0 0 . 9 9 3 3 0.9853 1.0000 0.9833 1.0000 1..0000 1.0000 0.9881 1.0000 0.9862 1,0000 1.0000 0.9630 0.9780 1.0000 1.0000 1.0000 1.0000 1.0000 1.0000
O. 9629 O. 9529 0.9476 0.9421 O. 9421 O. 9357 0.9220 0.9220 O. 9066 O. 9066 0. 9066 O. 9066
. .0.8958 O. 8958 0.8835 0.8835 0.8835 0.8507 O. 8320 0.8320 ,0.8320 0 . 8 3 2 0 o.832o 0.8320 0~8320
0.013 0.015 0.015 0.016 0.016 0.017 0.020 0.020 0.022 0.022 0.022 0.022 0.024 0.024 0.027 0.027 0.027 O. 034 0.058 0.038 0.038 0.038 0]038 0.038 O. 038

~n CO
I n t v l S t a r t Time (Days)
0.0 30.0 60.0 90.0
120.0 150.0 180. O: 210 .0 240.0 270 .0 300.0 330.0 360.0 390.0 420.0 450.0 480.0 510.0 540.0 570.0 600.0 630.0 660.0 690.0 720.0 750.0+
Table B17.c
I n - C l a s s Group S u r v i v a l Data f o r Severe Problem D r i n k e r s : : . F i r s t DUI o r Reck le s s Dr iv ing O f f e n s e
Number Entrng this Intvl
Number Wdrawn During I n t v l
212.0 211.0 197.0 183.0 1 7 7 . 0 167.0 145.0 136.0 121.0
0 .0 11.0 14.0 5 . 0 8.0
19.0 8.0
13.0 15.0
105.0 99..0 92.0 83.0 75.0 73.0 66.0 64.0 58.0 54.0 52.0 4 3 . 0 34.0 28.0 19:0 12:0
4.0
S°O 6.0 8.0 8.0 2.0 7.0 2.0 6.0 3.0 2 .0 9.0 9.0
6 . 0 19 .0
7.O 8 .0 4 .0
Number Exposed
t o Risk
212.0 205..5 190.0 180.5 173.0 1-57.5 141.0 129.5 113.5 102.5
96,0 8 8 . 0
79.0 74:0 69.5 65.0 61!.0 56.5
" 53.0 4 7 . 5 3 8 . 5 31.0 23.5 15.5 8 . 0
" 2.0
Number o f
Ter nl Events
1.0 3.0 0.0 1.0 2.0 3.0 1.0 2.0 1.O 1.0 1.0 1.O 0.0 0.0 0.0 0.0 0.0 1.0 0.0 0.0 0.0 . 0.0 0.0 0.0 0.0 0.0
Propn Termi- n a t i n g 0 .0047 O. 0146 0.0 0 .0055 0 . 0 1 1 6 0.0190 O. 0071 0.0154 O. 0088 O. 0098 0.0104 O. 0114 0 . 0 0.0 0.0 0.O 0 . 0 0 . 0 1 7 7 0.0 0 .0 0 . 0 o~o
.0" 0 .0 0.0 0 . 0
Propn Survi- ving 0.9953 0.9854 1.0000 0.9945 0.9884 0.9810 0.9929 0.9846 0.9912 0 .9902 0.9896 0.9886 1.0000 1.0000 1.0000 1.0000 1.0000 0.9823 1.0000 li0000 1.0000 1.0000 1.0000 1 . 0 0 0 0 1.0000 1.0000
C u m u l Propn
S u r v
At End 0.9953 0.9808 0.9808
:0.9753 0.9640 0.9457 0.9390 0.9245 0.9163 0.9074 0.8979 0.8877
0 .8877 0.8877 0.8877 0.8877 0.8877 0.8720 0.8720 0.8720 0.8720 0.8720 0 .8720 0-.8720 •0.8720 0.8.720
SE o f Cumul Surv- zv lng O. 005 0.010 0.010 0.011 0.013 0.017 0.018 0.020 0.022 0.023 0.025 0.027 0.027 O.O27 0.027 0.027 0 027 0 030 0 030 0 030 0 030 0 030
o 030 O. 030 0.030 0.030
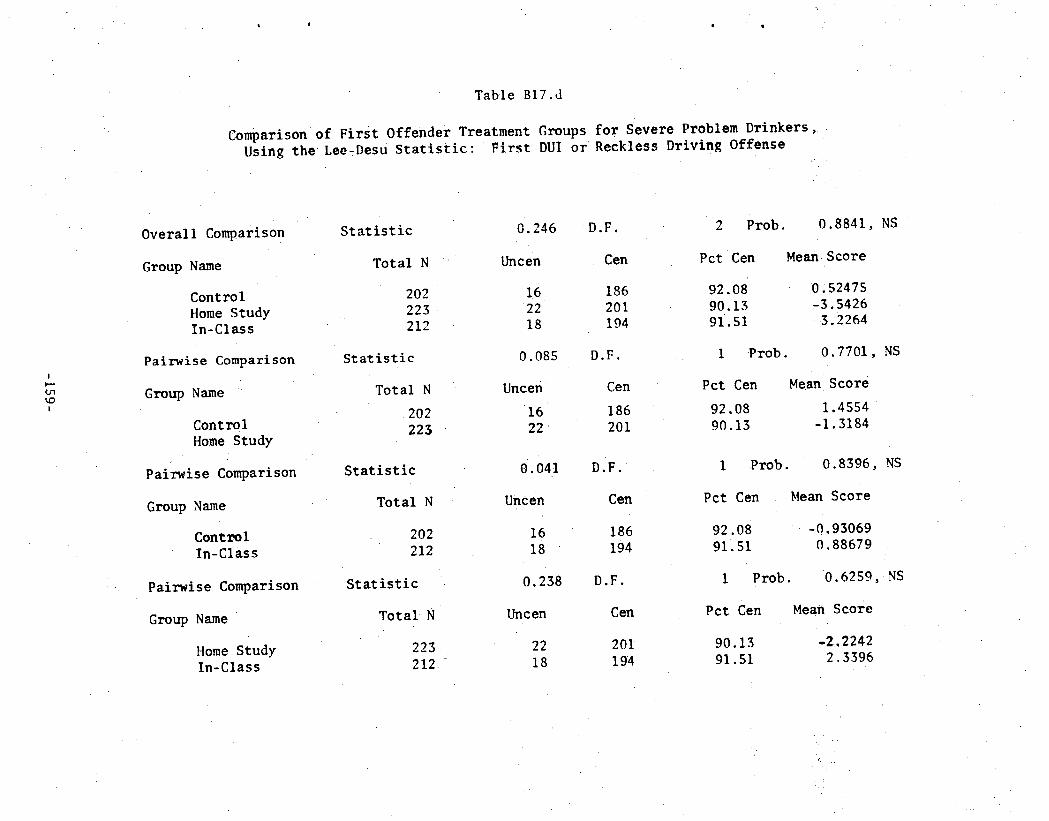
Table B17.d
Comparison of F i r s t Of fender Trea tment Groups f o r Severe Problem D r i n k e r s , Using the Lee~Desu S t a t i s t i c : F i r s t DUI or Reckless Driving Offense
I
I
Overa l l Comparison
Group Name
Cont ro l Home Study. I n - C l a s s
Pa i rwise Comparison
Group Name
C o n t r o l Home Study
Pa i rwise Comparison
Group Name
Cont ro l In-Class
Pairwise Comparison
Group Name
Home Study In-Class
S t a t i s t i c
To ta l N
202 2 2 3 212
S t a t i s t i c
To ta l N
202 225
S t a t i s t i c
To ta l N
2O2 212
S t a t i s t i c
T o t a l - N
225 2 1 2 :
0.246
Uncen
16 22 18
0.085
Uncen
1 6 2 2
0.041
Uncen
16 18
0.238
Uncen
22 18
D.F.
Cen
186 201 194
D.F.
Cen
186 201
D.F.
ten
186 194
D.F.
Cen
201 194
2 Prob. 0 .8841, NS
Pct Cen Mean Score
92.08 0.52475 90.13 -3.5426 91.51 3 . 2 2 6 4
1 •Prob. 0 .7701, NS
Pct Cen MeanlScore
92.08 1.4554 90.13 -1.3184
1 Prob . 0 .8396, NS
Pct Cen Mean Score
92.08 -0.93069 91.51 0.88679
1 Prob. 0.6259,
Pct Cen Mean score
90.13 -2.2242 91.51 2.3396
NS
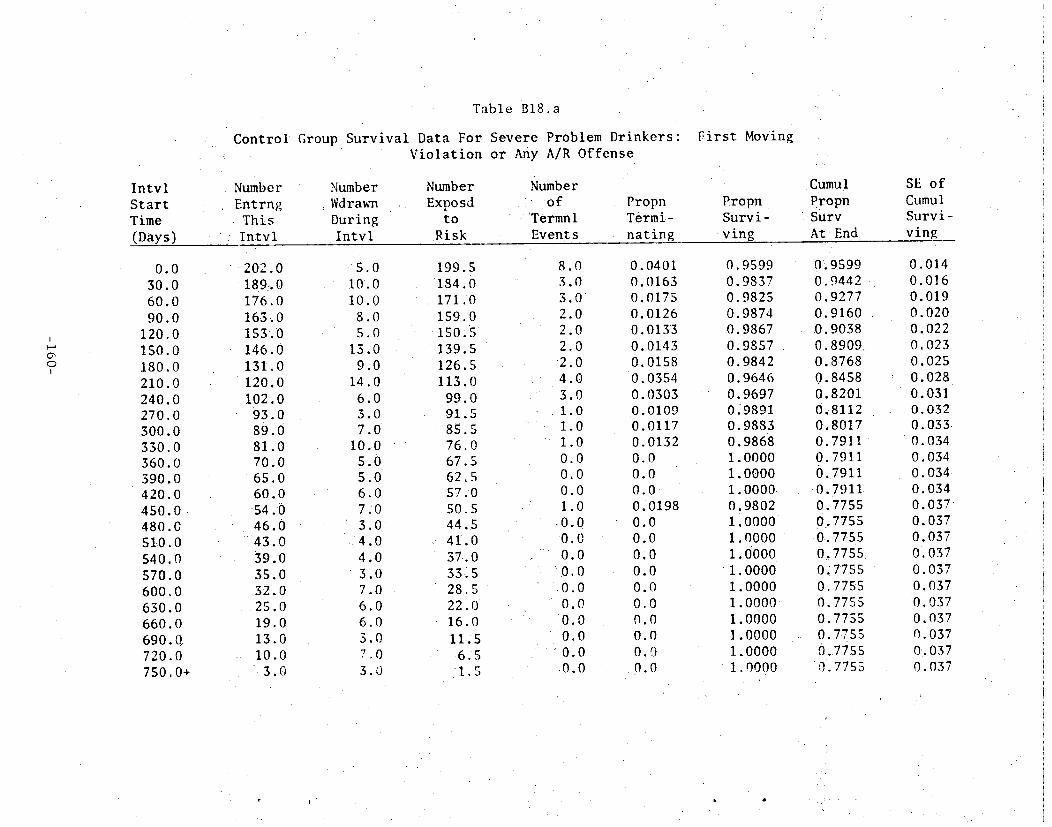
f
I
0 I
Intvl Start Time (Days)
0 .0 30 .0 60 .0 90 .0
120.0 150.0 180.0 210.0 240.0 270.0 300.0 330.0 3 6 0 . 0 390.0 420 .0 450 .0 480 .0 S10.0 540.0 570.0 600 ,0 630 .0 66O. 0 690. O, 720.0 750.0+
"Fable Bl8.a
C o n t r o l Group S u r v i v a l
Number Entrng This Intvl
Data For Violation
Number Wdrawn During Intvl
Number Exposd
to Risk
Seve re Problem D r i n k e r s : or Any A/R O f f e n s e
Number of
'Termnl Events
Propn Termi- nating
F i r s t Moving
Propn S u r v i -
v i n g
202.0 189>0 176.0 163,0 153.0 146..0 131.0 120.0 102.0
93 .0 8 9 . 0 81.0
7 0 . 0 6 5 . 0
60 .0 5 4 . 0 46 .0
4 3 . 0 39.0 35.0 32 .0
2 5 . 0 19.0 13.0 10.0 3.0
: 5 . 0 10.0 10.0
8 .0 5 .0
1 3 . 0 9 .0
14.0 6 .0 3 .0 7 . 0
10.0 5 .0 5 .0 6 .0 7 :0 3 .0
; 4 . 0 4 .0
3 . 0 7 .0 6 .0 6 .0 3 .0 7 .0 3 .0
199.5 1 8 4 . 0 171.:0 159.0
15o;5 139.5 126.5 113.o
99.0 91.S 85.5 76 .0 67.5 62.5 57 .0
.50 ,5 44 .5 41.0 37-.0 33;5 28.5 22.0 16..0 11,5 6~5 1.5
8 .0 3 .0 3 . 0 2 .0 2 .0 2 .0 2 . 0 4 .0 S.0 1 .0 1 .0 1 .0 0 .0 0 .0 0 .0 1.0
0 . 0 0 . 0 0 .0
L0.0 :0 .0 0 .0 0 .0 0 .0 0 .0 0 . 0
0.0401 0.0163 0.0175 0.0126 O. 0133 0.0143 0.0158 0. 0354 0.0303 0.O109 0.0117 0.0132 0 .0 0 .0 0 . 0 0.0198 0.0 0.0 0:0 0.0 0.0 0.0 0.0 0.0 0.0
0.9599 0.9837 0.9825 0.9874 0.9867 0 . 9 8 5 7 0.9842 0.9646 0.9697 0.9891 0.9883 0.9868 1.0000 1.0000 1.0000 0.9802 1 . 0 0 0 0 1 . 0 0 0 0 1.0000 1.0000 1.0000 1 . 0 0 0 0 1.0000 1.0000 1.0000 1.0000
.<..
Cumu! Propn .Surv At,End
0.9599 0 . 9 4 4 2 O.9277 0 .9160 0 .9038 0 . 8 9 0 9 0.8768 0.8458 0.8201 0,8112 0.8017 0 . 7 9 1 ! 0.7911 0.7911
0.7911 0.7755 0,7755
0 . 7 7 5 5 0 , 7 7 5 5
0~7755 0.7755 0 .7755 0.7755 0.7-7.55 0.7755
0 . 7 7 5 5
S E o f Cumul S u r v i - v i n g
0.014 0.016 0 .019 0 .020 0.022 0.023 0.025 0.028 O. 031 0.032 0 . 0 3 3 0.034 0.034 0. 034 0.034 0 . 0 3 7 0.037 0.037 0.037 0.037 0. 037 0.037 0.037 0.037 0..037 0.037
f

Intvl Start Time (Days)
liome Study
Number Entrng
This- I n t v l
Table B18.b
Group S u r v i v a L D a t a For Seve re Problem D r i n k e r s : o r Any A/R O f f e n s e
Number Wdrawn During
. I n t v l
Number Number Exposd o f
to Termnl Risk Events
• Propn Termi- n a t i n g
F i r s t Moving
Propn S u r v i -
• v ing
V i o l a t i o n
Cumul Propn Surv At End
SE o f Cumu 1 Surv i - ving
I
C~ I
3 0 . 0 60 .0 90 .0
120.0 150.0 180.0 210.0 240.0 270..0 300.0 330.0 360~0 390.0 420.0 450.0 480.0 51010 540.0 570~0 60O.O 630.0 660.0 69O. 0 720.0 750.0+
223..0 214.0 194.0 181.0 166.0 I55 .0 143.0 124 .0 112.0 104.0 98.0 93.0 81.0 72.0 62.0 58.0 54.0 47.0 43.0 34 .0 29.0 21.0 17.0 14.0 I0., 0 2.(~
.0 13.0 10.0 11.0
7 .0 10.0 14.0 10.0
6 .0 6 .0 5 .0
I 2 0 8 .0 8 .0 4 .0 3 .0 7 .0 4 .0 6 .0 S.O 8.0 4 .0
3 . 0 4 .0 8 .0 2 .0
221.0 207.5 189.0 175.5 162.5 150.0 136.0 119.0 109.0 -101.0
95.5 87.0 77.0 68 .0 60.0 56.5
50.5 4 S . 0
40.0 3 ! .5 25.0 19.0 1s.5 12.0 6 . 0 1 . 0
5.0 7.0 3.0 4.0 4.0 2.0 S,O 2.0 2.0 0.0
0 . 0 0.0 1.0 2.0 0 . 0 1.0 0 .0
0 . 0 3.0 0.0 0.0 0.0 0 .0 0 . 0 0 .0 0 . 0
0.0226 010337 0.0159 0.0228 0.0246 0.0133 0.0368 0;0168 0.9183 0 . 0 0.0 0.0 0.0130 0.0294 0,0 0.0177 O. 0 0.0 0.0750 0,0 0.0 0.0 0.0 0.0 0.0 0.0
0.9774 0.9663 0.9841 0.9772 0.9754 0.9867 0.9632 0.9832 019817 1.0000 1.0000 1.0000 0.9870 0.9706
1.0000 0.9823 1.0000 1.0000 0.9250 1.0000 1.9000 1.oooo 1.0000 1.oooo 1.0000 1.0000
0.9774 0.9444 019294 0.9082 0.8859 0.8741 0.8419 0.8278 0.8126 0.8126 0.8126 0.8126 0.8020 0,7784 0.7784 0.7647 0.7647
0 . 7 6 4 7 0.7073 O.7073 0.7073 0.7073 0.7073 0.7073 0.7073 0.7073
0,010 0.016 0.018 0.O2O 0.023 0.024 0.027 O. 028 0.030 0.030 0.030 0.030 0.031 O. 034 0.034 0.036 O. 036 0.036 0 046 0 046
0 046 9 046 0 046 0 046 0 046 O. 946
0 /
Intvl Start Time (Days)
I n - C l a s s .Group S u r v i v a l
Number Entrng
T h i s I n t v l
Number Wdrawn During I n t v l
Tab le BlS .c
Data or Any A/R Offense
Number Number Exposd of
to ,Termnl Risk .Even t s
For Seve re Problem D r i n k e r s : F i r s t
Propn Termi- nating
i
Hoving
Propn S u r v i - v ing
Violation
Cumul propn Surv At End
SE of Cumul Survi= ving
I
i
0 . 0 30.0 60 .0 9 0 . 0
120 .O 150.0 180.0 210.0 240.0 270.0 300,0 330.0 360.0 390.0 420.0 450.0 480.0 510.0 540.0 570.0 600.0 630,0 660.0 690.0 720. u 750.0*
212.0 205.0
1 9 0 . 0 174.0 164.0 153.0 131 ,0 120.0 107.0
89.0 8 3 . 0 77.0 69 .0 60:. 0 5 8 . 0 52 .0 50 .0 44.0 40.0 38 .0 31 .0 23.0 19.0 11.0
7 .0 2 .0
0 .0 11.0 14.0
5.0 8 .0
19.0 8 . 0 11.0 15.0 4 . 0 5 .0
6 . 0 8 .0 1:. 0 5 .0 2.0 6.0 3.0 2.0 7.0 8.0 4 . 0 8.0 4.0 5.0 2.0
212.0 1 9 9 . 5 183~0 171.5 1 6 0 . 0 143.5 127.0 1.14.5 99.5 87 .0 8 0 . 5 ,74.0 65 .0 59.5 55.5 51.0 47.0 42.5 39 .0 34.5 27.O 21.0 15.o 9 , 0 4;.5
1 . 0
7•,0 • f
4.0 2,0 5.0 3.0 3.0
3 . 0 2.0 3.0 2.0 1.0 2.0 1.0 1.0 1 . 0 0.0 0.0 1.0 0.0 0.0 0.0 0.0 0.0 0.0 0.0 0.0
0,0330 0.0201 0.0109 0.0292 0.0188 0.0209 0.0236 0.0175 O. 0302 0.0230 O. 012'4 0.0270 0.0154 0.0168 0 .0180 0 .0 0 . 0 0.0235 0 .0 0 ,0 O t' 0
0 . 0 0 . 0 0 .0 0 .0 0 .0
0:9670 0.9799 0.9891 0.9708 0.9813 0.9791 0.9764 0.9825 0.9698 0.9770 0.9876 0.9730 0.9846 0.9832 0.9820 1.0000 1.0000 0.9765 1.0000 1.0000 1.0000 1.0000 1.0000 1.0000 1.0000 1.0000
0 .9670 0 .9476 0 . 9 3 7 2 0.9099 0.8929 0.8742 0.8535 0.8386 0.8133 0.7946 027848 0.7636 0~7518 0.7392 0.7259 0;7259 0 .7259 0.7088 0.7088 0.7088 0;7088• 0 .7088 0.7088 0.7088 0.7088 0.7088
0.012 O.O1S 0.017 0.020 0.022 0.024 0 .026 0 : 0 2 8 o.o3i 0.033 0.034 0.,036
0 . 0 3 7 0.039 O. 04O O. 040 0.040 O. 043 0.043 0.043 O, 043 O, 043 0 .043 0.043 O. 043 0.043
• ¢ t •
Table BlS.d
Comparison of First Offender Treatment Groups For Severe Problem Drinkers, Using the Lee-Desu Statistic: First Moving Violation or Any A/R Offense
L~
I
Overall Comparison
Group Name
Control Home Study In-Class
Pairwise Comparison
Group Name
Control Home Study
Pairwise Comparison
Group Name
Control I n - C l a s s
P a i r w i s e Compar i son
Group Name
Home Study In-Class
Statistic 0.209
Total N Uncen
202 33. 223 41 212 41
Statistic 0.069
Total N Uncen
202 33 2 2 3 41
Statistic 0.221
Total N Uncen
202 33 212 41
Statistic 0.029
Total N Uncen
223 41 212 41
D.F.
Cen
169 182 171
D.F.
Cen
169 182
D.F.
C e n
169 17I
D . F .
Cen
182 171
2 Prob. 0.9009, NS
Pct Cen Mean Score
83.66 4.8119 81.61 -0.49776 80.66 -4.0613
1 Prob. 0.7928, NS
Pct Cen Mean Score
83.66 1.7574 81.61 -1 .5 9 1 9
1 Prob . 0 .6385 , NS
Pct Cen Mean Score
83.66 3.0545 80.66 -2.9104
1 Prob. O.8641, NS
Pct Cen Mean Score
81.61 1.0942 80.66 -I.1509
• . • • . . ,
z
APPENi)IX C
Survival • Data and Test Statistic
• Summary Tab i es
for Letter Honitoring and Follow-Up
Interview Analyses
- ] 6 4 -

AIWENI) IX C [)IRECTORY
Letter Hon!toring (Total Assigned) .......................... 166
Accident 166
DUI/Reckless ... ........................................ 169
Hoving Violatioll ................ ....................... 172
FollowiUp Interviews (Total Assigned) ....................... 175
Accident ............................................... 17S
DUI/Reckless ........................................... 178
Hoving Violation 181
-165--
Intvl S t a r t Time (Days
S u r v i v a l Data For
Number Entrng This
) I n t v l
Table C l . a
clients Receiving Quarterly Monitoring
Numbe r Wdrawn During I n t v l
Number Exposd
to,. Risk
Number .-,of :Termnl Events
I , e t t e r s
P r o p n Termi- nating
F i r s t
Propn Survi- ving
Acc iden t •
Cumul P ropn Surv At End
SE of Cumul Survi- ving
I
o', c ,
0.0 30.0 60.0 90.0
120.0 150.0 180.0 210.0 240.0 270.0 300.0 330.0 360.0 390,0 420.0 450.0 480.0 SlO.O 540.0
5 7 0 . 0 600.0
6 3 0 . 0 660.0 690.0 720.O 750~0+
1926.0 1891.0 1817.0 1734,0 1658.0 1562.0 1439..0 1323;0 1192.0 1069..0
975.0 896.0 822.0 699.0 601.0 537.0 477.0 4,15.0 359.0 3 ! 0 . 0 236.0 184.0 158 .0 116.0
83.0 26.0
16.0 59 .0 61.0 56.0 86.0
111.0 109.0 128.0 111.0 84.0 72.0
6 8 . O 118.0 89.0 60.0 55.0 60.O 54. • 47.0 73.0 52.0 26.0 42.0 33.0 57.0 26.0
1918.0 1861;5 1786.5 1706.0 1615.0 1506.5 1384:5 1259..0 1136.5 1027.0 939 .0 862.0 763.0 654.=5 . 571,0 509.5 447.0 388:0 335.5 273~5 210.0 171.0 137,,0 99:5 54.5 13.0
i 9 , 0 1 5 . 0 22.0 20.0 10 .0 12.0 7 . 0 3.0
: 1 2 . 0 10.0
7 .0 6 . 0 S.O 9.0 4.0
5 . 0 2 . 0 : 2 . 0 2 . 0 ! " . 0
~0.0 ,0 ,0 O . 0
• O o0
/ , 0 .0 0.0
0.0099 0.0081
0 . 0 1 2 3 0.0117 0.0062 0.0080
0 .0051 O. 0024 0.0106 O. 0097 0.0075 0.0070 O. 0066 0.0138 0.0070 0.0098 0.0045 0.0052 0 ,-0060 0.0037 0.0 0 . 0 0.0 0.0 0.0 0.0
0,990i o.9919 0.9877 0.9883 o.9938 0.9920 0 .9949 0,,_9976 0.9894 0.9903 0.9925 0 . 9 9 3 0 0.9934 0 . 9 8 6 2 0 . 9 9 3 0 , 0 . 9 9 0 2 0.9955 0.9948
-0.9940 0 . 9 9 6 3 1.0000 1.0ooo
:1 .0000 1.0000 1;0000 1.0000
~0.9901 0 . 9 8 2 1 ~0.9700
0.9586 0 . 9 5 2 7
• i 0 ,945 i 0 . 9 4 0 3 0 . 9 3 8 1 0.9282 10.9192 0.9123
10.9060 0 . 9 0 0 0
0 .8876 0 . 8 8 1 4 0 . 8 7 2 8
0.8689 0.8644 0 .8592 0 . 8 5 6 1 0 ; 8 5 6 1 0.8561 0.8561 0,8561
0 . 8 5 6 1 0.8561
O. 002 O. 003 O. 004 O. 005 0.005 O.OOS O. 006 O. 006 O. 006 O. 007 O. 007 O. 008 0.008 0.009 O. 009 0.010 0.010 0.011 0.011 0.012 0.012 0.012 0.012 0.012 O, 012 0:012
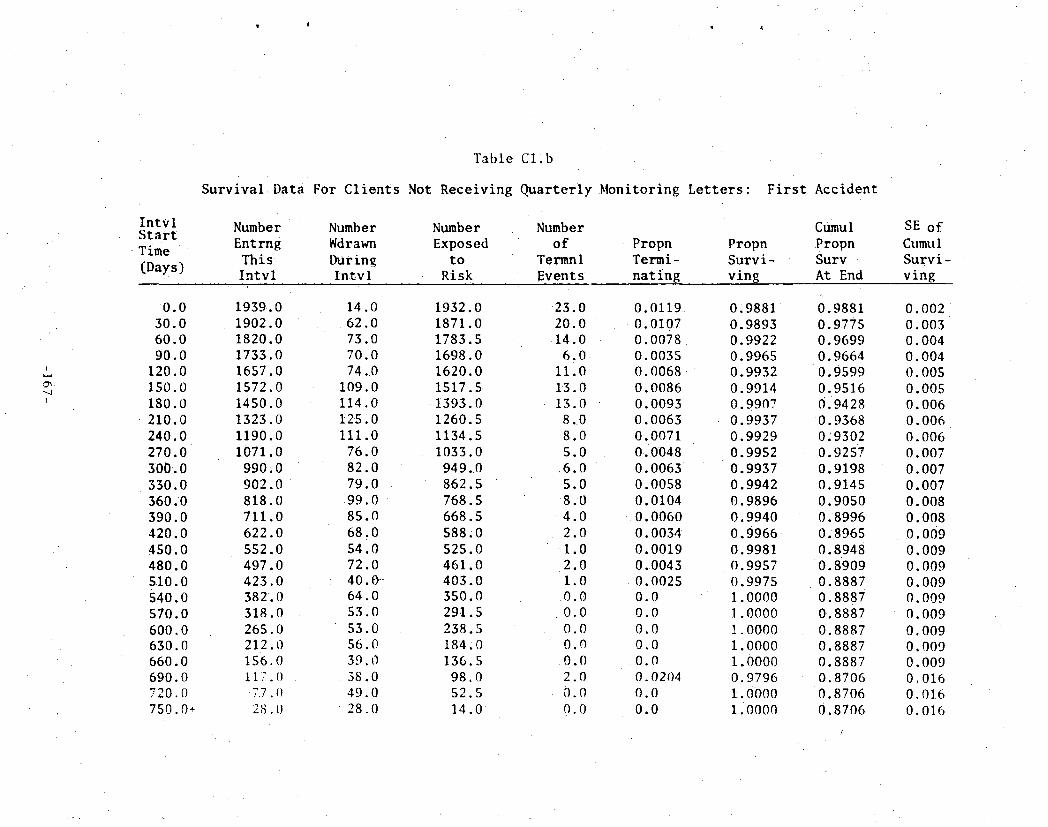
• f ! •
L -.J
I
I n t v l S t a r t Time (Days)
0 . 0 30 .0 60 .0 90 .0
120.0 150.0 180.0 210.0 240 .0 270 .0 300.0 330.0 360.0 390.0 420.0 450 .0 480 .0 5 1 0 . 0 $40.0 570.0 600.0 630.0 660.0 690 .0 720.0 750.0+
T a b l e C l . b
S u r v i v a l Data For C l i e n t s Not R e c e i v i n g Q u a r t e r l y M o n i t o r i n g
Number Number En t rng Wdrawn This During I n t v l In~vl
Number Number Exposed o f
to Termnl Risk Even t s
Propn Termi - nating
1939.0 1902.0 i 8 2 0 . 0 1733.0 1657.0 1572.0 1450.0 1323.0 1190.0 1071.0
990 .0 902 .0 818 .0 711 .0 622 .0 552 .0 497 .0 423 .0 382 .0 318.0 265.0 212.0 156.0 117.0 77.0 28.0
14.0 62.0 73.0 70.0 74.0
109.0 114.0 125.0 Iii.0 76.0 82.0 79.0 99.0 85 .0 68 .0 54.0 72.0 4 0 . f f 64.0 53.0 53.0 56 .0 39 .0 38 .0 49.0 28.0
1 9 3 2 . 0 1871.0 1783 .5 1698.0 1620.0 1517.5
1 3 9 3 . 0 1260.5 1134.5 1033.0
949..0 862 .5 768.5 668 .5 588 ;0 525 .0 461 .0 403.0 350.0 291.5 238;5 184;0 136.5 98.0 52.5 1 4 . 0
2 3 . 0 20 .0
1 4 . 0 6 .0
1 1 . 0 13.0 13.0
8 .0 8 .0 5 .0
. 6 .0 5 . 0
8 . 0 4 . 0 2 .0
1 . 0 2 . 0 1 .0
0 . 0 0 .0 0 .0 0 .0
0 . 0 2 .0 0 .0 0 .0
0.0119• • O. 0107 0.0078 0.0035 0.0068 • 0 .0086 0 .0093 O. 0063 0.0071 0 .0048 O. 0063 0.0058 0. 0104
• O. 0060 0. 0034 0 .0019 0.0043 0.0025 0 . 0 0.0 0.0 0.0
0 . 0 O. 0204 0.0 0.0
L e t t e r s :
Propn Survi- ving
0 . 9 8 8 1 0 .9893 0 .9922 0 .9965 0 .9932 0 .9914 0.9907 0 .9937 0 .9 9 2 9 0.9952 0 .9937 0 .9942 0 .9896 0 .9940 0 .9966 0.9981 0.9957 0 .9975 1.0000 1.0000 1.0000 1.0000 1.0000 0 .9796 1.0ooo 1.0000
F i r s t Accident
Cumul Propn Surv At End
SE o f Cumu 1 S u r v i - v i n g
0.9881 0 .9775 0 .9699 0 .9664 0 .9599 0 .9516 0 .9428 0.9368 O:9302 0.9257 0 .9198 0 .9145 0.9050 0,8996 0.8965 0.8948
0 .8909 0.8887 0.8887 0.8887 0 .8887 0.8887 0.8887 0.8706 0.8706 0.8706
O. 002 O. 003 O. 004 0. 004 0.005 0.005 0.006 0.006 O. 006 0.007 0 .007 0 .007 0 .008 0. 008 0. 009 0. 009 0. 009 0 .009 0. 009 0.009 O. 009 0 .009 0 .009 0 .016 0. 016 0 .016
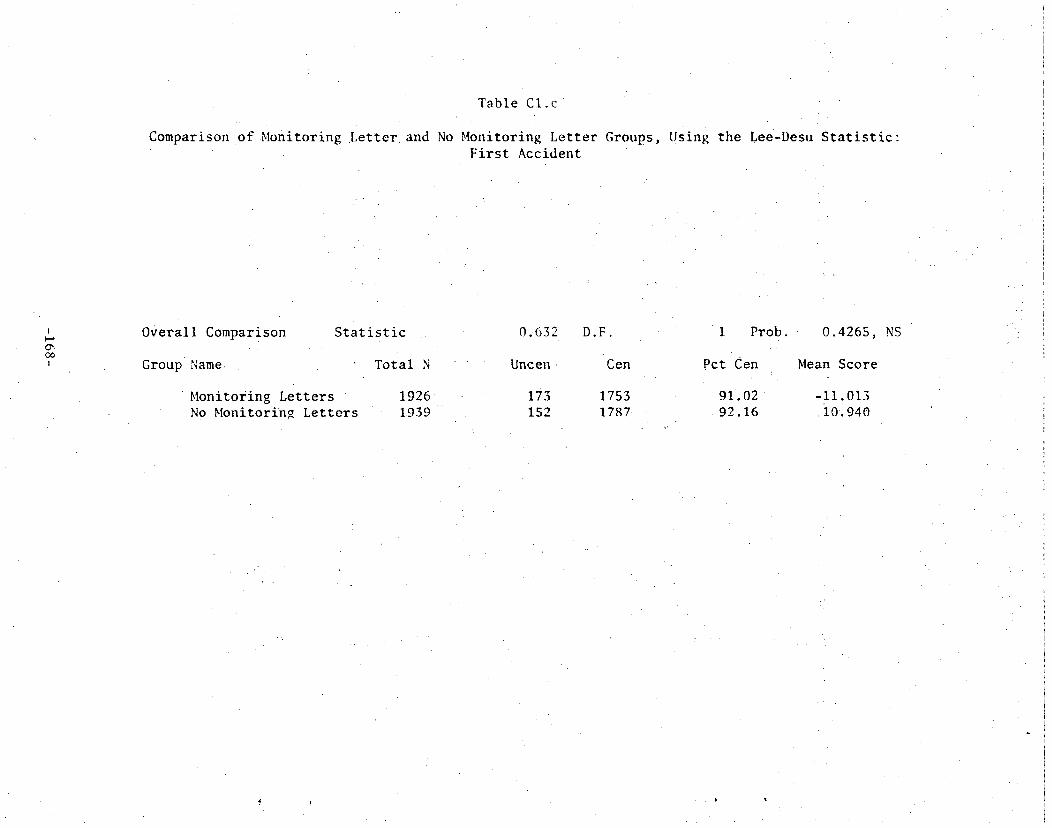
Table C l . c
Comparison of Monitoring Letter. and No Monitoring Letter Groups, Using the Lee-Desu Statistic: • F i r s t Accident
1
co
O v e r a l l Comparison
Group Name.
Statistic
T o t a l N
Monitoring Letters No Monitorin~ Letters
1 9 2 6 1.939
0..632 D . F .
Uncen . Cen
173 1753 152 1787
1 Prob. 0.4265, NS
Pct Cen Mean Score
91.02 -11.013 92.16 i0.940

S u r v i v a l
I n t v l Start Time (Days)
Data For
Number Entrng This Intvl
Table c2.a
C l i e n t s R e c e i v i n g q u a r t e r l y Mon i to r ing Dr iv ing O f f e n s e
Number Wdrawn During I n t v l
Number Number Exposd o f
to Termnl R i s k . Events
L e t t e r s :
Propn Termi- n a t i n g
First DUI or
P r o p n S u r v i - v ing
R e c k l e s s
Cumul Propn Surv At End
SE o f Cumu I Surv i - ving
)..-*
LO I
0.0 30.0 60.0 90.0
1 2 0 . 0 150.0 180.0 210.0 240.0 270.0 300.0 330.0 360.0 390.0 420.0 450.0 480.0 510.0 540.0 570.0 600.0 630.0 660.0 690.0 720.0 750. O+
1926 .0 1891,0 1812.0 1736.0 1663.0 1570.0 1442.0 1324.0 I184.0 •1069.0
975.0 898.0 821.0 708.0
6 1 0 . 0 549.0 486.0
• 426.O 370.0 324.0 253.0 193.0 162.0 117.0
82.0 31.0
1 6 . 0 59.0 6 1 . 0 56.0 87.0
117.0 108.0 130.0 110.0
88 .0 7 2 0 73 0
110 0 97 O 59 0 62 0 60 0 56 0 45.0 7 0 . 0 6O 0 31 0 45 0 35 9 51 0 31 0
1918.0 1861.5 1781.5 1708.0 1619.5 1511.5 1388.0 1259.0 1129.0 1,025,.0
939 .0 861.5 766.0 659.5 580.5 518:0 456 .0 398.0 347..5 289.0 223.0 177.5 139.5
99.5 56.5 15.5
19.0 20.0 15.0 17.0
6 .0 11.0 10.0 10.0
5 .0 6 .0 5 .0 4 .0 3 .0 1 . 0 2 .0 1 .0 0 .0 0 .0 1 .0 1 .0 0 . 0
0 . 0 0 . 0 0 .0 0 .0 0 .0
0. 0099 0 . 0 1 0 7 0. 0084 0.0100 0. 0037 0. 0073 0.0072 0.0079 O, 0044 0. 0059 0.0053 O. 0046 0.0039 O. 0015 0.0034 0.0019 0.0 0 . 0 0.0029 0.0035 0.0 0 ,0 0 .0 0 .0 0 .0 0 .0
0.9901 0.9893 0.9916 0.9900 0 . 9 9 6 3 0.9927 0.9928 0.9921 0 . 9 9 5 6 0.9941 0.9947 0.9954 0.9961 0.9985 0.9966 0.9981 1.0000 1.0000 0.9971 0.9965 1.oooo 1.0000 1.0000 1.0000 1.0000 1 .0000
0.9901 0.9795 0.9712 0.9615 0.9580 0.9510 0.9442 0.9367 0.9325 0.9271 0.9221 0 . 9 i 7 8 0.9142 0.9129 0 .9097 0 .9080 0 . 9 0 8 0 0.9080 0.9053 O.9O22 0.9022 0.9022 0.9022 0.9022 0.9022 0,9022
0.002 0.003 O. 004 0.004 0.005 0.005 0.006 O. 006 O. 006 0.007 0.007 0.007 O. 007 0.008 0. 008 0. 008 0. 008 O. 008 0.008 O. 0O9 0.009 0.009 0. 009 O. 009 0.~09 0 .009
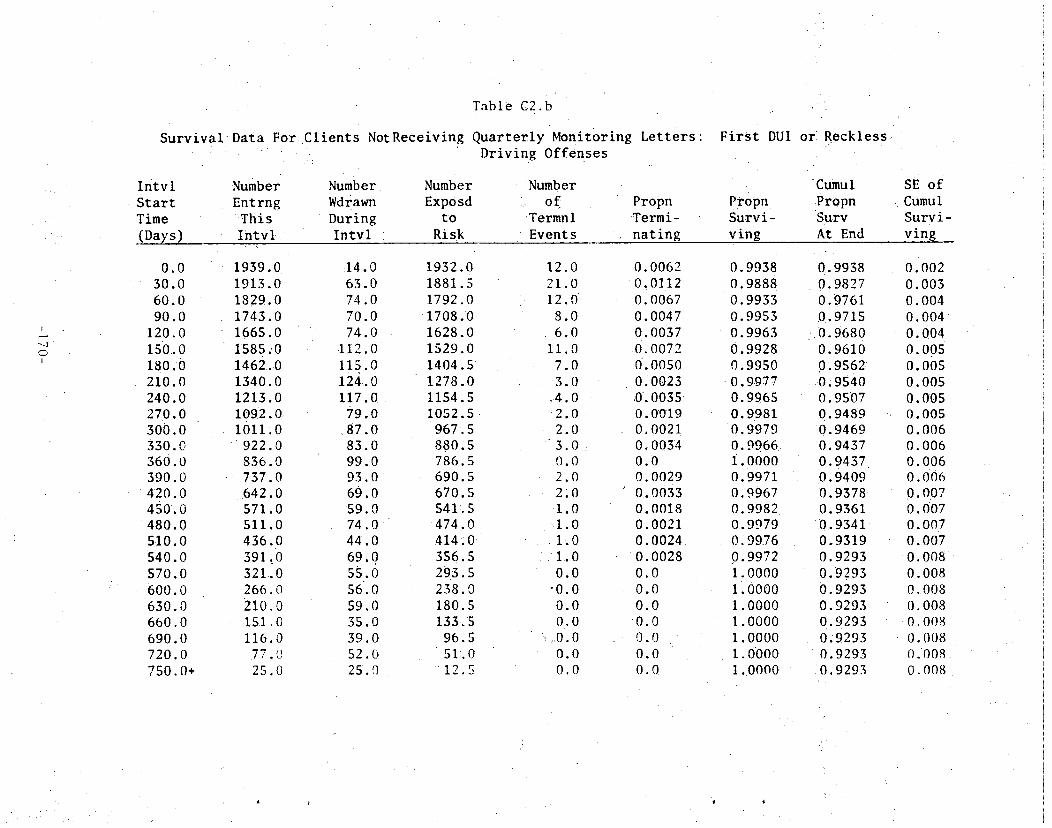
T a b l e C2.b
S u r v i v a l D a t a For C l i e n t s N o t R e c e i v i n g Quarterly Monitoring D r i v i n g O f f e n s e s
I n t v l S t a r t Time (Days)
Number Entrng This Intvl
Number wdrawn During Intvl
Number Exposd
to Risk
Number of
Termnl E v e n t s
L e t t e r s :
Propn Termi- nating
First DUI
Propn Survi- ving
or R e c k l e s s
Cumul Propn Surv At End
sE of Cumul Survi- ving
I
I
0 .0 30 .0 60 .0 90 .0
120.0 150 .0 180.0 210 .0 240 .0 270 .0 300 .0 330.0 360.O 390.0 420.0 4so.o 480.0 510.0 540.0 570 .0 600 .0 630 .0 660 .0 690 .0 720 .0 750,0+
1939.0 1913.0 1829.0 1743.0 1665.0 1585..0 1462.,0 1340.0 1213.0 1 0 9 2 . 0 1011:0
922 .0 836.0 73720
,642.0 571.0 •511.0 436.0 391.0 321.0 266.0 210 .0 1510 116.0 77.U 25.0
1 4 ; 0 63 .0 74 .0 70 .0 74 .0
112 .0 115.0 1 2 4 . 0 117 .0
79 .0 8 7 . 0 83.0 99.0 93 .0 69 .0 59 .0 74 .0 44 .0 69 .0 55 .0 56 .0 59 ,0 35 .0 39 .0 52 .0 25.~
1932.0 1881.5 1792.0 1708/0 1628.0 1529.0 1404.5 i278 .0 1154.5 1052.5
967.5 880 ,5 786 .5
6 9 0 . 5 670 .5 541.5
474 /0 414;0 356.5 293.5 238 .0 180.5 133.,5
96 :5 51~.0
•12 .5
12.0 21 .0 12 .0
8 .0 6 .0
11.0 7 .0 3 .0
4 . 0 2 .0 2 .0 3 .0 0 .0 2 .0 2:0
1 . 0 1 . 0 1 . 0
• 1 .0 • 0 ,0
: 0 . 0 0 .0 0 .0
0 . 0 0 .0 0 .0
0 .0062 0 .0112 0.0067 0. 0047 0.0037 0 .0072 0 .0050 0. 0023 0 . 0035 O. 0019 0.0021 O. 0034 0 .0 0 .0029 O. 0033 0 .0018 0.0021 0 . 0 0 2 4 O, 0028 0 ,0 0 ,0 0 ,0
O:O 0 .0 0 .0 O.O
0.9938 0 .9888 0 .9933 0 .9953 0 .9963 0 .9928 0 .9950 0.997.7 0 .9965 0.9981 0 .9979 0 .9966 i.0000 0.9971 0,9967 0 , 9 9 8 2 0 ,9979 0.99.76 0.9972 1.0000 1:oooo 1.0000 1 , 0 0 0 0 1 ,0000 1 .0000 1 ,0000
0 .9938 0 .9827 0,9761 0 .9715
: 0 . 9 6 8 0 0 .9610 0.9562: 0;9540 0,9507 0 ,9489 0 . 9 4 6 9 0.9437 0 . 9 4 3 7 0 ,9409 0 .9378 0.9361
0 , 9 3 4 1 0 ,9319 0 ,9293 0 .9293 0 .9293 0 .9293 0,9293 0 ;9293 0 .9293
0 , 9 2 9 3
0.002 0.003 O. 004 O. 004 0.004 0.005 O. OO5 0.005 0. 005 0 .005 0 .006 0 .006 0 .006 0 .006 0.007 o. 007 O.OO7 0.007 0 . 0 0 8 0.008 0.008 O. 008 0.008 0 .008 0.008 0 .008
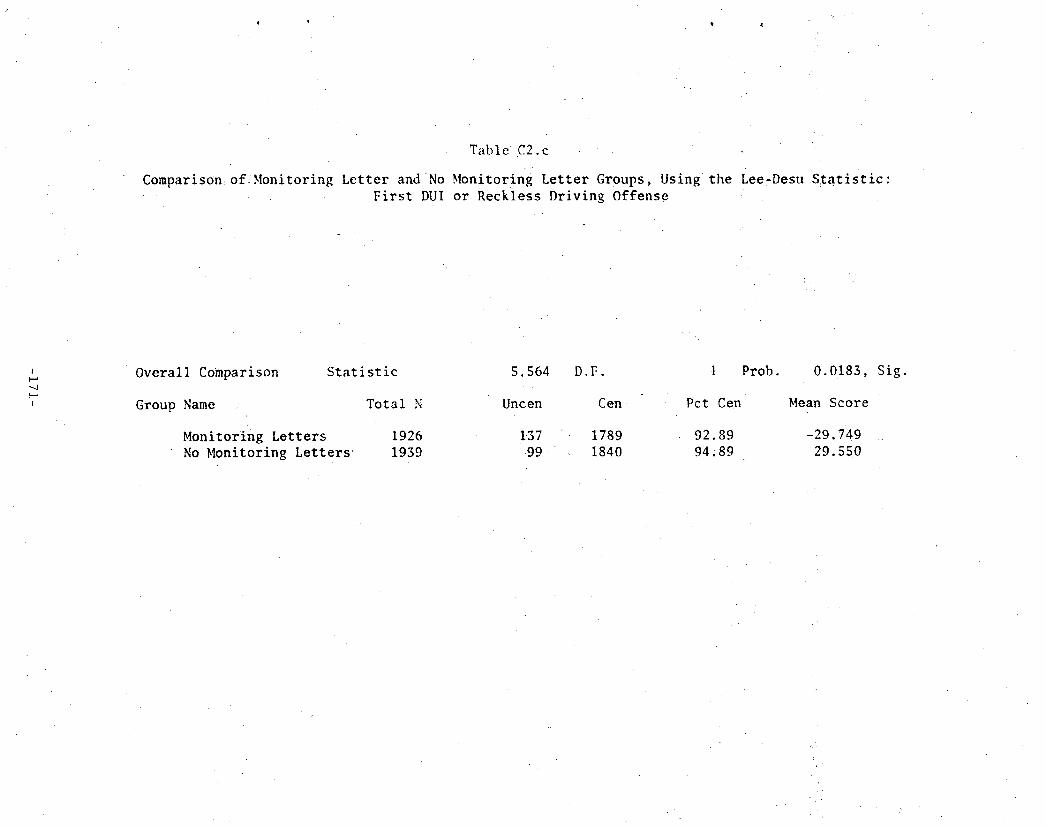
T a b l e C2.c
Comparison, of . Moni to r ing L e t t e r a n d N o Mon i to r ing L e t t e r Groups, Using the Lee-Desu S : t a t i s t i c : F i r s t DUI or Reck le s s Dr iv ing O f f e n s e
! Overall Comparison Statistic
Group Name Total N
Monitoring Letters 1926 No Monitoring L e t t e r s ' 1939
5,564
Uncen
137 .99
D.F.
Cen
- 1789 1840
1 Prob.
Pct Cen
92.89 94.89
0.0183, Sig.
Mean Score
=29.749 29.550

I
--3 t~
I
Intvl Start Time (Days)
0,0 30,0 60.0 90,0
120.0 150.0 180.0 210.0 240.0 270.0 300.0 330 .n 360 ; 0 3 9 0 . 0 420.0 450,0 480.0 5 1 0 . 0 540.0 5 7 0 . 0 600.0 6 3 0 . 0 6 6 0 . 0 6 9 0 . 0 7 2 0 . 0 750.0~- .
T a b l e
S u r v i v a l D a t a For C l i e n t s - R e c e i v i n g • .. Moving V i o l a t i o n
Number Entrng This Intvl
Number Number Wdrawn Exposd During to Intvl Risk
C3.a
Q u a r t e r l y M o n i t o r i n g o r Any A/R O f f e n s e
Number o f
Termn 1 E v e n t s
.Propn Termi- nating
1926.0: 1852 .0 1743.0 1 6 5 5 . 0 1554.0 1433.0 1 2 9 7 , 0 1171 .0 1023 .0
9 0 2 . 0 8 1 7 . 0 743.0 671.0 568.0 473.0 4 2 2 . 0 3 6 7 . 0 3 1 4 . 0 2 6 6 . 0 2 2 8 . 0 1 7 3 . 0 1 3 0 . 0 106 .0
7 6 . 0 5 7 . 0 2 1 . 0
16 .0 59 ;0 6 0 . 0 5 6 . 0
8 7 . 0 1 1 6 . 0 1 0 3 . 0 1 2 3 . 0 1 0 2 . 0
7 8 . 0 6 6 . 0 6 6 . 0 9 5 . 0 89 .0 49.0 53.0 5 3 . 0 4 5 . 0 3 6 . 0
5 5 . 0 4 3 . 0
24.0 30,0 19.0 36.0 21.0
1 9 1 8 . 0 1822 .5 1713 .0 1627 .0 1 5 i 0 . 5 1375 .0 1245 .5 1109 .5
9 7 2 . 0 8 6 3 . 0 784.0 7 1 0 . 0 623.5 523.5 448.5 395..5 3 4 0 . 5 291.5 248.0 200 ,5 151 .5 118 .0
9 1 . 0 6 6 . 5 39.0 10 .5
5 8 . 0 5 0 , 0 28:0 45.0 34.0 20.0 23.0 2 5 . 0 19.0
7.0 8.0 6.0 8 . 0 6.0 2.0 2.0 0,0 3.0 2.0
.0~0 O0 O0 O0 O0 O0
, 0 0
0.0302 0.0274 0.0163
0 . 0 2 7 7 O, 0225 O. 0145 0 . 0 1 8 5 0 . 0 2 2 5 0 . 0 1 9 5 0.0081
0:0102 0 .0085 0 . 0 1 2 8 0 . 0 1 1 5
O. 0045 '0.0051 0 . 0 0 . 0 1 0 3 O. 0081 O . 0
0 . 0 , 0 . 0
0 . 0 0 . 0 0 . 0
I
L e t t e r s : F i r s t
Propn Survi- ving _
0 . 9 6 9 8 0 . 9 7 2 6 0 .9837 0 . 9 7 2 3 0 . 9 7 7 5 0~9855 0 . 9 8 1 5 0 . 9 7 7 5 0 . 9 8 0 5 0 . 9 9 1 9
O : 9 8 9 8 0 , 9 9 1 5 0 .9872 0 .9885 0 . 9 9 5 5 0 . 9 9 4 9 1.0000 0.9897 0.9919 1.0000 1.0000 1.0000 1.0000 1 .0000 1.0000 1 .0000
Cumul Propn Surv At End
0.9698 0.9432 0.9277 0.9021 0.8818 0.8689 0.8529 0.8337 0.8174 0.8108 0 .8025 0 . 7 9 5 7 0 .7855 0 .7765 0 . 7 7 3 0 0 .7691 0 .7691 0 .7612 0 .7551
0 . 7 5 5 1 0 .7551 0 .7551 0 .7551
:0 .7551 0 . 7 5 5 1
0 . 7 5 5 1
SE of Cumul Survi- ving
0.004 0.005 0.006 0.007 0.008 0.008 0:009
0 . 0 0 9 0 . 0 1 0 0.010 0.010 0.011 0.011 0.011 0.012 0.012 0.012
0 .013 0 .013 0 .013 0 .013 0 .013 0 .013 0 . 0 1 3 0 . 0 1 3 0 .013
/
Survival Data For
T a b l e C3. h
C l i e n t s Not R e c e i v i n g Q u a r t e r l y b i o n i t o r i n g L e t t e r s : Moving V i o l a t i o n or Any A/R O f f e n s e
I n t v l Number Number Number Number S t a r t En t rng Wdrawn Exposd o f Propn Time This During t o Termfll Termin- (Days) Intvl Intvl Risk Events ating
Propn Survi- ving
F i r s t
Cumul Propn Surv At End
SE o f Cumul Survi- vlng
I
~ 4 ~ 4
i
0 . 0 3 0 . 0
• 6 0 . 0 9 0 . 0
120 .0 150 .0 180 .0 210 .0 2 4 0 . 0 270~0 300,0 330.0 360.0 390.0 420.0 450.0 480.0 510 .0 540.0 570.0 600.0 6 3 0 . 0 6 6 0 . 0 690.0 7:20.0 750.0+
1939 .0 1879 .0 1761~0 1653 .0 1558 .0 1 4 5 7 . 0 1321 .0 1191 .0 1061 .0
932.0 850..0 761.0 681.0 582.0 so!.o 438.0 383.0 314.0 273.O 220.0 183.0 139.0
94.0 7 3 . 0 4 7 , 0 12 .0
14 0 6 3 . 0 7 4 . 0 6 9 . 0 7 2 . 0
1 1 ! . 0 111;0 118 .0 111 .0
7 3 . 0 7 9 . 0 7 2 . 0 9 2 . 0 7 7 . 0 6 1 . 0 54.0 6 7 . 0 36 ;0 50.O 3 6 . 0 4 4 . 0 45.0 •21.0 2 6 . 0 3 5 . 0 12.0
1 9 3 2 : 0 1 8 4 7 . 5 1724 .0 1618 .5 1522 .0 1401 .5 1265 .5 1132 .0 1005..5 895.5 810.5 7 2 5 . 0 6 3 5 . 0 543.5 470.5 411.0 349.5 296.0 248.0 202.0 161.0 116.3 83.5 60.0 29.5 6 . 0
4 6 . 0 55.0 34.0 26 .0 29.0 25.0 19.0 12.0
1 8 . 0 9 . 0 I0.0 8.0 7.0 4.0 2.0 1.0 2.0 5.0 3.0 1.0 0.0 0.0 0.0 0.0 0.0 0.0
0 . 0 2 3 8 0 .0298 0 .0197 0 .0161 0 .0191 0. 0178 0.0150 0.0106 0.0179 O. OlO1 0 . 0 1 2 3 0.0110 0.0110 0.0074 0.0043 0.0024 0 .0057 0,0169 0.0121 0.0050 0.0 0.0 0.0 0.0 0.0 0.0
0..9762 0 .9702 0 .9803 0 . 9 8 3 9 0 .9809 0 .9822 0 . 9 8 5 0 0 .9894 0 .9821 0 . 9 8 9 9 0 .9877
0 . 9 8 9 0 0 . 9 8 9 0 0 .9926 0 .9957 0 . 9 9 7 6 0.9943 0.9831 0.9879 0.9950 1 .0000 1 .0000 1 .0000 1.0000 t . o o o o 1 .0000
0 . 9 7 6 2 0 .9471 0 .9285 0 . 9 1 3 5 0 . 8 9 6 1 0 .8801 0 . 8 6 6 9 0 .8577 0.8424 0.8339 0.8236 0.8145 0 .8056 0 . 7 9 9 6 0 .7962 •0.7943 0.7898 0.7764 O. 767O 0.7632 0.7632 0 .7632 0.7632 0.7632 0.7632 0.7632
0 . 0 0 3 0 . 0 0 5 0 . 0 0 6 0 . 0 0 7 0 .007 0 .008 0 .008 0 . 0 0 9 0 . 0 0 9 O. 009 0 . 0 1 0 0 . 0 1 0 0 .011 0 .011 o . o l l 0 .011 0 . 0 1 2 0 . 0 1 3 0.014 0 .014 0 .014 0 .014 0. 014 0.014 0 .014 0 .014

4
Table C3. c
Comparison o f Moni to r ing L e t t e r and No Mon i to r i ng L e t t e r Groups Osing t h e Lee-Desu S t a t i s t i c : F i r s t Moving V i o l a t i o n or Any A/R O f f e n s e .
t
I
Overall Comparison Statistic "
Group Name Total N
Monitoring Letters 1926 No Moni to r ing L e t t e r s 1939:
2 o 1 5 1 D.F. 1 Prob.
Uncen Cen Pct Cen
346 1S80 82.04 316 1623 83.70
0.1425, NS
Mean Score
-29.537 29.339
¢ ) ~) l
Intvl Start Time, (Days)
Survival Data For Clients
Number Entrng This Intvl
Number Wdrawn During Intvl
T a b l e C4.a
A s s i g n e d T o F o l l o w - U p
Number Exposd
to Risk
Number of
Termnl E v e n t s
Interviews:
Propn Termi- nating
First Accident
Propn S u r v i - v i n g .
/L
Cumul Propn
' S L i r v
At End
SE of Cumul Survi- ving
I
Gq I
0.'0 30.0 60.0 90.0
120.0 150.0 180.0 210.0 240.0 2?0.0 300;0 330,0 360,0 390.0 420.0 450.0 480.O 510.0
1276..0 1249.0 1179.0 1088.0 I017.0
9 3 5 . 0 881.0 827:0 727.0 616.0 539.0 : 452.0 378.0 266.0 166;0 99.0 52.0 i I .O
15 .0 59.0 77.0 62.0 77.0 50.0 50.0 97.0 106.0
75;0 84.0 72.0
I09LO 98.-0 • 67.0 47.0 41.0
1 1 . 0
1268:5 i 2 1 9 . 5 1140.5 1057.0
978:5 9 1 0 . 0 856 .0 778 .5 674 .0 578.5 497.0 416.0 32315 217.0 132.5
75.5 3 1 , 5 5 . 5
12 .0 1 1 . 0 14.0
9.0 5.0 4.0 4.0 3.0 510 2.0 3.0 2.0 3.0 2.0 0.0 0.0 0.0 0 . 0
O. 0095 O. 0090 0 .0123 0 .0085 0 . 0 0 5 I O. 0044 0.0047 0 .0039 0.0074 0 . 0 0 3 5 O. 0060 O. 0048 O. 0093 0. 0092 0.0 0.0 0 . 0 0 ;0
0.9905 0.9910 0.9872 0.9915 0.9949 0.9956 0.9953 0.9961 0 .9926 , 0.9965 0.9940 0.9952 0.9907 0,9908 1.0000 1.0000 1.0000 1.0000
0 . 9 9 0 5 0~.9816 0 .9696 0 .9613 0 .9564 0~9522 0 .9477 O. 9441 0.9371 0.9338
0 .9282 0.9237 0,9152 0.9067 0.9067 0.9067 0.9067 0.9067
0.003 O. 004 0 .005 0 .006 0 0 0 6 0 006 0 O07 0 007 0 008 0 008 0 OO9 O. 009 O.OlO 0.o12 0.012 0 .012 O. 012 0.012

S u r v i v a l Data For C l i e n t s
Intvl .Number: Number Start Entrng Wdrawn Time This During (Days) " Intvl Intvl
Table C4.b
Not Assigned to Follow-Up
Number Exposd
t o
Risk
Number o f
Termnl Events
I n t e r v i e w s : F i r s t
Propn Termi- nating
Propn Survi- ving.
•%
Acc iden t
Cumul Propn
Surv At End
SE o f Cumul S u r v i - v ing
I
Ox 1
0.0 30.0 60.0 90.0 120.0 150.0 180.0 210.0 240.0 270.0 300.0 330.0 360.0 390.0 420.0 450.0 480.0 510.0
1673.0 1638.0 1567.0 1496.0 1422.0 1333.0 I150.0 969.0
811.0 692.0 605.0 533.0 458.0 347.0 270.0 210.0
1 4 8 . 0 5 7 . 0
15.0 62.0 57.0 64.0 83.0
170.0 173.0 156.0 115.0 83.0 70.0 74.0
108.0 75.0 5910 62.0 91.0 57.0
1665.5 1607.0 1538.5 1464.0 1380.5 1248.0 1063.5 891.0 753.S 650.5 570.0 496.0 404.0 309.5 240.5 179.0 102.5
2815
20.0 9 .0
14.0 10.0
6 .0 13.0
8 .0 2.0 4LO 4 .0 • 2 .0 1.0 3 .0 2.0 1.0 0 ,0 0.0 0 .0
0.0120 O. 0056 0.0091 O. 0.068 O. 0043 O. 0104 0.0075 0.0022 0.0053 O. 0061 0.0035 0.0020 0.0074 0.0065 O. 0042 0.0 0 .0 0.0
0.9880 0.9944 0.9909 0.9932 0.9957 0.9896 0.9925 0.9978 0.9947 0.9939 0.9965 0.9980 0.9926 0 . 9 9 3 5 0.9958 1.0000 1.0000 1.0000
•0 .9880 0.9825 0.9735
•0.9669 0.9627 0.9526 0 .9455 0.9434 0.9383 0.9326 0.9293 0.9274 0.9205 0.9146 0.9108 0.9108 0.9108 0.9108
0.003 O. 003 O. 004 O. 004 O. 005 0.005 O. 006 O. 006 0.007 0.007 O. 008 O. 008 O. 009 0.010 0.010 0.010 0.010 0.010

¢ • C
Table C4.c
Comparison o f Fol low-Up and No Fol low-Up Groups; Using the Lee-Desu S t a t i s t i c : •
/ .
F i r s t Acc ident
I
I
Overal l Comparison S t a t i s t i c
Group Name Tota l N
Follow-Up I n t e r v i e w s 1276 No Follow-UpInterviews 1673
O. 046
Uncen
79 99
D • , F •
Cen
1197 ]574
1 Prob.
PCt Cen
93.81 94 .08
0;8306 , NS
Mean Score
-2.61.83 i . 9 9 7 0

I n t v l S t a r t Time (Days)
S u r v i v a l
Table C5.a
Data.For Clients Assigned to Follow-Up Interviews: Reckless Driving Offense
Number Number Number Entrng Wdrawn Exposd This During to Intvl Intvl Risk
Number of Propn
Termnl Termi- Events nating
F i r s t DUI
P r o p n Survi- ving
or
Cumul Propn Surv At End
SE of Cumul Survi- ving
I
Oo I
0 .0 30.0 60 .0 90 .0
120 .0 150.0 180 .0 210 ,0 240 .0 270,0 300.0 330.0 360 .O 390.0 420..0 450.0 480.0 510 .0
1276.0 1252.0 i188.0 i104.0 1034.0 956.0 901.0 846.0 745.0 632.0 549.0 463.0 387.0 280.0 176.0
1 0 8 . 0 52.() 14.0
151 59 0 78 0 62 0 76 0 52 0 52 0
lO0 0 III 0 81.0 86.0 75.0
107.0 103.0 68.0 56.0 38.0 14.0
1268.5 1222.5 1149.0 i073.0
996.O 930.0 875.0 796.0 689.5 591 .S 506.0 425.5 333.5 228.5 142.0
80.0 33 .0
7.0
9.0 O. 0071 5.0 0.0041 6.0 0.0052 8.0 0..0075 2.0 0.0020 3.0 0.0032 3.0 0.0034 1.0 0.0013 2.0 0.0029 2. 0 O. 0034 0.0 0.0 1.0 0.0024 0.0 0.0 1.0 • O. 0044 0.0 0.0 0.0 0.0 0.0 0.0 0.0 0.0
0.9929 0 .9959 0.9948 0 .9925 0 .9980 0 .9968 0.9966• 0 .9987 0 . 9 9 7 t 0 .9966 1 .0000 0.9976 1.0000 0.9956 1.0000 1.0000 1.0000 1.0000
0.9929 0.9888 0.9837 0.9763 0.9744 0.9712 0.9679 0.9667 0.9639 0.96O6 0.9606 0.9584 0.9584 0.9542 0.9542 0.9542 0.9542 0.9542
0.002 O. 003 O. 004 O. 004 0.005 0.005 0.005 0.005 0. 006 0.006 0.006 0.007 0.007 0. 008 0. 008 0. 008 O. 008 0.008
• )
I
- . j
t O
Intvl Start Time (Days)
0.0 30 .0 60.0 90.0
1 2 0 . 0 150.0 180.0 210.0 •240.0 270•.0 300.0 330.0 360.0
3 9 0 . 0 420.0 450.0 480.0 510.0
S u r v i v a l Data
Number Entrng This- Intvl
For C l i e n t s
Number Wdrawn During Intvl
Table C5.b
Not Assigned to Follow-Up D r i v i n g O f f e n s e
Number Exposd
to Risk
Number of
Termnl Events
Interviews: First DUI or
Propn Propn Termi- Survi- nating ving
1673.0 1645.0 1570.0 1502.0 1431.0 1345.0 1164.0 986.0 829.0 711.0 625 .0 552.0 471.0 367.0 281.0
2 2 1 . 0 156.0
60.0
15.0 63 .0 57 .0 64 .0 85 .0
177.0 171 .0 1 5 4 . 0 115 .0 84.0
7 3 . 0 80.0 102.0 •86.0 :59.0 6 5 . 0 96.0 60.0
1665.5 1613.5 1541.5 1470.0 1388.5 1256.5 1078.5 909.0 771.5 669.0 588.5 512.0 420,0 324.0 251.5 188.5 I08.0
30 .0
13.0 12.0 II .0 7.0 1.0 4.0 7.0 3.0 3.0 2.0 0.0 1.0 2.0 O.O 1.0 0.0 0.0 0.0
0.0078 0.0074 0.0071 0.0048 0.0007 0.0032 O. 0065 0 .0033 0.0039 O. 0030 0.0 0.0020 O. 0048 0.0 O. 0040 O. 0 0.0 0.0
0.9922 0.9926 0.9929 0.9952 0.9993 0.9968 0.9935 0.9967 0.9961 0.997O 1.0000 0.9980 0.9952 1.0000 0.9960 1.0000 1.0000 1.0000
Reckless
Cumul Propn Surv At End
SE of Cumul Survi- ving
0.99.22• 0;9848 0 . 9 7 7 8 0.9731 0.9724 0.9693 0.9630 0.9599 0.9561 0.9533 0.9533 0.9514 0.9469 0.9469 0.9431 0.9431 o.9431 0.9431
O. 002 0.003 0.004 0.004 O. 004 O. 004 0.005 O. 005 O. 006 O. 006 0.006 0.006 0.007 0 .007 0 .008 0 .008 0.008 0 .008

Table C5.c
Comparison of Follow=Up and •No•Follow-Up Groups, Using the Lee-Desu Statistic: • F i r s t DUI o r R e c k l e s s D r i v i n g O f f e n s e
t-
O0
!
Overall Comparison Statistic
Group Name Total N
Follow=Up Interviews 1276 No Follow=Up Interviews 1673
0 . 7 3 7 D .F .
Uncen Cen
43 1 2 3 3 67 - 1606
i Prob.
. P c t Cen
9 6 . 6 3 9 6 . 0 0
0.3907, NS
Mean S c o r e
8.605O 26.5631

S u r v i v a l Data For C l i e n t s Ass igned
I n t v l S t a r t Time (Days)
N u m b e r Entrng This
, Intvl
Number Wdrawn During I n t v l
Tab le C6. a
t o Follow=Up I n t e r v i e w s : o r Any A/R O f f e n s e
Number Number Exposd o f
to Termnl R i s k E v e n t s nat
F i r s t Hoving Violation
P r o p n . Termi- nating
Cumul Propn Propn Survi- Surv ving At End
SE o f Cumu! Survi- ving.
i
O 0
I
0;0 30.0 60 .0 90 .0 •
120.0 150.0 180.0 210.0 240.0 270;0 300.0 330.0 360.0 390.0 420.0 450.0 480.0 510.0
1276.0 1 2 3 2 . 0 1151:0 1055.0,-
9 7 5 . 0 8 8 4 . 0
8 2 7 . 0 768 .0 671.0 5 6 1 ; 0 486;0 407 .0 338.0 240.0 151:0 95.0 4 5 . 0 12.0
1 5 . . 0
59.0 77.0 62.Q 74.0 51.0 48.0 92.0
105:0 72.0 76.0 6 7 . 0 97.0 88.0 56.0 5 0 . 0 33.0 1"2.0
1 2 6 8 . 5 ~ 1 2 0 2 . 5 1 1 1 2 . 5 1024.0
938 .0 858.5 - 803.0 722.0 618.5 5 2 5 . 0 448.0 373.5 289.5? 196.0 123.0
70.0 2 8 , S
6.0
29.0 22.0 19.0 18.0 17 .0
6 .0 Ii .0 5.0 5.0 3.0 3.0 2.0 1.0 1.0
.--0.0 •'
:0.0 0.0
• 0 .0229 O, 0183 0.0171 0.0176 0.0181 0.0070 0.0137 O. 0069 O. 0081 •
,0.0057 ~' 0.0067 0.0054 ' 0.0035 0.0051 0 .0 0 .0 0 .0 0 .0
. ' . , , .
0.9771 0.9817 0.9829 0.9824 0.9819 0 . 9 9 3 0 0.9863 0.9931 0.9919 0 .9943 0 . 9 9 3 3 0.9946 0.9965
0 . 9 9 4 9 1.0000 1.0000 1.0000- 1.0000
0.9771' 0.9593 0.9429 0.9263 0.9095 0~9032 0 . 8 9 0 8 0.8846 0.8775 0.8725 0.8666 0.8620 0.8590. Q.8546
0 . 8 5 4 6 0.8546 0.,8546 0.8546
0.004 0.006 0.007 0.008 0.008 O. 009 0.009 0.010 •0.010 O. 011' O. 01.1 0.011 0 .012 0.012 0.012 0.012 0.012 0 :012
" 2
Intvl S t a r t
T i m e (Days)
Survival Data
Number . Entrng
T h i s I n t v l
For. Clients Not
Number Wdrawn During I n t v l
T a b l e - C 6 . b
Ass igned t o ' F o l l o w - U p I n t e r v i e w s : or Any A/R O f f e n s e
Number Exposd
: t o Risk
Number of
Termnl Event s
P r o p n Termi- nating
F i r s t
Propn Survi- ving
Moving5 V i o l a t i o n
Cumul SE o f Propn Cumul Surv Survi- At End ring
1
t O I
0 .0 30 .0 60 .0 90 .0
120.0 1SO.O 180.0 210.0 240.0 270.0 300 .0 330.0 360.0 390 .0 420 .0 450.0 480.0 510.0
1673,.0 1620.0 1527.0 i 4 5 2 , 0 1372,0
1 2 7 6 , 0 1085.0 909,0 754.0 639.0 561.0 491.0 418.0 325.0 247.0 193.0 136.0
49.0
1 5 . 0 6 3 . 0 57.0 6320 85 .0
176.0 166.0 149.0 107.0
77..0 6 9 . 0 70 .0 90;0 78.0 53~0 57.0 87.0 49.0
1665.5 1588.5 ' 1 4 9 8 . 5 1 4 2 0 . 5 1329.5 1 1 8 8 . 0 1002.0
834.5 700.5
; 600.5 526.5 456.0 373.0 286.0 220.5
1 6 4 . 5 92.5 24.5
38.0 30 .0 18.0 17.0 1.1.0 15.0 10.0
6 .0 8 . 0 1 .0 1 .0 3 .0 3 . 0
0 . 0 1 .0 0 .0 0 .0 0 .0
0:0228 0.0189 0 .0120 0 . 0 1 2 0 O. 0083 0 .0126 0 .0100 0.0072
0 . 0 1 1 4 0 . 0 0 1 7 0 .0019 O. 0066 0.0080 0 .0 O. 0045 0 .0 0.0 0 .0
0.9772 0 . 9 8 1 1
0 .9880 0 .9880 0.9917 0.9874 0 . 9 9 0 0 0.9928 0,9886 0.9983 0.9981 0.9934 0.9920 1 .0000
0 . 9 9 5 5 1.0000 1.0000 1.0000
0.9772 0 . 9 5 8 7 0.9472 0.9359 0.9281 0.9164 0.9073 0.9007 0.8905
0~8890 0 .8873 0.8815 0.8744 0.8?44 0.8704 0.8704 0.8704 O. 8704
O. 004 O. 005 0.006 O. 006 0.007 O. 007 0 .008
O. 008 o :009 0.009 0.009 0.009 0.010 0.010 0.011 0.011 0.011 0.011

T a b l e C 6 . c
Comparison of Follow-Up and No Follow-Up Groups, Using the Lee-Desu Statistic: .. ... Moving Violation or Any A/R Offense
F i r s t
I
O0 %aq I
Overall Comparison
Group Name
Follow-Up Interviews No Follow-Up Interviews
Statistic
Total N
1276 1673
i~370
Uncen.
142 162 "
D°F.
Cen
1134
1 S l l
1 . Prob,
Pct Cen
88.87 90.32
0.2418, NS
Mean Score
-19.241 14.67S
-/

%. , .i.,
APPENDIX D
Education Program Objectives
Note: The specific knowledge and attitude change objectives were identical for both home study and in-class education programs. This Appendix lists the objectives accord- ing to their order of presentation in the in-class education program. In the home study program the same objectives were pre- sented in approximately the same order but - the material was divided into seven chapters.
- 1 8 4 -

EDUCATION PROGRAM OBJECTIVES . . . .
SESSION 1:
Knowledge Students will be able to identify:
i. And define host liability.
2. Aspects of California law which relate to driving under • the influence (e.g. legal penalties; Implied Consent Law; presumed blood alcohol limits; • concept of "impairment" tests available for measuring BAL).
3. The relationship between alcohol consumption and ......... traffic accidents. '
4. Specific facts about alcohol--role in society; metabolism; food Val~ue; being a drug.
5. Factors which will affect blood alcohol level.
Attitude -- Students will feel that: : :
6Theyweren0tdriying s~fely at:the time of their
DUI arrest.
7. Their arrest for DUI was fair.
8. California drinking driving laws are fair and
necessary.
ESSION 2: •
Knowledge -- Studentswill be able to identify:
i. ~Physlol0gical effects of alcoholas these relate to
the driving task.
: . . . . . 2. ~ ' P s y c h 6 i o g i c a l e f f e c t s o f a l c o h o l - a s t h e s e r e l a t e t o
t h e d r i v i n g t a s k .
3. F a c t o r s w h i c h i n f l u e n c e t h e e f f e c t s o f a g i v e n BAL 5 n ' a n £ n ~ i v i d u a l ( e . g . s t r e s ' s ; e x p e r i e n c e ; f a t i g u e ) .
4. DUI alternatives.
Attitude -- Students will:
S. Feel the responsibility for their DUI behavior.
6. Feel that DUI is undesirable behavior. K
Behavior -- ' :
7. Students will decide that they do not want to be arrested again for DUI.
_185_ ~
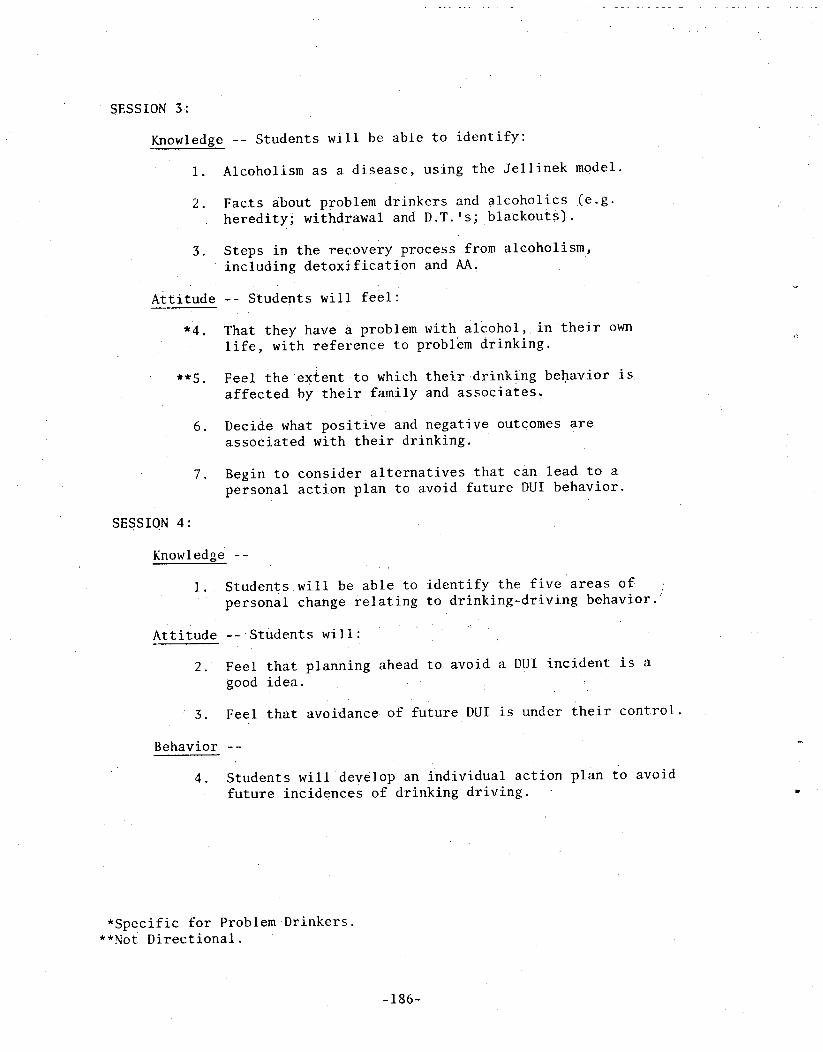
SESSION 3:
Knowledge -- Students will be able to identify:
i. Alcoholism as a disease, using the Jellinek model.
2. Facts about problem drinkers and alcoholics (e.g. : heredity; withdrawal and D.T.'s; blackouts).
3. Steps in the recovery process from alcoholism including detoxification and AA
Attitude -- Students will feel
~4.
~S .
.
That they have a problem with alcohol, in their own life, with reference to problem drinking.
Feel the extent to which theirdrinking behavior is affected by their family and assoCiates~
Decide what positive and negative outcomes are associated with their drinking.
7. Begin to consider alternatives that can lead to a personal action plan to avoid future DUI behavior.
SESSION 4:
Knowledg e --
i. Students will be able to identify the five areas of personal Change relating to drinking-driving behavior.
Attitude -- Students will:
2. Feel that planning ahead to avoid a DUI incident is a good idea. : ,
3. Feel that avoidance of future DUI is under their control.
Behavior --
4 Students will develop an individual action plan to avoid future incidences of drinking driving.
*Specific for Problem Drinkers. **Not Directional.
-186-
APPENDIX E
Quarterly MonitoringLetter and Content Analysis
- 1 8 7 -

C O U N T Y OF S A C R A M E N T O H E A L T H D E P A R T M E N T R O N A L D L. USHER. D IRECTOR
OFFICE OF ALCOHOLISM
L A U R E N C E R. V A L T E R Z A A L C O H O L I S M P R O G R A M A D M I N I S T R A T O R
E A R L D. J A C K DEPUTY FOR A D M I N I S T R A T I O N 713 9th Street " •
SAC~tAMENTO, C A L I F O R N I A 95814
(916) 440-6510
CDUI PROJECT (COMPREHENSIVE DRIVING UNDER THE INFLUENCE OF ALCOHOL TREATMENT DEMONSTRATION PROJECT) LEWIS A... D A V I S , DI RECTOR 708 - lOth STREET, SUITES 240 & 250 s A c R A M E N T O , C A L I F O R N I A 95814 T E L E P H O N E : (916) 446-5048 "
., .'
-DearClient:
Because of your arrest for driving under the influence Of alcohol, you have become a.CDUI (Comprehensive Driving Under the Influence).Project client and your.case will be under our observation during your • two-yearprobationary period. We will reveiw your case periodically and remind you of the condi- tions of your probation, with the hope .that you will successfully avoid any further trouble ..
You may have been assigned to participate in three personal interviews Con- ducted by the CDUI follow-up counselors. If you were assigned, your partici- pation is required. You are also required to drive safely and soberly at all times.
Please understand that the Court will not be as lenient if you are arrested again, particularly if you are still on probation. Take a moment and think about your past arrest andcourt experience. Is another DUI worth the time, the money, and the possible loss of your driving privilege?
Remember that half of all trafficfatalities are directly related to alcohol. Be careful and be aware of how much you drink when you drive. Won't youhelp make our highways safer? we don't want to read about yo u in the newspapers!
Sincerely, ".
M o n i t o r i n g and Compl iance Unit. 440-5958
-188-

I
Oo
I
I ..
.. .. i ,'i.
QUARTERLY MONITORING LETTER CONTENT ANALYSIS,
Subjec~ Content and Phraseology
Statement..of conditions resulting from index arrest: •
a) recipient became a CDUI Project client b) recipient was placed on probation for two years c) .... recipient will remain under our observation for
• theduration of.the probationary period
-. P u r p o s e , . . : '
Re~nfOr~co the causal relationship between client's drinking-driving activities and participation in the CDUI Project. (Arrest was Used instead of conviction because of reductions~t0 Reckless Driving.)
• Remindthe client that a two-year probationary period was imposed by the Court. ,
• Indicate that CDUI Project participation is a -condition of probation, and suggeSt that the CDUI Project is responsible for client's behavior throughout the probationary period. Thus establishing a logical and legitimate basis for periodic case reviews and follow-up interviews after successful completionof education/treatment programs.
2.
.
Statement of intention to review Client's case periodically.
Explanation of reason for sening a letteri
Remindclient of conditions of probation (done in conjunction with the periodic case reviews), with the hope that client will successfully avoid any further trouble.
• Reinforce the idea that tlle client is being monitored Calbeit indirectly) at regular intervals. Someone is giving his/her case individual atten, tion the clienthas not been lost in the system.
Associate the receipt of a monitoring letter with a review of the client's case. Establishthe fact that the client will be receiv- ing several letters, one with each periodic case
review. • Indicate that the purpose for sending letters is a periodic reminder of the conditions of probation.
• Imply how the Project exPects the client to use the information - by being aware of the proba- tionary conditions the Client will be better able to avoid violating those conditions and thus further trouble ~

I
I
.
QUARTERLY MONITORING LETTER CONTENT. ANALYSIS (Cont'd)
Subject Content and Phraseology
Statement of probationary conditions: .
a) Participation in follow-up interviews (three personal interviews with counselors) is required
b). Driving~safely and soberly at all times is r e q u i r e d .
5. Warning of possible consequences of another arrest (CoUrt will not be as lenient next time),.
Ask client to think about past arrest and court experience (is another DUI worth the 10ss of time, money, and possibly drivingprivi!ege).
7, Statement of proportion of all traffic fatalities related to alcohol.
: 6.
b) C)
Statements ofconcern for client's personal safety and well-belng, and client's responsibility for the Safety of others:
a) Be careful andbeaware of how much you drink when you drive. H e l p make o u r ~ h ~ g h w a y s s a f e r , Don't become a fatality statistic (we don't want to read about you in the newspapers)
.
P u r p o s e
Indicate that if the client was assigned to follow-up interviews, his/her participation is mandatory. Emphasis on personal interviews con- ducted by counselors to connote individual attention and concern for the client's progress. Specifica- tion of.three interviews to define:the extent of client's involvement and obligation.
Reinforce the idea that another offense will result in the imposition of more severe sanctions. A low threat warning of possible consequences also suggests our quasi-probationary function and our concern that the client not experience additional legal problems.
• Urge the ¢.lient to recall the unpleasant aspects of his/her prior arrest and conviction, with the intention of increasing the client's motivation to avoid another similarly Unpleasant experience.
• Reinforce the relationship between drinkingydriving and fatal traffic accidents.
• Reinforce the idea that the client is responsible for his/her own drinking and driving behavior, and that the client can control this behavior (and its consequences) but this control requires as a pre- requisite an awareness of the amount of alcohol consumed. Reinforce the idea that the client is responsible for the safety of others on the highways. Close letter with an expression of our concern for the client's life which is being endangered by drinking and driving.

APPENDIX F
CDUI Project Diagnostic Interview:Protocol
-191~(~ ~._

Rev: 9-01-78
CDUI INTAKE I,~!TERVIE!,'W
COUNSELOR
START TIME:
END TI ME :
p ~P- CLI E?,'T !-1,~t~E
CDUI ~3:\ -192-

CDUI INTAKE INTERVIEW PROTOCOL
Scale 1
I . DEMOGRAPItlC PROFILE AN[) SOCIAL/DIPLOYHENT PROBLEbIS
.
.
How far have you gone in school?
1. None
. 2. 7 , g r a d e s o r l e s s
3. 8-11 g r a d e s
4. 12 g r a d e s o r d i p l o m a
6. 1-3 years c o l l e g e
7. 4 y e a r s c o l l e g e
8. p o s t , g r a d u a t e work
9. n o t kno~m
S. Comnle t ed b u s [ n e s s . o r t r a d e s c h o o l ( 1 - 2 ) , e a r s )
a . E n t e r h i g h e s t g r a d e c o m n l e t e d :
Are you c u r r e n t i y employed? "
a . ( I f Yes ) : What i s y o u r o r e s e n t j o b ? T i t l e p l u s d e s c r i p t i o n :
3 . H a s t h e r e r e c e n t l y b e e n a c h a n g e i n your: r e s p o n s i - b i l i t i e s a t w o r k o r in ) 'our w o r k i n g c o n d i t i o n s ? (For e x a m p l e , t r a n s f e r , . s h i f t c h a n g e , p r o m o t i o n , e t c . ) . . . . . . .
.
.
t tave you r e c e n t l y had any t r o u b l e w i t h y o u r s u p e r v i s o r s , c o - w o r k e r s o r p e r s o n n e l u n d e r y o u r s u p e r v i s i o n ? . . . . . . . . . . . . . . . . . . . . . . . . . . . . . . . . . . . . . . . . . . . . . . , . . . .
• H a s d r i n k i n g e v e r c o n t r i b u t e d t o p r o b l e m s a t work o r t h e l o s s o f a j o b ? . " ' Y N
6. What isyour present marital status?
1. S i n g ! e ( n e v e r m a r r i e d )
2. N a r r i e d
3. D i v o r c e d
4. S e p a r a t e d
S. W i d o w e d
.
.
.
HOW man)" times }lave yo u been married? # ( I f never marri6d record ,zero)
L
Have ~::o~irecently been separated from YoUr spouse or serio~asly talked about separation? ........................
}t~s drinking interfered ::' " . ~z t , . a n y m a r r t a g e p l a n s .o r o t h e r s o c i a l r e l a t i o n s h i p s ? Y N "
-193-
Scale 2
Y N
Y N o r N/A
YNor N/A
Y N o r N/A

10.
11,
.
I I .
What was y o u r a v e r a g e month ly income f o r t h e l a s t t w e l v e months?
I3 .
a . I n d i v i d u a l Income $ per month
b. Family Income $ per month
tlow many c h i l d r e n and a d u l t s a r e l i v i n ~ on tt~iS income? -# ( i n c l u d i n g c i i e n t )
• . ' . .
I~hat i s you r p r i m a r y s o u r c e o f f a m i I y income?
6. O t h e r R e t i r e m e n t I . Wages
2, Supp lemen ta l S e c u r i t y ___7. O the r D i s a b i l i t y . Income
3. Unemployment Compensat ion 8. Fami ly i
4. S o c i a l S e c u r i t y B e n e f i t s ,__9. M i l i t a r y R e t i r e m e n t
5. p u b l i c A s s i s t a n c e 1 0 . O t h e r
( i n c l u d i n g SSI) ' i l . N o n e R e p o r t e d
ltave you r e c e n t l y been c o n c e r n e d about f i n a n c i a l p r o b l e m s ? (For example , p a y i n g f o r r e c e n t p u r c h a s e s , r e n t or m o r t g a g e payments , med i ca l b i l l s , e t c . ) '
ARRESTS AND DRIVING BEI~VIOR
When d id t h e a r r e s t o c c u r which l e d to your r e f e r r a i h e r e ? ( I f c l i e n t i s be ing r e f e r r e d f o r more t h a n one a r r e s t , r e c o r d t h e d a t e o f the most r e c e n t a r r e s t b e l o w . )
14. Have you ever been • arrested for an offense other than the arrest of
mn day yr (If Yes)" Ask client to describe the offenses and
record the number of times arrested for each offense category below.
(If No): Put zero in each offense category belowl
a. Numberof Prior Arrests for DUI, ................... #
b. Number of Arrests for 'Drunk and Disorderly or
Public Intoxication ................................ #
c. Number of Prior Arrests for Reckless D r i v i n g " " - # . . . . . . . . . .
d. Number of Crimes In,:01v~ng Property.....~
e. Nunber of Crimes Involving Assault ...... #
,f . Number of Crimes I n v o l v i n g sex., . . . . . . . . #
g. Number o f Crimes I n v o l v i n g Other [!rugs.# . . . .
h. Number o f O the r Crimes and T r a f f i c V i o l a t i o n s . . . . . . . . . . . . . . . . . . . . . . . . . . : . . . . # .__
i+
i +
- 1 9 4 -
I
I
YN
iS

4 ! . .
f
I I I .
S c a l e 1
i . t lad t h e c l i e n t b e e n d r i n k i n g when h e / s h e was a r r e s t e d f o r R e c k l e s s D r i v i n g ? . . . . . . . . . . . . . . . . . . . . . Y N o r
j~, l t a d t h e c l ~ i e n t b e e n d r i n k i n g when h e / s h e w a s " N/A a r r e s t e d f o r a n y o f t h e n o n t r a f f i c o f f e n s e s o r t r a f f i c v i o l a t i o n s i n d i c a t e d • i n i t e m s d - h ? . . . . . . Y N o r
N/A
I 5 , was c l i e n t ' s ' i n d e x a r r e s t BAC .15 o r a b o v e ? . . . . i . . . . . . . Y N
A s k t h e f o l l o w i n g :
I 6 . W h i l e d r i v i n g h a v e y o u e v e r b e e n s t o p p e d b y p o l i c e b u t n o t a r r e s t e d , when you knew you had b e e n d r i n k i n g t o o m u c h ? Y N
PHYSICAL HEALTH
17. Are you experiencing any of the following health problems?
a . f e e l i n g t i r e d o r f a t i g u e d . . . • . . . . . . . . . . . . . . . ; . . . . . . . Y N
b . w e i g h t l o s s o r i n a b i l i t y t o e a t . . . . . . . . . . . . . . . . . . . . Y N
¢ . i n a b i l i t y t o c o n c e n t r a t e o r c o m p l e t e t a s k s . . . . . . . . . Y N
d . d i f f i c u l t y s l e e p i n g . . . . . . . . . . . . . . . . . . . . . . . . . . . . . . . . . Y N
18 . H a v e y o u e v e r had u l c e r s • o r s t o m a c h p r o b I e m s . . . . . . ; . . . . Y N )
19 . H a v e y o u e v e r had l i v e r p r o b l e m s ? ( e . g . , f a t t y , • l i v e r o r c i r r h o s i s ) . . . . . . . . . . . . . . . . . . . .. . . . . . . . : . . . . . . . : : Y N
20 . Have y o u e v e r b e e n t o l d by a d o c t o r t h a t d r i n k i n g i s i n j u r i n g y o u r h e a l t h ? . . . . . . . . , . . . . . . . . . . . . . . . . . . . . . . Y N
• " . [ i
2 I . H a v e y o u r e c e n t l y b e e n c o n c e r n e d a b o u t t h e p h y s i c a l o r m e n t a l h e a l t h o f a n y c l o s e r e i a t i v e o r c I o s e f r i e n d ? . . . . . . . . . : . . . . . . . . . . . . . . . . . . . . . . . . . . . . . . . . . . . . . . . . . . . . . . .
22 . Have y o u r e c e n t l y l o s t a c l o s e r e l a t i v e o r c l o s e f r i e n d b y d e a t h ? . . . . . . . . . . . . . . . . . . ; . . . . . . . . . . . . . . . . . . . . . . . . . . , .
I V . . DRINKING PATTERNS AND PRO;~I.t%!S
23 . What is: y o u r d e f i n i t i o n oF a s o c i a l d r i n k e r ?
¢,,, " i v c Does c l i e n t ' s d e f i n i t i o n . u# . . , e s t e x c e s s d r ink in :~ , p a t t e r n s " Y N
24. Does d r i n k i n g Seem t o e a s e .vc'u)" p e r s o n i ! p, . 'o , , le .~ ' " * . . . . . . . Y:N
25 Does a d r i n k o r two o i v e >c,t~ e n e r g y t o n e t s t a r t e d ? Y N • ~ • . . , • - • -
-195--
Scale 2
Y N
Y N

26 ' Do you e v e r d r i n k to f e e l more a t e a s e a r o u n d p e o p l e ? . . Y N
27.
2 8 ,
29.
30.
3 1 .
32.
t tave y o u e v e r t ~ o u g h t abou t c u t t i n g down o,l d r i n k i n g ? . . Y N 2"
Have a n y o f y o u r f r i e n d s o r members o f y o u r f a l a i l v s u g g e s t e d t h a t you wa tch o r c u t down on y o u r d r i n k i n g ? . Y N
Do you u s u a l l y have s o m e t h i n g t o d r i n k e v e r y d a y ? . . . . . . Y N
How many d r i n k s can you h a n d l e and s t i l l d r i v e w e l l ? . . . # 4*
Do you u a u a l l y d r i n k f o u r o r more d r i n k s when you do d r i n k ? . . . . . . . . . . . . . . . . . . . . . . . • Y N
Have you e v e r f e l t bad or g u i l t y abou t d r i n k i n g ? . Y N
33. Have you e v e r f e l t t h a t you r e a l l y w a n t , n e e d , o r d e s e r v e a d r i n k ? . . . . . . . . . . . . . . . . . . . . . . . . . . . . . . . . . . . . . . . V N
34. l t a v e you gone on a d r i n k i n g Spree in t h e l a s t f i v e y e a r s ? . . . . . . . . . . . . . . . . . . . . . . - . . . . . . . . . . . . . . . . . . . . . . Y N
35. Have you e v e r f o u n d t h a t you c a n n o t r emember o r w o n d e r : w h a t y o u d i d t h e n i g h t b e f o r e when you were d r i n k i n g ? . . . . . . . . . . . . . . . . . . . . . . . . . . . Y N
A f t e r d r i n k i n g t h e n i g h t b e f o r e ; have y o u e v e r d e c i d e d n o t t o g o t o work t h e n e x t m o r n i n g ? . . . . . . . . . . . . . Y.N
Do you f e e l q u a r r e l s o m e or become a n g r y a f t e r you h a v e had s e v e r a l d r i n k s ? . . . . . . . . . . . . . . . . . . . . . . . . . . . Y N
Have you b e e n t o l d you were rowdy or n o i s y when you had t o o much t o d r i n k ? . . . . . . . ; . . . . . . . . . . i . . . . ; . . 7 . . . Y N
39. Have you e v e r d e s t r o y e d p r o p e r t Y o r g o t t e n i n t o a p h y s i c a l f i g h t when you were d r i n k i n g ? . . . . . . . . . . . . . . C Y N
40 . Have you e v e r p a r t i c i p a t e d i n an aCcohol t r e a t m e n t p r o g r a m b e f o r e ? . . . . . . . . . . . . . . . . . . . . . . . . . . . . . . . . . . . . . . . . Y N
36.
37.
38.
41. Do you f e e ! you h a v e a p r o b l e m w i t h a l c o h o l a t t h i s t ime?. . . . . . . . . , . . . . . . . . . . . . Y N
C o m m e n t s
- 1 9 6 -


f l "
/
\ I
- - 8 .
1, !