fireye explorer communication software · 1 section i general functions description fireye explorer...
TRANSCRIPT

1
SECTION I GENERAL FUNCTIONS
DESCRIPTIONFireye Explorer is a real-time data collection and monitoring software program for use with the Fir-eye range of Flame Scanners with communication capabilities. These include the 105 series ParagonFlame Scanners, the 95IRS2, 95UVS2 and 95DSS2 InSight I Flame scanners (with optional con-verter) and the 95DSS3 InSight II Flame Scanner.
This software may be used to program the Paragon and InSight II flame scanners, and provideextremely useful real time data, in a variety of formats, for the operator. The displays are all precon-figured, presenting the information in a format readily recognizable by instrument engineers andoperators alike.
The users should first make themselves familiar with the type of scanner in use at their facility byreferring to the appropriate Technical bulletin, before studying this document.
FIREYE EXPLORER FEATURESInformation is displayed in several formats, suitable for the data being displayed. Analog signals,like Flame Quality, (FQ) are depicted as bar graph type gauges, the range and set points being clearlyshown, giving instant information on the status of the flame signal without actually having to readdigital information. These displays, called “faceplates”, can be individually arranged on the screen,in the form of small windows, to show the signals in their relative positions on the boiler front. Thismakes it extremely simple to identify flame problems, and on which burner it occurs, at a glance.
Digital information, Flame ON, Flame OFF etc are displayed by simply changing the color fromRED to GREEN, or vice versa, for instant indication of change of state.
An event list gives on screen information as pre-determined events occur, and these can cover flamestatus change ON to OFF and vice versa.
For more detailed information on Scanner responses to the flames, the analyzed signals can be dis-played in a graphical format, and even stored and recalled when required.
Trending is an integral part of the provided software, and responses, shutdowns, signal strengths andgains are all available for real time and historical, display.
If it is required to transmit the scanner data to a plant wide DCS, FEX provides an OPC server inter-face, via Ethernet, to enable the DCS to interrogate any data point within the scanner, which is “onscan”.
Fireye ExplorerCommunication Software
For Fireye Flame Scanners with communication facilities.
CU-109JUNE 17, 2014

2
SYSTEM REQUIREMENTSThe following represents the minimum hardware requirements for a Windows1 compatible PC to runThe Fireye Explorer (FEX) communication software program:
- Microsoft Windows XP/7/8 operating system, with access to all features, and full administrationrights.
- 1 serial communications port, or USB port, configured for Serial communication, providing anRS485 interface.
As most modern PC’s and laptops have USB ports as standard, we recommend the use of part num-ber UC485, which is a port powered USB to RS485 2 wire converter. A standard serial 9 way “D”connected RS232 can also be supported by using part number IC485, and a 24 volt power supply.This converter is suitable for 2 wire RS485 to RS232.
1. Windows is a registered trademark of Microsoft.2. Fireye recommends using P/N UC485 which is a USB to RS485 converter that is powered fromthe USB port.
3
Table of ContentsSECTION I GENERAL FUNCTIONS . . . . . . . . . . . . . . . . . . . . . . . . . . . . . . . . . . . . . . . . . . . . . . . . . . . . . . 1
DESCRIPTION. . . . . . . . . . . . . . . . . . . . . . . . . . . . . . . . . . . . . . . . . . . . . . . . . . . . . . . . . . . . . . . . . . . . . . . . . . . 1FIREYE EXPLORER FEATURES . . . . . . . . . . . . . . . . . . . . . . . . . . . . . . . . . . . . . . . . . . . . . . . . . . . . . . . . . . . . 1SYSTEM REQUIREMENTS. . . . . . . . . . . . . . . . . . . . . . . . . . . . . . . . . . . . . . . . . . . . . . . . . . . . . . . . . . . . . . . . . 2
PROGRAM LOADING, START UP AND SHUT DOWN . . . . . . . . . . . . . . . . . . . . . . . . . . . . . . . . . . . . . . . . 4CONNECTING SCANNERS TO THE PC . . . . . . . . . . . . . . . . . . . . . . . . . . . . . . . . . . . . . . . . . . . . . . . . . . . . . . 6
USING FIREYE EXPLORER SOFTWARE (FEX). . . . . . . . . . . . . . . . . . . . . . . . . . . . . . . . . . . . . . . . . . . . . 8ADDING SCANNERS TO THE PROJECT. . . . . . . . . . . . . . . . . . . . . . . . . . . . . . . . . . . . . . . . . . . . . . . . . . . . . 10DEFAULT LOGIN . . . . . . . . . . . . . . . . . . . . . . . . . . . . . . . . . . . . . . . . . . . . . . . . . . . . . . . . . . . . . . . . . . . . . . . . 17WINDOW SETS . . . . . . . . . . . . . . . . . . . . . . . . . . . . . . . . . . . . . . . . . . . . . . . . . . . . . . . . . . . . . . . . . . . . . . . . . 20MANAGE SHORTCUTS. . . . . . . . . . . . . . . . . . . . . . . . . . . . . . . . . . . . . . . . . . . . . . . . . . . . . . . . . . . . . . . . . . . 21
COMMON DISPLAY FUNCTIONS . . . . . . . . . . . . . . . . . . . . . . . . . . . . . . . . . . . . . . . . . . . . . . . . . . . . . . . 24CHART ICONS. . . . . . . . . . . . . . . . . . . . . . . . . . . . . . . . . . . . . . . . . . . . . . . . . . . . . . . . . . . . . . . . . . . . . . . . . . 24DEVICE BACKUP AND RESTORE . . . . . . . . . . . . . . . . . . . . . . . . . . . . . . . . . . . . . . . . . . . . . . . . . . . . . . . . . . 28TRENDS AND CHARTS . . . . . . . . . . . . . . . . . . . . . . . . . . . . . . . . . . . . . . . . . . . . . . . . . . . . . . . . . . . . . . . . . . 30
INSIGHT II DISPLAYS . . . . . . . . . . . . . . . . . . . . . . . . . . . . . . . . . . . . . . . . . . . . . . . . . . . . . . . . . . . . . . . . 31COMMON COMMANDS . . . . . . . . . . . . . . . . . . . . . . . . . . . . . . . . . . . . . . . . . . . . . . . . . . . . . . . . . . . . . . . . . . 31ADMINISTRATION LOGIN. . . . . . . . . . . . . . . . . . . . . . . . . . . . . . . . . . . . . . . . . . . . . . . . . . . . . . . . . . . . . . . . . 32AUTOTUNE FACEPLATE. . . . . . . . . . . . . . . . . . . . . . . . . . . . . . . . . . . . . . . . . . . . . . . . . . . . . . . . . . . . . . . . . . 33TUNING BAY FACEPLATE . . . . . . . . . . . . . . . . . . . . . . . . . . . . . . . . . . . . . . . . . . . . . . . . . . . . . . . . . . . . . . . . 35FILE COPY FACEPLATE . . . . . . . . . . . . . . . . . . . . . . . . . . . . . . . . . . . . . . . . . . . . . . . . . . . . . . . . . . . . . . . . . . 37FUEL SELECT FACEPLATE . . . . . . . . . . . . . . . . . . . . . . . . . . . . . . . . . . . . . . . . . . . . . . . . . . . . . . . . . . . . . . . 38WINC DISPLAYS . . . . . . . . . . . . . . . . . . . . . . . . . . . . . . . . . . . . . . . . . . . . . . . . . . . . . . . . . . . . . . . . . . . . . . . . . .39UV & IRFQ FACEPLATES . . . . . . . . . . . . . . . . . . . . . . . . . . . . . . . . . . . . . . . . . . . . . . . . . . . . . . . . . . . . . . . . . . .41R1 & R2 FQ . . . . . . . . . . . . . . . . . . . . . . . . . . . . . . . . . . . . . . . . . . . . . . . . . . . . . . . . . . . . . . . . . . . . . . . . . . . . . .42FACTORY DATA FACEPLATE . . . . . . . . . . . . . . . . . . . . . . . . . . . . . . . . . . . . . . . . . . . . . . . . . . . . . . . . . . . . . . . .42OPERATIONAL DATA. . . . . . . . . . . . . . . . . . . . . . . . . . . . . . . . . . . . . . . . . . . . . . . . . . . . . . . . . . . . . . . . . . . . . . .43REALTIME CLOCK FACEPLATE . . . . . . . . . . . . . . . . . . . . . . . . . . . . . . . . . . . . . . . . . . . . . . . . . . . . . . . . . . . . . .43
INSIGHT I DISPLAYS . . . . . . . . . . . . . . . . . . . . . . . . . . . . . . . . . . . . . . . . . . . . . . . . . . . . . . . . . . . . . . . . . 44DATA. . . . . . . . . . . . . . . . . . . . . . . . . . . . . . . . . . . . . . . . . . . . . . . . . . . . . . . . . . . . . . . . . . . . . . . . . . . . . . . . . . 44FLAME QUALITY (FQ). . . . . . . . . . . . . . . . . . . . . . . . . . . . . . . . . . . . . . . . . . . . . . . . . . . . . . . . . . . . . . . . . . . . 44CHARTS AND TRENDS . . . . . . . . . . . . . . . . . . . . . . . . . . . . . . . . . . . . . . . . . . . . . . . . . . . . . . . . . . . . . . . . . . 45TAG CHARTS. . . . . . . . . . . . . . . . . . . . . . . . . . . . . . . . . . . . . . . . . . . . . . . . . . . . . . . . . . . . . . . . . . . . . . . . . . . 47
PARAGON DISPLAYS. . . . . . . . . . . . . . . . . . . . . . . . . . . . . . . . . . . . . . . . . . . . . . . . . . . . . . . . . . . . . . . . . 48FLAME TEMPERATURE . . . . . . . . . . . . . . . . . . . . . . . . . . . . . . . . . . . . . . . . . . . . . . . . . . . . . . . . . . . . . . . . . . 48NODE ADDRESS) . . . . . . . . . . . . . . . . . . . . . . . . . . . . . . . . . . . . . . . . . . . . . . . . . . . . . . . . . . . . . . . . . . . . . . . 48PARAMETER SETTING. . . . . . . . . . . . . . . . . . . . . . . . . . . . . . . . . . . . . . . . . . . . . . . . . . . . . . . . . . . . . . . . . . . 49TRANSITION HISTORY. . . . . . . . . . . . . . . . . . . . . . . . . . . . . . . . . . . . . . . . . . . . . . . . . . . . . . . . . . . . . . . . . . . 49PARAGON TRACES . . . . . . . . . . . . . . . . . . . . . . . . . . . . . . . . . . . . . . . . . . . . . . . . . . . . . . . . . . . . . . . . . . . . . 50TREND CHARTS . . . . . . . . . . . . . . . . . . . . . . . . . . . . . . . . . . . . . . . . . . . . . . . . . . . . . . . . . . . . . . . . . . . . . . . . 52

4
PROGRAM LOADING, START-UP AND SHUTDOWN
LOADINGInstall a serial port interface, if not already available. Refer to Installation of the UC485.
Insert the FEX program CD, and follow all the default settings to load the program. FEX software isWindows XP/7/8 compatible
During the installation, a shortcut will be placed on your desktop.
Double clicking this icon will start the FEX program. During the first operationof the program a pass code is required. Note the number on the screen and contactyour supplier for the activation code.
INSTALLATION ISSUESIn some instances where the security levels set within the PC are high, certain keysoftware modules in FEX can be prevented from being installed. This is very common on networkedCompany PC's which have "firewalls", and various other protective software which is designed toprevent virus's getting into networks.
It is required that the installation is performed with Administrator rights. If after installing the soft-ware, it fails to run, or possibly runs, but limits some functions such as "writing" to a flame scanner,then it may be necessary to change the USER Account security status, and Firewalls need to beturned off. We suggest consulting your IT department before doing this.
User Account.
User account security should be set to its lowest level for the installation. Once FEX is installed theUser account security should be returned to its original setting.
First select Control Panel, Select User Accounts, Select Change User Account Control settings,Move the slider down to Never notify, and click OK.
Reinstallation of FEX.
First Uninstall FEX from the control panel. Then reinstall, and run the program. A security box willappear, apply to your distributor for the password, by providing the displayed code Fireye EXP02.xx-xxxxxxxx. Once the password is received, enter this, at which point the programwill run correctly.
Restore the User account. (If there is a delay between starting FEX for the first time and receivingthe password, then set the User account back during this time). It should not be necessary to set theUser account, when restarting FEX and entering the password.
STARTUPIt is not important to set up basic options at this stage. They can be configured at any time, but eachchange will require the program to be stopped, and restarted to ensure the changes have been imple-mented. To make the changes, start the program, select OPTIONS, PREFERENCES.
The display below will appear, allowing several options to be selected.

5
Auto Start Application
This will automatically start the FEX program as soon as windows is started.
Auto Load Project.
This will allow any project that has been configured to start automatically on start up. On selectionof this option, the list of available programs will "drop down" and the required one selected..
Start Run Time Collect on Startup
Selecting this option will automatically put all scanners on line at start up.
Save default window set on exit, and recall on start up.
As the operators become familiar with certain display configurations, this preferred window set canbe called automatically on start up
Inactivity automatic logout after X minutes.
To save disc storage space, selecting this option will stop data collection after a pre-determined time.This time is settable by the operator.
The standard "out of the box" configuration is set such that only a limited amount of data is histori-cally stored. It is therefore necessary to re-configure the required data that will be stored to coverindividual site requirements.
SHUTDOWN
As the FEX software not only allows detailed information to be displayed, but also acts as a data col-lector, and simple SCADA package, it is quite important that the functions are not interrupted bymistake. As such, some of the normal Windows commands are interpreted differently. For example,the X in the top right hand corner is normally used to shut down a running application. FEX treatsthis in a different way, and simply minimizes the displays, putting the running icon onto the task trayat the bottom of the display. At the same time it displays the message.
To shut down the application it is necessary to select "File" and the Exit command.

6
CONNECTING SCANNERS TO THE PC.As already indicated, most modern PC's or laptops no longer have an RS232 standard D type con-nection. As this interface is the single point of entry for all data to and from the scanners, it is imper-ative that this device is correctly set up, and fully functional. To avoid any problems it isrecommended that the port powered USB/485 is used, and the following set up procedure followedcarefully.
FIGURE 1. UC485 WIRING
UC485 dip switch settings on the back of the device should be:
(SW1) RS-485-ON
(SW2) ECHO OFF-ON
(SW3) 2 Wire-ON
(SW4) 2 Wire-ON
For use with Fireye equipment, it is recommended that all dip switches be set to the ON position.
Wiring (Fireye cable colors are listed):
TDA (-) = Orange
TDB (+) = Brown
Please check data sheet for the scanners that you are using, as there may be differences in core col-ors, and connecting the wrong cables may cause damage to the converter.
When you install the UC485 Driver into your PC (with the CD ROM provided), it will select a COMnumber for your PC's USB port. The number selected may vary from PC to PC, and from UC485 toUC485. After installing the UC485 driver, for proper operation you should verify the COM portselection in your PC.
GND
TDA (-)
TDB (+)
RDA (-)
RDB (+)
COM B
COM A
COM B
COM A
(ORANGE)
(BROWN)
COMMUNICATIONSTERMINATOR 100 ON LAST SCANNER
TD
RD
USB CABLE
COM B
COM A
RS-422
Echo ON
4 Wire
4 Wire
RS-485
Echo OFF
2 Wire
2 Wire
OFF ON
DIP SWITCHES - REAR VIEW

7
To see which USB COM port number has been selected, mouse-click the following at your PC key-board:
1. START
2. CONTROL PANEL
3. SYSTEM
4. HARDWARE
5. DEVICE MANAGER
6. PORTS (COM & LPT)
7. *RS485 ISOLATED PORT (COMx) (For example: (COM9))
*(To see this line, the UC485 Driver must have been installed and the UC485 Converter must actu-ally be installed into the USB port of the PC)
For proper operation, the PC's USB COM port number, and the COM port number selected in thesoftware must be the same. While running FEX, this is not an issue as the software looks through theavailable ports and reports those that are available. If the USB driver software is correctly installed,and the device is plugged in, it will be automatically found.
To change the com port number, continue as described below:
8. PORT SETTINGS
9. ADVANCED
10. COM PORT NUMBER (e.g. COM9)*
*This is a pull-down menu where you may scroll and select the desired port.
8
USING FIREYE EXPLORER SOFTWARE (FEX)Having successfully installed the software, and hardware, for the RS485 interface, and the port re-allocated, if necessary, the scanners may now be connected to the PC, once the basic parameters havebeen set.
The first time the program is run it will ask for an activation key. A code will appear on the screen.This code must be passed onto your supplier for an activation number. Once this code is input, theprogram will run and will never need to be re-entered all the time the program is run on the samemachine. Installing the software onto another machine will require another activation code, and youwill be charged for this additional license.
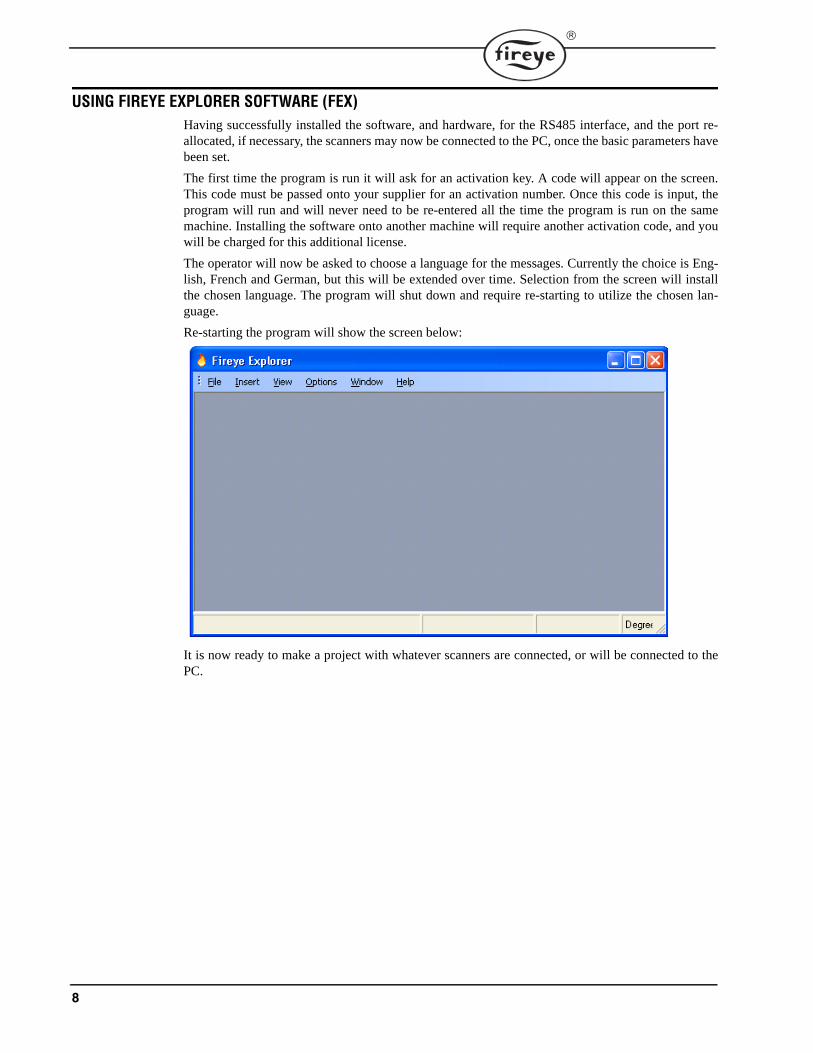
The operator will now be asked to choose a language for the messages. Currently the choice is Eng-lish, French and German, but this will be extended over time. Selection from the screen will installthe chosen language. The program will shut down and require re-starting to utilize the chosen lan-guage.
Re-starting the program will show the screen below:
It is now ready to make a project with whatever scanners are connected, or will be connected to thePC.
9
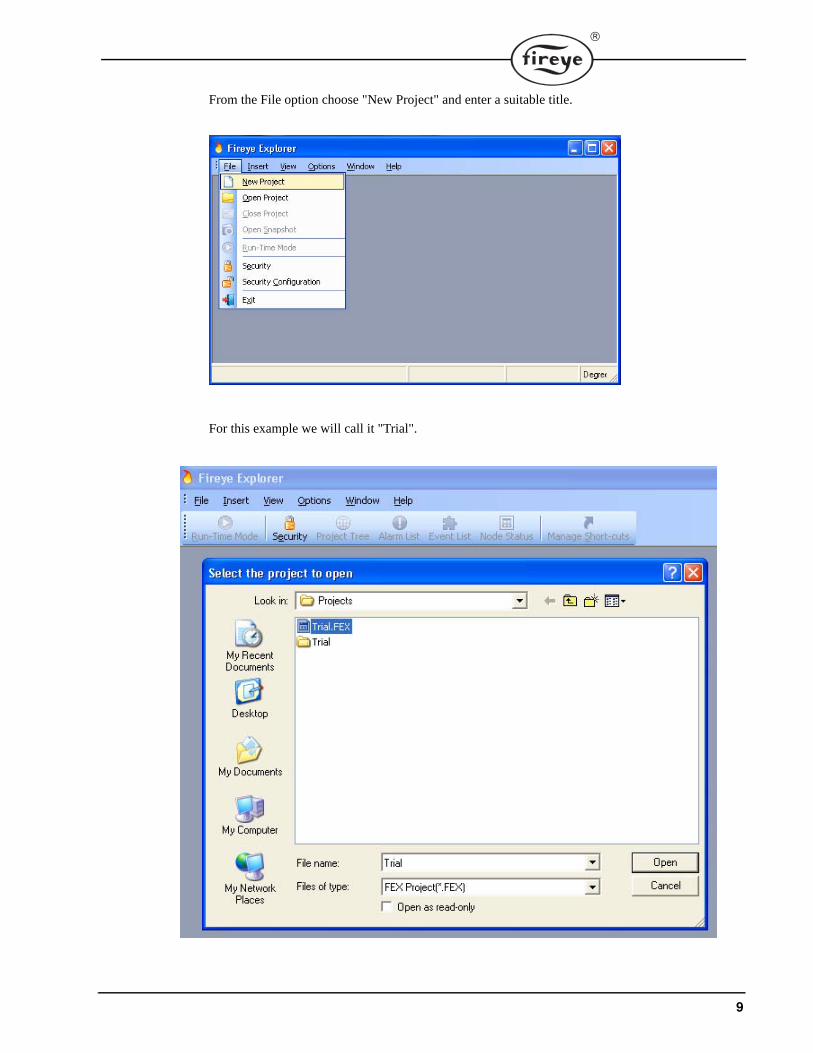
From the File option choose "New Project" and enter a suitable title.
For this example we will call it "Trial".
10
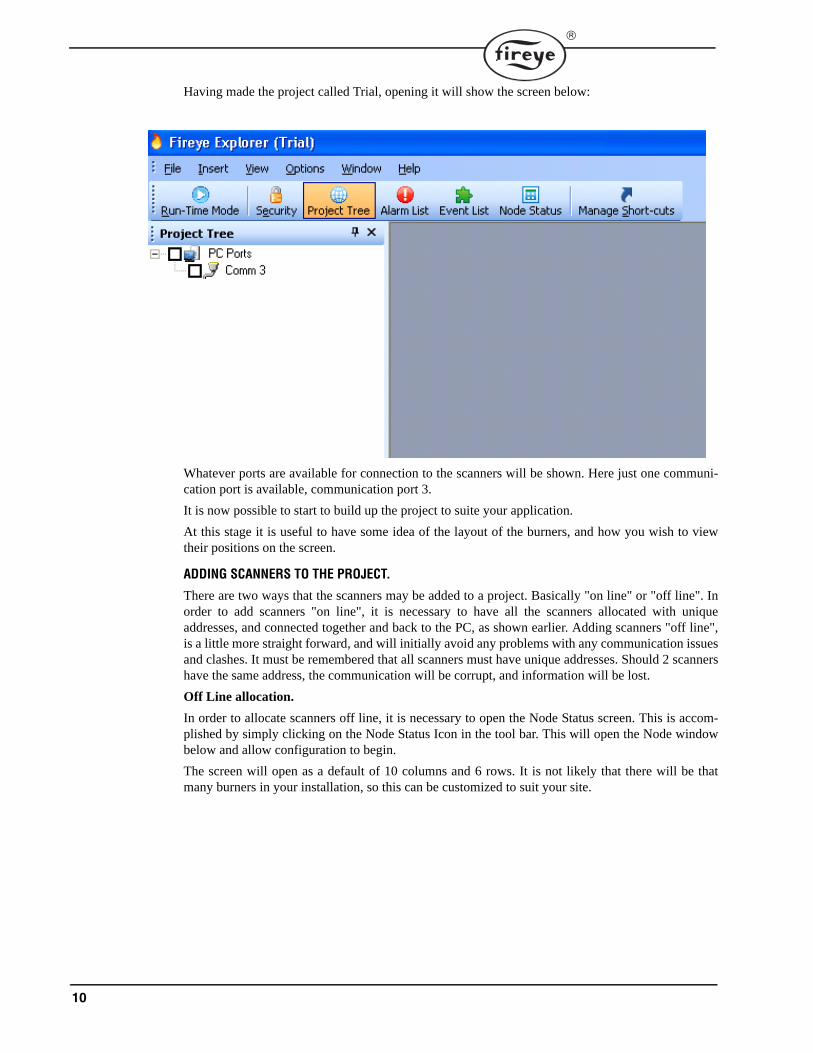
Having made the project called Trial, opening it will show the screen below:
Whatever ports are available for connection to the scanners will be shown. Here just one communi-cation port is available, communication port 3.
It is now possible to start to build up the project to suite your application.
At this stage it is useful to have some idea of the layout of the burners, and how you wish to viewtheir positions on the screen.
ADDING SCANNERS TO THE PROJECT.
There are two ways that the scanners may be added to a project. Basically "on line" or "off line". Inorder to add scanners "on line", it is necessary to have all the scanners allocated with uniqueaddresses, and connected together and back to the PC, as shown earlier. Adding scanners "off line",is a little more straight forward, and will initially avoid any problems with any communication issuesand clashes. It must be remembered that all scanners must have unique addresses. Should 2 scannershave the same address, the communication will be corrupt, and information will be lost.
Off Line allocation.
In order to allocate scanners off line, it is necessary to open the Node Status screen. This is accom-plished by simply clicking on the Node Status Icon in the tool bar. This will open the Node windowbelow and allow configuration to begin.
The screen will open as a default of 10 columns and 6 rows. It is not likely that there will be thatmany burners in your installation, so this can be customized to suit your site.

11
If we assume that there are 3 rows of 6 burners, this can be achieved as shown below
.
Selecting the icon shows the below screen, and by sliding the pointer along the scales allows therequired display to be achieved.
12
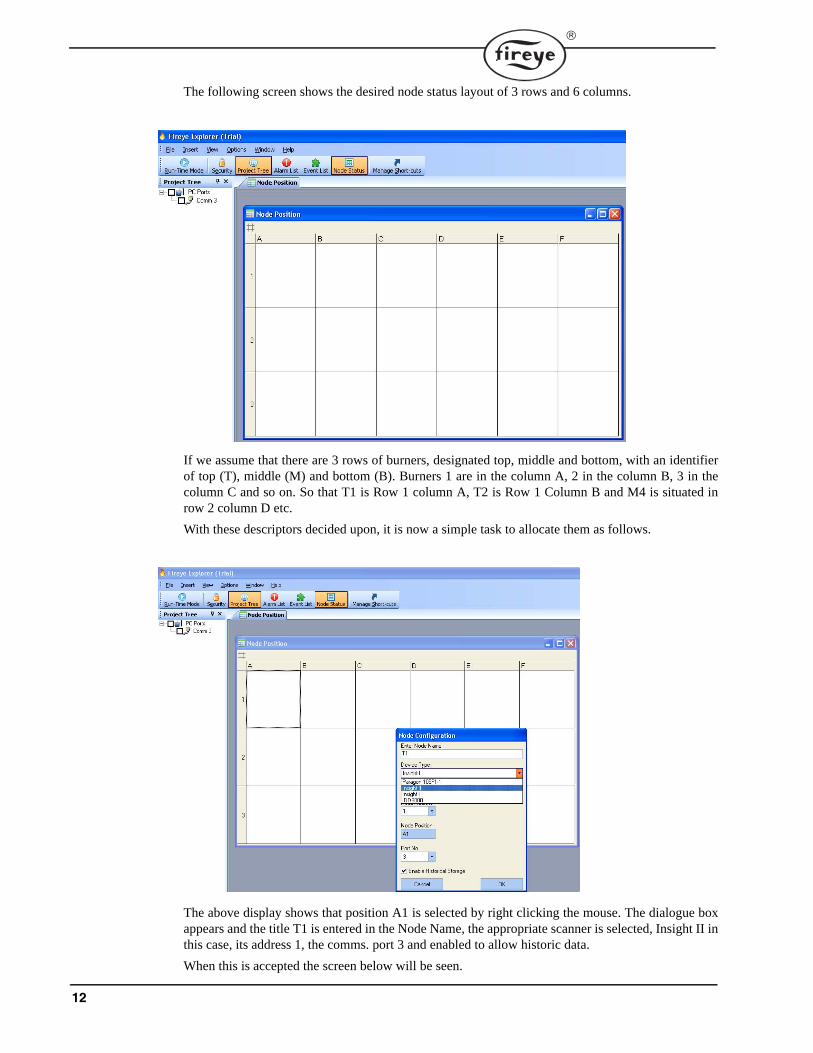
The following screen shows the desired node status layout of 3 rows and 6 columns.
If we assume that there are 3 rows of burners, designated top, middle and bottom, with an identifierof top (T), middle (M) and bottom (B). Burners 1 are in the column A, 2 in the column B, 3 in thecolumn C and so on. So that T1 is Row 1 column A, T2 is Row 1 Column B and M4 is situated inrow 2 column D etc.
With these descriptors decided upon, it is now a simple task to allocate them as follows.
The above display shows that position A1 is selected by right clicking the mouse. The dialogue boxappears and the title T1 is entered in the Node Name, the appropriate scanner is selected, Insight II inthis case, its address 1, the comms. port 3 and enabled to allow historic data.
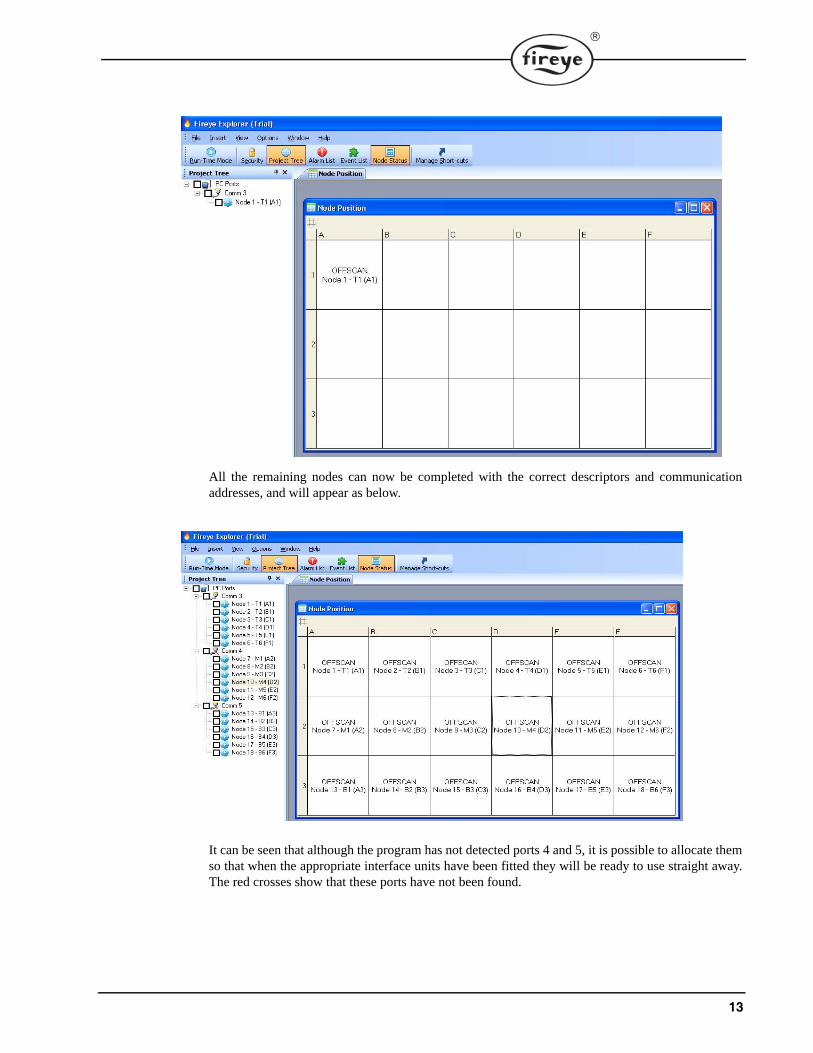
When this is accepted the screen below will be seen.
13
All the remaining nodes can now be completed with the correct descriptors and communicationaddresses, and will appear as below.
It can be seen that although the program has not detected ports 4 and 5, it is possible to allocate themso that when the appropriate interface units have been fitted they will be ready to use straight away.The red crosses show that these ports have not been found.
14
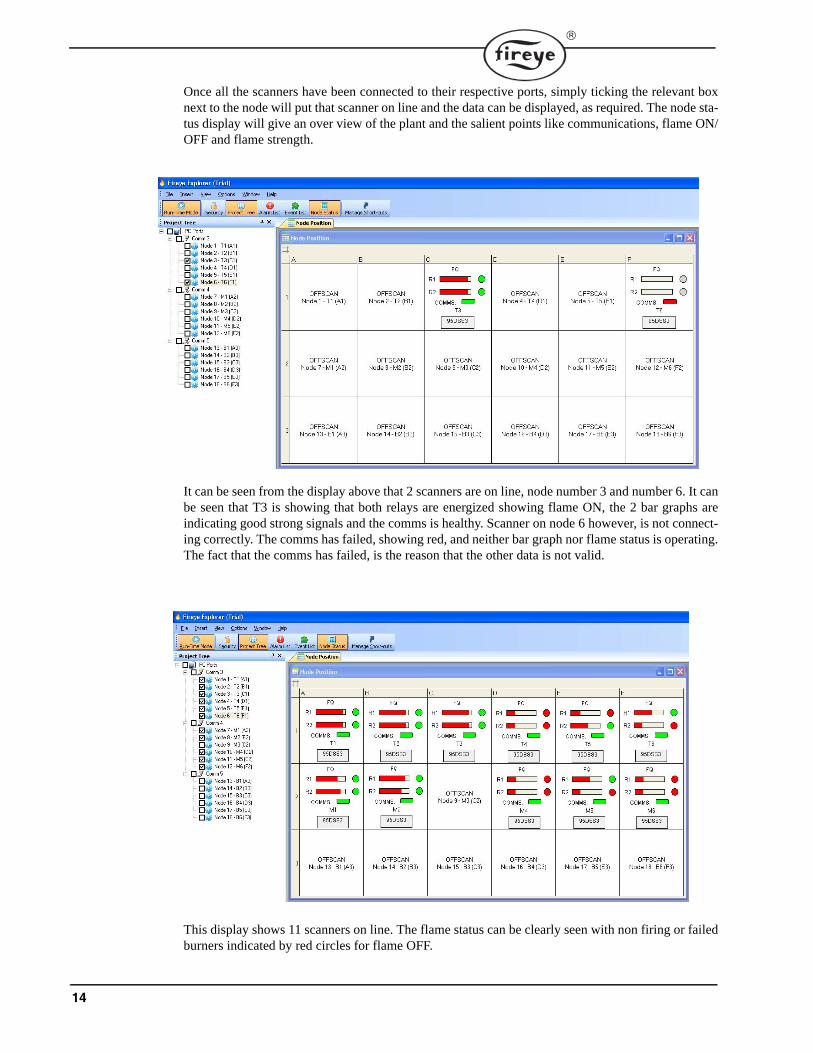
Once all the scanners have been connected to their respective ports, simply ticking the relevant boxnext to the node will put that scanner on line and the data can be displayed, as required. The node sta-tus display will give an over view of the plant and the salient points like communications, flame ON/OFF and flame strength.
It can be seen from the display above that 2 scanners are on line, node number 3 and number 6. It canbe seen that T3 is showing that both relays are energized showing flame ON, the 2 bar graphs areindicating good strong signals and the comms is healthy. Scanner on node 6 however, is not connect-ing correctly. The comms has failed, showing red, and neither bar graph nor flame status is operating.The fact that the comms has failed, is the reason that the other data is not valid.
This display shows 11 scanners on line. The flame status can be clearly seen with non firing or failedburners indicated by red circles for flame OFF.
15
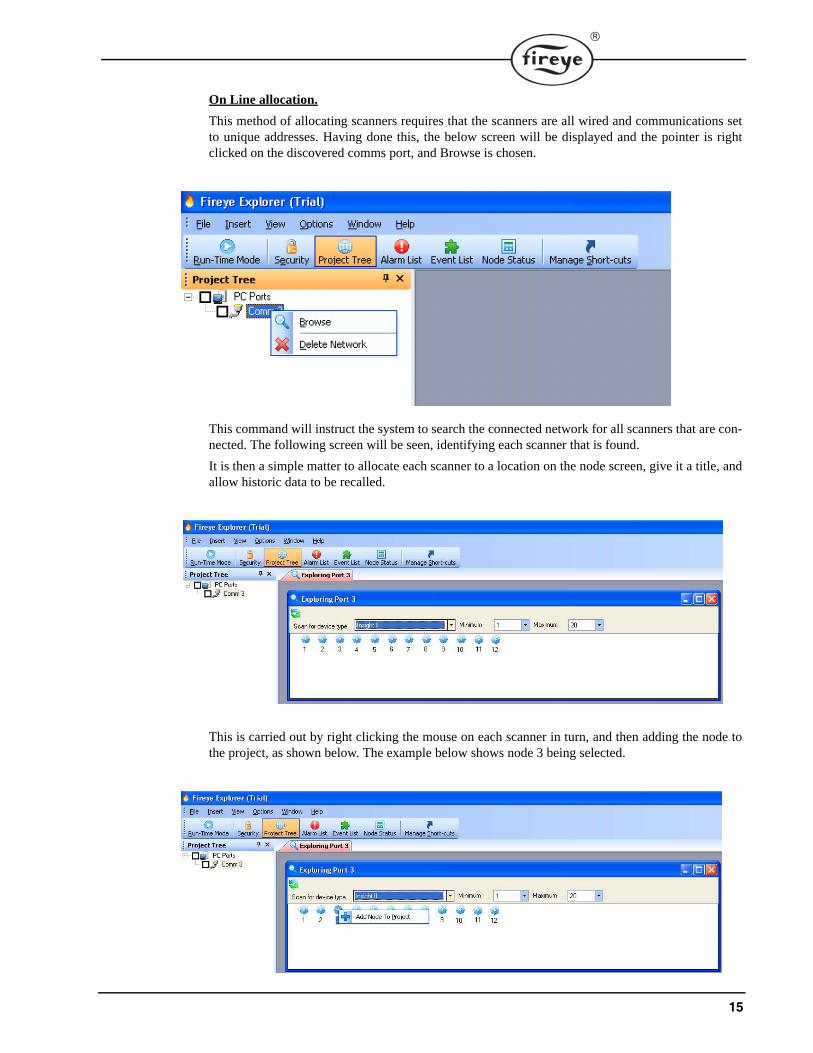
On Line allocation.
This method of allocating scanners requires that the scanners are all wired and communications setto unique addresses. Having done this, the below screen will be displayed and the pointer is rightclicked on the discovered comms port, and Browse is chosen.
This command will instruct the system to search the connected network for all scanners that are con-nected. The following screen will be seen, identifying each scanner that is found.
It is then a simple matter to allocate each scanner to a location on the node screen, give it a title, andallow historic data to be recalled.
This is carried out by right clicking the mouse on each scanner in turn, and then adding the node tothe project, as shown below. The example below shows node 3 being selected.
16
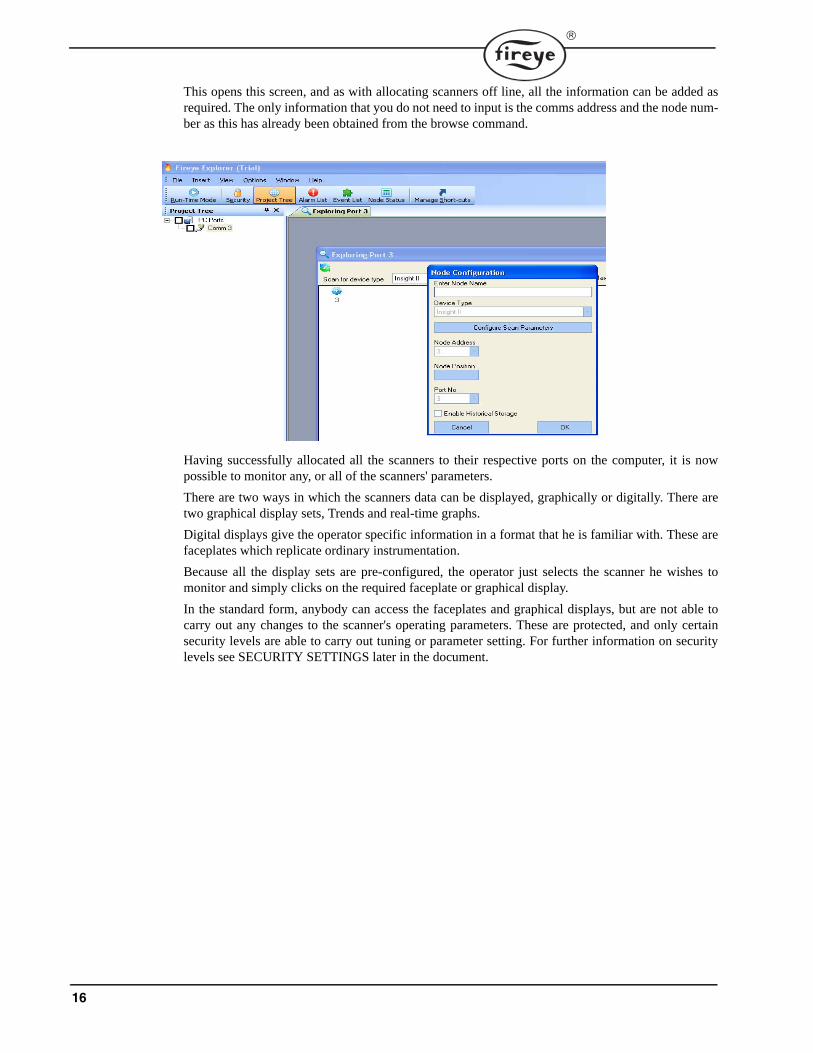
This opens this screen, and as with allocating scanners off line, all the information can be added asrequired. The only information that you do not need to input is the comms address and the node num-ber as this has already been obtained from the browse command.
Having successfully allocated all the scanners to their respective ports on the computer, it is nowpossible to monitor any, or all of the scanners' parameters.
There are two ways in which the scanners data can be displayed, graphically or digitally. There aretwo graphical display sets, Trends and real-time graphs.
Digital displays give the operator specific information in a format that he is familiar with. These arefaceplates which replicate ordinary instrumentation.
Because all the display sets are pre-configured, the operator just selects the scanner he wishes tomonitor and simply clicks on the required faceplate or graphical display.
In the standard form, anybody can access the faceplates and graphical displays, but are not able tocarry out any changes to the scanner's operating parameters. These are protected, and only certainsecurity levels are able to carry out tuning or parameter setting. For further information on securitylevels see SECURITY SETTINGS later in the document.

17
DEFAULT LOGIN.
When initially installed, the security level is called Default. At this level, anyone with access to thecomputer can carry out certain functions. The creation of new projects, the allocation of the scanners,the positions of the scanners on the Node Status screen, the naming of each scanner, and subsequentviewing of faceplates and graphs are all permitted via this default level. There are also additionaloperations that are available at this level.
The first one is configuration of the node scanning parameters.
The above display shows a section of the scan parameters that are settable. In order to keep theresponse time of the software to an acceptable level, data is only collected as required for the dis-plays. If it is required to store data, irrespective of whether it is displayed or not, the data will have tobe put on permanent data collect. This is achieved by ticking the box adjacent to the data required, ascan be seen in the above screen. In order to utilize the historic data displays, the raw IR signals areput on Data Collect. If this is not required, then the boxes may be un-ticked, and the data will only becollected when the display is active.
It is possible to monitor areas of the data map that are not currently being displayed. This is carriedout via the Monitor Window. This allows any number of points within the scanner's data map to bemonitored while the scanner is in operation.
To utilize this facility, click on the Insert Tab at the top of the screen, and an option Monitor Windowis displayed. Clicking on this option will open the screen below:

18
It is now necessary to click on the scanner you wish to monitor, and view the tags for this scanner.This is achieved by right clicking the scanner and choosing the View Tags option. This opens the taglist as below.
Highlighting the required tags, and dragging and dropping them onto the monitor window will showthe values of those parameters when the scanner is put on scan. Multiple scanners can be droppedonto the monitor window to compare one with another.
If just one scanner is being monitored, and the required parameters are adjacent, as the above exam-ple, it is possible to just utilize the tag list, and tick the On Scan box. This will display the selectedparameters within the tag list, once the node is put on scan.
19
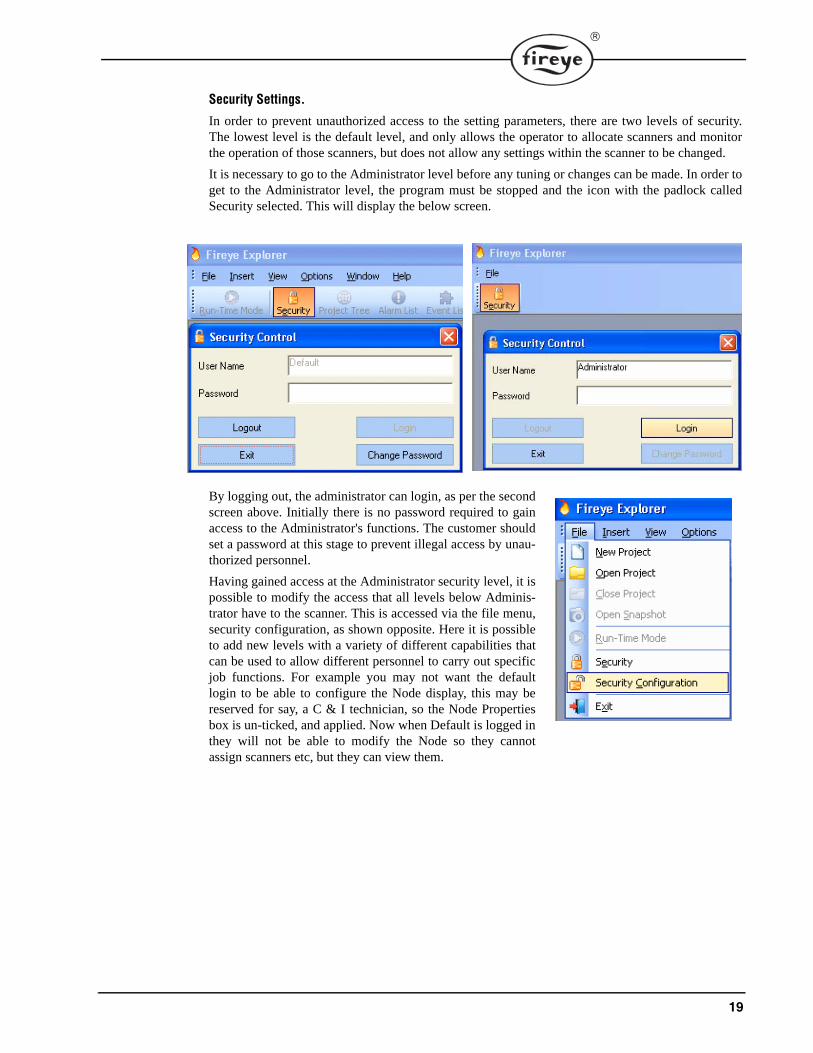
Security Settings.
In order to prevent unauthorized access to the setting parameters, there are two levels of security.The lowest level is the default level, and only allows the operator to allocate scanners and monitorthe operation of those scanners, but does not allow any settings within the scanner to be changed.
It is necessary to go to the Administrator level before any tuning or changes can be made. In order toget to the Administrator level, the program must be stopped and the icon with the padlock calledSecurity selected. This will display the below screen.
By logging out, the administrator can login, as per the secondscreen above. Initially there is no password required to gainaccess to the Administrator's functions. The customer shouldset a password at this stage to prevent illegal access by unau-thorized personnel.
Having gained access at the Administrator security level, it ispossible to modify the access that all levels below Adminis-trator have to the scanner. This is accessed via the file menu,security configuration, as shown opposite. Here it is possibleto add new levels with a variety of different capabilities thatcan be used to allow different personnel to carry out specificjob functions. For example you may not want the defaultlogin to be able to configure the Node display, this may bereserved for say, a C & I technician, so the Node Propertiesbox is un-ticked, and applied. Now when Default is logged inthey will not be able to modify the Node so they cannotassign scanners etc, but they can view them.
20
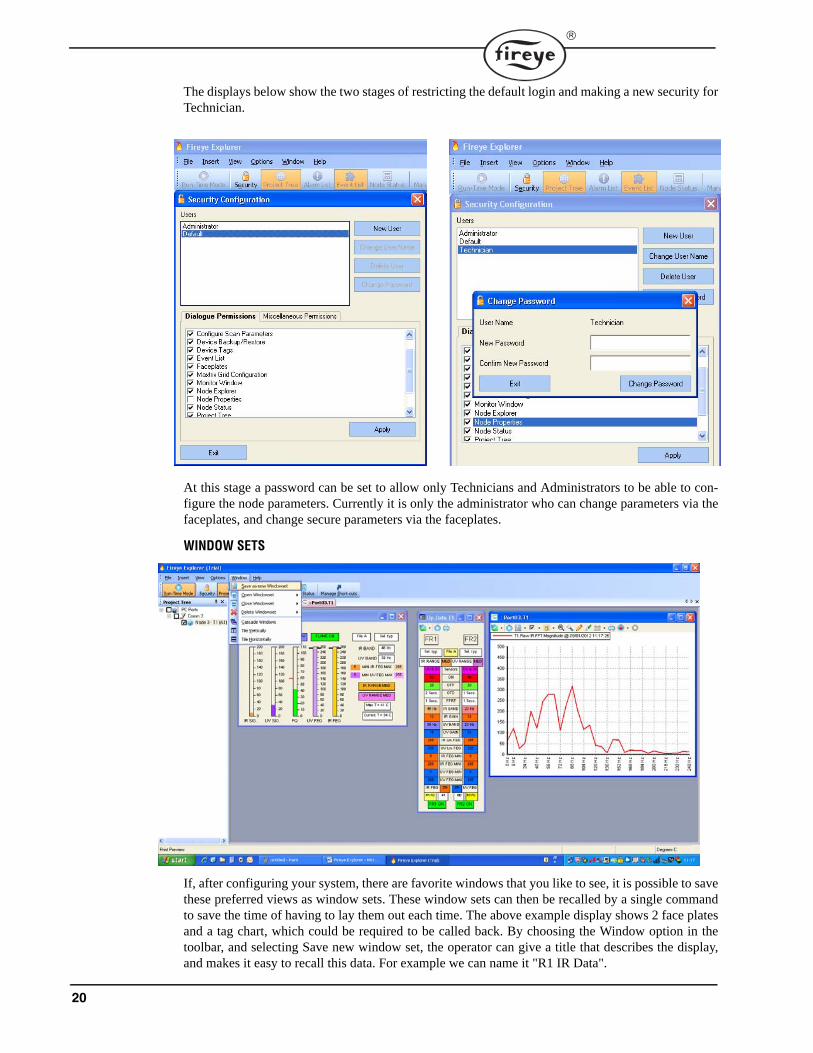
The displays below show the two stages of restricting the default login and making a new security forTechnician.
At this stage a password can be set to allow only Technicians and Administrators to be able to con-figure the node parameters. Currently it is only the administrator who can change parameters via thefaceplates, and change secure parameters via the faceplates.
WINDOW SETS
If, after configuring your system, there are favorite windows that you like to see, it is possible to savethese preferred views as window sets. These window sets can then be recalled by a single commandto save the time of having to lay them out each time. The above example display shows 2 face platesand a tag chart, which could be required to be called back. By choosing the Window option in thetoolbar, and selecting Save new window set, the operator can give a title that describes the display,and makes it easy to recall this data. For example we can name it "R1 IR Data".
21
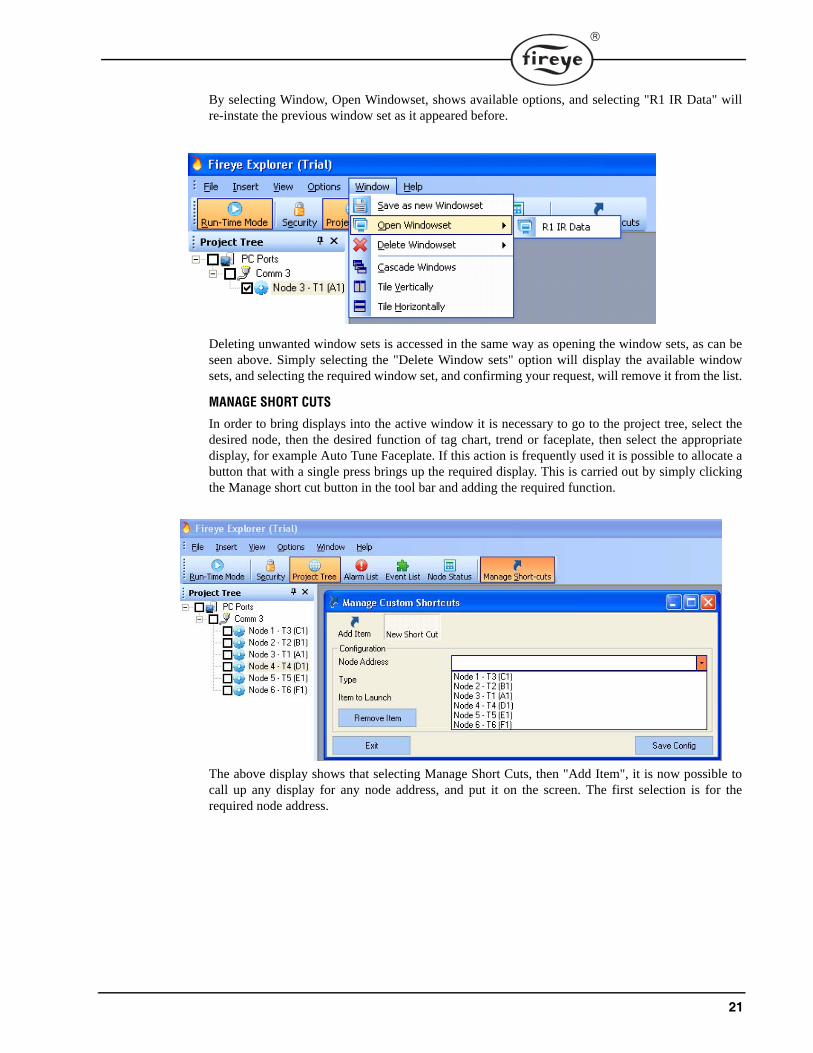
By selecting Window, Open Windowset, shows available options, and selecting "R1 IR Data" willre-instate the previous window set as it appeared before.
Deleting unwanted window sets is accessed in the same way as opening the window sets, as can beseen above. Simply selecting the "Delete Window sets" option will display the available windowsets, and selecting the required window set, and confirming your request, will remove it from the list.
MANAGE SHORT CUTS
In order to bring displays into the active window it is necessary to go to the project tree, select thedesired node, then the desired function of tag chart, trend or faceplate, then select the appropriatedisplay, for example Auto Tune Faceplate. If this action is frequently used it is possible to allocate abutton that with a single press brings up the required display. This is carried out by simply clickingthe Manage short cut button in the tool bar and adding the required function.
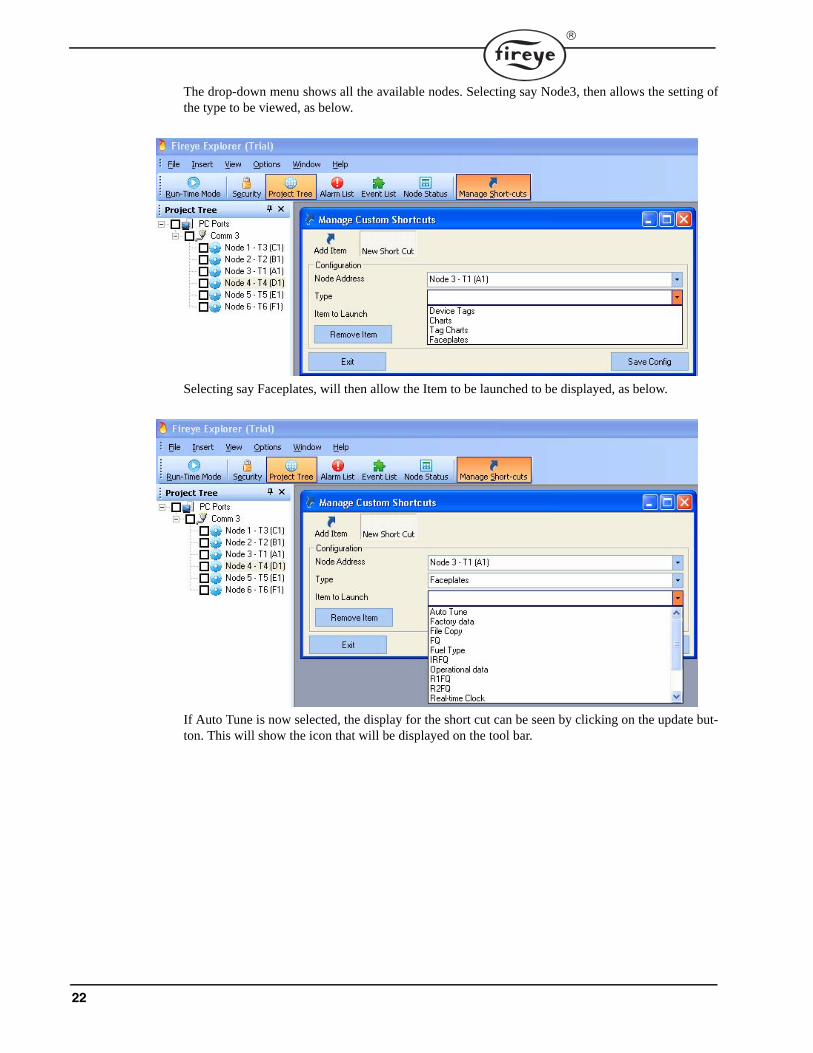
The above display shows that selecting Manage Short Cuts, then "Add Item", it is now possible tocall up any display for any node address, and put it on the screen. The first selection is for therequired node address.
22
The drop-down menu shows all the available nodes. Selecting say Node3, then allows the setting ofthe type to be viewed, as below.
Selecting say Faceplates, will then allow the Item to be launched to be displayed, as below.
If Auto Tune is now selected, the display for the short cut can be seen by clicking on the update but-ton. This will show the icon that will be displayed on the tool bar.
23
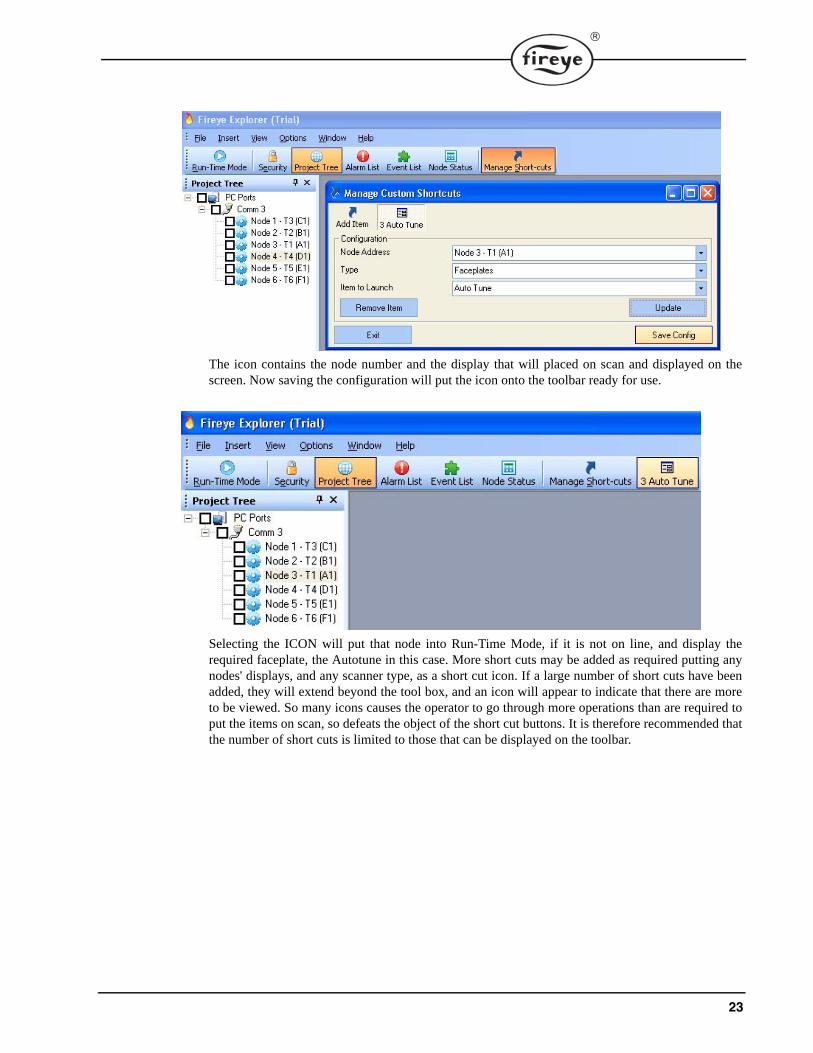
The icon contains the node number and the display that will placed on scan and displayed on thescreen. Now saving the configuration will put the icon onto the toolbar ready for use.
Selecting the ICON will put that node into Run-Time Mode, if it is not on line, and display therequired faceplate, the Autotune in this case. More short cuts may be added as required putting anynodes' displays, and any scanner type, as a short cut icon. If a large number of short cuts have beenadded, they will extend beyond the tool box, and an icon will appear to indicate that there are moreto be viewed. So many icons causes the operator to go through more operations than are required toput the items on scan, so defeats the object of the short cut buttons. It is therefore recommended thatthe number of short cuts is limited to those that can be displayed on the toolbar.
24
COMMON DISPLAY FUNCTIONS
The following displays and their functions are common throughout the faceplates, and are described in detail here. The descriptions of the individual faceplates do not therefore contain this detail.
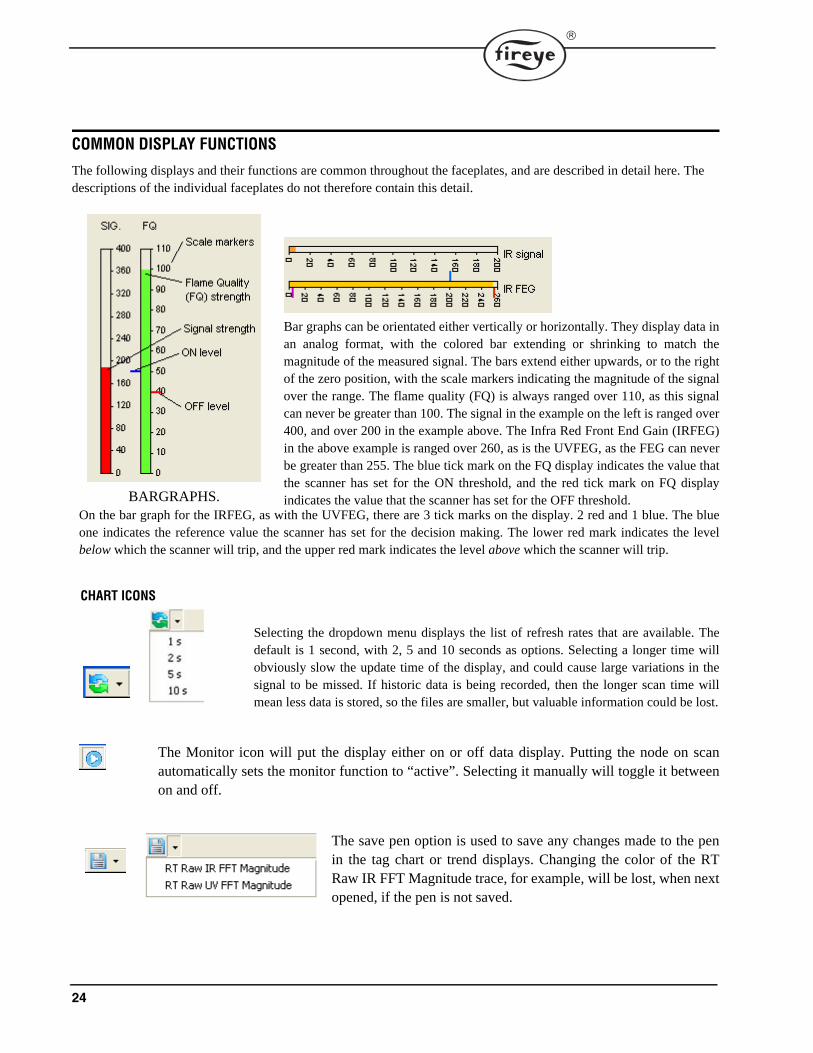
BARGRAPHS.
Bar graphs can be orientated either vertically or horizontally. They display data inan analog format, with the colored bar extending or shrinking to match themagnitude of the measured signal. The bars extend either upwards, or to the rightof the zero position, with the scale markers indicating the magnitude of the signalover the range. The flame quality (FQ) is always ranged over 110, as this signalcan never be greater than 100. The signal in the example on the left is ranged over400, and over 200 in the example above. The Infra Red Front End Gain (IRFEG)in the above example is ranged over 260, as is the UVFEG, as the FEG can neverbe greater than 255. The blue tick mark on the FQ display indicates the value thatthe scanner has set for the ON threshold, and the red tick mark on FQ displayindicates the value that the scanner has set for the OFF threshold.
On the bar graph for the IRFEG, as with the UVFEG, there are 3 tick marks on the display. 2 red and 1 blue. The blueone indicates the reference value the scanner has set for the decision making. The lower red mark indicates the levelbelow which the scanner will trip, and the upper red mark indicates the level above which the scanner will trip.
CHART ICONS
Selecting the dropdown menu displays the list of refresh rates that are available. Thedefault is 1 second, with 2, 5 and 10 seconds as options. Selecting a longer time willobviously slow the update time of the display, and could cause large variations in thesignal to be missed. If historic data is being recorded, then the longer scan time willmean less data is stored, so the files are smaller, but valuable information could be lost.
The Monitor icon will put the display either on or off data display. Putting the node on scanautomatically sets the monitor function to “active”. Selecting it manually will toggle it betweenon and off.
The save pen option is used to save any changes made to the penin the tag chart or trend displays. Changing the color of the RTRaw IR FFT Magnitude trace, for example, will be lost, when nextopened, if the pen is not saved.
25
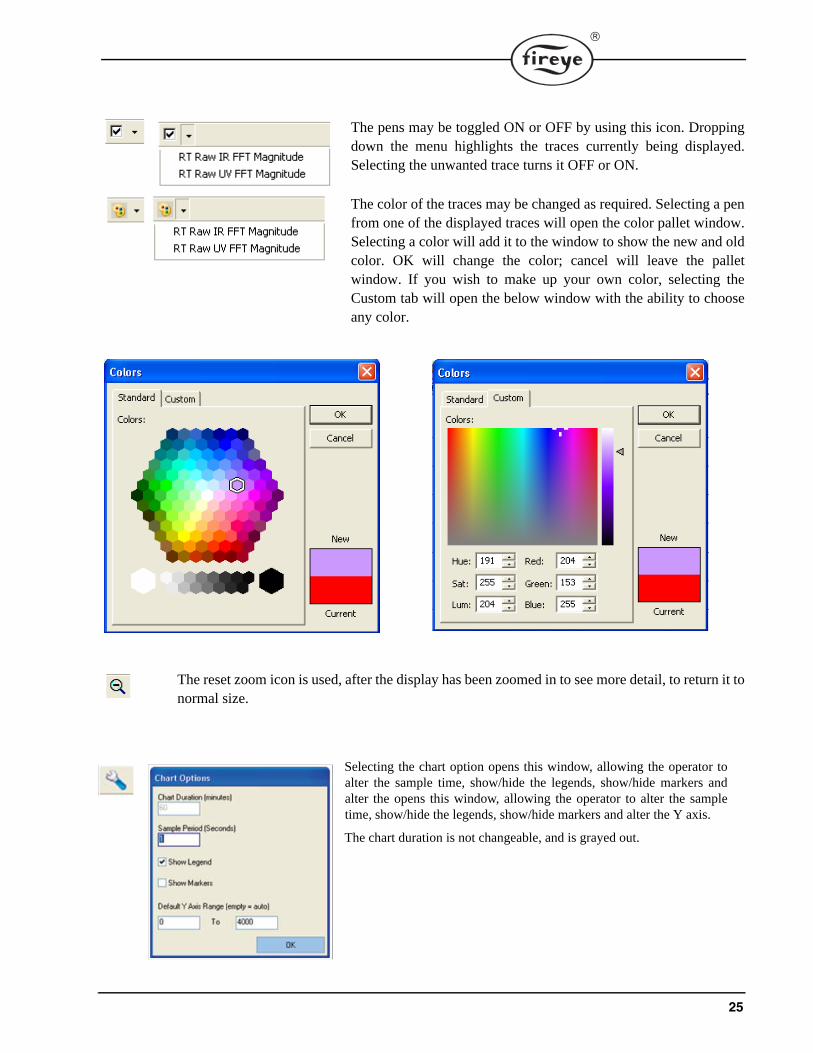
The pens may be toggled ON or OFF by using this icon. Droppingdown the menu highlights the traces currently being displayed.Selecting the unwanted trace turns it OFF or ON.
The color of the traces may be changed as required. Selecting a penfrom one of the displayed traces will open the color pallet window.Selecting a color will add it to the window to show the new and oldcolor. OK will change the color; cancel will leave the palletwindow. If you wish to make up your own color, selecting theCustom tab will open the below window with the ability to chooseany color.
The reset zoom icon is used, after the display has been zoomed in to see more detail, to return it tonormal size.
Selecting the chart option opens this window, allowing the operator toalter the sample time, show/hide the legends, show/hide markers andalter the opens this window, allowing the operator to alter the sampletime, show/hide the legends, show/hide markers and alter the Y axis.
The chart duration is not changeable, and is grayed out.
26
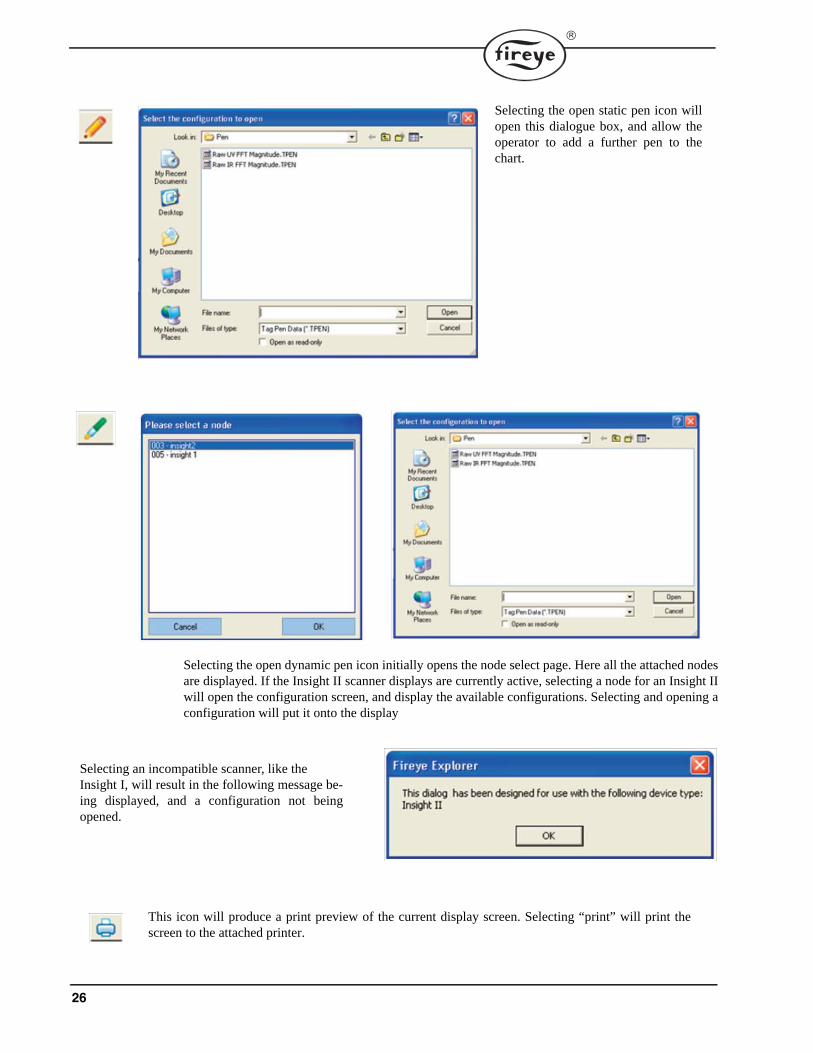
Selecting the open dynamic pen icon initially opens the node select page. Here all the attached nodesare displayed. If the Insight II scanner displays are currently active, selecting a node for an Insight IIwill open the configuration screen, and display the available configurations. Selecting and opening aconfiguration will put it onto the display
Selecting the open static pen icon willopen this dialogue box, and allow theoperator to add a further pen to thechart.
Selecting an incompatible scanner, like the Insight I, will result in the following message be-ing displayed, and a configuration not beingopened.
This icon will produce a print preview of the current display screen. Selecting “print” will print thescreen to the attached printer.
27
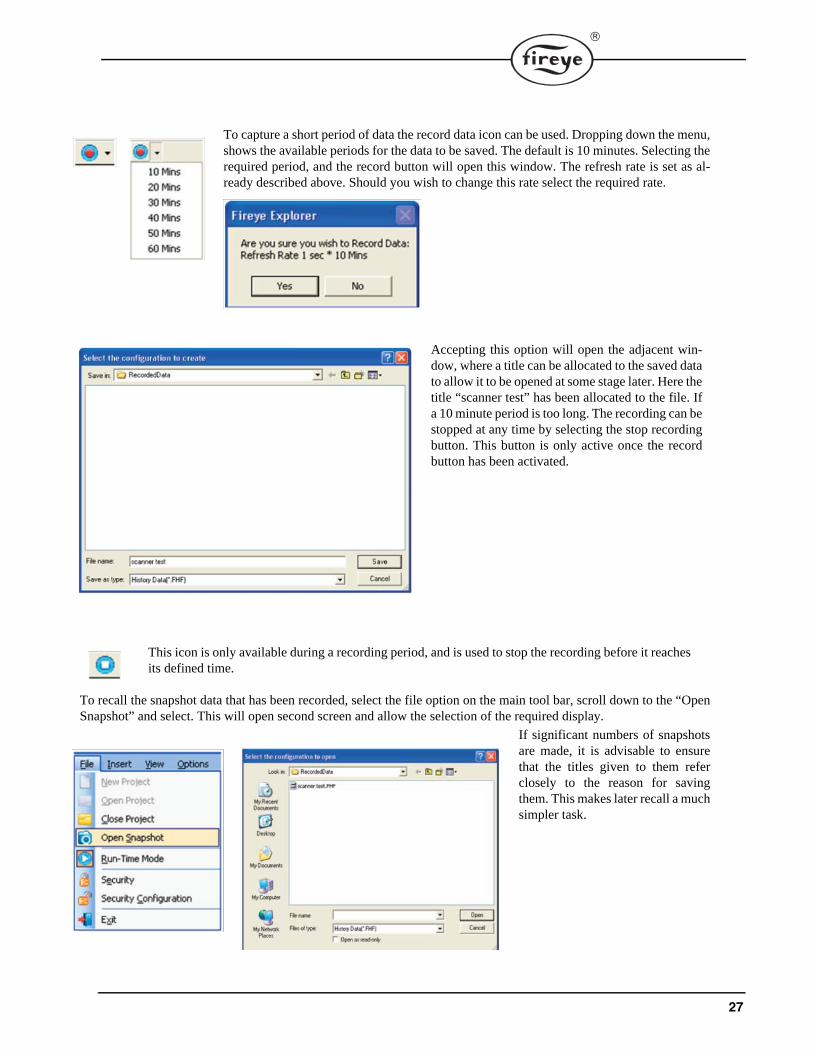
To capture a short period of data the record data icon can be used. Dropping down the menu,shows the available periods for the data to be saved. The default is 10 minutes. Selecting therequired period, and the record button will open this window. The refresh rate is set as al-ready described above. Should you wish to change this rate select the required rate.
Accepting this option will open the adjacent win-dow, where a title can be allocated to the saved datato allow it to be opened at some stage later. Here thetitle “scanner test” has been allocated to the file. Ifa 10 minute period is too long. The recording can bestopped at any time by selecting the stop recordingbutton. This button is only active once the recordbutton has been activated.
This icon is only available during a recording period, and is used to stop the recording before it reachesits defined time.
To recall the snapshot data that has been recorded, select the file option on the main tool bar, scroll down to the “OpenSnapshot” and select. This will open second screen and allow the selection of the required display.
If significant numbers of snapshotsare made, it is advisable to ensurethat the titles given to them referclosely to the reason for savingthem. This makes later recall a muchsimpler task.

28
DEVICE BACKUP AND RESTORE
It is possible to retrieve the scanners operating data, and save it to a disk for future reference. On some of the scan-ners it is also possible to re-instate this data, back into the scanner via the RS485 communication highway. To seewhich scanners are able to be programmed in this way see the relevant data sheets. The following information iscommon to all scanners with communication capabilities. In order to upload data from a scanner, all the scannersthat are connected to that communication port must be taken Off Scan. This is to ensure that data is not corrupted oraccepted by any scanner other than the selected scanner.
Right clicking on the desired node, here Node 3, willshow the options available to the operator. Selecting theDevice Backup/Restore will open the below dialoguebox.
The port and Node addresses are clearly indicated on thedisplay to ensure that the correct data is collected. Byclicking the Upload button, the entire memory will be up-loaded to the computer. Currently there is only one optionfor the area to be backed up, and that is the entire memory.
Once the upload is complete, the entire memory is avail-able to be viewed, and a confirmation message that theupload is complete is shown on the screen. This configu-ration can now be saved onto a suitable media, either thecomputer’s hard drive or any suitable storage device, byselecting the Save Config box. The following will be dis-played, giving the operator the opportunity to save the filewith an appropriate title. In order to make data retrievalsimple in the future, the title should contain as much in-formation as possible, but at a minimum it should containthe node address, in this example, 3, the date, a revisionnumber, and, if there is 1 computer accessing the data oneach individual boiler, the boiler number would be useful.
29
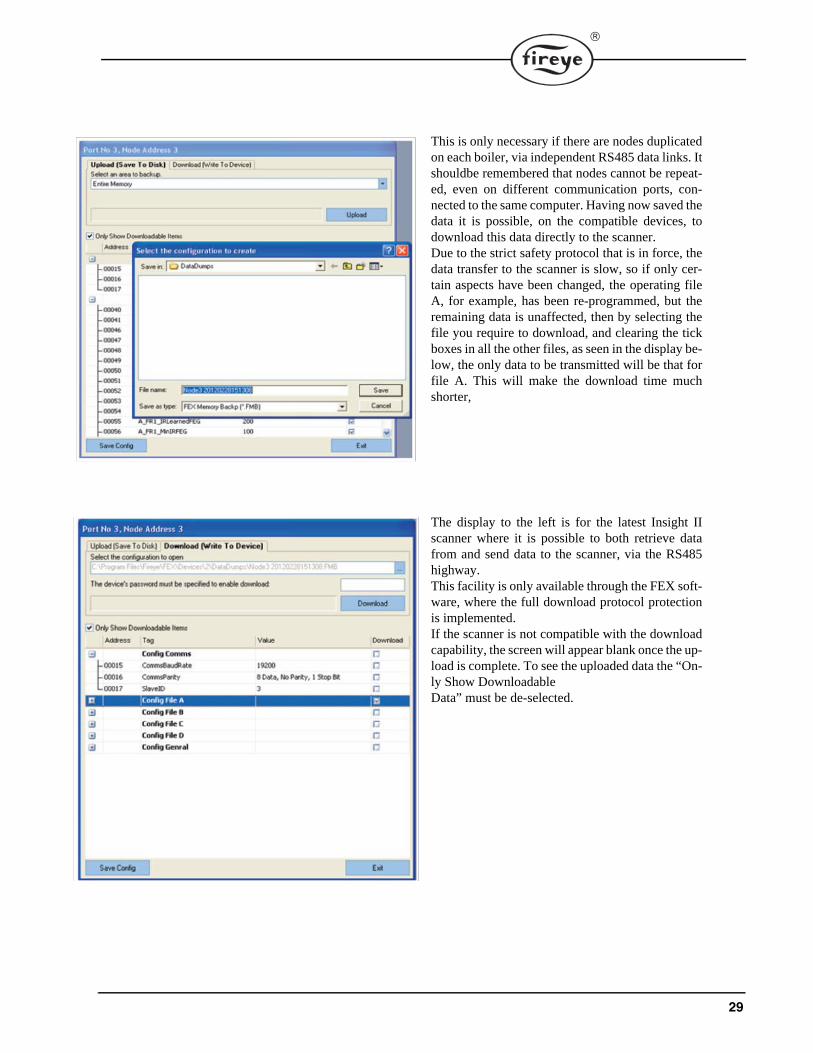
This is only necessary if there are nodes duplicatedon each boiler, via independent RS485 data links. Itshouldbe remembered that nodes cannot be repeat-ed, even on different communication ports, con-nected to the same computer. Having now saved thedata it is possible, on the compatible devices, todownload this data directly to the scanner. Due to the strict safety protocol that is in force, thedata transfer to the scanner is slow, so if only cer-tain aspects have been changed, the operating fileA, for example, has been re-programmed, but theremaining data is unaffected, then by selecting thefile you require to download, and clearing the tickboxes in all the other files, as seen in the display be-low, the only data to be transmitted will be that forfile A. This will make the download time muchshorter,
The display to the left is for the latest Insight IIscanner where it is possible to both retrieve datafrom and send data to the scanner, via the RS485highway. This facility is only available through the FEX soft-ware, where the full download protocol protectionis implemented. If the scanner is not compatible with the downloadcapability, the screen will appear blank once the up-load is complete. To see the uploaded data the “On-ly Show Downloadable Data” must be de-selected.

30
These displays are used to trend, over extended periods, important data so that changes in burner characteristics canbe displayed in an easily recognizable format. The standard charts are all preconfigured, with each parameter clearlyidentified with the node name, description of the function, time and date. The time and date is PC time and date, notthe scanner’s time and date. Although the scanner has time and date stamping capability, if the scanner has not beenset up with its time and date correctly, this data could be useless if it is different from the PC. Pens can be turned off,colors changed and different ones called up, as required and described in the above CHART ICON section.
Saved data can be called back, and displayed in thesame format using the historic data option for therequired node. The buttons along the bottom of thescreen are hidden. Holding the mouse pointer overthe bottom opens them, allowing the data to be se-lected ore moved through set periods of time, back-wards and forwards. The goto button allows theoperator to select days and times and display thedata from that period. The > and < arrows stepthrough the displays in 10 minute steps.
31
INSIGHT II DISPLAYS
COMMON COMMANDS
DEFAULT LOGIN
The below buttons are available for the operator to navigate around the displays without the need for security clearance:
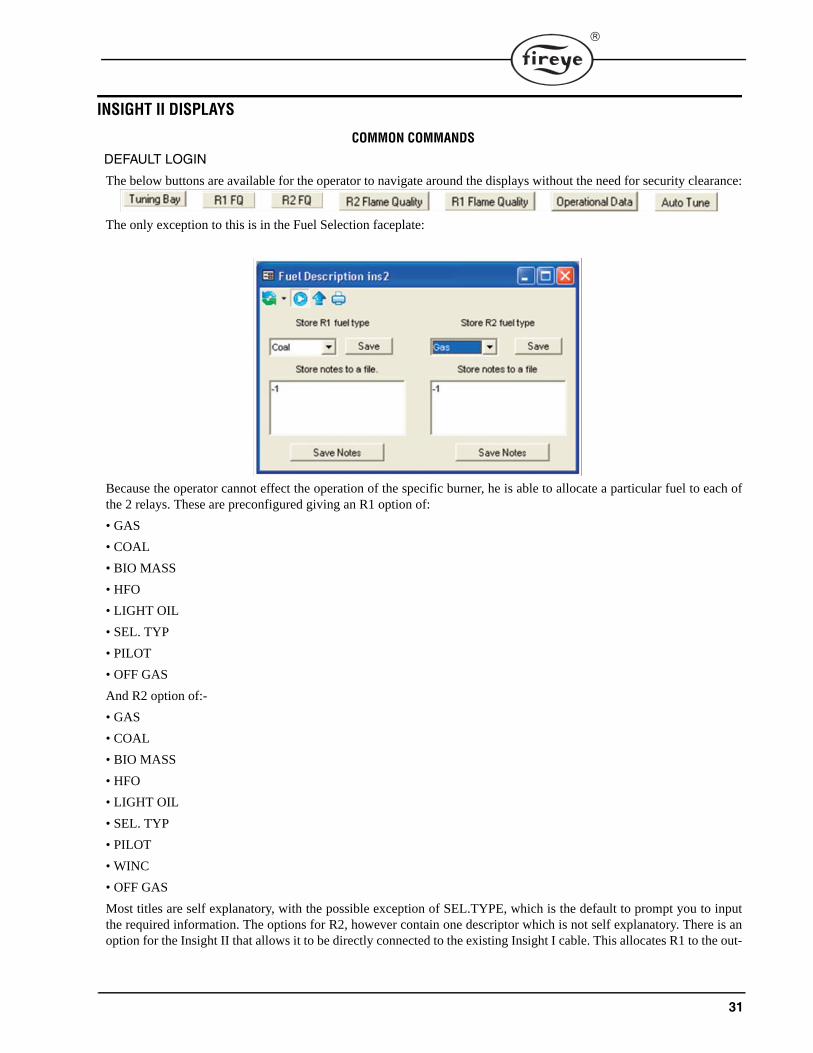
The only exception to this is in the Fuel Selection faceplate:
Because the operator cannot effect the operation of the specific burner, he is able to allocate a particular fuel to each ofthe 2 relays. These are preconfigured giving an R1 option of:
• GAS
• COAL
• BIO MASS
• HFO
• LIGHT OIL
• SEL. TYP
• PILOT
• OFF GAS
And R2 option of:-
• GAS
• COAL
• BIO MASS
• HFO
• LIGHT OIL
• SEL. TYP
• PILOT
• WINC
• OFF GAS
Most titles are self explanatory, with the possible exception of SEL.TYPE, which is the default to prompt you to inputthe required information. The options for R2, however contain one descriptor which is not self explanatory. There is anoption for the Insight II that allows it to be directly connected to the existing Insight I cable. This allocates R1 to the out-

32
put connector and disables R2, making it a direct replacement for the Insight I. Selecting this option hides the irrelevantsections of the displays to prevent confusion. WINC stands for With InSight Connector.
ADMINISTRATION LOGIN
At this level of security clearance, there are no restrictions to the display functions presented to the operator. At thislevel the operator must have the clearance to be able to completely configure the firing regime of the scanner todetect the presented flames. It must be noted that untrained personnel, configuring the scanner, can cause dangerousconditions to be programmed into the scanner, with a possible disastrous outcome. Under this login it is possible toset up further security levels so that different levels of expertise can be allocated further access, but maybe not totaladministration rights. This additional security setting is covered under the section Security Setup

33
This faceplate is pre-configured. The bar type displays give analog indication of, IR signal strength, UV signal-strength and Flame Quality (FQ) for each individual relay. The common signals, the Front End Gain (FEG), theAIM for both UV and IR are displayed in the centre of the display, together with the rear display of the scanner, andkeys to allow remote operation of the scanner. The bars that are utilized for the display of control functions, e.g. FQ,have the ON/OFF levels that are used for this decision making. These are the small “Ticks”, one Red and one Blue,shown on the side of the bar. The Red shows the OFF threshold, and the Blue shows the ON threshold.
The push buttons labelled “Send” are only available to certain security levels. For the default loading, so that any-one can access information, these buttons are inoperative. Trying to use them without the correct security clearancewill cause a message “Access denied due to security credentials” to be generated in the Event List at the bottom ofthe screen.
The buttons labelled “Tuning Bay”, “R1 FQ”, “R2 FQ” are available to all levels of security, as they are only shortcut keys to further displays.
In order to actually set up and alter parameters within the scanner it is required to have the correct security level. Toachieve this access it is necessary to go to the security screen and login at the required level. This operation isdescribed in a separate section, see Security Setup.
Assuming the correct level of security is in operation, the first action is to input the password, just type in the num-bers, it is unnecessary to “enter” or “return” the data input. Default is 205. It is now possible to utilize all the com-mands on the display.
34
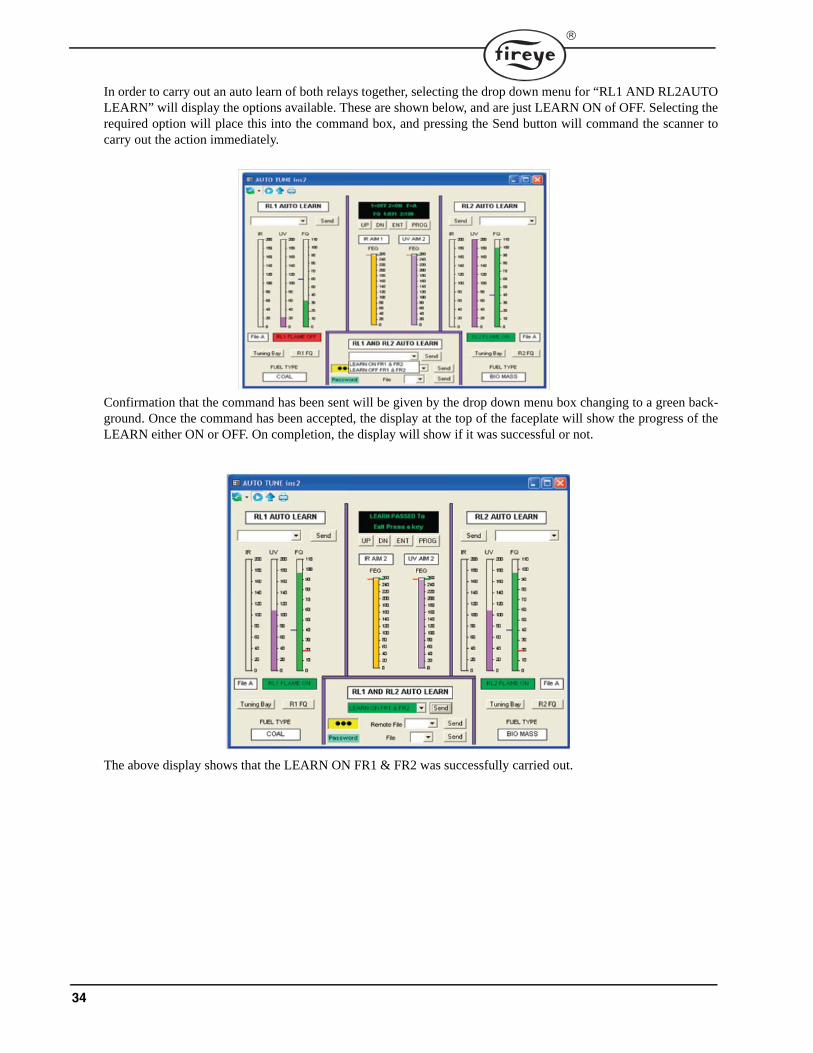
In order to carry out an auto learn of both relays together, selecting the drop down menu for “RL1 AND RL2AUTOLEARN” will display the options available. These are shown below, and are just LEARN ON of OFF. Selecting therequired option will place this into the command box, and pressing the Send button will command the scanner tocarry out the action immediately.
Confirmation that the command has been sent will be given by the drop down menu box changing to a green back-ground. Once the command has been accepted, the display at the top of the faceplate will show the progress of theLEARN either ON or OFF. On completion, the display will show if it was successful or not.
The above display shows that the LEARN ON FR1 & FR2 was successfully carried out.

35
TUNING BAY FACEPLATE
This pre-configured display allows access to all the major fine tuning parameters within the scanner. This access isonly available to Administration level of security, or security levels allocated by Administration. The only com-mands available in the default level of security are additional display selections, found along the bottom of thescreen, namely Auto Tune, Operational Data, R1 Flame Quality and R2 Flame Quality. Each of these displays iscovered in detail under their specific titles.
Assuming that the correct security level is in operation, the data may be adjusted as required. Where there are fixedavailable options, these are presented in a drop down list so the operator can select, and then send the data. The fol-lowing is the list of pre-defined options for relays R1 and R2 :-
OTD 1sec to 6 secs in 1 second steps.
FFRT 1 sec to 4 secs in 1 second steps.
IR and UV BAND 23hz to 179hz in defined steps.
SENSORS IR, UV, UV & IR
Once this data is sent, confirmation of its acceptance by the scanner is shown in the adjacent box, showing theactive data. Correct data transmission is shown in the selected operation by changing from yellow, when the data isinput, to green once it has been sent.

36
The remaining send functions are monitored to ensure that incorrect data is not sent to the scanner. E.g. if the opera-tor tries to send a value of the OFF Threshold that is greater than the ON Threshold it will display the messageshown below, and no data will be sent. It can be seen that the current controlling data is 50 ON and 40 OFF, and try-ing to change the OFF to 60 is not acceptable.
Sending a value that is outside the permissible range will generate a message in the Event list:- Device status:Invalid parameter value The control parameter will not change in the device.
The effect of de-selecting the UV cell associated with R1, and the UV cell associated with R2 are shown above. Thesuppression of the de-selected cell displays is to prevent confusion with information that have no effect on the oper-ation of the relevant relays.
37
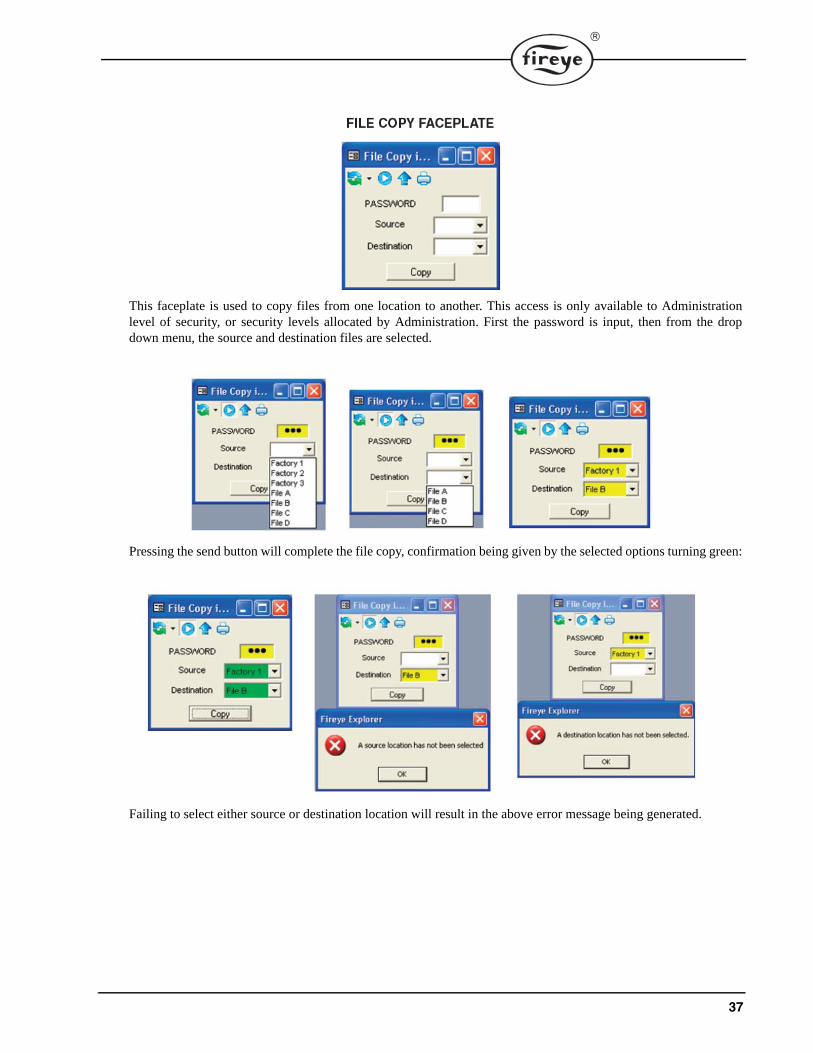
This faceplate is used to copy files from one location to another. This access is only available to Administrationlevel of security, or security levels allocated by Administration. First the password is input, then from the dropdown menu, the source and destination files are selected.
Pressing the send button will complete the file copy, confirmation being given by the selected options turning green:
Failing to select either source or destination location will result in the above error message being generated.
38
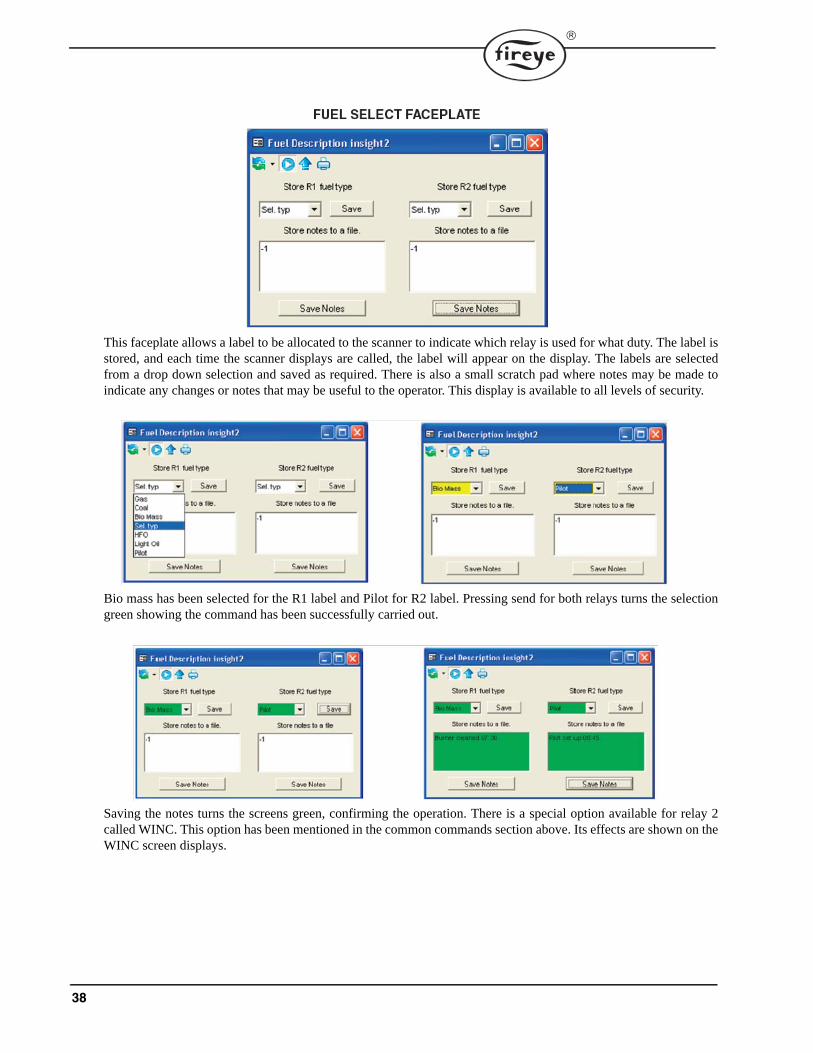
This faceplate allows a label to be allocated to the scanner to indicate which relay is used for what duty. The label isstored, and each time the scanner displays are called, the label will appear on the display. The labels are selectedfrom a drop down selection and saved as required. There is also a small scratch pad where notes may be made toindicate any changes or notes that may be useful to the operator. This display is available to all levels of security.
Bio mass has been selected for the R1 label and Pilot for R2 label. Pressing send for both relays turns the selectiongreen showing the command has been successfully carried out.
Saving the notes turns the screens green, confirming the operation. There is a special option available for relay 2called WINC. This option has been mentioned in the common commands section above. Its effects are shown on theWINC screen displays.
39
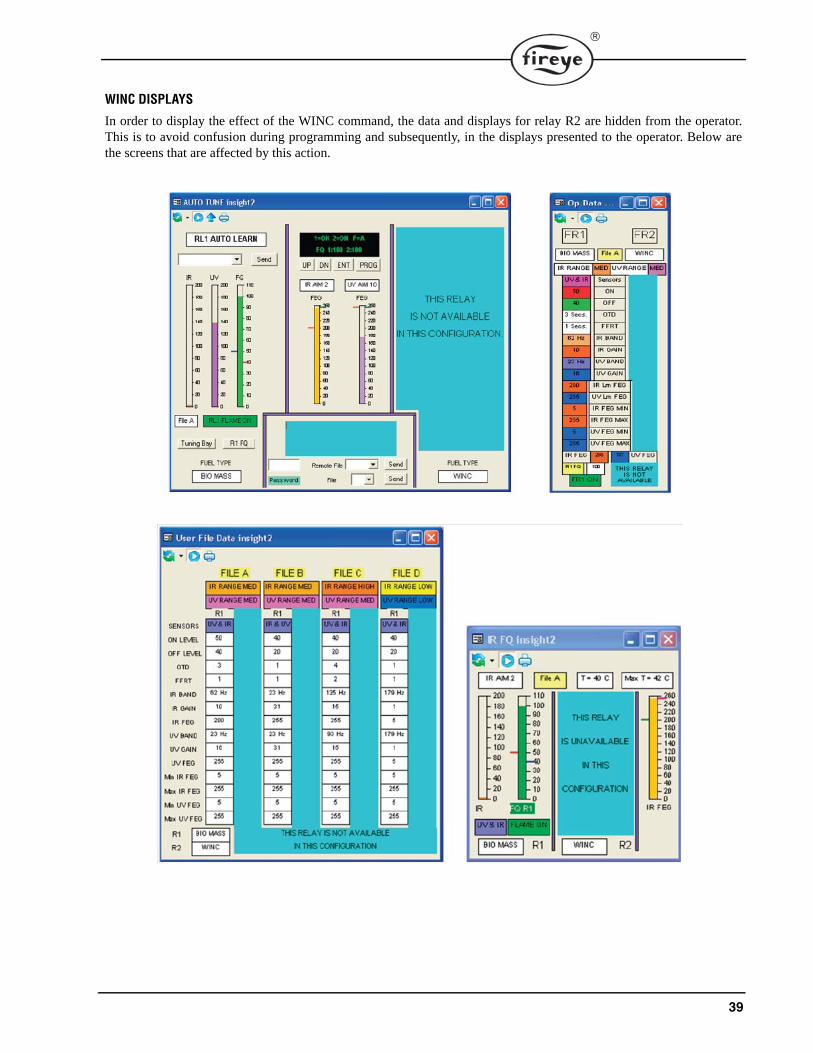
WINC DISPLAYS
In order to display the effect of the WINC command, the data and displays for relay R2 are hidden from the operator.This is to avoid confusion during programming and subsequently, in the displays presented to the operator. Below arethe screens that are affected by this action.
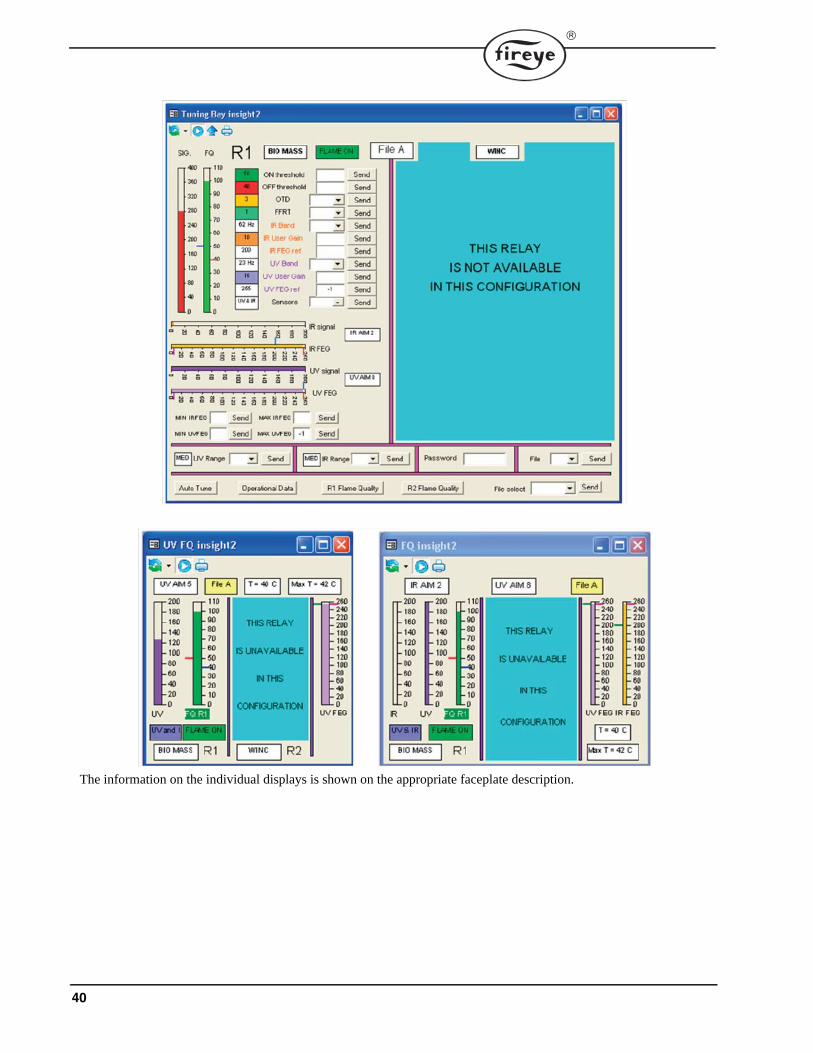
40
The information on the individual displays is shown on the appropriate faceplate description.
41
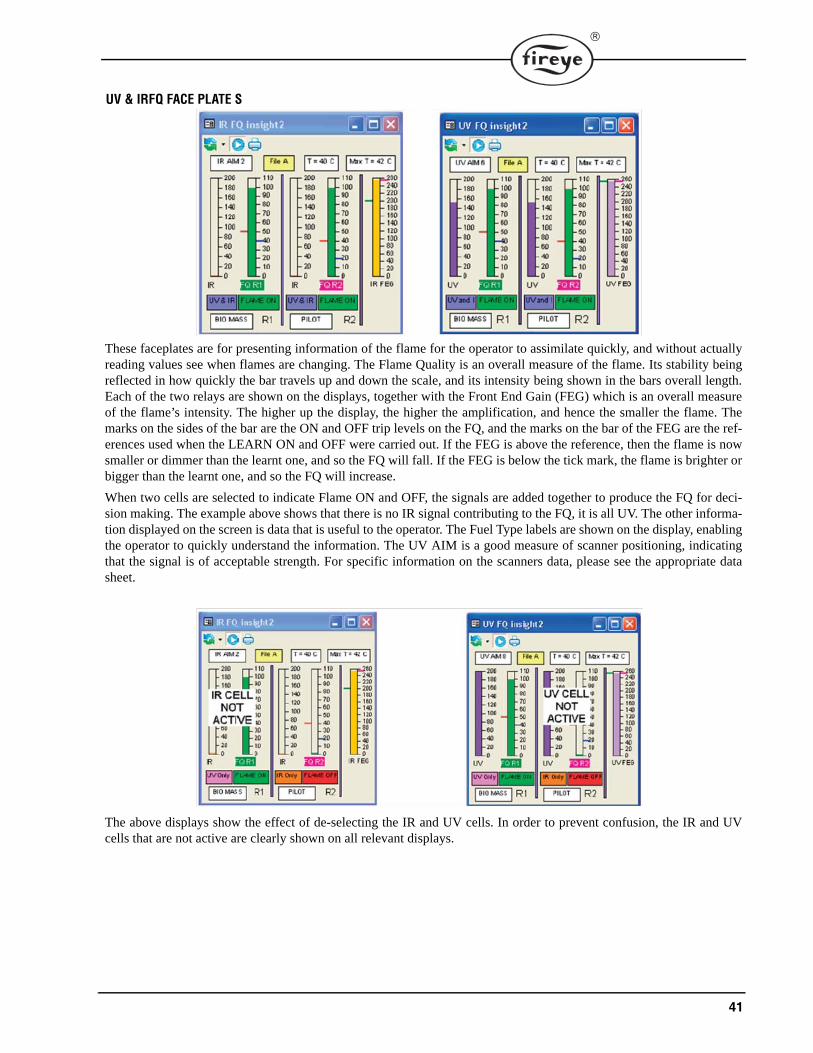
UV & IRFQ FACE PLATE S
These faceplates are for presenting information of the flame for the operator to assimilate quickly, and without actuallyreading values see when flames are changing. The Flame Quality is an overall measure of the flame. Its stability beingreflected in how quickly the bar travels up and down the scale, and its intensity being shown in the bars overall length.Each of the two relays are shown on the displays, together with the Front End Gain (FEG) which is an overall measureof the flame’s intensity. The higher up the display, the higher the amplification, and hence the smaller the flame. Themarks on the sides of the bar are the ON and OFF trip levels on the FQ, and the marks on the bar of the FEG are the ref-erences used when the LEARN ON and OFF were carried out. If the FEG is above the reference, then the flame is nowsmaller or dimmer than the learnt one, and so the FQ will fall. If the FEG is below the tick mark, the flame is brighter orbigger than the learnt one, and so the FQ will increase.
When two cells are selected to indicate Flame ON and OFF, the signals are added together to produce the FQ for deci-sion making. The example above shows that there is no IR signal contributing to the FQ, it is all UV. The other informa-tion displayed on the screen is data that is useful to the operator. The Fuel Type labels are shown on the display, enablingthe operator to quickly understand the information. The UV AIM is a good measure of scanner positioning, indicatingthat the signal is of acceptable strength. For specific information on the scanners data, please see the appropriate datasheet.
The above displays show the effect of de-selecting the IR and UV cells. In order to prevent confusion, the IR and UVcells that are not active are clearly shown on all relevant displays.
42
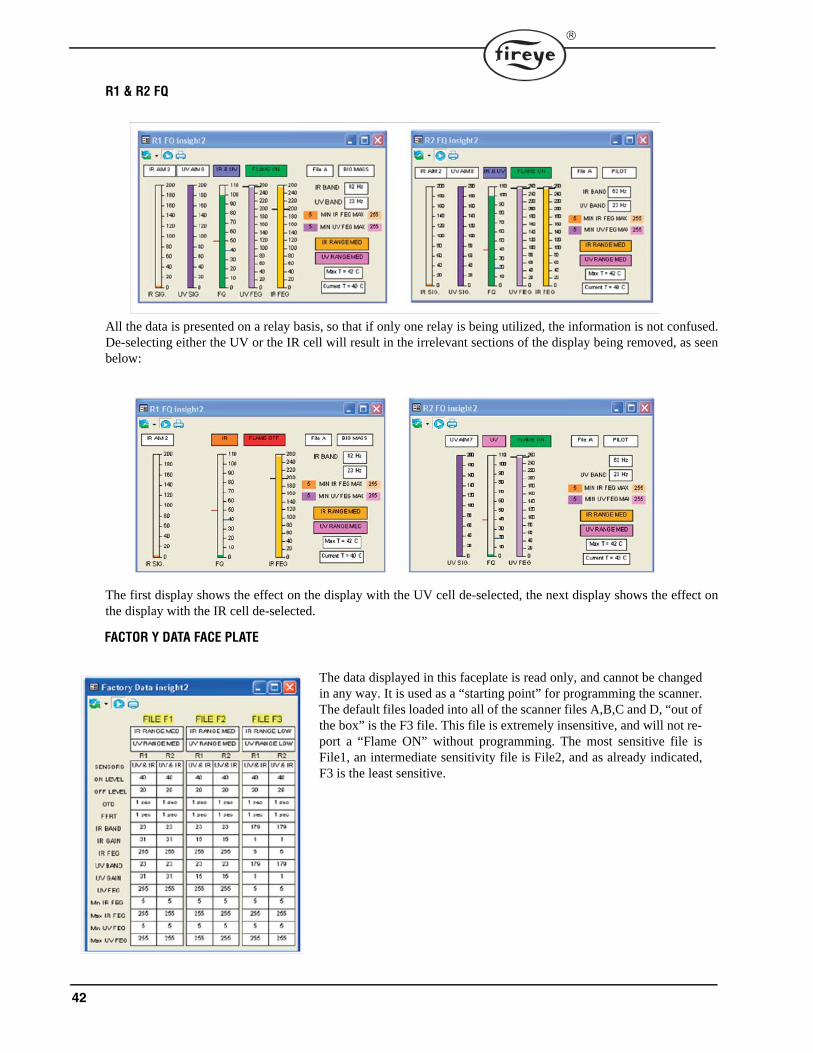
R1 & R2 FQ
All the data is presented on a relay basis, so that if only one relay is being utilized, the information is not confused.De-selecting either the UV or the IR cell will result in the irrelevant sections of the display being removed, as seenbelow:
The first display shows the effect on the display with the UV cell de-selected, the next display shows the effect onthe display with the IR cell de-selected.
FACTOR Y DATA FACE PLATE
The data displayed in this faceplate is read only, and cannot be changedin any way. It is used as a “starting point” for programming the scanner.The default files loaded into all of the scanner files A,B,C and D, “out ofthe box” is the F3 file. This file is extremely insensitive, and will not re-port a “Flame ON” without programming. The most sensitive file isFile1, an intermediate sensitivity file is File2, and as already indicated,F3 is the least sensitive.

43
OPERATIONAL DATA
REAL TIME CLOCK FACE PLATE
This data display shows all the current settings that are being used to con-trol the relays R1 and R2. Most of this data is read only, and will onlychange if the scanner is re-tuned. The exceptions to this are the IR andUV FEG’s, R1 and R2 FQ’s, the FR1 OFF/ON and the FR2 OFF/ON.These are continually being updated so that changes in the flame can beseen at all times.
The real time clock can only be updatedby Administrator, or security levels allo-cated by Administration.
The fields to be sent to the scanner areupdated by pressing the “Update Fieldsto PC Clock” button. This will load thecurrent time date etc. into the relevantfields. The password is input, and thedata is sent by pressing the send buttons.Verification of the sent action is givenby the fields changing to green, as seenbelow.
44
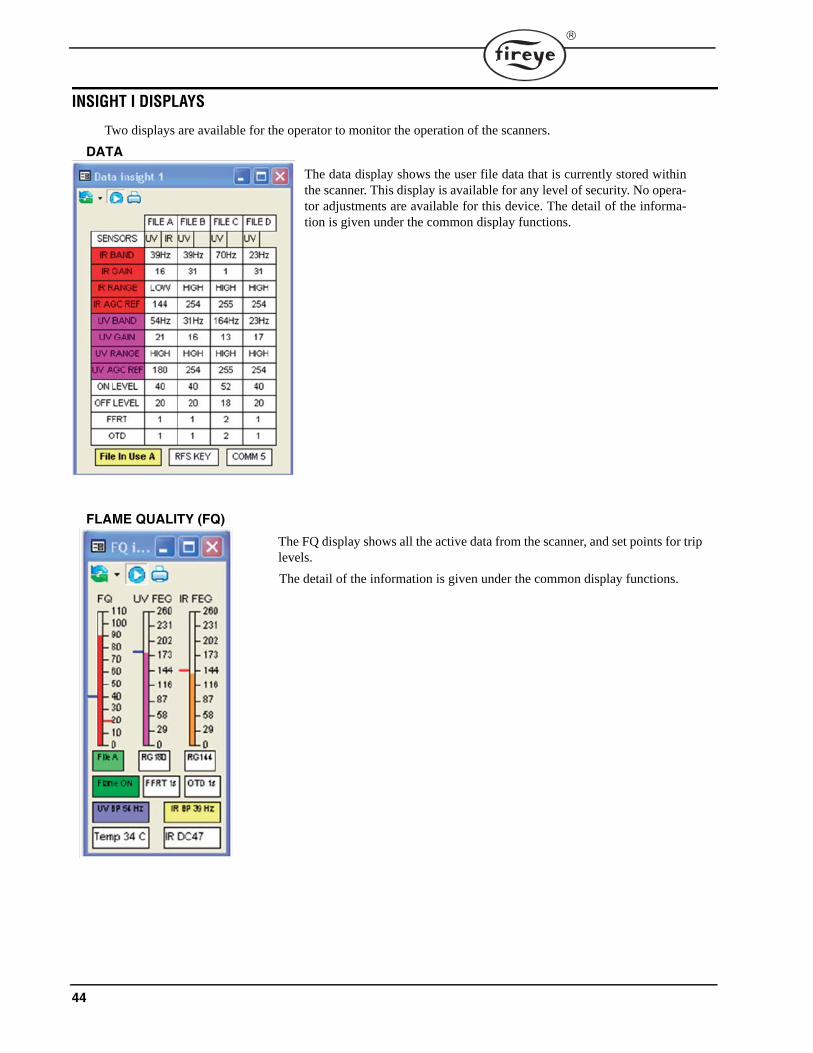
INSIGHT I DISPLAYS
Two displays are available for the operator to monitor the operation of the scanners.
DATA
The data display shows the user file data that is currently stored withinthe scanner. This display is available for any level of security. No opera-tor adjustments are available for this device. The detail of the informa-tion is given under the common display functions.
FLAME QUALITY (FQ)
The FQ display shows all the active data from the scanner, and set points for triplevels.
The detail of the information is given under the common display functions.
45
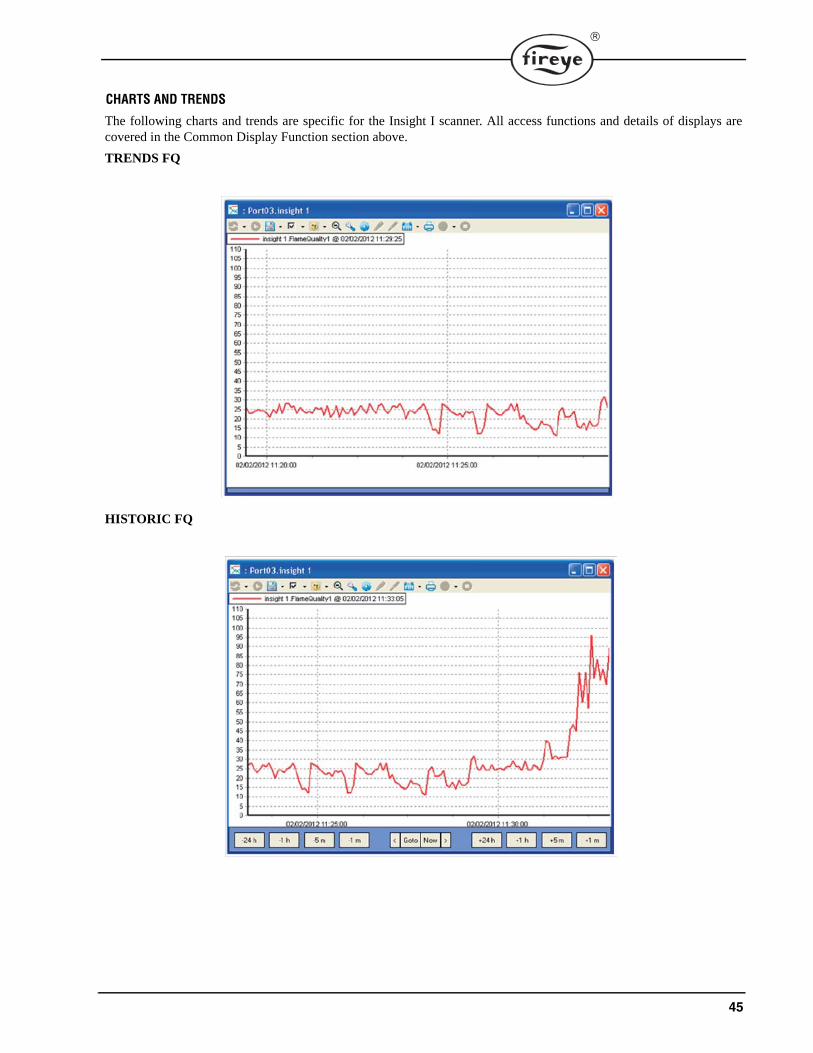
CHARTS AND TRENDS
The following charts and trends are specific for the Insight I scanner. All access functions and details of displays arecovered in the Common Display Function section above.
TRENDS FQ
HISTORIC FQ
46
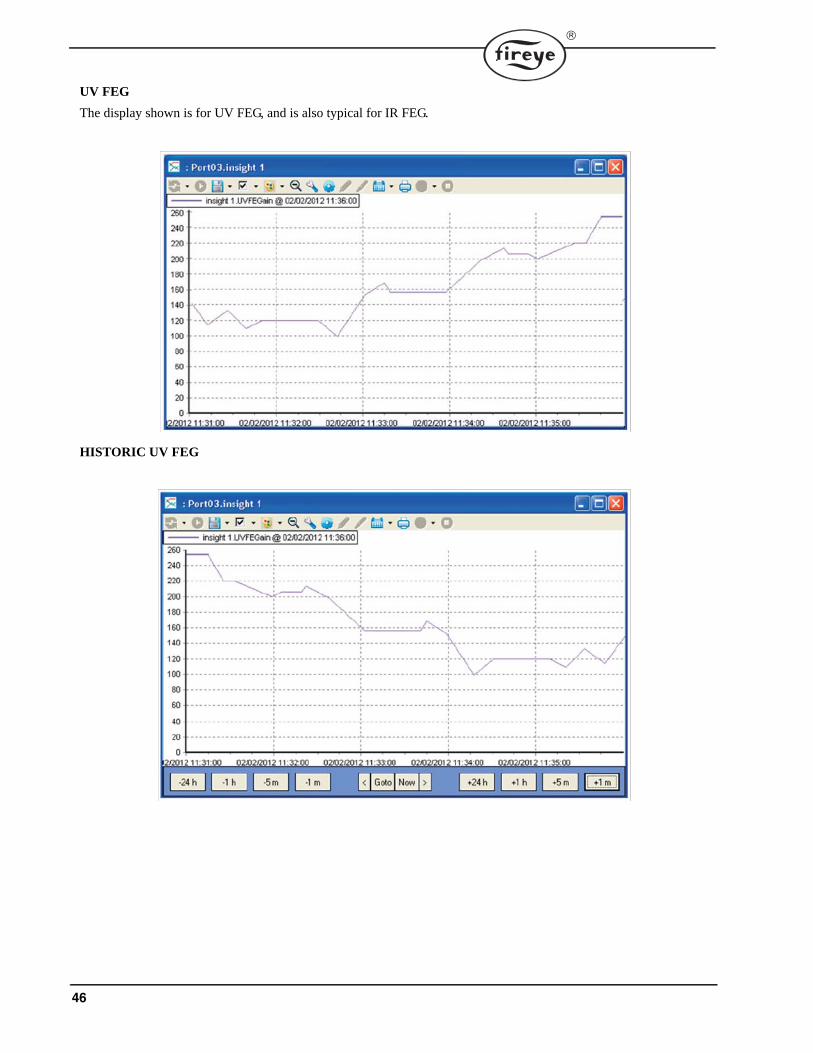
UV FEG
The display shown is for UV FEG, and is also typical for IR FEG.
HISTORIC UV FEG
47
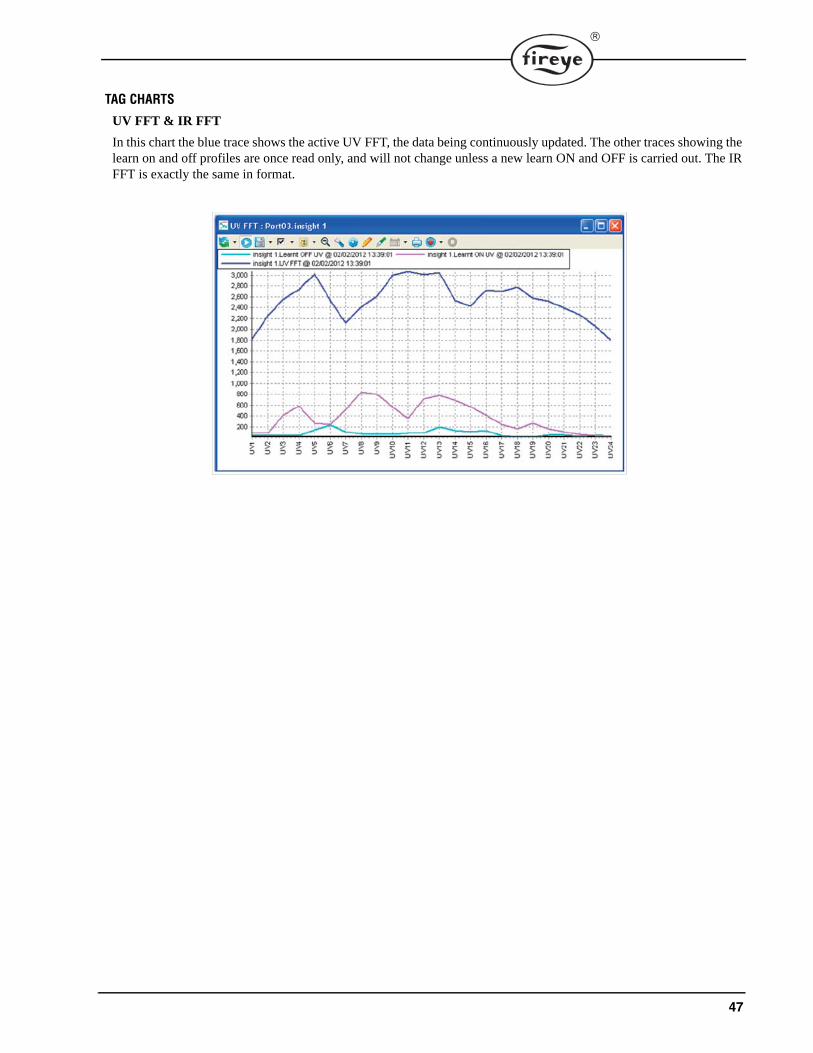
TAG CHARTS
UV FFT & IR FFT
In this chart the blue trace shows the active UV FFT, the data being continuously updated. The other traces showing thelearn on and off profiles are once read only, and will not change unless a new learn ON and OFF is carried out. The IRFFT is exactly the same in format.
48
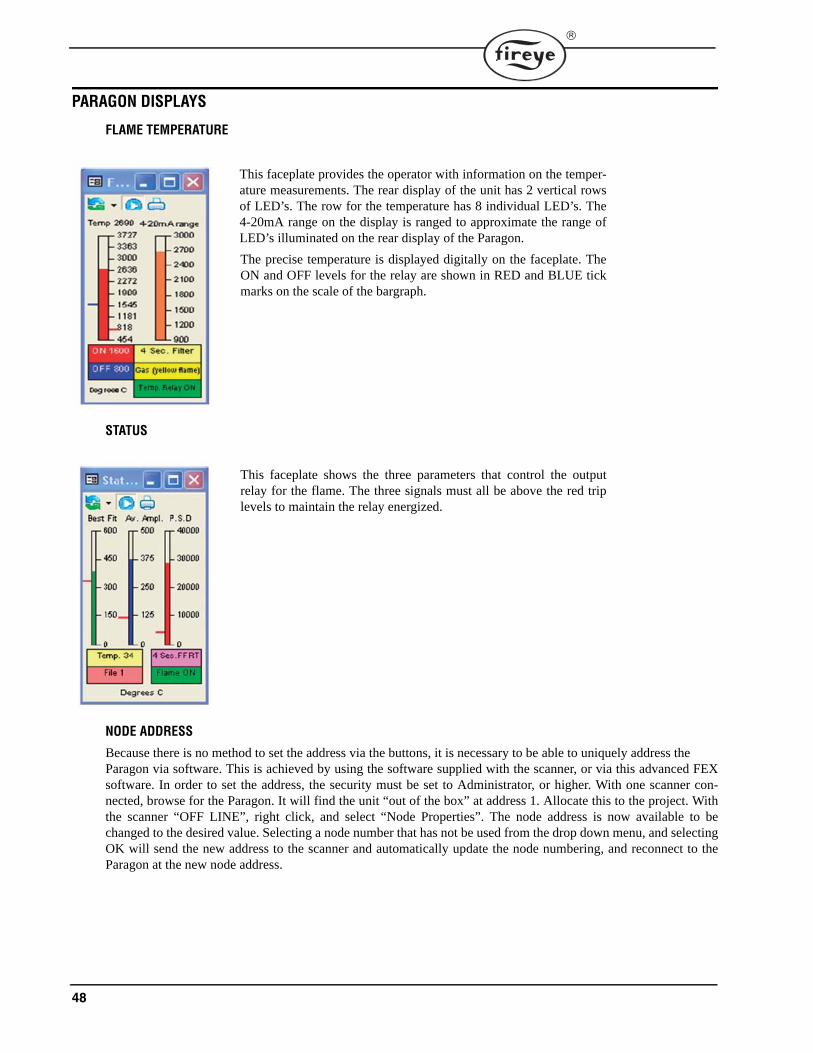
PARAGON DISPLAYS
FLAME TEMPERATURE
STATUS
NODE ADDRESS
Because there is no method to set the address via the buttons, it is necessary to be able to uniquely address the Paragon via software. This is achieved by using the software supplied with the scanner, or via this advanced FEXsoftware. In order to set the address, the security must be set to Administrator, or higher. With one scanner con-nected, browse for the Paragon. It will find the unit “out of the box” at address 1. Allocate this to the project. Withthe scanner “OFF LINE”, right click, and select “Node Properties”. The node address is now available to bechanged to the desired value. Selecting a node number that has not be used from the drop down menu, and selectingOK will send the new address to the scanner and automatically update the node numbering, and reconnect to theParagon at the new node address.
This faceplate provides the operator with information on the temper-ature measurements. The rear display of the unit has 2 vertical rowsof LED’s. The row for the temperature has 8 individual LED’s. The4-20mA range on the display is ranged to approximate the range ofLED’s illuminated on the rear display of the Paragon.
The precise temperature is displayed digitally on the faceplate. TheON and OFF levels for the relay are shown in RED and BLUE tickmarks on the scale of the bargraph.
This faceplate shows the three parameters that control the outputrelay for the flame. The three signals must all be above the red triplevels to maintain the relay energized.
49
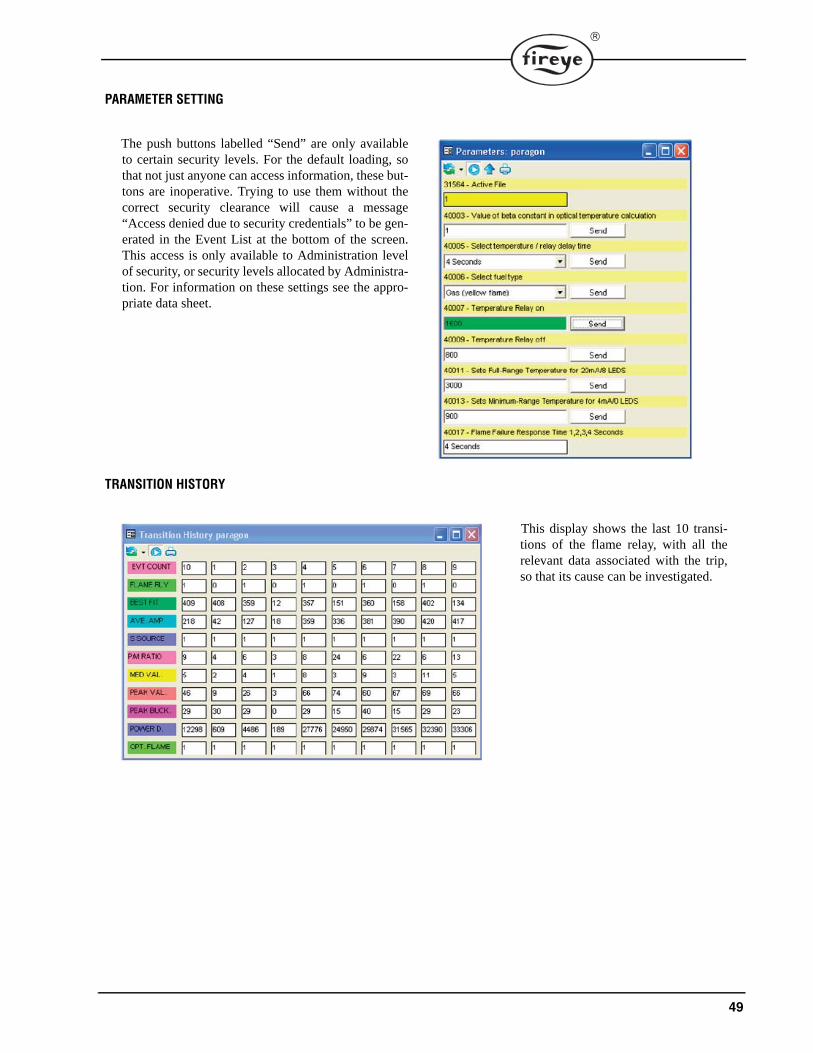
PARAMETER SETTING
TRANSITION HISTORY
The push buttons labelled “Send” are only availableto certain security levels. For the default loading, sothat not just anyone can access information, these but-tons are inoperative. Trying to use them without thecorrect security clearance will cause a message“Access denied due to security credentials” to be gen-erated in the Event List at the bottom of the screen.This access is only available to Administration levelof security, or security levels allocated by Administra-tion. For information on these settings see the appro-priate data sheet.
This display shows the last 10 transi-tions of the flame relay, with all therelevant data associated with the trip,so that its cause can be investigated.
50
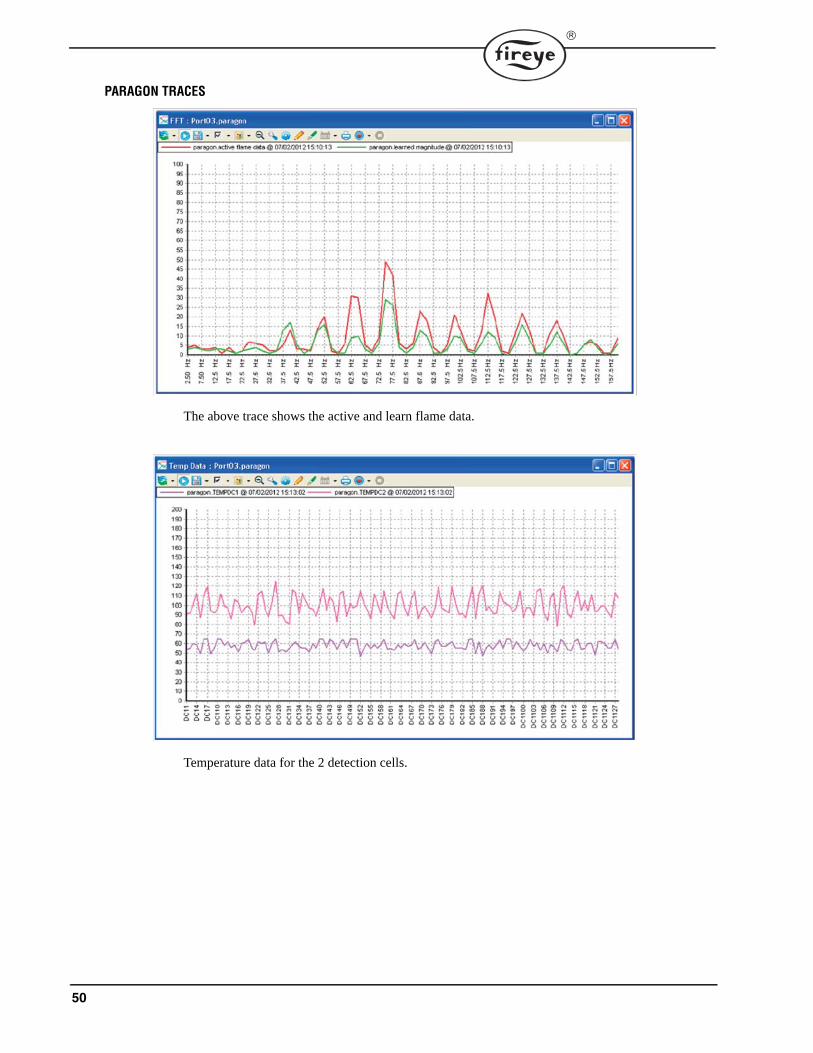
PARAGON TRACES
The above trace shows the active and learn flame data.
Temperature data for the 2 detection cells.
51
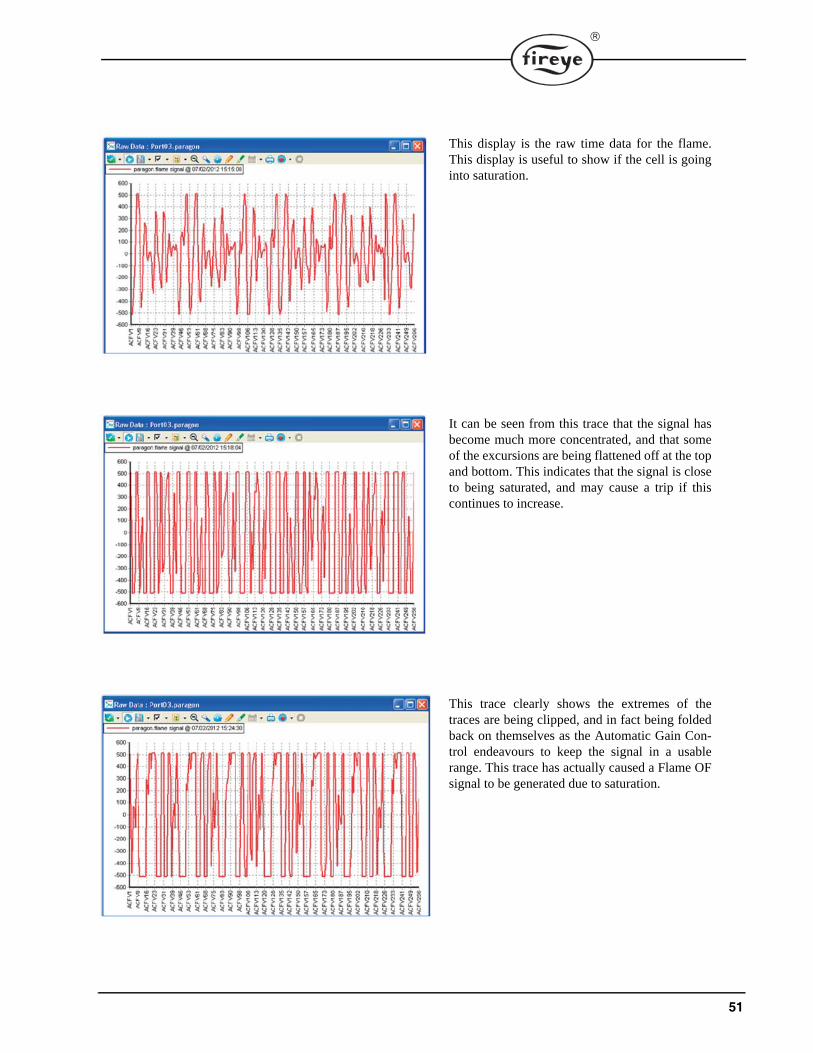
This display is the raw time data for the flame.This display is useful to show if the cell is goinginto saturation.
It can be seen from this trace that the signal hasbecome much more concentrated, and that someof the excursions are being flattened off at the topand bottom. This indicates that the signal is closeto being saturated, and may cause a trip if thiscontinues to increase.
This trace clearly shows the extremes of thetraces are being clipped, and in fact being foldedback on themselves as the Automatic Gain Con-trol endeavours to keep the signal in a usablerange. This trace has actually caused a Flame OFsignal to be generated due to saturation.

52
TREND CHARTS
AVERAGE AMPLITUDE
BEST FIT
53
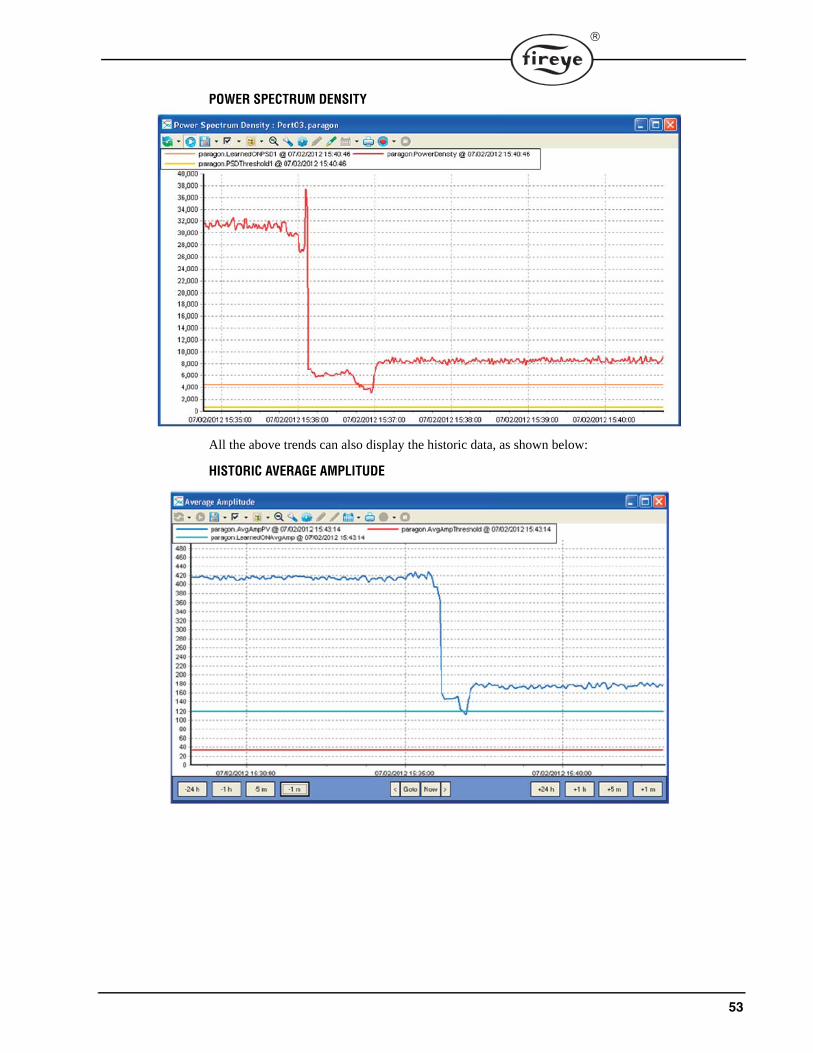
POWER SPECTRUM DENSITY
All the above trends can also display the historic data, as shown below:
HISTORIC AVERAGE AMPLITUDE

54
HISTORIC BEST FIT
HISTORIC POWER SPECTRUM DENSITY

55

56
NOTICEWhen Fireye products are combined with equipment manufactured by others and/or integrated intosystems designed or manufactured by others, the Fireye warranty, as stated it its General Terms andConditions of Sale, pertains only to the Fireye products and not to any other equipment or to thecombined system or its overall performance.
WARRANTIESFIREYE guarantees for one year from the date of installation or 18 months from date of manufactureof its products to replace, or, at its option, to repair any product or part thereof (except lamps andphotocells) which is found defective in material or workmanship or which otherwise fails to conformto the description of the product on the face of its sales order. THE FOREGOING IS IN LIEU OFALL OTHER WARRANTIES AND FIREYE MAKES NO WARRANTY OF MERCHANT-ABILITY OR ANY OTHER WARRANTY, EXPRESS OR IMPLIED. Except as specificallystated in these general terms and conditions of sale, remedies with respect to any product or partnumber manufactured or sold by Fireye shall be limited exclusively to the right to replacement orrepair as above provided. In no event shall Fireye be liable for consequential or special damages ofany nature that may arise in connection with such product or part.
FIREYE CU-1093 Manchester Road JUNE 17, 2014Derry, New Hampshire 03038 USA Supersedes April 12 2013www.fireye.com