finlayson, james bruce, 1937-- a chemical study of … · 2014-06-13 · volcanoes, or the remnants...
TRANSCRIPT

This dissertation has been
microfilmed exactly as received 68-11,926
FINLAYSON, James Bruce, 1937--A CHEMICAL STUDY OF HAWAITAN VOLCANICGASES.
University of Hawaii, Ph.D., 1967Chemistry, analytical
University Microfilms, Inc., Ann Arbor, Michigan

A CHEMICAL STUDY OF
HAWAIIAN VOLCANIC GASES
A DISSERTATION SUBMITTED TO THE GRADUATE DIVISION OF THEUNIVERSITY OF HAWAII IN PARTIAL FULFILLMENT
OF THE REQUIREMENTS FOR THE DEG~ OF
DOCTOR OF PHILOSOPHY
IN CHEMISTRY
SEPTEMBER 1967
By
James Bruce Finlayson
Dissertation Committee:
John J. Naughton, ChairmanRichard G. InskeepHarry ZeitlinI. Lynus BarnesMurll H. Manghnani

ACKNOWLEDGEMENTS
I wish to express grateful acknowledgement to the many people
who have contributed their time and skills toward the completion
of this research. In particular I 'WOuld like to thank the following:
Dr. Reiner Gogel for his helpful discussions and for the analyses
of the sublimate samples.
Miss Virginia Lewis for the analyses of the eluate from the
silica gel sampling tubes.
The drafting section and the library staff of the Hawaii
Institute of Geophysics for their considerable help in transforming
my rough drawings into a usable form.
Mrs. Carol Koyanagi for the difficult job of typing the first
draft from the handwritten original.
Mrs. Lu Russell for her skill, patience 8Ild the long hours she
spent in typing the tinal manuscript.

ABSTRACT
A chemical study has been made of volcanic gases from a variety
of sources at Kilauea Volcano on the island of Hawaii. During a
recent flank eruption, gas samples were taken from the molten surface
of a lava lake as it was forming in Makaopuhi pit crater. Sampling
was continued for more than a year by means of holes drilled through
the crust or the lava lake by the staff' of the Hawaiian Volcano Ob
servatory, u. S. Geological Survey. Additional samples were col
lected from fumaroles on the summit area of Kilauea, and the
majority of these were taken at the piped fumarole of Sulfur Bank.
The collection of gas samples was made by using evacuated,
silica gel-filled, glass sampling tubes, developed by previous
workers. Considerable effort was spent on making further improve
ments on these tubes, and on investigating collecting techniques
suitable for the available sampling sites. A gas chromatographic
method of analysis was developed, which required only tl10 chromato
graphic columns for the analysis of a gas sample. The analyses from
selected samples were used to initiate computer calculations of the
thermodynamic equilibrium composition of the different gas sources
investigated.
The analysis of samples from all collecting sites showed varying
degreep of air contamination. Investigations were made to determine
its caure. The results indicated that the majority of the air

iv
contamina.tion took place after the sample had been taken and the
tubes were being resealed. Some air, however, may have infiltrated
the gas source below ground, perhaps coming from air-saturated ground
water.
As with most previous investigations of volcanic gases, rela
tively large compositional variations were orten found in samples
from the same source t even when they were taken only minutes apart.
It is felt that this is in part a reflection of the air contamination,
but is also due to the relatively poor precision of gas analyses.
The results of this first investigation of the degassing of a
large, isolated body of cooling lava (Makaopuhi lava ls..1te) showed a
gradual depletion of the principle carbon and sulfur gases with time.
This trend is apparently associated with the solubility of these gases
in the rock melt. A similar trend was not found in the analyses of
the SulfUr Bank samples. The relative4" constant composition found
for gases from this source, however, may be due to its connection
with the magma r~servoir beneath Kilauea caldera.
Su1:t"ur Bank B3JnPles were also examined for compositional changes
that might allow prediction of eruptions, as suggested by previous
workers. The results have not established this s but do indicate that
total sul:f'ur gas content may be the key.
The results of this research imply that the interpretation of
the role played by the gas phase in volcanics would be greatly aided
by more frequent and systematic sampling of volcanic gases.

TABLE OF CONTENTS
ACKllOWLEDGEMENTS · . . . . . . . . . . . . . . . . . . . .Page
11
ABSTRACT ••• . . . . . . . . . . . . . . . . . . . . . . i1i
LIST OF TABLES •
LIST OF FIGURES
· . . . . . . . . . . . . . . . . . . . .· . . . . . . . . . . . . . . . . . . . .
vii1
ix
. . . . . . . . . . . . . .INTRODUCTION • • •I.
A. The Importance ot Volcanic Gases . . . . .· . . . . .· . . . . .
1
1
The role of gases in eruptive phenomenon •
1.
2.
Introductory remarks · . . . . . . . . . · . . . .. . . .
1
1
3.
4.
The role of gases in the formation of oredeposits • • • • • • • • • • • • • • • • • •
The role of volcanic gases in the tormationof atmospheres an_d oceans •••••••••
. . .
. . .2
3
B. Sta~~ent of the Problem • • • . . . . . . . · . . . . 3
c. Review of Volcanic Gas Collecting Techniques · . . . . 4
D. Review of Volcanic Gas }nalysis Techniques · . . . . . 31
E. Chemical Equilibria in Volcanic Gases . . . . . . . . 43
F. Description of '~hc Sampling Sitea . . . . . . . . . . 44
• • • • • • • • • • • • • • • • • It • .. • I •EXPERIMENTAL
Gas collection tubes
II.
A. Sampling
1.
• • • • • . . . · . " . . . . . . . . . . . .· . . . . . . . . . . . . . .
51
51
51
B.
Sampling techniques
The Gas Analysis System
• • • • • • 0 • • • • • • • •
• • • • • • • • • • • • e I
56
61
1. Description ot the extraction and measuring sJCsteru 61

vi
2. Description ot the gas chromatographic system • · . .Page
67
3. Operating procedure • • • . . . . . . . . • • • • • • 73
Analysis ot the voJ.ati~es on the sampling tubesilica gel • • • •• •••••••••••••
C.
4.
Sublimate Collection and Analysis • . . • • • · . .• • •
· . .75
76
1. Sampling technique . . . . . . . . . . . . . . . . .2. Extraction and analysis techniques
III. RESULTS AND DISCUSSION . . . . . . .· . . . . . . . .· . . . . . . . .
78
80
A. Introduction . . . . . . . . . . . . . . . . . . . . . . 80
B. Et:aluation of Sampling Tubes and Techniques · .. . . . 91
C. Evaluation ot the Gas Analyzing System · . . . ~ . . . . 105
Introduction · . . . . . . . . . . . . . .. .-. . . . 105
2. Sensitivity ot the gas chromatograph • • • • • 106
3. Sources ot error . . . . . . . . . . . . . . . . 100
4. Precision and accuracy ot the gas analyzingsystem •• . e • • • • • • • • • • • • • • • • · . . III
D. Discussion ot the Gas Samples • • • • • • • • • • • • •• ll4
1. Maltaopuhi lava. lake samples • • • • • • • • • • • • • ~14
2. Fwnarollc gas samples · . . • • • . . . . . · . . . . ~18
Miscellaneous · . . . • • • • • • • • • • • • • • • • 123
E. Equilibrium Calculations • • • • • • • • G • • • • • • • 126
1. Introduction • • • • • • • • • • • • • • • • • • • • 126
Results • • . . • • • 0 • • • . . . . • • • · . • • • 129
3. E=luilibrium and the tren.de in a drill hole • • • • • 135
4. Extension ot the equilibrium studies to sublimates o 138

vii
PB6e
IV. CONCLUSIONS • • • 142
v. SUMMARY • • 146
APPENDIX I 149
APPENDIX II 155
BIBLIOGRAPHY 175

LIST OF TABLES
• • • • • • • •
I. Parameters ot the Gas Chrcmatographic System •
II. Analyses ot Makaopuhi Lava Lake Samples
. . . . .
87
71
81
Page
• •. .. .Analyses ot Fumarole Samples • • • • • • • •III.
IV• An~ses ot Artificial Drill Hole Samples . . . . . . . 102
V. Sensitivity ot the Gas Chromatographic Detectorstor Gases Investigated • • • • • • • • • • • • • • • • • 107
VI. Precision and Accuracy ot the Gas Analyzing System:Seven Run.a ot Philips Gas Mixture G-7 (Lot 8) •• • • • 112
VII. Oblgerveu and Equilibrium Compositions ot the MajorGas Components at the Sampling Sites • • • • 0 • • 0 Q 0 131
VIII. Observed and Equilibrium Compositional VariationsBetween the Bottom &D.d Top ot a Drill Hole • • • • • •• 137

LIST OF FIGURES
• • • •Silica Gel Gas Sampling Tube • • . . .• • • • •
52
45
Page
· .• •. . .. .• •. . . .. .Summit Area ot Kilauea Volcano
2.
1.
Extraction and Measuring Section •
7. 02Ygen Partial Pressure Variation Within a Drill Hole
4. Gas Sampling Technique at Makaopuhi Lava Lake Surface
• • • • •
57
60
62
63
98
104
• •
• •
• • •
• • •
· . .• •
• • •
• • • •• • •• • •
Gas Chromatographic Section
Drill Hole Gas Sampling Device •
Oxygen and Nitrogen in the Gas Samples • • • • •
Gas Analysis System:
6. Gas Analysis System:
3.
8.
9. Variation ot the Makaopuhi Lava Lake Gases WithTime After Eruption • • • • • • • • • • • • • • · . . . . . 115
10. Variation ot the Gases from Su.J.fur Bank FumaroleWith Time ••••••• • • • • • • • • • • • • · . . . . . 121
11. Total SUltur Gas to C02 and H2 to CO2 Variationswith Time at Sulfur Bank. Fumarole ••••••• · . · . . . 122
12. Variation of the Gases from. S2 Fumarole with Time · . . . . 124
13. Residual Peaks from Condensable Gases from AssortedVolcanic Gas Samples; C02' S02 and H20 SUbtracted • • • • • 127

I. INTRODUCTION
A. The Importance of Volcanic Gases
1. Introductory remarks
Volcanoes, or the remnants of them, are a geologic feature
feature common to much of the surface of the earth. Some 500
act!ve volcanoes are known tod8¥. and oJ.l are located on or
near the major fault systeI!lS of the earth's crust. The molten
rock or magma and the volatiles associated with it no doubt
provide the best direct evidence as to the nature of the
processes occurring within the interior of the earth.
2. The role of gasee in eruptive phenaaenon
Volcanic gases undoubtadly plav an important role in
eruptions. It is generally believed that the gases which
appear during a volcanic eruption vere origina1J¥ dissolved
in the magma. As the lava nears the surface these gases would
be released, due to a 10s8 of confining pressure. The rapid
liberation of gases at that time produces the spectacular lava
fountains that are associated vith Hava1ian volcanoes, and the
violent explollions common to volcanoes with more viscous la'\"'88.
Changes in the ccmp08it!on of certain gases issuing from
volcanic vents and tumaroles, have been suggested by' some
investigatorsl , 2 as being indicative of impending eruptions.
Ballard and Pqne3 and Heald ~ 81.4 found Bane evidence that
increasing concentrations of the sulfur gases, (especi~
~S). tram Sulfur Bank tumarole at Kilauea Volcano. Havaii.

2
vere 8Bsociated vith eruptive phases. A stu~ by Noguchi and
Kemiy'a5 ot Japanese volcanoes shoved that changes in total
sul:ru1- and chlorine taken up in solutions of NaOH set around
the main vent ot a volcano, could be used to predict the
approach ot an I31'Uption within an active crater. Sim1lar~y,
a paper by' Surin& and Voronova6 reported evidence which sug
gested that changes in the composition ot halogen gases and
¥ indicated approaching eruptions tor Ebeko Volcano on the
Kurile Islands.
3. The role ot gases in the tormation ot minerals and ore
deposits
Ore deposition is gener~ believed to occur f"rc:lm a liquid
medium, vh1ch becomes e. 8upercrit1cal fluid at greater depths
in the crust. The volatility ot certain metal compoundB,
especially the chlorides, makes a strictly gaseous transporta
tion ot some metal compounds a very probable likelihood, at
least in the early stages ot metal concentration. Studies of
tumarollc sublimates indicate volsti10 transter ot Na, K, Fe
and Cu salts. and direct sublimation has been confirmed tor
Ca and Mg.7 Murata8 has detected CuCl in volcanic tl8m.es,
using spectrometry t d'Jrlng the 1960 eruption of Kilauea
Volcano. The transportation of ore torming compounds at
depth by solution in condensed supercritical magmatic gases
has been discussed by Krauskop:r9 and Barton.10

3
4. The role of volcanic gases in the formation ot atmospheres
and oaeans.
Thera is considerable evidence that the agglaneration
ot the earth occurred with the complete loss of ~ primordial
atmosphere, and that the subsequent evolution of the present
fluid envelope of the earth occurred entire~ tram a self
contained secondary source.ll It is curren~ believed that
the most probable mechanism tor the tormation ot this
secondary atmosphere, and the oceans as well, was the de
g88s1ng ot the ear~ crust in a process that is otill taking
place in present-dq volcanoes, fumaroles and hot springs .12,13,14
Thus the stud¥ of volcanic gases may shed sane light on the
various phases ot the growth ot these important bodies dur1.ug
the hiatory ot the earth, and account tor the atmospheres
present~ being observed in detail on other planets vith in
creased space exploration and discovery.
B. Statement ot the Problem
The object ot this research, in its broadest sense, vas to
obtain an increased insight into the composition and the function
and importance ot the gas phase associated vith the active
Hawaiian volcanoes. To this end the tolloving obJectiyeS vere
included in the problem. Improved gas coUacting devices and
techniques were to be devised, based on existing deaigns and
methods. A gas anaJ.ysis 87Btem based on gas chromatogr&Ph1' was
to be developed. In addition, other ana:Qrtical methode, such as
D19JJ8 :spectrometry, were to be emplo7ed to supplement the

4
chromatographic an~ses. During the course of the stuctr, any
source of volcanic gases (vents, tumeroles, lava lakes, etc.)
that became accessible were to be sampled.
With the hope of gaining more knowledge ot equilibrium condi
tions in Hawaiian volcanic gases, the results of selected samples
tram various collecting aites vere to be used ali a basis tor
thermodynamic equilibrium calculations, via an electronic digital
computer.
C. Review ot Volcanic Gas CollectiDg Techniques
It is probably true that man' s first gas collecting and
analyzing device vas his nose. The human nose is c&pable of de
tecting, by their distinctive odors, H~, 802 and Hel, which
are components of most volcanic gases. This method sufters in
that it does not detect all ot the gues and is only qualltative.
In SODle recent investigations ot volcanicaJ.J.y active areas, how
ever, when a more tormal program of collection and anaiysis of
gues vas not possible, this technique has provided the only
intormation on the gases present. l5 ,l6 JUddl7 has described
another "qualitative technique" which vas used at one time to
illustrate the prasence ot large amountla ot cal'bon dioxide in
an active tumarole area near Naples, Italy. According to him,
a dog vas thrust into the invisible gas, and its suftocating
effect on the animAl indicated the presence ot this gas. The
dog was then vithdral1J1 and revived vith vater.
Fortunately for dogs, scientists have been interested i.il a
more complete and quantitative method ot en~sis ot volcanic

5
gases. The design ot a collecting technique tor volcanic gases.
ideally. must m.eet two requirements it the sample is to be
representativa ot the gases. First. it must take in the gases to
be collected while eXcluding all possible air. Secondly, the
collected gases muot not be allowed to react between themselves
vithin the collecting dence. Because volcanic gas sampling sites
are alvqs surrounded by an ocean ot air and 'because of the hot.
corresive nature of the gases. meeting these tvo requirements is a
very ditt1cult task. This di:tf1culty 1s otten compounded by the
inaccessibility ot sampling sites, which limits the type and amount
ot equipment that can be brought to the area. A survey ot the
literature since the beginning ot this century shows that t1va
basic methods have been emplo;yed for taking volcanic gas samples:
displacement ot air trau the sample container, displacement ot
water or mercury. vacuum tubes or bottles, condensation, and
adsorption. These methods are essenti~ the same as those
developed tor sampling industrial gases .18 vith modifications
tovsrd meeting the requirements and difficulties encountered in
sampling volcanic gases. By' far, the DIOst popular method has
been displacement ot air in the sampling dence vith the volcrmic
gases. In 1912 D8¥ and Shepherd19 used this method to take
samples trom. cracks in a dome ot lava built up over a lava
tountain on the floor ot Halamaumau caldera in Hawaii. Their
apP81'8.tUS contained 20 half liter glass tubes connectod in Beries.
One end of this series was connected through several lengths ot
glass tubing (with pure rubber Joints) to a piece ot iron pipe

6
which extended for 12 inches into the lava dome. The other end
vas attached to a hand pump to pull the gase8 through the sample
tubes. They pumped gases through this system tor 15 minutes to
be sure all ot the air originally present had been displaced
before the ends of the sample tube series vere closed off. Some
disadvantages' of this technique D18\Y be noted. First, considerable
water condensed in the sample tubes (ch1et~ in the first three
or four tubes) BO that it was not possible to determine the pro-
portion of this constituent relative to the total volcanic gases
discharged from the lava dome. Second, there vas no wB:¥ to prevent
alteration of the gas composition onca the sample had been
collected. The acid gases were soluble to a slight extent in the
vater that condensed out. thus removing some of' these gases from
the original composition. More troublesome is the reaction
2H28 + 802 a 38 + 2820.
This reaction apparent~ occurs beloW lOOoC in the presence of'
liquid vater, leaving onl.y 'Gba~ gas which was origin~ in
exce3s and a sul.tur deposit on the sides of the collecting de-
vice. Another reaction that would alter the canposition of the
collected gases. especiaJ..ly when there has been air contamination,
is I
2H2S + 02 lD 2S + 2H20.
These workers19 found the iron intake pipe to be badly corroded
after the collections II 00 1t seemed like~ that the primary'
COJIril08ition of the gases as they vere collected vas affected by

7
this tactor , especially with regard to the sul.rur gases. The
temperature at the iron pipe was estimated at 10000 0. Although
the analyses indicated, by their high N2 content (11 to 60 volume
percent), that air contamination took place, it is not possible
to determine how the contamination occurred. The air Jll8¥ have
been sucked into the dome ot lava by the motion ot the molten
lava inside, or it m8\Y ha.ve been due to incomplete removal ot
air tram the collection train.
This first attempt by D8\Y and Shepherd was designed to
collect fixed gases only, as they did not expect to find any
gases capable ot condensing in the sampling system. In order to
collect samples in which the condensed water vapor would be in
its correct proportion to the fixed gases they turned to a
vacuum tube. Their design consisted ot a 500 ml bulb to which
a long glass tube was attached. The sampling end ot this tube
vas closed with a thin, glass bulb. It was planned to take the
sample by inserting the thin bulb end into the gas vent or crack..
The heat ot the molten lava and the vacuum in the tube would cause
the thin bulb to collapse, alloYing the main bulb to till with
gas. This lJampllng end of the tube could then be resealed
qu1ckJy in the mo1ten lava. Untortunately sampling conditions
in Halem&\DJIAu crater had changed by the time these tubes vere
ready, and they vere not ab1e to test them under good sampling
conditions.
From 1917 through 1919. Jagger and Shep~erd20 took advantage
of the excellent sampling conditiona created in Halemaumau when

8
its lava lake would at intervals till to its rim. For these gas
collections they chose a V&Cuum tube. Shepherd was aware that the
most cr!tical part ot the design ot a vacuum tube vas its collecting
tip. The ideal tip would remain unbroken during transportation to
the site. would break easi~ in the gas source. and would be cap
able ot sealing before air could be drawn in by the cooling of the
hot gases in the tube. The usual design had the tip drawn out to
a fine point which can be broken on the valls ot the collecting
site. allaring the tube to till. This tip had the disadvantage
that if' the sampling vent temperature vas above the sotting point
ot the glass. the tip might collapse and thicken. Nf'uBing to
break. In another design. the tip was deliberate~ thickened. eo
that when placed in a hot vent. the reheating causes it to crack.
Bhepherd19 considered these tip designs as well as his "thin-
bulb" model used in 1912 as unreliable. When placed in the source
of volcanic gas. they often would not break as designed or just
not break at all. but would break regular~ during transportation
-to the source. For his 1911-1919 collecting tubes Shepherd
followed the design ot his ear~ vacuum tube except tor the tip.
Here he UBed a small bulb with a moderate~ thick vall. A thin
disc ot sott glass vas tused into the rounded end ot this bulb.
which curved inward when the tube had been evacuated. The idea
vas that the sott glass disc would melt and pull through before
the thicker valls ot the bulb reached their sottening point.
The tube also had a constriction near the main bulb end ot stem
leading to the tip. This allowed removal in the field ot the

9
long stem by a gas torch, tac111tating return ot the collected
sample to the lab tor analys1s. The oollect1ng procedure began
by tying the vacuum tube to a long bamboo rod, as heat f'rcm the
lava lake 'WOuld not allow hand-held tubes. The t1p ot the tube
was thrust 1nto openings ot the lake suriace tram wh1ch small
flames were r1sing. When they be11eved that the t1p had opened,
otten signaled by a sudden clouding ot the tube, they would
attempt to Deal the sottened t1p against the hot lava betore
removing the tube 1'rom the opening. Otten, however, the t1p
cracked when 1t was pulled out. In th1s case 1t was sealed vith
a rubber tube unt1l the stem could be sealed at 1ts constr1ct1on
with a gas torch.
Analyses ot thi!se samples showed a range ot 0 to 100 percent
air 1n the collected gases. All ot the sample tubes in wh1ch the
t1p cracked on pull1ng tram the gas source, shoved cons1derable
air. Those that stEqed sealed, provided scme ot the best volcanic
gaa samples ever collected. St1ll, these samples suffered from
the seme major disadvantage as those taken by the displacement of
air technique described above; that 1s, no provis1on was made tor
preventing sample alteration atter col16ct10n.
On a Nat10nal Geographic Expeditlon 1n 1919 to the Valley ot
Ten Thousand Smokes in the Katma1 region ot Alaska, Allen and
Ze1s2l collected gas samples trom some ot the many act1ve tumaroles
created by the 1912 erupt10n ot Nt. Katmai. They rejected col
lect10n by vacuum tubes because the cooling gases in the tube
usuaJ.]y pulled in air betore the tube could be sealed, thus

10
contaminating the sample. In addition, since the fumaroJ.e gases
consisted ot almost 100 percent water vapor, they could not collect
a large enough sample of the other gases to satisty their method
ot analysis without resorting to impossibly large sample tubes.
They chose to collect the "fixed" gases (CO2 ' O2 , CO, ~, CH4' N2)
and "vater soluble" gases (~S, HC1, HF) in separate operations.
For the "fixed" gases and vater vapor determination, they used a
water displacement technique. Their apparatus, consisting ot a
sample bulb with stopcocks at each end, a leveling bulb, and
connecting tubing, was tilled with water, including a copper in
take tube which was to be placed into the sampling vent. On
applying suction ut the leveling bulb end of the apparatUlf train,
a suf'ficient amount of the tumarole gas was pulled into the sample
bulb. The volume ot the condensed vater was then determined and
a meuured voJ.ume ot "fixed" gases was trapped in the swt\ple bulb.
For the H20 "SOluble" portion ot the gases they had planned to use
a technique developed by Shipley,22 in his collections tram the
same area in 1917. This apparatus consisted ot a glass tube
leading tram the vent to a catch bottle (a small filter flask)
which vas attacl1ed to one arm ot a U-tube filled with solid
Ba(OH)2- The other arm ot the U-tube vas attached to a suction
pump of known capacity. To collect a sample, a recorded number
ot strokes on the pump Ya8 performed. Some ~O vapor would
condense in the fluke some in the U-tuba and some escaped through
the pump. The ~O in the flaslt vas dravninto the U-tube ot
Ba(OH)2 and this tube vas stoppered until analysis.

11
Several objections can be raised against this collecting
technique. A major objection was that the gases must be collected
in two parts, due to the water solubility o~ sane of the gases.
Allen & Zeis were prevented from collecting the second portion of
their samples, the "soluble" gases, due to bad weather. This
made a complete analysis of the gases impossible, although they
were able to gain some information about the "soluble" gases
from Shipley's samples. They discovered on analyzing Shiple~ •s
four year old samples, that their original assumptions of negligible
concentration of "soluble" gases was wrong. Instead, the "soluble"
gases were found to have a concentra.tion equivalent to that of the
fixed gases. E'l'en with this correction, the amount of water vapor
was still greater than 99 volume percent. Another source of error
was to include CO2 with the "fixed" gases, whereas it is quite
~~adily soluble in water (1113 ml of CO2 per liter of water at
OOC).23 They found a considerabl~ amount of Ba(C03 )2 in Shipley's
Ba(OH)2 collecting tubes, but attributed this to atmospheric con
tamination, rather than CO2 in the fumarole gases. Finally, the
copper intake tube on their collection apparatus altered the
composition of the gases by its reaction with H2S. Because this
reaction produces H2 , it was necessary to report these two gases
as a total of H2 + H2S. No other sultur gases vere considared.
These samples do not appear to haw been entirely free of air
contamination as the percentage of N2 1s high in almost all of
their samples (25 to 80 volume percent of the fixed gases). This
Ul8\Y have been due, however, to air mixing with the gases in the
fumarole before they were collected.

12
E. T. Allenl sampled gases from the steam wells of Sulfur
Banks at Kilauea Volcano, Havaii. in 1922 using an air d1splace~
ment method. He determined sulfur wpor, sulfur dioxide and the
ratio of vater vapor to the remaining gases. For these three
determinations it vas necessBry' to take three" separate samples.
For sulfUr vapor collection, a glass intake tube, vhich extended
below the iron casings of the vells to prevent contmnination :from
this source, led the gases into a series of two small bottles.
The gases were pulled through the bottles by a 10 IIter metal,
gas aspirator. A small measured amount ot vater vas added to
each bottle to aid condensation and the first bottle vas kept in
an ice water bath. causing most of thq} water vapor to condense in
this bottle. When 10 liters ot gas had been pulled through the
bottles, the condensed vater vapor and precipitated sulfur vere
determined as s. ratio of sulfur vapor to vater vapor. The
same apparatus vas used tor sult'Ur dioxide, vith the addition
of a tlask containing 20 percent NaOH. The vater in the bottles
vas alao replaced with this solution, which adsorbs all ot the
other acid gases (002• H26, HC1) as well as 802 • Condensed
water vapor vas determined from the increased volume ot the
solutions and adsorbed 802 as BaS04. From this data a ratio ot
602 vapor to vater vapor vas determined. To det8rm1ne the water
vapor to "fixed" gas ratio, a bulb nth stopcocks on each end was
placed between the condensing bottles and the aspirator. The
first bottle vas not cooled in an ice bath. but allowed to remain
hot so that 002 would not be absorbed. Very U ttle vater

13
condensed in the second bottle and none in the gsa bulb. Atter
aspirating 10 liters of gas through this train, a sample ot "fixed"
gases vas trapped in the bulb for later analysis (which vas not
reported) • The amount ot water vapor was determined tram the
condensed water and the difference between this and the 10 11ters
of the aspirator gave the "fixed" gas volume.
Since no "fixed" gas analysis vas given it is not known hoy
etficiently this method displaced air originally in the apparatus.
The two maJor objections to this teChnique are the necessity ot
having ice and considerable amounts of water available and that
three separate collections are required tor determination of the
different components ot the gases.
Gases tram tumeroles in the crater ot White Island, one of
New Zealand's most active volcanic areas, were sampled in 1921,
1928 and 1929 by I. L. Grange.24 The 1921 samples were taken
by placing a small funnel attached to a gas bottle in the vent
to be sampled. When it vas felt that all air had been displaced,
the bottle vas removed and sealed. These samples vere badly
contsminated with air, the two reported having 81 percent and
91 percent, respectively. For the 1928 and 1929 collections the,y
chose a liquid displacement technique. The gas was led trom the
tumerole vent by a small diameter copper tube to a smupllng bottle
filled with mercury or vater, vh1ch it displaced. These samples
also vere air contsminated but to a lesser 9xtent. Of' the three
reported, the highest air concentration (02 percent plus the at
mospheric ratio equivalent of' N2
) vas. 19- percent and the lowest

14
zero percent. While this second technique reduced air contamina-
tion considerably, it has several drawbacks. First the inlet tube
was copper which would react with acid gases like H2S and H01.
Neither of these gases were found when this technique was used,
while large amounts of H2 vere detected (greater than 20 percent
of the water and air tree gases). With the air displacement
method. H01 was found but no H2• There was no ~S detected, but
this ~ have been oxidized to sulfur due to the large amount of
air contamination. While a glass intake tube 'Would have cQrrected
thi.1 problem, the use of mercury as the displacing liquid would
cause further problems. When water was used, some of the water
soluble gases were lost by solution. ~~o resulting in an a1ter.:~
gas composition.
An air displacement technique was used in 1929 and 1930 to
8EUllp1e solfataric gases from volcanoes in the former Netherlands
East Indies.25 The gases were led from the f'umerole by a tube
through three condensing bottles in series and then into a
15 liter aspirator. For each sample 10 liters of water was
allowed to flow out of' the BBp1rator, thus pulling 10 liters of'
gas into it. Although no fUrther details were given, the author
stated that he followed the procedUres used by Allen at SUlfur
Banks, Kilauea in 1922.1
An air displacement method which sampled all of the gases
vith (.)ne collection was used in 1935 to sample tumaro1e gases
26from the summit area of Mount Hood, Oregon. The collection
train consisted of a Pyrex intake tube, a condenser, a. Wou1t1'

15
bottle containing barium hydroxide (evacuated to keep it free from
C02), a copper gas holder, and an aspirator bottle. In taking a
sample, most of the water vapor was collected in the condenser and
then drained into the Woulff bottle. The Ba(OH)2 in this bottle
served as an adsorbent for H2S and CO2 , The remaining gases were
then collected in the copper gas holder. Water draining from the
aspirator created the suction necessary to pull the sample through
the gas train. The Woultf bottle and :the copper container were
then sealed until their contents could be analyzed in a laboratory.
In this technique, reactions between the apparatus and acid
gases were avoided by using glass equipment until these gases were
removed. Still some problems remained with the method. Water
condens8,tion in the intake tubing was a problem which is common
to all methods of this type. It was especi~~ serious when the
position of the intake tubing allowed this water to drain back into
gas vent, as happened with one of their reported samples. Air
contamination did not seem to be too great a problem. Their best
samples had less than one percent of air. The samples in which
the condensed water vapor drained back into the vent had almost
100 percent air even though its intake tube extended 5 feet into
the vent. The adsorption of the acid gases with Ba(OH)2 pre
vented reactions between these gases and adding the volume of the
condensed water vapor to the Ba(OH)2 allowed analysis of any of
these gases that dissolved in this water. Reactions, such as the
one between H2S and S02 which occurs readily at less than 100oC,
could not be prevented in this apparatus. The authors of this

16
work did not report if' any tree sulfur was found in the intake
tubing or in the water condenser which 'Would have indicated the
occurrence of this reaction.
A Russian scientist, I. Z. Ivanov,27 used the air displ.acement
technique vith some variations. to sample gases tram satel.l.1te
vol.canoes ot Klluchevskoi volcano in 1937. In an attempt to pre
vent air contamination ot the se.m,pl.e during collection. Ivanov
buried a large iron funnel in a pit dug into the fumerole. Glass
and rubber tubing led gases from the funnel into a collecting
bulb vith stopcocks on either end. A water aspirator. attached
to the outlet end ot the sample bulb, was used to pull the gases
through the sample train. In some cases he replaced the sample
bulb and aspirator with a one 11ter evacuated bulb. The tip ot
the bulb. which had been drawn-out to a capillary tube, was scratched
and connected to the intake tube by thick-walled rubber tUbing.
By squeezing the rubber tubing, the tip was broken and the bulb
filled with g&S. Samples collected with either ot these methods
were used to determine the ganeral mixture ot the gases and the
water vapor content. A separate collection ot acid gases was made
by pull1ng the tumarole gases through an adsorbing tube tilled with
a concentrated potassium hydroxide solution. The reported results
of the samples show the dry gases (water percentage excluded) to
be almost 100 percent air. indicating that the burial of the in-
take tunnel did not help to reduce air contamination. A glass
tunnel would have been better than the iron funnel as the acid
gases probably reacted with the iron tunnel.

17
From 1936 to 1940, Ballard and hie associates28,29,30 col
lected tumerolic gases tram Kilauea volcano on the island ot Hawaii.
Almost all ot these samples vera taken tram the manitold con
necting the three wells drilled in the SUltur Bank tumarole area
in 1922. 31 They were interested only' in determining the campOl! i
tion ot the 3.T percent "fixed gases" reported by Allen's 1922
study of Sulfur Bank gases,1 and made no attempt to collect water
or sultur vapor. A simple air displacement technique vas first
used by pulUng the gases, with a hand pump, through a sample
bulb attached to the manifold connecting the wells. The sample
bulb was placed in a vertical position above the gas source and
packed with ice so that vater vapor would condense out and flow
back into the vells. When it vas believed that the tube had been
thoroughly flushed vith vent g88es, stopcocks at each end were
closed and the sample was ready for laboratory ana.J.ysis. Detec
tion of rare gases in these samples was obscured by the large
amounts of CO2 and 802 found. To eliminate these gases the col
lection train vas altered by adding two vater condensers
foUaved by two adsorption tubes containing 50 percent KOR, and
then the sample bulb. Only air argon was found in the rare gas
ana.J.yeis of these samples.
From 1938 to 1940 their interest was in the measurement of the
602 :002 ratios in order to determine it any correlation existed
between variations in gas camposition and volcanic activity.
For these coll.ections they used the same air displacement method
vithout the KOH adsorption tubes. For more efficient removal of

18
vater vapor, they passed it through a coiled copper tube packed
in ice. The sample bulbs were connected to the coil through a
trap which prevented any vater tram entering the sample bulbs.
Three sample bulbs vere used, connected in series, and a hand
pump pulled the gases through the collection train. One sample
tube was used for 8°2 , one for CO2 + 802 and the third was a
spare in case of accidents.
There are tvo objections to their technique. First, the use
of coppeJ;'. tubing vith these highly reactive gases and second, the
gases had to bubble through previously condensed water vapor
betore entering the sample bulb. Both of these could alter the
composition of the collected gases. Air composition varied tram
zero to 40 per cent. This could mean air vas not efficiently
flushed f':rom their sample train or that it had mixed Vith the
tumarole gases underground. It is not likely to have entered at
the intake to their sample tre.in, as they had gas tigll"t; connections
to the manifold connecting the wells.
Ballal'd29 also designed a vacuum sampling tube to collect gases
tram molten lava during eruptions. He changed the design ot the
Shepherd and Jasger tubes20 in an attempt to overcome the 4ifti
culties in opening and sealing vacuum gas collecting tubes. To
insure that the tube could be opened when the sample WM to be
taken he used a crook-necked ti:.;» which had. been scra.tched with a
tile. A v1re vas attached to the tip to pull it ott at the proper
time. To seal the tubes before air could be drawn in, Ballard
placed e. glass vacumm stopcock between the main bulb (an 800 cc

19
Kjeldah1 tlask) and the tube leading to the tip. Betore removing
the sample tube tram the gas source this stopcock would be closed,
preventing air contamination. The sample tube also could be tied
to a long pole as Shepherd and Jagger did, it ~BmPle conditions
required it, and the stopcock would then be closed by a remote
control device. Untortunately, no opportunity occurred tor
testing these tubes during an eruption while Ballard vas conducting
his volcanic gas research at Kilauea.
A. U. 8. Government study ot Alaskan volcanoes in 1946 in
cluded some investigations ot tu:m&rollc gases. 32 Two methods vere
described tor taking gas samples. The tirst, vhich vas used to
take. partial samples ot gas tram tJmnals Island fumaroles, allaved
the gall to bubble through 250 ml. absorption bottles containing
about 150 ml of a strong KOH solution. No other details ot the
collection vere given. Analysis reported only CO2 and 802 in the
KOH sol,.rtion and gave approximate volumes ot unabsorbed gas8S
drawn through the collection bottles and the approximate volume
of condensed vater vapor. The other gas samples were taken from
tumaroles on Great Sitkin Island. For these collections a 25 ml
Pyrex glass pipette vas inserted in the fumeroJ.e opening. The
pressure of the f'umarole gases vas used to displace the air in
the tube and. till it vith the gas sample. When the pipettes vere
jUdged to be tilled, they vere sealed vith an cay-butane torch.
Unfortunately no analysis of these samples vere reported.
Another very simple air displacement technique vas used to
take gas samples near Helka volcano in Iceland in 1948.33 The

20
samples were taken by placing an inverted tuunel over the vent
opening. A rubber tube connected the f'Wmel to a gas sampling
tube or in some cases directly to a field gas anaqzer. Air in
the gas train was vashed out by allowing the gas to tlow through
it tor half' an hour. The analyses showed large mno\D1ts ot CO2
,
02' and N2 and less than one percent CO. The 02 and N2 are
almost certainly atmospheric and probably vere pulled in through
the loose fitting edge ot the tunnel.
A simple air displacement technique vas used by Wilson34 to
collect tumarol1c gas samples in New Zealand. The gas train con
sisted of an intake tube which vas attached to one side ot a bolt
head flask. An air condenser, attached to the other aide of the
tlask vas situated so that ~ condensate would drain into the
flask. The top ot the condenser vas attached to the sample bulb
set up vertically so that &:lJ::f further condensation would drain
out ot it into a flask attached to its bottom. This flaak served
os a trap for a pump used to pull gases through the train. The
condensed steam vas to be anal.yzed for soluble gases and the
sample bulb tor noncondensables, but no results vere given.
A preliminar;y investigation ot tumarol1c gases of Mount Pttle
and Grande Sou:triere volcanoes in the West Indies by' Fabre and
Chaigneau35 in 1958, led them to suspect that the gases vere
interacting atter collection (particularly vater vapor D ~S and
8°2) • To investigate this f'urther they devised a vacuum tube
collecting technique. Three bulbs of about 300 cc capacitY' vere
evacuated to about 10-2 mm. of Hg before sealing. In one bulb

21
they had put an exces~ amount of powdered P205 (12-15 grams) so
that all vater vapor would be quickly removed from the gas mixture
during collection. The second bulb contained a weighed tube of
P205 adsorbed on pumice, so that the amount of water vapor in the
sample could be determined. The third bulb contained no absorbent,
so that a compar:J.son of the affect of interactions during collec
tions on the gas composition could be made with the first two
bulbs. To take a sample, gas from the tumaro1e opening was pulled
through a funnel and tubing by means of a bulb-type aspirator until
it was felt all air had been displaced. The aspirator was then re
placed with one of the evacuated sample bulbs, fitting the intake
tube over the sample bulb rs capillary tip. This tip was then
broken and the sample bulb filled with gas. It was then sealed
by melting some Go1az cement which had previously been introduced
into the intake tube. Because of the law temperature of these
fumaroles (1000C) the tunnel and intake tUbing were of polyvinyl
plastic which should be inert to volcanic gases.
The results showed that the use of P205 as a dessicant was
quite successful in preventing the reaction between 802 and H28.
As an example, the gas from a Grande 80ufriere fumarole had about
0.8 percent (by volume) H28 and about 15 percent 802 according to
the analysis of the sample bulb with no dessicant. When P205 was
used, the H28 was found to be about 5 percent and the 802 21 per
cent. These percentages were calculated without including the
water vapor. The other gases found, CO2 , °2 , CH4, N2 and rare
gases, were not affected by' the presence or lack of the dessicant.

22
A sample taken from a Mount Pele fumarole, in which no H2S or S02
were found, had the same composition with the dessicant as without.
In later collections,36 these workers used CaC2 to determine
the water vapor content of the gases. The P205 on pumice was
replaced with 12-15 grams of powdered CaC2 which reacts with water
according to the equation:
CaC2 + H20 =CaO + C2H2 •
The volume of acetylene (C~2) liberated corresponds to an equal
volume of water vapor and so no weighing was involved in this
method. Chaigneau et a1. felt that the CaC2 reacted with water
vapor more efficiently than the P205 adsorbed on pumice. They did
not compare these two methods, but did use collecting tubes con-
taining excess P205 to determine all gases except water vapor.
Comparison of these results showed both methods gave the same
composition (excluding the water vapor).
Several research groups in Japan have in recent years developed
techniques for the collection and analysis of volcanic gases.
Mizutani37 has developed a technique, based on a method originally
38devised by Oana, which required that i'our separate samples be
tl."k..:n tor a complete analysis. In each case a syringe with two
needle heads vas used to pull the gases through the sampling train.
The first sample was used to determine the total alkali soluble
gases (C02 , H2S and S02)' oxygen, and the residual gases. The
sample train in this case consisted of the glass intake tube from
the vent, and the syringe. Using the syringe, air was displaced
by the volcanic gases. The exhaust head of the syringe was sealed

23
and the syringe was cooled in vater. Then more gas was drawn into
it. Condensed water vapor dissolved any hydrogen halide gases and
the remaining gases were transferred to a gas burrette for
analysis. For the second sample, used to determine H28 and 802 ,
a volumetric tube cooled in ~O and containing 4N NaOH was placed
between the intake tube from the vent and the syringe. After
purging air from the system, the syringe was used to bubble the
fumarolic gases through the NaOH solution. \-Tater vapor condensed
and the alkali gases were dissolved in the basic solution. Pumping
was continued until about 50 cc. of water had condensed. The solu
tion was then analyzed for H28 and 602 •
The same sampling train and procedure was used for the third
sample, to determine HC1, HF and the ratio of the remaining gases
to the original wate~ vapor, but the alkali solution was replaced
vith 10 ml of distilled water. When a measurable amount of water
had condensed in the tube the system was closed-off. After the
system had cooled, the volume of gas remaining in the syringe was
measured and the volume of eondensed vater vapor wae. determined.
The water vas saved for the determination of the dissolved HCl and
HF. A final gas sample was taken to determine the alkali
unadsorbed fraction (H2 , N2 , CH4' CO and Ar). For this sample a
gas collecting tube was placed between the vent intake tube and
the syringe. After air had been displaced from the sample train
by pumping the syringe a concentrated NaOH solution was pumped
via the syringe into the collecting tube, until it vas half-f'u11.

24
The collecting tube vas closed off from the syringe and tilted so
that the tumarolic gases bubble through the solution and the UD
adsorbed fraction collected above it. Both ends of the collecting
tube vere sealed with a torch and the sample vas returned to the
lab for analysis.
Mizutani "ras avare of several sources of error in his pro
cedure. Air contamination vas alV8\YS possible and a large amount
of oxygen in the first portion was reason for rejecting the sample.
Some error vas introduced due to the solubility of H28, 8°2 , and
C02 in the condensed vater vapor in the first and third samples.
He vas also aware of the error due to the reaction that occurs
betveen H28 and 802' but felt that when volcanic gases were poor
in both H2S and 802, the error vas negligible. When volcanic
gases contained considerable amounts of H28 and 802 he altered his
sampling procedure and method of analysis. The third sample vas
eliminated and the HC1, HF and ratio of unadsorbed gases to va'ti.er
vapor were determined from the second sample (taken with ~N NaOH
solution). The major disadvantage of this technique is that at
least three samples are required to make a complete analysis.
An extremely simple collection technique was developed by
Noguchi and Kamiya5 in their studies on predicting volcanic erup
tions. Their gas collection device vas a glass dish 15 em in
diameter and 15 em deep, containing 500 ml of 25 percent KOH.
The dish vas covered by a protective wooden boa whose sides were
f'Ull of holes to allow gas to enter. Several of these boxes were
placed on stands one meter high situated around "th'9 main crater

25
and a sulfataric zone of the volcano being studied. The KOH
solution was changed every 7 to 10 days and an~zed by the
authors for its C02' total sulfur, and total chlorine content.
Although a complete analysis could not be obtained by this method
it provided the information the authors needed.
The research group led by Iwasaki39 developed sampling tech
niques similar to Oana 1s 38 and Mizutani Is37 during their studies
of a number of Japanese volcanoes in the 1950 1s • They tried and
rejected iron tubes and glass vacuum tubes b~cause of poor pre-
cision. Fumarolic gases were sampled by inserting silica or hard
glass tubes into the vent to a depth sufficient to prevent air
contamination. A SYringe was used to pump gas through this tubing
until all air had been displaced, it the pressure ot the gases vas
low. For a complete determination, two samples of gas were taken.
A 100 ml syringe containing 20-30 m1 of 51q KOH was attached to the
vent intake tube and opened to the volcanic gases. 'fuen neceseary
the syringe was cooled with water. When the gases vere drawn into
the syringe, water vapor condensed and the acid gases dissolved in
the alkaline solution. The other components remained in the gas
phase. The volume of these residual gases and of the alkaline
solution were determined in the syringe, and then both vere
analyzed. From this SBI'lp1.e, H20, CO2 , BCL, F, total sulfur and
fixed gases (H2 , N2 , etc.) were determined. A second sample was
necessary to determine the ratio of the sulfur gases. For this
purpose they bubbled the fumarole gases through potassium iodide
solution containing known amounts of iO,jine. This solution was

26
analyzed for total sulfur (iodine consumed) for 802 (as sulfate),
and H28 was determined by the difference. Laboratory tests showed
the precision and accuracy of this technique to \)e ...Q...uite satis-
factory. The disadvantages were that a canplete analysis requires
two samples and that liquids, one of them caustic, must be trans-
ported to 8.lld from the collection site.
During this same decade of European and Japanese activity,
Naughton40 was developing gas sampling techniques for his studies
on Hawaiian volcanic gases. Like most investigators at the time,
Naughton was aware that one of the main problems involved in ob-
taining representative samples of volcanic gases was the prevention
of interactions among the gases during and after collection. This
is particularly true of the sulfur gases, as illustrated above by
the work of Fabre and Chaigneau. 35 Naughton noted that whether the
sample Wa!) taken in a vacuum bulb or by displacing air in a sample
bulb, tree sulfur deposited in the liquid condensate on the walls
of the bulb. This sulfur was believed to result from the inter-
action of ~8 and 802 • To overcome this problem, Naughton chose a
vacuum tube design similar to that used by Jagger and Shepherd,20
but with an adsorbent occupying a major portion of the tube. Of
the many adsorbents tested, both liquid and solid, the. most
successf'ul was 20 to 60 mesh silica gel. The sample tubes were
made from approximately three foot lengths of 3/8" diameter Pyrex
glass tubing with break-off tips added to each end (one for
sampling and one for analysis). About two feet of the length was
filled with silica gel which was held in place by glass wool plugs,

27
and the tube vas baked at 3500 C under vacuum to activate the silica
Bel. To take a sample, the sampling tip vas broken against the
wall ot the volcanic vent, tilling the tube vith gas in o~ a 'lev
seconds. Sealing the tube vas still as much a problem as it vas
for Jagger and Shepherd. If'-the vent vas above the softening
temperature of glass, the glass tip could be resealed in it.
otherwise when the tube was removed from the vent, it was tempor
ari~ sEaled with a short piece of closed-end fluorocarbon or rubber
tubing. A torch was used to seal the tip later. When a sample
was to be taken deep in a high temperature vent, the tubes were
placed in an iron pipe and surrounded by an insulating layer of
powdered diatomaceous earth. The glass break-off tip protruded
from the end of the pipe so It could be broken as before. This
pipe could be held in an 8000 c vent for about one minute before
the temperature of the vacuum tube exceeded lOOoC.
Naughton and co-workers 40 made a comparison of' their silica
gel tube and Shepherd's vacuum bulb by taking samples of a known
mixture of CO2 , H2S, S02 and steam passing through a large glass
tube. Free sulfur was Inve.riab~ deposited on the walls of the
Shepherd tubes and when the remaining gases were analyzed, on~
that sulfur gas (H2S or S02) originally present in a stoichio
metric excess was found. Analysis of the gases collected in the
silica gel tubes showed they had the same composition as the pre
pared mixture. other tests showed that the silica gel adsorbed the
acid gases and water vapor in the same way as a chromatographic
column, separating each component. The adsorbed gases showed no

28
tendency to migrate or remix, all.ow1ng a sample to be stored for
long periods without alteration of its contents. The fixed gases
(H2, 02' N2, etc.) were not adsorbed and filled the free volume
of the tube. In field tests during the 1959-1960 Kilauea eruption,
the composition of gases collected by this method corresponded to
4the equilibrium composition calculated for such volcanic systems.
Not even an approximate equilibrium composition was found in samples
taken by any of the other methods tested. While this collecting
tube had many advantages over previous designs it still had the
disadvantage of being difficult to seal before air contamination
occurs.
40 4 41Both Naughton ' and Murata sampled gases from the pumice-
cinder cone of Kilauea Iki, which was built-up during the 1959
Kilauea eruption. While Naughton vas interested in determining
all of the components of the gas, Murata was interested only in
finding the amount, if any, of halogen acid gases present. For
this purpose the latter used the following technique. A two feet
deep hole was dug into the cone at a point where copious steam
was being emitted (the temperature was about 328°C at this point).
A large inverted glass :runnel was buried in thi s hole and its
protruding stem was attached to a long, inclined piece of glass
tubing. This tube, which served as a condensor, ran into a
500 ml receiving flask immersed in a bucket of dry ice cooled
water. A suction pump was used to pull the fumarole gases through
the gas train, and after several hours of pumping about 450 ml. of
condensate was collected and analyzed by standard chemical methods.

29
The use of all glass equipment prevented the interaction of the
halogen acid gases with the collecting equipment. Air contamina
tion vas not important in this type of collection, as only the
condensed steam was collected for analysis.
In November of 1963 a submarine eruption off the southern
coast of Iceland, began building the island of Surtsey. Four
attempts were made in 1964 to collect gases from Surtsey's still
erupting volcano by Sigvaldason and others. 42 ,43 The collections
were made by inserting a tube into the vent to be sampled. This
was attached to a Dewar bottle, which served as a water trap, and
this in turn was attached to the sample tube. The sample tubes
were made from Pyrex glass with stopcocks on each end. On the
first and second visits to the island, samples were taken using a
copper inlet tube. This proved to be a poor choice due to the high
temperature of th~ vent (8400 c) and the corrosive gases. Air
cooling was used to condense vater vapor in the Dewar bottle and a
pump was used to pull the remaining gases into the sample tube.
Analysis of these samples showed only water and air. Sampling con
ditions had changed on the third visit to Surtsey. This time lava
was flowing from the main crater through closed channels. Samples
were taken from a hole in the roof of one of these channels where
burning gases were escaping at a high velocity. Since the tempera
ture of this vent was about llOOoC, the copper intake tUbing was
replaced with stainless steel tubing. The high velocity of the
emitting gas efficiently removed air from the sample trai~ and made
pumping unnecessary. The reported analysis of a sample taken from

30
this vent showed a number of active gases to be present (H2
, CO2
,
CO and S02) with less than one percent air. Tests with lead
acetate paper at the end of the stainless steel tube indicated
the presence of H2S and its odor had been noted from the beginning
of lava production. Considerable free sulfur waa noted in the
condensed water vapor, which also indicated the presence of H2S.
Sampling conditions had changed again when the fourth visit to
Surtsey vas made. Again a stainless steel tube was inserted
into a hole in a lava tunnel, but this hole was very large and
the gases did not have as high a velocity as before. It was neces
sary to use a pump to pull the gases through the sample train.
The composition of this sample was like that of the first two,
mostly water and air with some CO2•
The results of the analysis indicated that Sigvaldason's
collecting technique worked best at high pressure gas vents. Air
was probably pulled in through the intake tube by the pump and its
02 plus the metal intake tube apparently removed all of the active
components from the gases before they reached the sample tube.
While a quartz intake tube would have been better than the metal
ones used, very little could have been done to prevent inter
actions between the gases as they cooled in the sample train
before reaching the sample tube. This probably was the reason
H2S was not found in the gases analyzed.
This review has shown that a vide variety of volcanic gas
collecting techniques have been developed since the beginning of
the century. While some techniques seem superior to others, no

31
clear favorite ha.s emerged. It is not always obvious from the re
ported research why a particular method was used. Many factors
not always evident in the report must be considered, such as the
location of the sampling site and difficulty or ease in reaching
it. Sometimes, because of heat or other dangers, it is not pos
sible to get close enough to a vent to use a particular method.
Lack of some of the necessary material and equipment may also pre
vent the use of more desirable techniques.
D. Review of volcanic gas analysis techniques
In the past, as with the collecting techniques, the methods
used for analyzing volcanic gases have relied heavily on the
technology developed for studying mine and industrial gases. This
has most often been an absorption apparatus based on the Hample or
Oreatprinciple. 44 In both cases, the sample is admitted to a gas
burette and its volume measured. The gases are then exposed to a
pipette containing an absorption reagent specific for one gas.
The volume is redetermined, and the difference corresponds to the
absorbed gas. With the Hemple apparatus, the absorption pipettes
are attached one at a time as they are needed, while with the
Orsat apparatus they are permanently attached to the gas burette
by means of' a manifold. Absorption reagents used by Allen and
Zies in their studies of volcanic gases from Katmai, Alaska are
typical. 2l In order or their use they were: potassium hydroxide
for carbon dioxide, pyrogallol for oxygen, ammoniacal cuprous
chloride for carbon monoxide. Methane and hydrogen were determined

32
in a combustion pipette and nitrogen was adsorbed on hot calcium.
Any residual gases were assumed to be noble gases. Their labora-
tory apparatus, based on the Orsat principle, was developed by
U.S. Bureau of Mines' scientists. 45 Allen and Zies took a portable
model into the field, which, for convenience, used water instead
of mercury in the gas burette. This resulted in a loss in accuracy,
however, due to the solubility of the gases in vater.
Until recent years H2S was not detected in volcanic gases, due
to the collecting techniques, so a method of analysis was rarely
reported for this gas. If S02 was present it was absorbed in the
sodium or potassium hydroxide used to adsorb CO2 , The 802 was
then determined gravimetrically by oxidizing and precipitating as
BaS04 or volumetrically by adding a standard iodine solution and
back-titrating the excess iodine. This latter method was used by
Shepherd20 in the analysis of the famous samples collected with
Jagger in Hawaii in 1918 and 1919. Shepherd's apparatus was based
on the Orsat principle, but was more elaborate than the usual
equipment employed and undOUbtedly contributed a great deal to the
excellence of their 1918-1919 analyses. His apparatus was designed
around the :tact that volcanic gases consist of a few components
present in large amounts and the majority present in trace quan-
tities. So that a simple solubility would not be mistaken for
absorption, Shepherd used solid reagents for absorbents and mercury
to move the gases around within the system. Tests indicated his
apparatus vas accurate for its purposes and considerably more
accurate than the gas collecting techniques used.

33
Absorption methods based on the Hemple or Orsat apparatus
vere also used by Ivanov in Russia.27 Ballard and Ptqne in
Havaii29 and Porkelsson in Iceland. 33 Using a similar technique.
Wilson34 made a partial an~sis of his samples in the field.
After determining the sample pressure and temperature. CO2 and
H2S vere removed with a NaOH solution. The pressure was remeasured
and from this and the 8lllount of H2S found in the NaOti solution by
iodine titration. the 8lllount of CO2 was determined. The remaining
gas vas transported to his laboratory tor an~sis by a standard
adsorption pipette method. Fabre and Chaigneau46 used an absorp
tion method developed by Lebeau bIld Damiens47 that. like
Shepherd•s technique. used solid reagents to avoid errors from
the solubility ot some of the gases in the reagents. Their
an~sis included specific re88ents for absorbing H2S and 602'
since these gases were preserved by their collecting technique. 35
~dr~en sulfide vas absorbed by cupric sultate crystals and
602 by an agglomeration ot small balls ot Pb02•
Allen •sl 1922 study 01' gases from the drill holes at SUlfur
Bank. Kilauea. Hawaii. involved extreme~ simple methods for a
partial analysis 01' the samples. SUlfur vapor vas considered a
component 01' the gases and vas determined by dr1ing &n.d weighing
the tree sulfur that precipitated in the condensing vater vapor
during collection 01' the sample. Sulfur dioxide. vhich vas
collected in a NaOH solution. vas determined by preclpita.ting it
tram this solution as BaB04• The remaining components. vater

vapor and the tixed gases (C02' N2' etc.), vere determined by
measuring the volume ot fixed gases that accompanied a measured
amount ot condensed vater vapor. He took care to avoid solution
ot CO2 in vater by using hot vater whenever the tvo came into
contact. This same procedure vas followed by stehn in his gM
studies ot volcanoes in the former Netherlands East Indies.25
In their recent study on the use of volcanic gas composition
tor the prediction ot volcanic eruptions, Noguchi and Kamiya5
were concerned only with the gases that vould be adsorbed by
dishes ot a NaOH solution set around the volcano. Total
sulfur gases (~8 and 802) vere determined by oxidizing these
gases to sulfate with thirty percent hydrogen peroxide. The
resulting sulfate vas then precipitated with barium chloride
and determined gravimetrically as barium sultate. They deter
mined chlorine by titrating with silver nitrate, using potassium
chromate as an indicator (the Mohr method). Atter oxidizing an
aliquot ot the potassium hydroxide, they titrated it vith a
2B hydrochloric acid solution to determine carbon dioxide.
Murata's4l search tor halogen acid gases at Kilauea Ild also
made use ot standard vet chemical methods ot analysis. since
his gas samples ware collected as a steam condensate.
The use ot instrumental methods tor the analysis ot vol
canic gases has largely replaced the absorption pipette and vet
chemistry techniques. While this has been mostly a recent
34

35
development, one instrumental technique. spectroscopy, has been
applied to the study of volcanic gases for some time. Judd's
book, "Volcanoes," published in 1881, proposes the use of a
spectroscope to study the flames of burning volcanic gases as
they are emitted from a vent. 48 Since that time many investi
gators have used hand-held, visual spectrometers to observe
volcanic flames, but only qualitative information could be
obtained in this wB\Y. In 1938, Verhoogen49 made the first
quantitative studies of volcanic flames by obtaining spectro
grams tram the eruption of the African volcano, Nyamlagira.
His results showed that the ma.1 or em!tting atoms were minor
components of the gases D such as sodium and potassium.
Nothing of the nature of the major burning ga.oes was re-
vealed ~ the spectrograms. It was suggested that this was
most likely due to the poor em!tting abillty of the molecules
and radicals involved in the major gases. His instrument was
a Hilger conStant deviation camera spectrometer vith a range
of 3800-9000 AO • K. J. MurataB made a study of gas flames
during the 1960 flank eruption of Kilauea volcano, using a
small Gaertner quartz spectrograph. His spectrograms shoved
the presence of Cuel in the flames and suggest that this mole
cule is more volatile in ba881tic magmas than had been sus
pected. Emission spectroscopy was sometimes used to an~ze
the residual gas fraction from the adsorption pipette techniques,

36
since this traction contained only rare gases, which almost
alwqs consisted ot only argon.21,20 Ballard and pa.ynE"28
attempted to analyze all of the gases in a sample by spec
troscopic means but were not successful, because the large
amount of CO2 in the sample masked the other components. They I
then switched to the absorption pipette method of analysis,
using spectroscopy only for the rare gases. 29
The tvo analytical techniques, mass spectrometry and
gas chromatography, have in recent years been developed to a
high state and are proving to be extremely valuable tools tor
the study of volcanic gases. Sakai and Nagasawa50 ha.ve
studied the fractionation of sultur isotopes in f'umo.rolic
gases from Shirane and Shownshinzon volcanoes in Japan by'
means 0-: mass spectrometry. During collection of the sample
the gases were bubbled through a KI-I2 solution, which oxidized
602 and ~6 to sultate ions and free sulf'ur. The tree sulf'ur
was tiltered-out and the sulfate precipitated as BaS04 and
converted to a sulfide. Each ot these was then converted to
sultur dioxide tor the analysis by mass spectrometry. In
this Y8'¥ they were able to determine S34/632 ratios tor the
802 and the H2S in the original sample. They used a. CEO Model
2l-l03A mass spectrometer.
Rafter5l and Wilson52 in Nev Zealand have made sulf'ur iso-
tope measurements on a variety of sp~cimen8, including gases

and condensates !rom fumaroles in their studies on the origin
and genesis of sUlphide and sulfate minerals. In their
sampling technique the reactive gases were adsorbed in a con
centrated sodium hydroxide solution. In addition to l~S and
S02' polythionates were also found in the gases and con
densates from the tumaroles sampled. To separate these com
pounds, they used a stream of 112 to drive the two gases out
of the NaOH solution into an acidified ~02 solution. This
solution oxidized the 802' which was later precipitated as
BaS04, and 'the H2S, which passed through it, vas trapped in
a AgN03 solution and precipitated as ~S. The sulfur iso
tope abundances for each of these components could then be
determined.
Other New Zealand investigators53 have used mass spec
trometry to study' gas discharges in 'the thermal areas of
that country, in hopes of obta1niD8 more information on the
cause of such discharges. Their analyses included deter
minations ot N2, 02' H2' Ar, CH4 and C02. Collected samples
were prepared for the mass spectrometer in a vacuum system
where water, CO2 and 'the residual gases, as a group, were
separated. The pressure and volume of the CO2 and of the
residual gases were measured and break-seal tubes taken for
an~is• The mass spectr.ometer used was a sixty degree
Ni~r type using magnetic ion slection and manual peak height
37

38
measurement. They estimated an accuracy of :!: 3 percent tor ArIN
ratios reported and approximately 10 percent for the othe~
components reported.
The high sensitivity ot mass spectrometry makes ita par
ticularly advantageous technique tor the study of the rare gas
component of voJ.canic gases. An example is the york ot Mazor
and Wasserburg54 on gas emanations !rom Yellowstone and Lassen
volcanic parks. The purpose of their study was to determine the
nature and the juvenile component. it any. ot the rare gases
associated with some ofthe thermal waters in these National
Parks. Their samples. which involved only' gases bubbling-up
through the hot springs and mud pools ot these thermal areas,
were tirst anal:yzed volumetrically tor C02. N2• CH4' ~S and
the total rare gases in a vacuum system. The individual rare
gases were then determined by isotopic dilution and mass
spect.rometry using a tracer mixture containing each rare gas
to be determined. They used a mass spectrometer with a 6-inch
radius of' curvature and two detectors. one with an electron
multiplier and the other a simple Faradlq cage. to measure the
argon, krypton and xenon in their samples. Experimental errors
ot the results were in the range ot 10 percent or less.
Gas chramatograp~ is undoubtedly the most suitable technique
available for the analysis of volcanic gases. Its sensitivity
range is such that both the ma.1 or components and the trace
components can be determined tram a relatlvely small sample (a
'lev milllliters ) • While not as sensitive as mass spectrometry

39
for the trace components, this disadvantage is completely out
weighed by the low cost and simple operating procedures ot a gas
chromatograph. Naughton et al., 40 used a gas chromatoRl"aphic tech
nique tor the analysis ot their gas samples taken during the 1959
1960 Kilauea eruption in Hawaii. They used five chromatographic
columns to obtain a complete separation ot the gas Dample. Their
analysis involved essentially three steps. First the permanent
gases (~. °2 , 1'12 , CH4 and CO), which were not adsorbed on the
silica gel in their collecting tubes, were an~zed with a molecu-
lar sieves 5A column, using argon as the carrier gas. Another
molecular sie~s 5A column vas run at -780 0 with He carrier gas to
separate Ar and 02 and a third column of silica gel and cupric oxide
was used to determine CO and 002 (some of which apparently did not
stay adsorbed on the collecting tube silica gel). In the second
step of the analysis, the gases adsorbed on their silica gel col
lecting tubes were driven off and analyzed. Here they used 8.
column of tricresyl phosphate on a base of 0-22 firebrick to sep
arate H28, CO2 and 802 and a distillation trap with silica glass to
separatt." CO2 , 802 and C82 • Both were used wi th He carrier gas. In
the third step, water was driven off the collecting tube into a re
movable trap and weighed. They used a thermal conductivity detector
throughout. Using air samples, they found the accuracy and pre
cision or their apparatus varied vith the sample size. The
accuracy ot analysis was usually within 5 percent ot the known
values, but as high as 20 percent f.or very small samples.
SUYa83 in Japan has developed a gas chromatographic method
to analyze the "residual gases" which remain after washing a

40
volcanic gas s8q)le with a concentrated alkali solution. These
gases (~, 12 , ~, CH4' CO and the rare gaees) were analyzed on
columns ot molecular sieves 5A and l3X run at room temperature
with argon as a carrier gas. The 5A sieves gave a better separa
tion ot ~ and 02 than the 13X sieves. Since a molecular sieve
column will not separate 02 ,and Ar at room temperature, Suwa
determined 02 using argon as the carrier gas and then determined
Ar using oxygen as the carrier gas. When there was so much ~
present that it intertered with the determination ot Ar and °2,
she removed the H2 with a palladium leak. Hel1\D1l was also deter
mined by first removing H2 with a palladium leak.aB these two gases
have the same retention time on molec.ular sieve columns at room
temperature. To determine the precision and accuracy ot her
technique, Suva measured the Ar content ot different volumes ot
air. She tound a relative standal·d deviation ot 2.4 percent and
an average value ot 0.93 ~ 0.02 percent tor argon in air, which
compares tavorably vith the accepted value (0.93 percent). 55
A recent study ot gases tram hydrothermal sources in Yellow
stone National Park was made by Gunter and Musgrave using gas
chromatography tor the analysis. 56 With their system they were
able to determine CO2 , ~, ~8, 02 + Ar, N2, CH4, CO, and S02
with one run ot a gas sample through the chromatograph. Carbon
dioxide, H2S and S02 vere separated on a sultolane on fire
brick. column, which also produced a composite peak tor the other
gases. A molecular sieves 131 column vas used to separate the
"composite" gases, while the H28, 802
and CO2 were irreversibly
41
adsorbed on this column. As the "composite" gases (~, 02' etc.)
vere eluted from the l3X column. they vere detected on the
reference side or the detector. A polariV sritch was necessary
to obtain positive recorder peaks tor these gases. To obtain a
separation of Ar and °2 , they switched to a molecular sieves 5A
column vhich vas run at less than zero degrees centigrade. The
rellabilltY' of their 8Y'stem vas monitored periodic~ bY' com-
paring the total number ot moles ot gas observed with the number
calculated b'cm the sample pressure, volume, and temperature. On
the average. they vere tound to agree vithin 3 percent ot each
other. It should be noted that in their technique the continued
irreversible absorption ot CO2 , ~S and S02 on the l3X column would
eventual.J.y' destl'OY' the separating &billty of this column for the
other gases. This would necessitate continued reactivation or re-
placement of the l3X sieves column.
Some investigators have used a combination of dif':terent tech
niques to achieve a complete an~sin. Mizutani, 31 who collected
his samples in tour parts, used an Orsat type an~zer to determine
CO2' ~6 and S02 as a group, 02 and residual gases in his first
traction. Hydrogen sulfide and 602 in the second traction and
HCl and HF in the third traction were determined by standard
titrametric methods. A gas chromatographic technique vas used to
analyze ~, 12 , CH4' Ar and CO in the fourth traction. Multiple
samples vere also used by Ivasald. !i!!. ,39 to obtain a complete
analysis. They used standard "vet chemistry" techniques for the
determination of y and 6°2 • For CO2 they used a diffusion

42
technique and tor HCl and Ifil'. photometric methods. Fixed gases
(~. N2 • °2 , etc.) were determined by mass spectrometry in their
laboratory and by an Orsat apparatus in the field.
The techniques described above involve two steps, the collec
tion or the sample in the field and the analysis of the sample
in the laboratory (in some cases a partial analysis was made in
the field). Elskens et ale ,57 have, however, devised a technique
that analyzed the sample as it vas being collected. Their tech
nique completed the collection and analysis in a tev seconds or
less and was capable or detecting H20. CO2 , Hi3 and S02 + H~.
To accomplish this they adapted an air-pollution detection unit
manufactured by Draeger and Co. in Lubeck. Germ&1lY'. for use with
volcanic gaEes. The Draeger unit operates bY' selective~ adsorbing
one component ot the gases being sampled on a so11d reagent con
tained in a small (10-20 cc). calibrated glass tube. A measured
amount ot gases is pulled through this tube by a calibrated suc
tion pump. The length of adsorbent that changes color then gives
directly the concentration ot that component. To compare their
Draeger tube technique vith laboratory analyses. these investi
gators took a number ot samples trom Stromboli volcano in Italy.
Samples taken tor laboratory analysis were collected on silica
gel. molecular sieves. or other absorbents. They found the field
results to be within 5 percent ot the laboratory results. on the
average. for ~O. CO2 , H2S and 802 + H2S. Determinations or co.
Hel and C~ vere not successful due to interferences.

43
E. Chemical Equilibria in Vol.canic Gases
The discouraging compositional variations to\D1d in the
analy'ses of volcanic gas collections, led ear~ in'Yestigators to
conclUde that such studies would contribute little to under-
standing the role ot gases in volcanism. Crude collecting and
an~z1ng techniques no doubt contributed to the variability in
composition, but variations remained even when these factors were
improved Ltpon. Recent studies have taken :l.~.t~ aCQ:ount the pos-
sible attainment ot chemical equilibrium in volcanic gas systems,
which could be used to explain the variations on the basis· of
temperature and pressure changes and the admixture of various
quantities ot air or ground vater, or some combination of these.
Calculations made by Ellis58 in 1957 showed that the composi-
tion ot the gases in some ot the best volcanic gas collections
were nearly the same as the chemical equilibrium compositions
which would be expected for similar situations of distribution
of atomic species, pressure and temperature. Krauskopt, 59 has
calcul.ated the composition of a magmatic gas phase assumed to
exist at 6000 c and 1000 atmospheres, including the degree of oJd-
dation ot the gas and reactions of it with minerals in the magma.
Several Japanese workers also have made studies of thermo~amic
equilibria in volcanic gas systems.60,61 Extensive studies on
the establishment ot chemical equilibrium in recent collections
ot Hawaiian volcanic gases and the ettects ot temperature.
pressure and water variations on these equilibria have been made
by Heald et &.4 They reduced the considerable labor involved

44
in the theoretical calculations by progr8lllD1ing them for a com
puter. 62
F. Description of the Sampling Sites
The Hawaiian Archipelago consists of a series of volcanic
islands stretching tor 1,600 miles along a line northwest to
southeast across the central Pacitic. As described by Stearns,
these islands are actually shield-shaped basaltic domes built
over a fissure 1,600 miles long in the ocean t1oor. 63 He esti
mates that the islands sts.rted from this tissure about 25,000,000
years ago in the Miocene epoch. Volcanic activity has apparently
moved down the chain from the northwest and is now centered on
Hawaii, the youngest island, at the southeastern end of the chain.
Ot the five volcanoes on the island of Hawaii, only three have been
active in historic times. Hualalai, which is on the western part
ot the island, last erupted in 1801. Mauna Loa and Kilauea,
which cover the southern end ot Hawaii, are still active.
Both Kilauea and Mauna Loa are shield-type volcanoes, built
largely by eruptions occurring along their ritt zones, which ex
tend in tlrO directions trom thei!" summ:f.t calderas at an angle ot
approximately 135 degrees. Kilauea is the smaller ot the two
volcanoes and lies against the southeastern flank of Mauna Loa.
Its rift zones extend to the southwest and to the east trom its
summit crater. A map of the swmnit area is shown in Figure 1.
Kilauea' B tame as a volcano is due mainly to the active lava
lake which occupied its summit through most ot the 19th century

19°25'
155°10'
155°10'
MAKAOPUHIALAELAVALAKE LAVA LAKE
'---- 0 -~-,//,~---ALOI ~
CRATER cO~ ~~
~
\\
"/\ ....a 53-FUMAROLEI ,\.3
/ '---
155°15'
9 ,1 ~ML ~OI • I I (~
1 2KM.CONTOUR INTERVAL,,: 250 FEET
3500
HAWAIID
/
19°1 VOLCANO25'r-08SERV~
0/ ~ I' Q
Figure 1. SUJIIIlit Area or Kilauea Volcano~VI

46
and the first quarter ot this century.64 While other lava lakes
existed tor short periods on the caldera tloor, the principle
activity vas centered in the pit crater Halemaumau, vh1ch is
believed to be the point vhere the main lava conduit of Kilauea
reaches the surtace. The establishment ot the Havaiian Volcano
Observatory in 191265 allowed continuous study ot this unusual
feature until the lava lake vas destroyed by an explosive eruption
in 1924.
Before this lava lake disappeared, however, it provided the
first samples of gases collected from Hawaiian volcanoes. The
first attempts to collect gases from this source vere made by
D83" and Shepherd19 in M~ of 1913 shortly after the Volcano
Observatory began fUnctioning. Their samples vere taken from
a dome vh1ch had formed over a small fountain ot lava at the edge
of the lake. At the time they made their collections, the level
ot the lava lake vas several hundred teet below its rim, requiring
a rather diff'icult climb to reach the sampling point. Jagger and
Shepherd20 took advantage ot more tavorable sampling conditions
when they made their classic collections from the lava lake during
1917, 1918 and 1919. At times during these years, Halemaumau
vas filled to its rim, allowing these investigators to stand at
the edge and collect their samples trom openings in the crust as
it floated by. These collections represent the only gas samples
to be taken from this important source. The 1300 teet deep crater
lett by the 1924 explosion has been reduced to about 750 teet by
several outbreaks of magma on the floor ot Halemawnau.64 Still

this important source ot gases (apparently the top ot the main lava
conduit ot Kilauea volcano) remains inaccessible due to the steep,
continually sloughing valls ot the crater.
For the past decade, eruptive activity at Kilauea volcano
has been centered along the east rift zone. Bear the summit ot
the volcano, this rift zone is characterized by a series ot pit
craters tormed by a collapse dUe to removal ot support. Since
1959 a number ot eruptions have occurred in or near these pit
craters, partial.ly tilling some ot them vith molten lane The
lava lakes thus formed vere not true lava lakes in the same sense
as the active lake that existed tor so long in Halemaumau, since
they vere not connected to any source ot magma. Nevertheless,
they are important tor they have provided an unequalled oppor-
tunity to study the cooling and degassing ot large bodies ot
basaltic lava. The 1959 eruption in Kilauea Iki pit crater re-
sulted in a lake ot this type, some 380 teet deep. About seven
months atter the end ot this eruption, a study ot this lake was
begun by drilling holes through the crust and into the still
molten interior ot the lake. This program vas initiated by
66u.S. Geological Survey geologists to make a long-term study
ot the cooling and crystallization ot the lava lake. These
drill holes also proved to be an excellent source ot gases from
the cooling lake. Naughton, Heald and Barnes40 were able to
take a tfN samples ot these gases by lowering their collecting
tubes into one of the drill holes. An eruption in 1963 produced
a similar but smaller lava lake in Alae crater, turther dawn the

48
rift zone. This lake, only 50 feet deep, was also studied by
core drilling. The initial gas samples taken for the present
investigation came fram these holes during the last stages ot
solidification ot this lake.
During a week-long, flank eruption in March of 1965. another
"rootless" lava lake was formed, this time in Makaopuhi pit
crater, vhich is located about seven miles down the east rift
zone trom Kilauea's summit. By the end of the eruption, vents on
the crater vall had poured into the deep western pit ot this
double pit crater approximately 6.5 million cubic yards ot lava.
cret\tillg a 290 feet deep lake. Twice during the course of this
eruption. collecting trips were made down to the surface of the
forming lake. and, under somewhat hazardous conditiona. a number
of gas samples were taken. These have been included in the
present study. In April ot 1965, when the surtace ot the new
lavs. lake had cooled sufficiently and a crust about six teet
thick had formed. the U.S. Geological SUrvey began a core drilling
study of the cooling lava. This investigation took advantage of
these drill holes to make a rather extensive collection and analysis
ot the gases emanating trom them during the first year of cooling
of Makaopuhi lava lake.
The rootless lava lakes are unusual. but the tumaroles found
around Kilauea are a common feature of almost all volcanoes. A
fumarole is defined as a hole or vent tram which fumes or vapors
are emitted,67 and those associated with volcanoes have been a
major source of samples tor studies of volcanic gases. Primary

49
tumaroles are best for this purpoae, as they are situated over
cracks in the calderas or rift zones at a volcano and are active
tor Dl8JlY years. The best known example at Kilauea is the soltataric
fumarole known as SUltur Bank, which is situated on an old rim ot
the main caldera, near the National Park headquarters. In 1922,
31T. A. Jagger conducted a drilling program at Kilauea to study
changes in temperature, gas composition and mineral formation vith
depth in Kilauea volcano. During that time three holes were
drilled at Sulfur Bank, one 70 teet deep and two on either side
15 feet deep. The middle hole was cased vith cement and all
three holes vere joined at the top by an iron manifold. Since
that time almost all Sulfur Bank gas samples have come from this
source, rather than the natural fumarole. Allen, l in 1922, was
the f'irst to sample and an~ze these drill hole gases. From
1935 to 1940, Ballard and P8\Ylle30 conducted a study ot gases tran
this source, and Naughton et al.40 ,68 samples these gases in the
1950's. Although the iron manifold topping these drill holes has
corroded extenaive~ and is now most~ crystalline sulfur re-
taining the form 01' the pipes, they have provided a continuous,
reliable source 01' gases for this investigation.
Two previously unsampled tumaroles have also been included
in this study. One is located on the ooutheastern edge of
Kilauea Caldera about one mile east ot Halemaumau (82 tumarole
in Figure 1). As is the case at Sulf'ur Bank, the gases trom the
cracks and vents at this fumarole have caused considerable
alteration of the surrounding rock.69 Both of these fumaroles

50
have been operating tor some time; their activity apparently vas
first recorded in 1823.63 The other tumarolic area s8Zlq)1ed is
much more recent, and lies adJacent to the Chain ot Craters Road
between Aloi and Alae pit craters on Kilauea's east rift zone
(83 tumaro1e in Figure 1). This region has had active steaming
vents tor some time, but after a small eruption in December, 1965,
covered portions ot the area, sultur began depositing around many
ot the vents, indicating a more interesting site tor gas sampling.

II. Experimental
A. Sampling
1. Gas collecting tubes
The gas collecting tubes used in this investigation were
, 'bued on the vacuum sampling tubes developed by Naughton
et al. 40 The main teature ot their design was the inclusion
ot an adsorbent, silica gel, which prevented the reactive
gases, H2S and 802 in particular, tram interacting with each
other. As shown by' them, the silica gel acts like a chrana
tographic column, adsorbing and separating the acid gases and
water vapor (CO2, ~S, 802 and ~O in that order). The present
torm ot the tube is shown (not to scale) in Figure 2, as it
appears just prior to evacuation. A description ot the con
struction ot these sampling tubes tollows; the numbers in
parentheses correspond to those in Figure 2. Pyrex glass
tUbing vas used in constructing the tubes, employing con
ventional glassblowing techniques. A 60 CDl. length ot 10 mm.
O.D. (outside diameter) tubing (4) was joined to a 15 CDl.
length ot 17 mm. O.D. tUbing (6) to torm the main body ot the
sampling tube. To the opposite end ot (6) vas added a break
seal. (8), 10 mm. O.D., to allow transter ot the gas sample
to the analyzing sY'stem. A side-arm (7) vas attached for
evacuating the sampling tube. it was constricted at its base
so it could be more easilJ sealed. The indentations at (2)
and (3) were made and a plug ot glass wool was pushed into
pasition at (5). Section (4) vas then tilled vith about

Detail of sampling tip withpull-off wire attached
~hSide-arm for tubeevacuation during bake-out
(2)Indentation for
sealing tube
Collecting tip with
protective glass bulb
(1)
40-60 mesh with silica ger
(absorbs C~, H~, S~, and H20)
(4)(6)
(7)
Free volume for
non-absorbed gases
(H2 ,02'~' CO, CH.,andrare gases)
Break-seal
and protectivecork
(8)
Figure 2. Silica Gel Gas Sampling Tube
V1f\)

53
20 grams ot 40 to 60 U.S. Standard mesh silica gel and a plug
ot glass wool vas placed in position at (3). The glass wool
plugs at (3) and (5) keep the silica gel in place. To
complete the construction ot the tube, a short section ot small
diameter glass tubing vas added at (1). This vas sof'tel1ed
and pulled into the desired hoolt-shar3 to torm the sampling
tip. The length ot the completed sampling tube vas about one
meter. A protective glass bulb vas fitted over this tragile
tip and butted-up against the end ot the sampling tube. It
vas held in place by' asbestos tape during bake-out and by
masking tape afterward. To remove all gases and vater absorbed
on the silica gel, thus "activating" it, the tube vas baked
out at approximate1¥ 3600 c vhile under vacuum. This step could
be completed in 2 or 3 hours, but vas usuaJ..1.y done overnight
tor convenience. The vacuum system consisted ot a manitold
capable ot handling eight sampling tubes, a dry ice-acetone
trap and a high vacuum. rotary oil pump. The sampling tubes
vere removed trom this system under vacuum by sealing the
side-arm (7) at its base.
The silica gel used in the sampling tubes vas ot
"Chromatographic grade" (Micro-Tek Instruments, Inc., Baton
Rouge. Louisiana). Betore using it in the sampling tubes,
the sU'.ca gel vas heated in a Pyrex tube which vas swept
vith oxygen. This treatment vas a precautionary measure to
insure the removal ot any organic matter that might have been
adsorbed on the silica gel. The same pretreatment vas applied

to the glass wool used in the sampling tubes.
When the silica gel from used sample tubes was examined
for suspected adsorbed volatiles (iron compounds, for ex
ample) not removed during the gas analysis (see Section
II-B-4), an additional pretreatment of this silica gel
was required to remove the large background amounts of
iron found on the commercially available product. For this
purpose, the silica gel was placed in a vertical glass tube
and washed with a dilute hydrochloric acid solution until
iron was no longer found in the effluent by standard spot
tests. The column was then flushed with distilled, de
ionized water until a negative chlorine spot test with
AgN03 was obtained. Later in this investigation, a dilute
perchloric acid solution was used for this prewashing, as
the hydrochloric acid left a high chloride ion background,
which was not easily washed-out by the water elution.
The perchloric acid was flushed from the silica gel column
with distilled, deionized water until a Dp.utral eluate was
obtained.
The sampling environment of the lava lake drill holes
resulted in slight alterations to the design of the
collecting tube just described. Temperatures in these
holes varied from ambient to 1000°0 and the sampling range
was usually between 4000 and 900°0. To protect the evacuated
55
sampling tubes and retain the adsorption feature of the
silica gel in them, it was necessary to insulate them from
this high temperature environment. This was done by
placing the sampling tube inside a protective jacket or
shield, and filling the annular space with crushed fire
brick (Johns-Manville and Company). Originally the jackets
were made from steel conduit, but these were replaced with
quartz shields to prevent reactions with the hot gases
present in the drill holes. The quartz shields were made
in two foot sections of heavy-wall, vitrious silica tubing
(Thermal American Fused Quartz Company), and were closed
on one end, except for two small holes, through which a
chromel wire loop was fastened to secure the lowering cable.
The other end was constricted slightly to help contain
the insulation material. Because of this constriction, it
was necessary to limit the diameter of the sampling tube
to 10 mm. The diameter of the quartz shields was reatricted
to 2.5 em.; the next larger size would not fit into the
approxir.m.tely 3 em. diameter drill holes. The one meter
length of the sampling tubes was reduced to about 55 em.,
maintaining the same scale of the various sections. This
resulted in a drill hole sampling device (tube and shield)
of about 60 em., which was a less awkward size to work
with in the drill holes.

When the firebrick insulation had been packed around
the inner tube and thoroughly tamped-down, 1t vas covered
with a plug of moistened asbestos paper. The sampling tip
of the collecting tube vas allowed to protrude beyond the
lower end of the quartz shield. Partial protection of
the tip from heat vas provided by quartz wool packed
around its base. The completed drill hole sampling ap
paratus is shown in a cutaway viev in Figure 3. The break
off wire is packed inside the shield at the same time as
the inner sampling tube, but is only attached to the tip
Just prior to lowering the apparatus into a drill hole.
2. Sa.mpling techniques
During the course of this investigation, gas samples
were collected from five different sites at Kilauea Vol
cano. A general description and history of them has been
given in a previous section.
At Sulfur Bank all samples were collected from a
small hole in a pipe attached to the manifold connecting
the three holes drilled by Jagger in 1922.31 A sample
vas collected by pushing the evacuated tube into this
hole until the tip touched the back wall of the pipe (a
distance of about 15 em.). The tip vas then pulled
off with a wire loop attached to the tip prior to
inserting the tube into the hole (see detail of

51
111-60-LoweringBreak-off-~H cablepull wi re
+1--- Quartz tube
-----------------------
~- ---
- --------.... -- -- -- ----
i. vEvacuated sampleI~ tube with absorbant~:tl
~1.1fH~-=--_The~ma_1 ~Sulation
---- ---..-
~\'
- --
--------
-- ------------------
Break-off-- tip and wire-- ~ - ~-
-
------ - --- --- - -
-- -
~------
-~IIi-----~......-------
-- - ~--~ if.~ ~
--- -
Figure 3. Drill Hole Gas Sampling Device

58
Figure 2. The pull-off wire and loop was made from a piece
of nickel-chromium wire slightly longer than the sampling tube.
Atter 15 minutes the tube vas sealed-off with a gas-oxygen
torch. In the present design of the collecting tube, which is
the one shown in Figure 2, it is possible to seal the tube
without removing the tip from the vent, because of the slightly
extended sampling end and the constriction at (2). Most of
the samples reported in this work were collected before this
change in design vas made, and were sealed after removing the
tube from the gas source. In this case it was helpful to use
a glass rod to pull off the tip when it vas softened by the
torch, thus effecting a good seal.
The other low temperature sampling sites included in this
study were the fumarole on the east rim of Kilauea Caldera
(S2 fumarole) and the steaming area between Aloi and Alae pit
craters on the east rift zone of Kilauea Volcano (S3 fumarole).
These were sampled by the same techniques used at Sulfur Bank.
The vents chosen for sampling were small cracks or holes in
these areas, the edges ot which were coated vith sulfur
crystals.
Samples vere collected at two periods during the tormation
of the lava lake in Makaopuhi pit crater. The same general
technique used at Sulfur Bank was followed, but some altera
tions vere necessary due to the conditions at that time. All
samples were taken at the edge of the lake from cracks in the
crusting surface or f'-oC:! holes made in fresh lava "squeeze-outs"

59
as shown in Figure 4. The holes were made by ceramic combus
tion tubes used to pull-out samples of the still molten, but
very viscous lava. The wire pull-off technique for opening
the tubes had not been developed at the time these collections
were made. Instead, the tubes were opened by crushing the
fragile tip against wall of the crack or hole. Because of the
great heat radiating from the lake surface, it was not possible
to hold sample tubes in place for more than about 10 seconds.
Sealing of the tubes was sometimes accomplished by holding the
opened tip against the wall of the hole until it softened and
collapsed. These were usually not good seals as they were a
combination of lava and glass, and cracked easily. If the
vents were not hot enough for this type of seal, a closed-end
teflon tube was slipped over the tip to plug it. All of these
tubes were sealed later at the Volcano Observatory by gas
oxygen torch.
Special sampling techniques were necessary for collecting
gas samples from the drill holes in Alae and Makaopuhi lava
lakes. As described previously, the high temperatures en
countered required an insulated sampling tube. Since it was
of interest to obtain samples from any level in a particular
hole, it was necessary to suspend the tube by a cable so it
could be lowered to the desired depth. For this purpose a
woven-wire, stainless steel cable was attached to the quartz
shield o~ the sampling tube by means of stainless steel
fittingr! and the chromel wire at the top of the shield. Depth

Silicagel Gas Sampiino Tube
Momentary Hole left by withdrawalof Ceramic Lava Sampling Tube
Figure 4. Gas Sampling Technique at Makaopuhi Lava Lake SUrface
0\o

61
and temperature data for each drill hole ,rna supplied by the
staff of the Hawaiian Volcano Observatory.
To collect a sample, the drill hole tube was first
attached to the lowering cable. The 'Pull-off wire packed in
the thermal insulation was worked back and forth to insure
freedom of movement when the tip was to be pulled-off. The
loop of the pull-off wire was then hooked on to the sampling
tip and an extension, the same length as the lowering cable
was attached to the upper end of this wire. Being careful not
to put any strain on the pull-off wire, the assembly was
lowered rapidly to the desired depth, where the tip was pulled
off. The length of time which the sampling apparatus could be
left in a hole at lOOOoC without the inner tube and its ad
sorbent exceeding lOOoC was determined from laboratory experi
ments to be one minute. Sampling at any depth in the drill
holes was therefore confined to a one minute period. At this
point the tube wa.s pulled-out and the tip sealed with a gas
oxygen torch and returned to the laboratory for an~sis.
B. The Gas Analysis System
1. Description of the extra.ction and measuring system
. The gas samples were analyzed on the system shown in
Figures 5 and 6. In the following discussion, the letters
enclosed in Parentheses r~fer to corresponding letters in
these diagrams.
The extraction and measurement Bystem (Figure 5) was used
to remove the gas sample from the collecting tubes, perform a
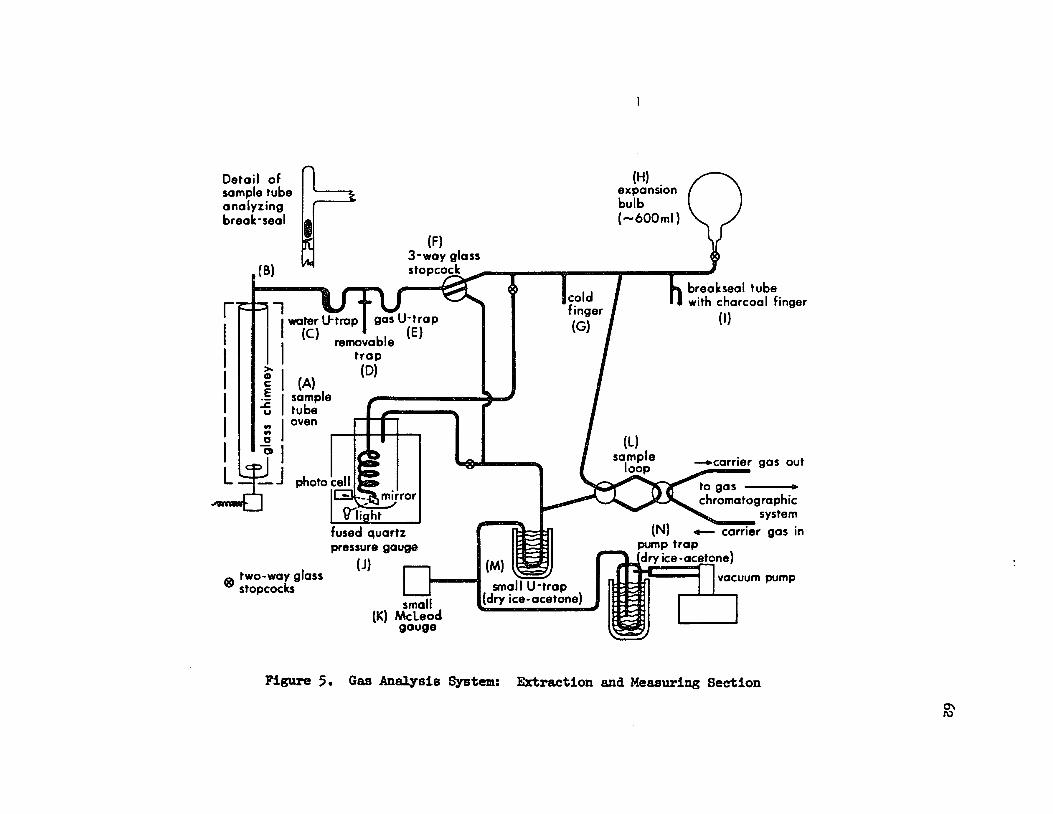
-carrier gas out
breokseal tubewith charcoal finger
(I)
to gas •chromatographic" system
(N) 4-- carrier gas inpump trapdry ice-acetone)Ii n
(H)expansionbulb(-600ml)
(M)
I I small U-trap(dry ice-acetone)small
(K) Mcleodgauge
(B)
-, - ~Iwater U-trap I gas U-trap(C) bl (E)
Iremova e
trap
~ I (A) (0)~ I sample J '] ,u tube; Ioven
c.1_J
~ two-way glassstopcocks
Detail ofsample tubeanalyzingbreak-seal
Figure 5. Gas Analysis System: Extraction and Measuring Section
C'\ro

electrometer
powersupply~
o( ) flame ionizationQ detector trace
I ther .I(T) detector trace
(W)
,,- ..~ :~I~~I~~~~;:~ carrier gas(V) plus sampleJ thermal conductivity
detector block & oven
(P)silica gel column & oven,=1
IIII
I (5) IIPerkin-1
v,Elmer I.-J6-way
gas valvel
indicating
I~III
carrier hydrogenm=flow line air~ meter pump- (Y) (Z)
\'':'~ pressure hydrogenregulator generator
II
(R)injection Iport
heliumtank
(0) Imolecular sievecolumn & ovenI
Figure 6. Gas Analysis System: Gas Chromatographic System
C7\W

64
preliminary separation of the gases, and determine the pressure
and volume of the gases. A metal break-off bar (detail of
Figure 5), which was used to open the sample tube, was Jacketed
with glass to avoid any gas-metal reactions. Gases adsorbed
on the sample tubes silica gel (C02 , H2S, S02 and H20) were
desorbed by gradually heating the sample tube in an oven (A)
to a maximum of 300°C. As these gases came off the silica gel
they were collected in traps, the H20 at (C) in a trap cooled,
with dry-ice acetone and the other gases (C02 H2S, S02) at (E)
in a trap cooled with liquid N2 • The water U-trap (C) was made
large purposely on the sample tube side to prevent clogging with
the condensed water (ice). Durin~ the extraction of the con
densable gases, it vas necessary to heat that portion of the
system between (A) and (C) by wrap~ing with a heating tape.
This prevented premature condensation of H20 which seemed to
act as a catalyst for the reaction:
2H2S + S02 = 3S + 2H20
depositing a sulfur film on the glass wall of the system. Un
fortunately, this reaction could not be prevented entirely by
this means. When these gases were present in high concentra
tions (as in Sulfur Bank. samples, for example), a sulfur film
formed around the top of the frozen water in the U-trap (C).
In such cases this film was oxidized at a later stage in the
analysis and analyzed as S02. During the calculations, pro
portional amounts of H2S and S02 were determined trom this
"extra" 802 and added to the H2S and S02 concentrations found

65
in the gas U-trap (E). It should be noted, however, that this
"reacted" H28 and 802 represented only a small portion of the
total concentration of these two gases found in such samples.
A removable trap (D) was attached to the system by means
of a ball and Bocket joint. The condensed water collected in
the U-trap at (C) and was transferred to the removable trap
t"or weighing.
A three-~ stopcock at (F) served to connect or isolate
the extraction system to the lett of it and the measuring
system to the right, and provided the extraction system with
a direct connection to the vacuum pump.
In the measuring portion of the system (Figure 5) a cold
finger (G) was utilized for transferring gases to this section
and a breakseal tube (I) provided a means of collecting por
tions of the gas sample for further analysis by mass spect
rometry. The expansion bulb (it) was used to determine the
volume in the system that the permanent gases (He, H2, Ar,
02' N2, CH4 and CO) filled when they were released from the
sample tube (the volume in which the pressure of these gases
was measured). It was necessary to determine this volume
for each sample since the volume of each sample tube and the
tubing connecting it to the system at (B) was different. This
problem did not exist with the condensable ~as, which were
pulled over to the cold finger (G) by means of liquid N2 and
expanded into the known volume of the measuring system. It'

66
the pressure was greater than one atmosphere the condensable
gases were expanded f'urther by' using the expansion bulb.
Pressures were measured by' a fused quartz precision
pressure gauge (J) manufactured by' Texas Instruments,
Incorporated, Houston, Texas (Model Number 140). This unit
consisted of a quartz Bourdon tube contained in a capsule and
an optical readout system. The capsule was attached to the
vacuum system so that both it and the Bourdon tube could be
evacuated and the readout unit zeroed. In this ~ pressure
readings were independent of changes in atmospheric pressure.
The capsule was designed for a range of zero (10-3 mm. of Hg)
to one atmosphere, and was calibrated by the manutacturer.
The pumping system used a two-stage mechanical vacuum
pump (Welch Duo-Seal) capable of producing a vacuum ot 0.1
micron, separated trom the system by dry ice-acetone cooled
trap (N). A small McLeod gauge (K) was used to determine
when the system or a particular part of the system was pumped
down to the limit ot the pump. Mercury vapor :from this gauge
was kept trom ditfusing into the system by' the U-trap (M)
cooled with a dry ice-acetone mixture.
Samples were introduced into the gas chromatographic
system by means ot a sample loop (L) tormed with two four-Y~
stopcocks. A single bore plug was necessary for the stopcock
on the measuring system side ot the loop to control access
of the measuring system and the loop to the vacuum pump. The

67
sample loop stopcocks are shown in the position for filling
the loop in Figure 5. They have been turned, in Figure 6 (L),
to the position for sweeping the sample from the loop into the
gas chromatographic system by the carrier gas.
2. Description of the gas chromatographic system
The separation and determination of the individual
gases in each sample was performed by means of the gas chroma
tographic system shown in Figure 6. Gas chromatography is a
procedure that separates a gaseous mixture by passing a
moving gas phase over a stationary adsorbent. The gas phase
consists of a non-absorbed carrier gas plus the sample. The
technique is called gas-liquid chromatography (GLC) when the
stationary phase is a non-volatile liquid distributed over an
inert solid phase, and gas-solid chromatography (GSC) when the
adsorbent is a solid with surface active properties. The
latter technique vas used in this work.
The permanent gases vere separated on a molecular sieves
5A column (0). The column vas constructed from a six foot
section of aluminum tubing one-quarter inch in outside
diameter, and was filled vith 60-80 u.S. Standard mesh
molecular sieves number 5A. The column was activated by
heating at a temperature of 3600 c tor at least two hours
while passing a stream ot He gas through it. Whenever the
separating ability of this column deteriorated, it was re
activated by means ot an oven (0). During an analysis the
oven chamber insulated the column against variable air

68
currents, but vas not used to operate the column at an elevated
temperature. The vorking temperatures used with the molecular
sieves column vere -780C and room temperature. At -780c and
with Ar as the carrier gas, separation vas achieved tor He and
H2 among the permanent gases. At this same temperature, but
with He carrier gas, Ar and O2 vere separated. Low temperature
operation vas achieved by placing the column in a Dewar tlask
ot dry ice-acetone • At room tempel"ature the column separated
H2 (+He), O2 (+Ar), N2, CH4 and CO in that order with He as
the carrier gas. The carrier gas tlow rate tor each case vas
40 ca. per minute. The use ot molecular sieves 5A colUlD!lS
under these temperature conditions to achieve these separations
has been described in the literature.70
Condensable gas were separated in a 2 teet by 1/4 inch out-
side diameter aluminum column tilled with 80-100 U.S. Standard
mesh silica gel. Activation ot the silica gel vas achieved by
heating it to about 3000C tor several hours vhile purging with
He. The column (p) vas nul at 1000C, with He as carrier gas
at a tlow rate ot 40 cc. per minute, and would separate gases
in the tollowing order: air (composite peak), CO2 , COO, H2S,
082 and S02. Hodges and Matson71 reported this separation tor
this column in 1965. Either this column or the molecular
sieve column, but not both at the same time, could be switched
into the carrier gas nov-stream by means ot a six-~ gas
sampling valve (Perkin-Elmer Corporation, Norwalk, Connecticut)
adapted tor this purpose (S).

69
The concentration of the separated gas canponents in the
column effluent vas measured vith a thermal conductivity
detector (V) manufactured by the Gov-Mac Instrument Cc:mpany,
Madison, Nev Jersey (Model 9234 - Hot Wire Detector). A home
made transistorized D.C. power unit supplied the detector
voltage. The detector current vas set at 200 milliamperes
when He vas used as the carrier gas and at 170 milliamperes
vith Ar carrier gas, and it was operated at 100oC. A thermal
conductivity cell operates by comparing the conductivity of
the pure carrier gas in the reference chamber to that of the
carrier gas plus sample in the sample chamber. This results
in an out ot balance potential in a Wheatstone bridge circuit,
vhich is used to produce a chromatogram. on a potentiometric
recurder (T). A Wheelco Series 8000 recorder, vith a chart
speed of 3 minutes per inch and a full scale deflection of
1 millivolt, was used with the thermal conductivity detector
(Barber-Colman Company, Rocktord, Illinois). A polarity
svitch was provided to reverse the output signal f'r0ll1 this
detector when Ar carrier gas vas used, so that positive peaks
vere obtained tor He and H2, which have greater thermal con
ductivities than Ar.
When the molecular sieves column was run at room tempera
ture or when the silica gel column vas used, a flame-ionization
detector (U) was attached t,o the effluent vent of the thermal
conductivity cell, to determine CH4 and search for other
organic gases in the sample. The flame-ionization detector,

70
which is extremely sensitive to these compounds. produces an
electric current. due to the release ot electrons and negative
ions vhen organic matter is burned in the hydrogen tlame of the
detector. The current is amplified by an electrometer and
applied to a strip-chart recorder to produce the chromatogram
(Q). A Wilkens Flame Ionization Detector (Varian-Aerograph.
Walnut Creek. California) was used in conjunction with that
comp~'s Model 650 Hydrogen Generator (Z). The recorder (Q)
vas a Honeywell Electronik 19 single pen lab recorder (Honey
well. Philadelphia. Pennsylvania) operated at one millivolt
tun scale and with a chart speed of one-half inob per minute.
The carrier gases. He and Ar. were used directly trom the
tanks. except for passing them over two drying agents (W).
indicating silica gel and Aquasorb (Malllnckrodt Chemical
Works. New York). A three-WBiY stopcock (X) allowed one to
select the desired carrier gas. Tank pressure for the carrier
gases vas set at 40 p.s .i •• and column head pressure vas
varied between 5 to 12 p.s .i •• depending on the column and
column temperature being used. The pressure regulator at
(Y) controlled the column head pressure and flow rate. Flow
rate vas measured vith a soap-bubble flow meter placed at
the detector effluent vents.
The column and detector operating conditions are
summarized in Table I along with the column retention times
and the thermal conductivities (where available) tor each
gas.

TABLE I 71
PARAMETERS OF THE GAS CHROMATOGRAPHIC SYSTEM
Thermal'Retention conductivity.time. cal./cm.S8C./deg. Column
Gas minutes (100°C) Parameters~ Detectors
He 1.4 39.8 MoJ.eeular Themal.H
~ 1.8 49.9 sieves conductivity5A
-78°c(170 m. amps)
Ar carriergas
Ar 10.5 5.1 Molecular ThermalO2 14.5 7.4 sieves conductivity
5A (200 m. amps)-78°C
He carriergas
H2(+He) 1.5 49.9 Molecular Thermal°2(+Ar) 3.1 7.4 sieves conductivityN2 7.0 7.2 5A (200 m. amps)CH4 10.6 7.2- ambie:lt flameCO 35 5.4- temperature ionization
air 0.8 7.5 silica gel ThermalCO2 1.7 5.1 100°C conductivity(COS) 3.5 He carrier (200 m. amps)
~2)4.1 3.0· gas flame
13.1 3.7* ionization802 16.3 2.0·
I Abstracted trom Jeffery and Kipping. 72*Avai1ab1e~ for OOC.
**Thermal conductivity detector run at 100°C."Carrier gas flow rate alwa.Ys set at 40 cc./min.

72
The detectors were calibrated by a syringe injection
technique developed by Je~ery and Kipping72 using a by-pass
syringe valve (R) of their design. Their method combines the
advantages of sample loop inJection with the speed and
simplicity of syringe injection. The four-vq stopcock of
the valve vas turned so that carrier gas vould tlush the
small sample loop. It vas then returned to the position shown
in Figure 6. The high pressure ot the carrier gas trapped in
the loop vas equalized to atmospheric pressure to make sample
injection easier. This vas done by inserting an empty, gas
tight syringe, and allowing the barrel of the syringe to be
pushed-out until the pressure vas equalized. A calibration
gas sample vas then inJected into the loop using a gas-tight
syringe with a Chaney adaptor (Hamilton CompaDY, Whittier,
Calitornia) vhich was possible vithout the high back pressure
of the carrier g&8. This sample vas then swept into the gas
stream by' opening the 4-vq stopcock.
Air was used tor the 02 and '2 calibration and the re
maining gases came trom caamercial gas cylinders or lecture
bottles. A glass bulb vith stopcocks on either end and an
inJection port in between was tlushed and tilled with a sample
tram a cylinder. and calibration samples vere removed trom the
bulb vith the gas tight syringe by VtV ot the in3ection port.
When Ar and He were included in the gas analysis scheme, these
gases were calibrated by introducing them into the measuring
system at (D) and rnnn1 ng aliquots into the gas chromatograph

73
via the sample loop (K). Calibration curves for each gas vere
constructed by plotting peak area versus the number of moles
injected into the system.
3. Operating procedure
An outline of the procedure tor analyzing a gas sample on
this system follows. The sample tube was usual~ attaehed to
the SYstem (B) the evening before a run vas to be made, and
the system in Figure 5 pwnped-out overnight. The molecular
sieves column (0) vas also purged overnight with Ar carrier
gas with a Dewar flask 01' dry ice-acetone cooling the column.
a. All. stopcocks were o-losed and dry lce-aaetone was
placed on the H20 U-trap (C) and liquid N2 on the traps
at (D) and (E).
b. The sample was opened and the pressure 01' the permanent
gases measured.
c. The permanent gases were pumped tram the extraction
system and heating of the sample tube was started.
d. H2 and He were determined in the permanent gases with
the molecular sieves column (0) at -78°c and Ar carrier
gas.
e. The carrier gas was changed to He. and Ar and 02 in the
permanent gases vere determined on the molecular sieves
column still at -780 c.
t. The molecular sieve column vas warmed to room tempera
ture and the tlame-ionization detector (U) vas attached to
the eftluent vent ot the thermal conductivity detector (V).

74
g. The remaining permanent gases (02 , N2 , CH4 and CO) vere
analyzed on the molecular sieves column at roan temperature
with He as carrier gas.
h. If a sample of the carrier gas was to be saved for
fUrther analysis , it was tro.pped. and sealed in the break
seal tube (I).
i. The permanent gases vere pumped trom the measuring
system.
J. The condensable fraction was transferred trom traps (D)
and (E) to the cold finger (G).
k. The silica gel (p) column was switched (S) into the gas
flow, replacing the molecular sieves column.
1. The condensable gases vere expanded in the measuring
system and into the expansion bulb (H) if necessary.
m. The pressure of the condensable gas was determined.
n. These gases (C02, ~S and 802) were analyzed with He
carrier gas on the silica gel column (p).
o. The water in trap (C) was transferred to the removable
trap (D) and weighed.
p. If the condensable gases were to be saved tor turther
analysis, they vere collected in a breakseal tube at (D).
q. The volume, in which the permanent gas pressure was
measured, was determined.
r. If a sulfur film had formed in the Vater U-trap (0),
it vas oxidized and the 602 tormed an~zed on the silica
gel column.

15
Steps q and r vere usually carried out on the day folloving
an analysis. At least two aliquots vere necessary for eaoh
run (steps d, e, g and b) in order to correct for bad guesses
on the attenuation of the signals to the recorders.
4. Analysis of the volatiles on the sampling tube silica gel
Atter the completion of the gas analysis, the gas sampling
tubes vere removed from the system for elution analysis of
volatiles that were not desorbed from the silica gel during the
gas analysis. The top and the tip of the sampling tubes were
broken-off and a separatory funnel containing the eluting
solution was attached to the top with a short piece of Tygon
plastic tUbing. Both were mounted on a rack in a vertical
position, with the separatory funnel above the sampling tube •
.An Erlenmyer flask was placed beneath the tip of the sampling
tube to receive the effluent.
Elution was by gravity, and the first washing vas with
100 ml. of methanol which removed iron. If iron was found by
spot test (~OH • Hel and o-phenanthroline) in the last
0.5 ml. of effluent from this washing, an additional 50 ml.
of methanol were passed through the silica gel. This vas re
peated until the test for iron was negative.
The silica gel vas then eluted with 250 ml. of distilled,
deionized water. The calcium, hydrogen, chloride, and
ammon1 um ion concentrations in the effluent from this step
vere determined trom different aliquots of that solution.
Sulfate ion was determined only quailtatively at this time.

76
The methods of analysis were based on procedures reported
in the literature. Iron vas determined colorimetrically vith
73o-phenanthrol1ne according to SandeJ.1. The photometric
method of zan !l !!. ,74 using mercuric thiocyanate. vas
adapted for the analysis of chlorine. A photometric method
voo also used for the ammonium ion analysis, based on the
formation of a blue color vhen an ammonium solution is treated
vith phenol and sodium bn>och1orite. 75 Calcium was determined
by titration with ethylene diWDine tetracetic acid (EDTA) after
the method of Brown and Sallee.76
C. Sublimate Collection and Analysis
1. Sampling technique
'lYo devices were designed and used to scrape sublimates
from the walls of the drill holes at different depths. The
first type consisted of a long steel tube with two slots at
the bottom end along the wall ot the tubing. From these
slots. strips ot spring steel would extrude when a rod inside
the tube was pushed against them :from the other end of the
tube. The extruded springs would then scrape against the
valls of the drill hole, knocking loose bits ot sublimate.
which would fall into the tUbing. The pressure on the
springs vas released and the tube pulled into the hole. A
steel plug. held by screws in the slotted end of the tube
vas removed and the sample taken out.
The second type ot sublimate collector vas made from four
foot lengths of stainless steel rod which could be connected

TI
together to any multiple lengths ot tour teet. Tvo sampling
end pieces were used on these rods. The first. which was
constructed tram tvo one-halt inch tapered reamers was used
to punch a hole or make a bigger hole (at least one-halt inch
by one inch) through the sublimate formation in the drill hole.
The rod vas then pulled trom the hole and this end piece re
placed with the second one.
The second or collecting end piece consisted ot two
cylinders. 7/16 of an inch in diameter tormed by drilling two
holes in one piece of stainless steel. The horizontal dimen
sions ot this end piece vere the same as those ot the reamer.
one-halt inch by one inch. The cylinders vere closed on the
bottom by a plate held by screws.
Sampling was achieved by pushing these cylinders through
the hole opened in the sublimate by the reamer. The rod vas
then turned 90 degrees and pulled-up through the sublimate
collecting the sample in the cylinders. The rod was then
pulled tram the hole, the plate on the bottom of the cylinders
removed, and the sample pushed into a collecting bottle and
returned to the laboratory tor ana:b'sis.
Sublimate samples vere collected with these tvo devices
by the author and Dr. I. L. Barnes, who designed the :first
collector. and Dr. Reiner Goguel. the designer ot the second
collector (both ot the staff ot the Un!verBity ot Hawaii).

78
2. Extraction and analysis techniques
The extraction and analysis ot the sublimate samples col
lected were performed by Dr. Reiner GoguelTI using a scheme
dtlv1sed by him. A briet abstract ot his techniques is given
here.
Three solvents, acetone, methanol and water, were used to
separate the samples into tractions by extraction. The ex
traction was done oy shaking the sample with three, 20 ml.
portions of a particular solvent. Acetone was used to
separate the halides of poJ¥valent cations from the halides
of the alkali metals. Since the samples contained very large
amounts of caS04' and methanol does not dissolve great amounts
of this compound, it was easier to tell from the balance ot
cations and anions in the acetone and methanol fractions, if
cations had been overlooked. If there were excess cations,
sUlfate was expected as the anion. The difference was there
fore ca.:ued sulfate.
The extracted solutions vere dried at room temperature in
a dessicator above :magnesium perchlorate. The dry residue vas
dissolved in 25 ml. of O.2N ~S04 and extracted with vater.
This was followed by an extraction with 100 ml. of 10 percent
Ne.CJ. solution, with four hours ot shakinEh to remove all CaB04.
The insoluble residue vas investigated separatJel¥ by x-rq
diffraction techniques and differential thermometrical analysis
techniques.

79
The acetone, methanol, and water tractions were analyzed
for Cu, Zn, Fe, Mn, Mg, Ca., Na, K, and Rb by atomic adsorption
spectroscopy.
A potentiometric titration with 0.01 N ceric sulfate was
used to determine Fe (II), which was found in the acetone
traction of two of the samples.

III. Results and Discussion
A. Introduction
The results ot the an~ses ot the gas samples collected f'ram
the various gas sources investigated have been summarized in
Tables II and III. Two compositions are given tor each sample.
The first lists the actual composition ot gases tound in the
sample tubes, and the second the air tree composition ot the
sample. The latter vas determined by subtracting all 02 and N2 ,
and corresponding amounts ot the other atmospheric gases (CO2 ,
Ar, He + Ne, and H2) based on the amount ot N2 tound and their
N2 ratio in air. The computer program in Appendix I illustrates
the necessary calculations. The tables also include the mole
percent ot air in each sample II vhich vas determined by adding
together the portions ot gas subtracted to malte the air tree
corrections. This percentage ot air provides a simple basis tor
judging whether or not the sample is any good. The less air con
tamination in a sample, the less chance tor alteration ot the gas
composition by air oxidation; thus a better sample. Samples which
were ~zed on a loy temperature collDDD to obtain a separation
ot H2 tram He and 02 trom Ar are 150 noted, as are those in vhich a
partial separation ot He and H2 vas obtained at room temperature.
For all other samples. the 02 concentration actu.allJ represents
(°2 + Ar) and the ~ percentage represents (H2 + He). The tempera
tures given in the tables were provided through the courtesy ot the
start ot the U.S. Geological Survey, Hmraiian Volcano Observatory.

TABLE II
ABALYSES OF MAKAOPUHI LAVA LAKE SAMPIJ!:S
PART A - Surh.ce Samples- Concentration, Moles Percent
Semple Do.and Date ~O He ~ Ar O2 N2 CH4 CO2 ¥ 802 Air
2141 9.39 - 0.023 - 20.36 73.31 0.0004 0.178 - - 94.573/1/65 98.19 - 0.24 - - - 0.002 1.51 - - I
28-M 11.18 0.023+ 0.003 - 15.89 68.00 - 0.18 0.63 0.63 84.133/i/65 81.65 0.15 0.019 - - - - 1.15 4.72 6.31 H
29-M 4.95 - 0.047 - 22.30 73.80 -- 0.095 - -- 97.013/1/65 97.15 - 0.92 - - - - 1.33 - - ,~ 16.71 _tJ - 0.71~ 10.22 57.15 - 1.38 - 12.30 68.073/7/65 54.96 - - 0.11 -- - - 4.48 - 40.45 ,36-M 18.19 0.0019rJ - 0.6~ 15.86 66.78 - 0.16 - 0.35 83.463/14/65 97.39 0.00003 - - - - 0.72 - 1.89 II
31-M 31.25 0.00007" 0.0012 0.7£i1' 12.08 65.74 - 0.34 - 1.73 18.. 633/14/65 93.86 - 0.0035 - -- - - 0.94 - 5.20 ,38-14 31.11 - 0.0043 - 13.96 44.96 - 0.21 - 1.50 59.473/14/65 95.62 - 0.011 - - - - 0.49 - 3.89 ,-SUrface temperature, 1l00o-12000 C.ICorrected to "air tree" conditiona by' subtracting O2 and N2 and equivalent amounts ot other
(»air gases based on N2 atmospheric ratios. ~
fLow temperature (-78OC) column used to separate He tram ~ and Ar tram 02.+Partial separation of He trail H2 obtained at room tempera ure.

TABLE II
ABALYSES OF MAKAOPUHI LAVA LAKE SAMPLES
PART B - Drill Hole Samples Concentration, Moles Percent
Sample Ho. Depth-ft.and Date (Temp. )
(Oe) ~O He ~ Ar O2 li2 CH4 CO2 ~8 802 Air
50-MD9 9 96 0 48 - - - 0.67 2.64 - 0.021 0.044 0.017 3.346/18/65 (95()O) 99.92 - - - - - - 0.021 0.046 0.017 ,54-HD8 1.5 68.14 0.0007" 0.056 0.33'1- 1.36 31.65 - 0.21 - 0.035 33.406/18/65 (1600) 99.49 - 0.081 - - - -- 0.38 - 0.051 /I
55-MD10 1.5 38.19 - - - 8.61 55.71 - 0.14 - 0.18 65.016/18/65 (160°) 99.25 -- - - - - - 0.30 - 0.45 ,63-MDll 5 28.12 - - - 14.76 53.52 - 0.077 - -- 68.957/20/65 (500°) 99.80 - - - - - - 0.201 - - ,64-MDll 7 80.75 - 0.042 - 4.58 15.03 - 0.21 - - 19.807/20/65 (6000) 99.69 - 0.052 - - - - 0.26 - - 1/
66-MDll 5 26.32 - - - J.1.43 60.87 - 0.068 - - 73.051/20/65 (500°) 99.83 - - -- - - - 0.111 - - ,61-MDll 1 86.51 - - - 1.19 1.51 - 0.14 - - 8.851/20/65 (600°) 99.84 - - - - - - 0.16 - - I
69-MD8 4 98.00 - O.Oll - 0.04 1.62 - 0.020 - 0.33 1.681/21/65 (5000) 99.63 - O.Oll - - - - 0.020 -- 0.34 I
Q)I\)

TABLE II
ANALYSES OF MAKAOPUHI LAVA LAKE SAMPLES
PART B - Drill Bole Samples (Continued) Concentration, Moles Present
Sample Depth-ft.No. (Temp. )aDd Date (OC) ~O He ~ Ar O2 112 CH4 CO2 ~S 802 Air
71-MD8 9 90.81 - 0.16 - 1.50 6.96 0.002 0.032 - - 8.547/21/65 (900°) 99.79 i- 0.17 - - - 0.003 0.032 - - /I
I72-MDl4 11 61.99 - 1.92 -- 2.24 31.00 0.022 0.48 1.84 1.50 33.627/21/65 (9600) 91.50 - 2.84 - - - 0.032 0.69 2.72 2.20 I
73-MD14 5 93.89 - 0.027 - 0.27 5.81 0.0007 0.030 0.14 0.18 6.167/22/65 (600°) 99.59 - 0.029 - -- - 0.0007 0.030 0.15 0.28 I
74-MD14 8.5 77.20 - 0.81 -- 0.69 1.91 0.029 0.087 - 0.17 20.061/22/65 (850°) 98.53 - 1.12 -- - -- 0.037 0.102 - 0.22 I
15-MD16 7 ll.25 - 0.0006 - 20.59 71.72 -- 0.16 - - 93.197/22/65 (7500) 98.80 - 0.005 - - - - 1.20 -- - ,76-MD16 12 63.20 -- 1.09 - 1.48 31.40 0.047 0.12 - - 33.277/22/65 (ooסס1) 98.01 - 1.69 - - - 0.073 0.16 - - U
TI-MDll 1 97.43 - 0.051 - 0.35 1.75 - 0.026 0.080 0.31 2.1211/21/65 (500°) 99.52 - 0.052 - - - - 0.026 0.081 0.32 6
78-MDll 13.9 91.43 - 0.008 -- 0.39 1.91 0.0005 0.067 - - 2.3211/27/65 (81.0°) 99.92 - 0.008 - - - 0.0005 0.068 -- - I
():)w

TABLE II
ANALYSES OF MAKAOPUHI LAVA LAKE SAMPLES
PART B - Drill Hole Samples (Continued) Concentration, Moles Present
Sample Ro. Depth-f't.and Date (~.)
(OC H2O He H2 Ar O2 N2 CH4 CO2 ~S 802 Air
79-MD10 5 99.16 - 0.008 - 0.14 0.58 - 0.034 -- 0.017 0.7311/27/65 (3700) 99.94 - 0.008 - - - - 0.034 - 0.017 D
8O-MD10 8 60.50 - - - 9.88 35.13 -- 0.036 - -- 45.4411/27/65 (550°) 99.96 - - - - _. - 0.037 -- - I
8l-MD10 10.1 82.70 - - - 3.52 1l.93 - 0.030 - 0.15 15.5911/29/65 (7000) 98.78 - - - - -- - 0.031 -- 0.19 I
82-MD20 6 98.60 - 0.007 - 0.29 1.14 - 0.009 -- - 1.4511/29/65 (420°) 99.98 - 0.007 - - - - 0.009 - - I
83-MD20 14.5 96.52 - 0.15 - 0.56 2.62 0.0007 0.22 - - 3.2211/29/65 (9000) 99.62 - 0.15 - - -- 0.0007 0.22 - - ,86-MD2l 3 97.35 - 0.21 - 0.55 2.16 - 0.020 0.032 0.017 2.741/31/66 (150°) 99.72 - 0.21 - - - - 0.020 0.032 0.018 ,88-MD2l 10 94.46 - 0.22 - 1.16 ~.32 0.0004 0.020 0.055 0.046 5.531/31/66 (5600) 99.64 - 0.23 - - - 0.0004 0.019 0.058 O.O~ ,89-MD2l 13 93.69 - 0.29 - 5.36 1..24 0.0005 0.030 - 0.045 6.621/31/66 (720°) 99.62 - 0.30 - - - 0.0005 0.031 - 0.047 ,
()),f:"

TABLE II
ANALYSES OF MAKAOPUHI LAVA)LAKE SAMPLES
PART B - Drill Hole Samples (Continued) Concentration. Moles Present
Depth-ft.Sample Bo. (!remp.)and Date (Oe) ~O He ~ Ar O2 N2 CH4 CO2 ~S 802 Air
90-MD21 15 68.10 - - - 1.28 24.19 - 0.26 - - 31.111/31/66 (8100) 99.64 - - - - - - 0.36 - - D
91-MD20 3 98.13 - 0.011 - 0.07 1.61 0.00006 0.065 0.069 0.046 1.701/3]./66 (250°) 99.14 - 0.079 - - - 0.00006 0.066 0.071 0.041 H
92-MD20 7 91.66 - 0.048 - 0.29 1.94 - 0.028 - - 2.251/31/66 (450°) 99.92 - 0.049 - - -- - 0.027 - - I
93-MD20 10 96.50 - 0.062 - 0.65 2.81 0.0002 0.001 - - 3.561/31/66 (630°) 99.93 - 0.065 - -- - 0.0003 0.006 - - Ii
96-MDl4 3 98.23 - 0.012 -- 0~39 1.39 - 0.006 - - 1.802/1/66 (150°) 99.98 - 0.012 - - - - 0.006 - - I
91-MD16 8 97.42 - 0.006 - 0.57 2.12 - 0.018 - -- 2.122/1/66 (465°) 99.98 - 0.006 - - - - 0.018 - - IJ
98-MD23 10 91.15 - 0.15 - 0.33 1.65 0.0001 0.012 0.063 0.071 2.012/1/66 (619°) 99.90 - 0.15 - - - 0.0001 0.012 0.065 0.018 ,99-MD23 15 71.38 - - - 3.06 18.86 0.004 0.012 - 0.21 22.162/1/66 (840°) 99.51 - - - - - 0.006 0.015 - 0.27
())V1

TABLE II
ANALYSES OF MAKAOPUHI LAVA LAKE SAMPLES
PART B - Drill Hole Samples (Continued) Concentration, Moles Present
Depth-ft.SampJ.e Ho. (~.)and Date (Oe) ~O He ~ Ar O2 N2 CH4 ~ ¥ S02 Air
104-MD24 1 98.58 - 0.16 - 0.02 1.16 - 0.049 0.010 0.044 1.196/1/66 (mo) 99.14 -- 0.16 - - - ~ 0.049 0.011 0.045 ,108-MD24 14 94.91 -,,:1 0.20 0.058" 0.31 4.24 0.0001 0.021 - - 4.616/1/66 (683°) 99.15 - 0.22 0.008 - - 0.0008 0.021 - - fJ
115-MD22 4.5 80.28 0.003+ 0.016 - 1.54 18.13 - 0.36 - - 20.508/9/66 (2100 ) 99.54 0.003 0.020 - - - - 0.44 - -- I
116-MD22 5 85.80 - - - 0.34 12.95 - 0.023 - - 13.458/9/66 (21-,0) 99.98 - - - - - - 0.021 - -- I
llB-MD22 1.5 96.43 -- - - 0.10 3.64 - 0.012 - - 3.188/9/66 (2880) 99.99 - - - - - -- 0.011 - - fJ
'Corrected to "air tree" conditions by subtracting ~ and N2 and equivalent amounts ot other air gasesbased on 112 atmospheric ratios.
'how temperature (-1SOC) column used to separate He :from ~ and Ar tram ~.+Partial separation ot He tram ~ obtained at room temperature.
co0\

TABLE III
ANALYSES OF FUMAROLE SAMPLES
PART A - SUltur Bank Samples Concentration, Moles Percent
Sample lio.H~ He H2 Ar 02 N2 C~ H2S 802 Airand Date
4-81 84.24 - 0.0007 - 2.64 9.09 4.51 0.007 0.002 11.849/21/64 94.91 - 0.0008 - - - 5.08 0.008 0.002 1/
20-81 91.59 - 0.0005 - 0.012 0.36 6.39 - 0.010 0.382/3/65 93.46 - 0.0005 -- - - 6.53 - 0.010 #
33-81 92.76 - 0.00009 - 0.006 0.35 7.36 0.016 0.013 0.363/7/65 92.63 - 0.00009 - - - 7.34 0.016 0.012 /I
34-81 92.81 O.OOOOr 0.0002 - 0.002 0.12 5.67 0.025 0.064 0.133/7/65 94.16 0.00006 0.0002 - - - 5.75 0.025 0.065 II
43-81 94.23 - 0.00007 - 0.0008 0.011 6.09 0.085 0.~8 o.o~
6/17/65 93.68 - 0.00007 - - - 6.05 0.085 0.18 1/
60-81 93.38 - 0.0001 - 0.002 0.17 6.73 0.016 0.089 0.187/19/65 93.18 -- 0.0001 - - - 6.71 0.016 0.089 I
61-81 93.52 0.00004" 0.00004 - 0.0004 0.032 7.22 0.029 0.099 0.037/19/65 92.71 0.00004 0.00004 - - - 7.16 0.029 0.098 I
62-81 95.23 0.00001" 0.00002 - 0.001 0.078 4.99 0.032 0.10 0.087/19/65 94.90 0.00001 0.00002 - - -- 4.97 0.032 0.10 fI
84-51 92.47 - 0.00003 - 0.002 0.008 7.51 0.015 0.12 0.0111/29/65 92.31 - 0.00003 - - - 7.54 0.015 0.12 f/
85-81 92.72 - 0.00002 - - 0.002 7.65 0.029 0.16 0.00211/29/65 92.21 - 0.00002 - - - 7.61 0.029 0.15 ,
())~

TABLE III
ANALYSES OF FUMAROLE SAMPLES
PART A - Sulfur Bank Samples (Continued) Concentration, Moles Percent
Sample No.and Date ~O He H2 Ar 02 N2 CO2 H2S S02 Air
102-S1 91.07 -- 0.0003 --- 0.94 3.32 4.86 0.012 0.051 4.302/1/66 94.87 -- 0.0003 --- --- --- 5.07 0.012 0.054 /I
103-61 92.71 --- 0.00008 --- 0.0003 0.030 8.22 0.021 0.13 0.032/1/66 91.72 --- 0.00008 --- -- --- 8.13 0.021 0.13 II
109-S1 92.09 -- 0.00003 --- --- O.Oll 9.78 0.026 0.15 0.016/9/66 90.25 -- 0.00003 -- --- --- 9.58 0.025 0.14 If
llO-Sl 92.18 -- 0.0004 -- 0.0005 0.032 8.11 0.020 0.13 0.036/9/66 91.77 -- 0.0004 --- --- -- 8.08 0.020 0.13 If
ll9....s1 91.93 0.00004+ 0.00007 -- 0.0006 0.036 8.34 0.016 0.29 0.048/10/66 91.40 0.00004 0.00005 -- -- --- 8.30 0.016 0.29 fI
120-S1 91.81 0.00005+ 0.00004 --- 0.0008 0.046 8.26 0.016 0.26 0.058/10/66 91.50 0.00005 0.0004 --- --- --- 8.23 0.016 0.26 D
124-51 93.46 0.00004;1 0.00005 -_:# --- 0.006 7.78 0.016 0.21 0.012/3/67 92.ll 0.00004 0.00005 -- -- - 7.66 0.016 0.21 If
125-61 93.83 O.00004~ 0.00004 -_:# 0.001 0.082 6.76 0.012 O.ll 0.082/3/67 93.17 0.00004 0.00004 -- - -- 6.71 0.012 O.ll /I
126-S1 92.32 0.00003" 0.00003 --~ -- 0.006 8.84 0.020 0.24 0.012/3/67 91.03 0.00003 0.00003 8.71 0.020 0.24 D CD-- -- -- CD

TABLE ill
ANALYSES OF FUMAROLE SAMPLES
PART B - S2 Fumarole Samples Concentration, Moles Percent
Sample No.and Date ~O He H2 Ar O2 N2 CO2 H2S S02 Air
22-82 58.69 0.0004; 0.004 0.21; 1.82 7.47 33.87 -- 3.23 9.382/3/65 61.19 0.0002 0.004 0.12 -- - 35.31 --- 3.37 If
39-S2 66.90 --- 0.0002 -- 0.85 4.66 27.95 -- 0.71 5.576/17/65 70.00 -- 0.0002 -- -- --- 29.25 -- 0.75 fI
40-82 72.64 l 0.0003~ 0.0003 --; 0.010 0.75 26.99 -- 1.80 0.776/17/65 71/62 0.0002 0.0003 -- -- --- 26.61 -- 1.77 II
41-S2 70.84 0.0002; -- 0.029~ 0.12 1.63 28.88 --- 2.97 1.776/17/65 69.52 0.0002 - 0.010 -- -- 27.56 --- 2.91 fI
57-82 88.23 -- 0.0003 -- 0.42 1.70 9.97 -- 0.31 2.17/19/65 89.~6 -- 0.0003 - -- --- 10.12 --- 0.31 fI
58-S2 76.49 0.0002" 0.00008 ---; 0.008 0.55 24.21 --- 2.44 0.567/19/65 74.16 0.0001 0.00007 -- --- -- 23.47 --- 2.37 /I
59-82 73.71 0.00027' 0.0002 --~ 0.007 0.59 27.31 -- 1.90 0.617/19/65 71.62 0.0002 0.0002 - --- --- 26.53 --- 1.85 II
(»\0

TABLE III
ANALYSES OF FUMAROLE SAMPLES
PART C - S3 and New Zealand Fumarole Samples Concentration. Moles Percent
Sample No.and Date H2O He H2 Ar °2 N2 CO2 H2S S02 Air
100-53 93.57 0.0004" 0.016 0.063" 1.28 4.91 0.11 -- --- 6.252/1/66 99.87 0.0002 0.017 0.005 --- --- --- --- --- II
101-53 90.43 - 0.022 --- 2.15 7.36 0.09 - -- 9.602/1/66 99.88 --- 0.024 -- --- --- 0.10 - --- II
132-83 91.15 _'1 0.004 0.079" 2.08 6.77 0.16 --- - 8.933/18/67 99.82 -- 0.005 -- -- -- 0.17 -- -- II
127-NZ 38.61 --" -- 0.54" 12.95 ~.27 0.18 --- --- 59.79(1/67) 99.59 - - - -- - 0.41 -- - II
129-NZ 80.32 0.0004" 0.008 0.14;' 2.93 11.93 3.21 0.007 1.60 15.00(1/67) 94.32 0.00005 0.010 0.007 --- --- 3.77 0.008 1.88 1/
IICorrected to "air free" eonditions by subtracting 02 and N2 and equivalent amounts of otherair gases based on N2 atmospherie ratios.
"r..ov temperature (-78OC) eo1umn used to separate He from H2 and Ar from ° 2•+Partial separation of' He from H2 obtained at room temperature.
\0o

91
B. Evaluation of Sampling Tubes and Techniques
The gas sampling tube used in this research retained the basic
design of' the evacuated tube developed by Naughton !i~.40 The
main feature of this design vas the inclusion of silica gel in the
tube. Yhich prevented reactions between the gases by absorbing and
separating H20 and the acid gases. thus preserving the composition
of the sample. While this solved one of' the major problems of
collecting good samples of volcanic gases. other problems remained.
The ditt1culties involved in opening a vacuum type sampling tube
in the gas source have been considered by several vorken.19•29
The technique of Naughton !i.!!.•40 vhich vas used for early SUlfur
Bank samples in this research (Samples 4. 20. 33 and 34 in
Table III and the surface samples in Table II. was to smash a
fragile tip on the sample tube against the vall of the vent being
sampled. Similarly. for the first attempts to sample Ail.8e lava
lake drill holes. the tip was broken vhen the tube vas allowed to
drop the last fo inches to the bottom of the hole. This vas found
to be a rather unreliable method (onl¥ two samples ·w€l...·(' collected
successfully) • Otten the main section of the tube would break above
the tip. making it "17 difficult to seal atter removing trom the
drill hole; these samples were usually discarded. At other times
the tip retUBed to break. probab~ because slippage vithin the
quartz shield prevented it fro"!. &trlk.1ng the bottom. In addition.
gas samples could be collected only at the bottom of the drill hole
by this opening method. Therefore. investigations vere made to de-
vise a more reliable technique that would allow the semple tube to

92
be opened at any level in a drill hole. Borraving tram ocean
ographic technique, an attempt vas made to open the tip by
dropping a "messenger" ma<1o_ ot glass down the lowering cable. In
this case the quartz shield was lowered upside down, with the
lowering cable passing through the firebrick insulation, along
side ot the sampling tube. so the messenger could strike the tip.
This method, which vas used tor the Alae lava lake samples 13 and
14 (Table II), allowed taking samples at any depth, but very
often did not break the tip. The messenger either stopped betore
reaching the tip or broke on the wrq down. The present method,
that ot pulling the tip ott with a tine, nichrome vire, vas then
adopted. It required a small change in the tip design; a hook
shape was necessary, so the loop ot the break-ott wire could be
attached. This pull-ott method also has the advantage that it
leaves only a tine capillary-sized opening, which is easier to
seal with a torch. This technique, which was used tor the
Maltaopuhi drill hole samples. was also adapted to the sample tubes
used at Sulfur Bank and the other fumaroles, vhere it had an
added advantage. At these aites, when the tip was opened by
smashing as in the older designs • it otten bec8ill8 partially
plugged with sulfur crystals or other :fUmarollc deposits. When
this happened, it was necessary' to reseal the tube above the tip,
where it had a larger diameter; this took longer. illcreasing the
chances ot air contamination. pl1111ng the tip ott with a wire
el1m1nated this ditt1culty.

93
Ot the ma.ny problems encountered by past investigations ot
volcanic gases, the collection ot samples tree tram air has been
the most persistent. An examination ot the results of this 1Il
vestigation listed in Tables II and III show T&l7ing degrees ot
air contamination in the samples. It vas of interest to deter
mine the cause of this contamination and it it could be prevented
because of the possible alteration of the composition of the gas
sample by air oxidation. The question as to vhat vas the source
of the air found in the samples. vas considered. There are two
possibilities. the accidental contamination by the atmosphere sur
rounding the site during sBDq>ling. and the natural infiltration
and mixing ot air with the volcanic gases underground. The former
was considered first. as the most likely source. In this case.
contamination by air would occur during sampling, and would depend
on the collecting technique used and the conditions at the sampling
site. At Sulfur Bank samples were taken from a small hole in a
pipe capping a cased drill hole. There appeared to be 11ttle
chance for air to mix vith these gases at this point. Indeed
Sulf'ur Bank samples were found to have re!ativeq little air
contamination compared to samples taken from the other sites.
Air infiltration apparently occurred during the time when the tube
vas removed tram the hole in the pipe and vas being resealed by a
gas torch. It vaanoted that as the glass tip vas sottened by the
torch. it pulled-in as though there vas still a vacuum in the tube.
This would be exrected. with the cooling of the hot gases just
collected and undoubtedly would pull in some air. N01'II18l.ly the

94
tubes were lef't open in the gas source tor one minute betore re
seaJ.ing. It vas tound, however, that it they were left open in the
vent tor at least fifteen minutes betore closing them, their air
content vas greatl1' reduced. This can be seen in the results tor
Sulf'ur Bank (Table III), starting with the June 1965 samplels (43
Sl) • The most likely exp1ana't1on tor this is that the hot gases,
vhich till the tube, are given time enough to reach a temperature
equilibrium with the air surrounding most ot the length ot the
collecting tube and the contin~ emitted gases trom the vent.
Leaving the tip in the vent during this time keeps it immersed in
the tumarolic gases, preventing d.r infiltration.
In an attempt to eliminate the remaining air contamination, the
design ot the collec't1ng tube vas altered BO that it could be
sealed ott while still in the vent. This involved extending the
tip end ot the tube several inches beyond the silica gel section
of the tube. A constriction vas included as shown in Figure 2 to
tacilitate closing by torch. In Table III, Sulfur Bank samples
124 and 126 vere sealed vhile still in the vent and sample 125 vas
sealed atter removing it !"rom the vent. While there vas a ~ ...
duction of air in those tubes closed in the hole, it was not
especiall1' great, and in tact several other samples had an
equa.J.ly low air content (Sample 85, tor example). A convenient
explanation as to why' this technique did not reduce air contami
nation to zero, vas provided by the discove17 of another, larger
hole in the "sampling pipe," which had been hidden by the pile ot

95
rocks covering the pipe and manitold at the sul.tur well. It is
not unlikely, that some air is being drawn into the pipe through
this hole, which lies below the sampling hole.
Air contamination ot samples taken at other low temperature
sources (approximately lOOOC) vas greater than at the piped
tumarole ot Sul.tur Bank. This was expected because the cracks
and vents sampled at these sites vere much larger and more ir
regular than the small hole used at SUlfur Banks and, theretore,
vere more open to mixing vitb a.tmospheric gases. In add!tion
none ot these samples were sealed while still in the vents. The
ettect on the air contamination ot leaving the tubes in the vents
tor at least 15 minutes is apparent with the S2-tumarole samples.
As at Sultur Bank, this technique was begun vith the June. 1965,
samples. The three samples taken at the 63-tumarole, which vere
collected in the seme manner. still had considerable air contamina
tion. The cause at this vas not investigated turther, but IDBiY be
due to a shallow underground mixing ot air vitb the rising tum&rolic
gases. The air could have entered through lava tubes and cracks at
lover levels on the uneven ground vhere these vents vere located.
Air contamination was considerable tor the samples taken tram
the surtace ot Makaopubi lava lake during its tormation. This was
not unexpected because at the untavorable sampling contUtiona at
that time. The holes tram wbich the samples 'Were taken vere
shc.llow enough to allow considerable mixing at air with the
emitted gases. A more likely cause was the sampling ditficulty

96
(l1J.e to the intense heat radiating tram the surtace. vh1ch allowed
one to hold the sample tUbes in these holes for only a few seconds.
Because ot this the tubes could not be sealed sutt1ciently against
the red-hot walls ot these holes. When the tubes vere removed to
be sealed. they began cooling. creating in them a partial vacuum.
which drew in the air.
The situation appeared to be ditterent tor samples taken tram
the drill holes in Maltaopuhi lava lake. It vas otten noted that
when a sample tube vas pulled tram a drill hole. gas vas bloving
out ot its tip. meJdng it ditficult to seal. In most cases closure
was not achieved until this effect had stopped and the softened
glass tip vas pulled-in by a vacuum in the tube. A number ot tUbes.
hovever. vere apparently sealed-off under this ideal "blowing-out"
condition. Like sJ.l of the other drill hole samples. though. these
tubes vere contaminated with air. Air. which ranged trom one to
ten percent for the best samples. vas found at all depths in the
drill holes. Investigations vere made to determine hov this air
might be getting into the drill holes. It air permeation through
the crust ot the lava lake has extended down to the hot zone near
the bottom of the holes. one would expect vith time an approach to
equilibrium conditions with the gases present. Thermodynamically.
equilibrium conditions with such high concentrations ot air (02)
would preclude 8JJY measurable quantities of reduced gas species
such as ~. H28 and CH4. All ot these gases. however. vere found
in the drill hole samples. Further evidence against the presence
of large concentrations of air in these holes ve.s provided by the

91
determination ot the oxygen partial pressure tor the gaseous
composition tound in the holes. Heald et al.,4 have shown that
volcanic gases seem to represent a system in thermodynsm1c
equilibrium, with partial pressures ot o~gen extending from 10-8
atmospheres at 12000C to even smaller values at lover tempera
tures. Using their computational method,62 the o~gen partial
pressures tor two drill hole samples (12 and 13 in Table II) vere
calculated tor the temperature range (4000c to 10000C) tound in
these holes. These have been compared with o~gen partial pres
sure measurements made directly by U. S. Geological Survey'
scientists,18 using an electrochemical device. A plot ot the
l1m1ts of variation ot the o~gen partial pressure measured both
vqs is shown in Figure 1. The area between the hematite
magnetite and hematite-vustite boundaries represents the stability
field of magnetite according to the data of Eugster and Wones.19
Within the crust of the earth, variations in oxygen partial pres
sure will occur largely between these boundaries. It should be
noted that they tound the direct measurements were not reliable
below 500oC. The straight lines shown below this temperature are
extensions of the high temperature results. Nevertheless, these
results indicate that the air found in the samples taken at the
lover depths (the high temperature zones) of the drill holes is
not present in the holes betore sampling. other sources or causes
tor this air contsm1nation vas theretore investigated.
One possibility considered vas that cooler, more dense atmos
pheric air vas seeping dawn into the drill holes in a current

8
10
12
14 ..-' ftl
'Cr 160::-C>g 18
20
22
24
26
98
1.6 1.4 1.2
1000TfR)
1.0 0.8 0.6
Figure T. Oxygen Partial Pressure Variation Within aDrill Hole: High (Low) H~-Theoretically Determined 02 Partial Pressures; High (Lov) ProbeExperimentally Determined 02 Partial Pressures
(Sato and WrightT8)

99
counter to the evolved gases, which vere mainly steam. As it sank
in the hotter and lighter volcanic gases , it would be heated until
its density matched that ot the rising gases, which would then
carr'1 it back out ot the hole. This might cause the poor re
producibility ot the 02Ysen partial pressure probe in the upper
reachers ot the drill holes (below 50000). To determine it seepage
could occur, a simple "drill hole" consisting ot a vertical glass
tube vas set-up in the laboratory'. To stimulate the light vol
canic gas, air vas passed up through the tube. Neither the tube
nor the air, however, vere heated. A heavy gas atmosphere vas
created at the top ot the "drill hole" with carbon dioxide, which
vas generated by adding "dry ice" to vater. The usual ice fog
produced allowed one to tollow the movement ot the heavy gas, which
did indeed infiltrate the laboratory' drill hole, flowing down the
valls at the glass tube. The tlow rate tor the lighter gas vas
varied over a ride range, including the approximate flow rate
determined tor the actual drill holes. It vas found that the heavy
gas penetrated to as much as seven feet at this latter rate (600 cc.
per minute).
It is conceivable then that a similar effect could occur in the
field and would be heightened by the piston-like effect ot lowering
a sampling tube into the hole. This latter ettect vas not ob
served vith the laboratory model. In fact the opposite occurred,
and as the tube was vithdravn the heavy gas appeared to be pulled
dam and around it. In either case, this seems to be a likely oause
tor air infiltration into the hole during the sampling prooedure,

100
and a possible source of air contamination of the samples.
The crushed firebrick used 8S insulation tor the drill hole
sampling tubes. was also examined as a possible source of intro
duction of air into the drill holes. It vas believed that air
trapped between the particles ot firebrick when the sampling
tubes vere packed into their quartz shields._would be released
when the apparatus vas lowered into the hot holes. To counteract
this possible ettect. a double-valled quartz shield was con
structed. in which the space between the walls vas tilled with
crushed firebrick and sealed-otf under vacuum. The results ot
this experiment are illustrated by Maltaopuhi <!rill hole smnples
116 and 118 (Table II). which were collected using this shield.
The considerable amount of air found in these samples would seem
to eliminate the firebrick as a major source ot the sample con
tamination.
A second. but more sophisticated artificial drill hole was
constructed in the laboratory in a further attempt to establish
the cause ot the air contamination in the drill hole samples. For
this model. a vertical glass tube with the same diameter as the
lava lake drill holes. vas titted to a round bottom tlask. In
operation. carbon dioxide from e. cylinder was bubbled through
boiling vater in the :tlaslt. and the glass tube was heated with
heating tapes to 3500 C in the lover tour toot section and to
slightly greater than 1000C in the upper tour teet. Only tres~
boiled~ d..tstil1ed vater vaa Wied and the system vas allowed to
purge i tselt ot air for at least one-halt hour atter each add!tion

101
ot fresh vater, before taking any samples. In addition to the usual
drill hole sampling tubes, with quartz shields and firebrick insula
tion, samples vere also taken with a special collecting device,
that could be closed while still in the "drill hole." It con
sisted ot a one-meter long, small diameter glass tube with a brealt
ott tip on one end and a cylindrical sample bulb connected to the
other end by means ot a stopcock. No silica gel vas used in this
tube. In practice, the entire tube we.s evacuated, sealed, and
placed in the "drill hole." Atter 10 minutes which allowed 8ZJy
air pushed in by the tube to be flushed-out, 1ts tip vas pulled
ott, and atter one additional minute, the st~cock vas closed and
the tube removed tor analysis. Table IV summarizes the results of
this experiment; samples 141, 142, and 143 being collected with
the usual sampling tubes and samples 144 and 145 being taken with
the special.ly designed tube. According to these results, a con
siderable reduction in air contamination occurred when the samples
were closed while still in the "drill hole." The small amount of
air that vas found in these samples vas a IlI,Vstery until a sample ot
gas from the carbon dioxide cylinder was an~zed directly and
tound to contain o2Y'gen and nitrogen. For samples ot the Bame
size, the O2 and N2 found in the cylinder and in samples 144 and 145
vere in the same concentration range. Ot the three samples col
lected by the usual means, and sealed outside the hole, 141 vas
opened as soon as it vas lowered into the "drill hole." and 142
and 143 vere opened atter waiting one minute tor purging ot air
that might have been pushed into the "drill hole" by the sample

TABLE IV
AHALYSES OF AFl'IFICIAL DRILL HOLE SAMPLES
Depth,T,ypc~ ot teet
Semple Sampling (Temp. )Humber Device °c ~O O2 H2 CO2 Air Comments
regular 1 Opened 1mmediat~.
141 drill hole 96.53 0.28 1.08 2.63 1.36 RemoYed atter 1 min.device (350°) Sealed by torch.
Opened after 1 min.142 " n 95.33 0.09 0.36 4.59 0.45 Removed after 1 min.
sealed by torch.
Opened after 1 min.143 tI n 94.29 0.61 2.21 3.56 2.82 Removed a:tter 1 min.
sealed by torch.
Stopcock 3144-1 tube 94.69 0.002 0.03 5.90 0.03 Opened a:tter 10 min.
(100°) Bealed in the hole bystopcock.
Same as 144-1, except144-2 n tI 94.69 0.004 0,,02 6.11 0.02 eamposition vas determined
from a different aliquot.
Opened after 10 min.145 If n 96.31 0.004 0.009 4.48 0.01 Sealed in the hole by
stopcock.
...,0f\)

103
tubes. The results indicate that it air is pushed into the drill
holes 'by the sample tubes it is not a significant tactor in the
air contamination ot the s&Dij)les. The conclusion then is that
the maJority ot the air contamination ot the drill hole samples
occurred, as vith the samples taken at the other sites investi-
gated, vhen the sampling tube vas removed from the gas source and
betore it could be sealed-ott.
Additional evidence, that at least the major traction ot the
mr;ygen and nitrogen tound in all samples came directly from atmos-
pheric air, vas provided 'by considering air-saturated ground vater
as a possible source tor air contamination ot the gases. This
vas done 'by plotting the ratio ot nitrogen to vater versus the
ratio ot ox;ygen to vater (expressed as cubic centimeters ot ° or2
N2
per liter ot liquid H2
0) tor each sample. The relationships tor
nitrogen to oJrYgen in atmospheric air and in air-saturated vater
were then superimpoDed on this plot, vhich is shown in Fi~ "3.
As is seen in the diagram, the majority ot the points are clustered
about the atmospheric air line, vhile the air solution line is
complete~ ignored, eliminating air dissolved in ground vater as
a maJor source of air contamination. These points represent, in
!:.;s~ aas13s, smnples which had massive air contamination. The posi-
tion ot the leema1 ni ng points. all ot which lie to the lett ot the
air line, is most probab~ due to oJl;Jgen conswnption caused 'by
reactions ot this gas during collection and before analysis of the
sample. A leas llke~ explanation is that they have been displaced
tram the atmospheric air line 'by the presence ot primar;y magmatic

z
Figure 8. Oxygen and Nitrogen in the Gas Samples:Solid Line-02:N2 in Atmospheric Air;
Dashed Line-02:N2 in Air-Saturated Water
.I
b~

105
nitrogen in the gases. Although such "juvenile" nitrogen is be
lieved to exist in magmatic gases, it is not thought to be present
in concentrations as great as this interpretation indicates.
Perhaps the displacement of these points is due to both factors,
with oxygen consumption the main cause. These results support a
similar study described recently by Yuhara. 80 In his case oxygen
and nitrogen found in water samples from hot springs in Japan were
compared with the air-saturated vater relationship. His results
indicate an atmospheric source for the oxygen and nitrogen found,
and he concludes that oxidizing reactions account for the oxygen
consumption found.
C. Evaluation of the Gas Analyzing System
1. Introduction
The characteristics and advantages of gas chromatography
as a method of separation and analysis of gases, liquids or
even metallic compounds of sUfficient volatility, have been
well documented in many papers and texts since this tech
nique was first described ~ James and Martin. 8l The three
chief advantages may be succinctly described as speed of
analysis, simplicity of apparatus, and Bensitivity of de
tection. The combination of these factors with relatively
low cost in comparison with other instrumental techniques,
has led many to refer to gas chromatography as the poor
man's mass spectrometer.

106
2. Sensitivity of the gas chromatograph
Sensitivity data for the two detectors used for each gas
analyzed by the gas chromatographic system is presented in
Table V. The minimum detectable number of moles was determined
by estimating the smallest peak. area that could be measured above
the background noise of the detector systems. This area depended
a great deal on the peak shape for the individual gases at this
concentration limit, and varied from approximate~ 4 x 10⁻³ square
inches for CH4 to 0.12 square inches for Ar. For comparison, the
minimum detectable concentration in parts per million (ppm) were
calculated trom the moles for a four milliliter sample which was
the approximate volume ot gas introduced into the chromatographic
system during a run. In actual practice, the concentrations of
the individual gases in the samples, often approached their sensi
tivity limits. Common~ found concentrations were: 10-6 moles
(Ar, N2), 10-7 moles (02' CO2 , H2S, S02)' 10-8 moles (He, H2 ),
and 10-9 moles (CH4). Concentrations in these ranges increase the
likelihood tor inaccuracies in determining chromatogram peak areas
and in measuring pressures, as discussed in the following section.
Carbon monoxide, COS, and CS2 were not found in any samples, and
this is believed to be due to the relatively low sensitivity of
the thermal conductivity detector used in this study for these
gases. Previous investigations of Hawaiian volcanic gases have
found CO and CS2 to be present. 4

TABLE V
SENSITIVITY OF THE GAS CHROMATOGRAPHDETECTORS FOR GASES IBVEBTIGA!rED
Thermal Conductivity Detector
107
Ar Carrier Gas He Carrier Gas
Component Moles ppmu Component Moles Ppm*
He 3.7%10-10' 2.1 Ar 8.2xlO-8 461
~ 2.8xl0-1O 1.6 °2 5.6xlO-9 31
N2 5.5xlO-9 31
CO 2.7xlO-8 151
CO2 3.0xlO-9 17
~S 5.4%10-9 31
8°2 1.6xlO-8 88
Flame Ionization Detector
He Carrier Gas
Component Moles yemu .
*Calculated tor the sample size analyzed (400.) at S.T.P.

108
3. Sources of error
Errors associated with gas chromatographic techniques and in
particular with its application to the study of volcanic gases
have becn discussed by Heald82
and by suwa. 83 Consideration of
these and other errors as they apply to this investigation will
be given here.
The inaccuracies in measuring the peak areas of the chromato-
grams are believed to be one of the most important sources of
error. Three factors influence this measurement: 1) The method
used to determine the area; 2) the size of the peak; and 3) the
shape of the peak. An excellent comparison of the most common
methods for measuring peak areas (planimetry, triangulation,
height x width at half-height, cutting and weighing, disc integra
tion and electronic digital integration) has recently been pre
sented by Gill and Tao. 84 Their results show that height times
the width at half-height, the method used in this study, to be
comparable to the other mechanical methods, but not as precise
generally as the electronic integration techniques.
Another important relationship illustrated by their data is
that precision and reliability of the results decreases as the
peak size decreases. The peak size for a particular component
will depend on its concentration in the sample and the detector's
sensitivity to it.
Peak shape is particularly important when using height times
width at half-height and other triangulation methods. When used
on asBYmetrical peaks, poor results will often be obtained.

109
Symmetrical peaks are more cormnon in the usual method of gas
liquid chromatography than in the gas-solid technique used in this
investigation. This error was somewhat minimized by selecting the
most symmetrical peak for each component trom the several aliquots
usually run from each sample. The effect on the resu1ts of
measuring different peaks from different aliquots of the same
sample is illustrated by samples 144-1 and 144-2 in Table IV.
Mechanical errors inherent in the gas chromatograph no doubt
contributed to lack of precision in the resu1ts, but compared to
peak measurement errors they play a minor role. These errors in
clude nonlinearity of the detector response, variations in flow
rate and in the temperature of the columns and detectors. By
keeping the sample size within ~he linearity range of the detector,
and maintaining constant flow-rates and temperatures from sample
to sample, these errors can be kept to a minimum.
A constant error may have been introduced into the resu1ts by
the calibration curves, since they were subject to the inaccura
c',eR of the measurement of peak areas when they were constructed.
In addition, the syringe method used tor calibrating the gas
chromatograph may have added to this error, because air was always
introduced with the calibrating gas. Correcting for this air in
cluded the uncertainty involved in measuring the oxygen and
nitrogen peaks produced. When the determination of He and Ar
was included in the ~sis scheme, the instrument was cali
brated for these gases by introducing them directly into the
vacuum system. All air was excluded, eliminating one source of

110
error. This method then should lend itself to a more accurate
calibration of the gas chromatograph.
Another source of' error in the analyses was the pressure
measurements. Here the error was mainly due to uncertainties in
reading a mercury manometer. Sample pressures in the vacuum
system varied from approximately 0.1 mm of' Hg to 300 mm of Hg.
The uncertainty involved in reading the manometer when sample
pressures were in the low range, probably contributed as great
an error in the results as the area measurements did for the size
peaks produced by these samples. A great improvement in the re
liability of the pressure readings, especially when the pressures
were lOW', was achieved when the ma.nometer ~TaEl .L'p-placed by the
quartz pressure gauge. This improvement vas apparently masked in
the results, however, by the still present errors in measurement
of peak areas. The determination of the sample volume involved
pressure measuremento before and after expansion from a known
volume. Error in these measurements was kept to a minimum by
using a relatively high pressure range (250 to 350 mm of Hg).
The determination of the condensed vater vapor by weighing is
subject to error, as is any physical measurement. This is usu.ally
the most reliable step, however, in a chemical analysis, and
errors norma.lly amount to fractions of a milligram. The weight
range for the analyses in this study were approximately 0.001 gram
for surface and drill hole samples, to 3 grams for SulfUr Bank
samples. Again the greatest errol' would be expected in the low
range.

111
4. Precision and accuracy of the gas analyzing system
To assess the precision and accuracy of the gas analyzing
system, seven samples of a gas mixture of known composition were
ana1yzed in the same manner as the volcanic gas samples. The
results are presented in Table VI. The gas mixture, which was
prepared by Philips Petroleum Company and designated by them
as Gas Mixture G-7 (Lot 8), contained acetylene, but it was ex-
eluded from the results, since the instrument was not calibrated
for this gas. The sample size of the Philip's mixture used for
these runs was within the range found tor the volcanic gas samples.
For the permanent gas portion this range varied from 10-3 moles
-6for Makaopuhi lava lake surface samples to 10 moles for Sulfur
Bank samples. The condensable gas range varied from 10-2 moles
-6for Sulfur Bank samples to 10 moles in Makaopuhi drill hole
samples.
The precision reported in Table VI is poorer than that ind!-
cated tor the Philip's analysis, but no intormation is available
on the method ot analysis used by this supplier or the size ot
sample taken by them. other investigators of volcanic gases, and
especially those using gas chromatography for their analyses,
usually have reported better precision and accuracy. It might
be remarked, however, that these data almost always involve only
a simple gas mixture, such as oxygen and nitrogen (air). The
column ot relative standard deviations shows that the precis10n
generally decreases with a decrease in concentrations. As was
explained in the preceding section, this is most likely due to

TABLE VI
PRECISIOB AlID ACCURACY OF THE GAS ANALYZING SlBT»1: SEVEli RUBS OF PHILIPS GAS MIXTURE G-7 (LOr 8)-
S Sreiative Philips PresentMedian, Estimated Analysis Philips DeviationMole standard S x 100 of G-7 (Lot 8) Deviation (Philips-Median) •
Component Percent Range Devia.tion** median Mole Percent Mole Percent Mole Percent
li2 69.83 8.71 3.22 4.6 67.91 0.5 1.9
~ 13.13 3.26 1.21 9.2 11.23 0.2 1.9
CO 9.13 7.51 2.78 30.4 14.52 0.2 5.4
CO2 5.10 2.82 1.04 20.4 4.82 0.2 0.3
Ar 0.95 0.78 0.29 30.1 0.94 0.1 0.01
CH4 0.041 0.008 0.003 7.3 0.58 o.~ 0.5
ClThe acetylene component ot this mixture has been deleted.
fHIS 11:I (Bange) (Kia). where K:m. is a statistical factor based on the number or obsenations; tor sevenobservations. the present situation. Km. a 0.37. 85
~I\)
113
uncertainties in measuring peak areas. Any discrepancies in the
decreasing sensitivity with decreasing concentration can be ex-
plained on the basis of individual variation in senaitivities. As
seen in Table V, the sensitivity of the system is greater for CO2
and CH4 than it is for CO and Ar. Deviations of as high as
20-30 percent for gases present in low concentrations and devia
tions of approximately 5 percent for gases of higher concentration
compare with the results of Naughton, et a1. 40 For the size and
type of sample involved, and accepting the accuracy of the analysis
supplied with the standard sample, the accuracy of the method used
in this work is sufficient for noting the trends in composition
which are discussed in a later section. No detailed analysis of
the precision and accuracy can be given for the volcanic gas samples,
since no more than three vere taken at the same site (or depth in a
drill hole) at the same time. The accuracy of the ana.lyses of
these samples may be assessed in a general way by noting their
degree of a.ir contamination. Samples containing a large amount of
air necessari~would have only a small concentration of volcanic
gases. These would suffer therefore from the errors inherent in
the analyses of low gas concentrations. The relative~ large
compositional variations that vere found when samples were taken
from the same site and only minutes apart, are common to most
previous investigations of volcanic gases. It is felt that, at
least in this investigation, these variations are due not only to
the vagaries of sample collection (such as air contamination), but
also reflect the effects of all the factors discussed previous~

114
which lead to the relatively poor precision and accuracy of the gas
anal¥ses. In view of this work, and with some recent developments
in gas chromatography, several changes could be suggested for the
analysis system to improve its accuracy l!!Dd precision: 1) adop-
tion of an electronic integration technique for chromatogram peak
area measurements; 2) use of a more sensitive thermal conductivity
detector or the ultra sensitive helium ionization detectors recentl¥
developed; and 3) adoption of the calibration technique used for Ar
and He to the other gases.
D. Discussion of the Gas Samples
1. Makaopuhi lava lake samples
An examination of the results of the gas analysis of the
Makaopuhi lava lake samples in Table II shows a characteristically
variable composition for the gases with position on the lava lake
at a givan time, with depth in a given drill hole at a given time,
and with time since eruption. The change in the average composi-
tion of the gases with time and the range of the measurements for
each collecting date are shown in Figure 9. Similar data from
4Heald's collections at Kilauea Iki are shown for camparicon.
As has been noted previously,7 a great variation in c~osi-
tion is almost a general phenomenon in collections of volcanic
gases, and m~ occur even over short periods of time for gases
issuing from a given natural vent. It would not be unreasonable,
however, to expect a more uniform composition in gases collected
from an isolated body of lava such as Makaopuhi lava lake, at

H2
-------------------"*1 W.?:,:=:- ,·~ ·M~ J::02
---- .so _....-.-.HS ........ 2
2
Cinder Cone(Puu Puai)
Kilauea Iki1959- 60
Makaopuhi lava1965-66
-----
H20
:---.---------\
\ \ -------,.......-...__ H2S
fa e i .,.L
", , ,",
", , ,H2 '"
'I ., •I.. H
20• •
1""" Lake
4
3
2
3
o
~o...o
a...
CD 4...::I.....CD
a': .s
C>g 2I
5I , I , I , I I , I I , I , I , , I ,
o 1 2 3 4 5 6 7 8 9 10 11 12 13 14 15 16 17 18Months (from start of eruption)
Figure 9. Variation of the Makaopuhi Lava Lake gases vithTime Atter Eruption (similar data from Heald's collec
tions at Kilauea Iki are shown for comparison) ~V1

116
least at a given time. This did not prove to be the case.
Further evidence of this compositional variation was found in the
degassing at the natural crack system on the surface of the lake,
which left some with a coating of sulfur and other volatile
deposits, and others nearby with no deposits at all. Why this is
so is not yet known. In discussions with the staff of the
Hawaiian Volcano Observatory, the hypothesis that convection cells
are formed in the molten lava beneath the crust due to lower heat
transfer through areas where the crust is thicker, such as the
island-like vellings on the surface of the lake and at the lake
edges. While there is no definite experimental proof of this
phenomenon, the slow flowing action in these regions could lead to
the concentration of volatiles. Deposits along the natural crack
system in the vicinity of these regions of thicker crust indicate
higher concentrations ot gases rich in volatiles.
Since the gases collected trom the drill holes appear to repre
sent a system in thermodynamic equilibrium, as will be shown in a
following section (III-E), a variation in gas composition with
increasing depth within in a given drill hole and at a given time,
would be expected due to the accompanying temperature increase.
As may be seen from the results in Table II, there vere a number
of cases where a series of samples were collected at varying depths
within a given drill hole and at a given time. Unfortunately only
_o~e series, numbers 72, 73 and 74 from drill hole 14, was complete
enough (i. e ., had a variety of gases at all three depths sampled)

117
to allow any conclusions to be drawn with respect to trends with
depth. The gases found in this series show evidence of an
approach to the equilibrium situation, particularly with respect
'to the H2
0 to H2 ratio. The compositional trends for CO2 and
~S, however, are in the reverse order to what would be expected
theoretically. In addition, the CH4 concentration found at each
level sampled in this drill hole is much greater than the calcu
lated equilibrium concentrations at these depths. These problems
will be explored further in the discussion of the equilibrium
calculations made for this investigation.
The variations in the composition of the gases of Makaopuhi
lava lake with time, as illustrated in FigUre 9, show a rapid
depletion of all of these gases, with the exception of vater,
during the :first few months atter the eruption. The compos!tion
of the gases then became essentially constant for the remainin3
period in vhich samples were collected (some 16 months). This
trend strongly supports the hypothesis presented by Peck et al. 86
to explain the formation of vesicles found in drill cores extracted
from Alae lava lake. The decrease in the solubility of a rapidly
ascending magma, due to falling pressure, is believed to result
in a supersaturation of the gases in the magma before any bubbles
are formed. 87 When the bubbles do form, the high viscosity of the
magma would result in negligible movement of the bubbles relative
to the magma. Abundant exso1ution of gases would then occur as
the magma reaches the surface. In Alae lava lake, then, evolu-
tion of the gas held in a supersaturated condition in this body of

li8
lava for the first two months after it was created is believed to
have formed the large number of vesicles found in the first three
or four feet of the crust. Below this depth, as solidification
proceeded, exso1ution of the gases became nearly constant, re1a
tive to the amount of lava solidifYing, forming less abundant
tiny angular vesicles. This same decrease in abundance and size
of vesicles with depth has been found for other similar situations
at Kilauea Vo1cano. 88 ,89 In this case, the gao is believed to
have resulted from the "second boiling" effect during crystalliza
tion of the lava. Second boiling differs from ordinary boiling
in that it is a response to cooling. This is a pressure effect;
a result of an increase in vapor pressure due to confinement of
dissolved ganes in a smaller and smaller body of' liquid as it is
~emoved from other portions by crystallization.
Essentially no variation occurred in the water concentration
of Makaopuhi gases with time from the eruption. This would be
e%pected, since water comprises almost one-hundred percent of' the
gases found, and small variations would not be as noticeable as
with the other gases where variations were of the same magnitude
as the gas concentrations.
2. Fumarolic gas samples
The results of the gas analyses of samples collected at Sulfur
Bank (81), at the solfatara on the east rim of Kilauea Caldera (82),
and at the steaming area between Aloi and Alae pit craters on the
east rift zone of Kilauea volcano (S3) are summarized in Table III.
The location of these fumaroles at Kilauea may be seen in Figure 1.

119
The analyses of two samples obtained !'rom fumaroles on White Island,
New Zealand, have also been included in the table.
A comparison of these analyses shows a wide variation in
composition from site to site, which is an almost universal
feature of volcanic gas collections throughout the world. These
variations 11I8\Y be attributed to several factors, one or all of
which may be in effect, such as air contamination either during
sampling or in the gas source, poor precision in the gas analyses,
infiltration and mixing of meteoric waters with the gases, and the
effect of temperature on the gas composition.
A lack of sulfur gases in the samples collected at the S3
fumarole was surprising, considering the sulfur depooition that
occurred around many of the cracks and vents after an eruption on
Christmas Eve, 1965, poured lava over much of that area. Also the
first samples were collected on~ a month after the eruption.
The composition of the gases at this site, mostly H20 with a small
amount of CO2 and H2 , is similar to that found for late Makaopuhi
samples collected trom "old" drill holes in which the bottom no
longer extended through the lava lake crust (Sample 97 in Table II,
for example). This indicates that a similar mechanism of gas ex
solution is operative in both cases, but reaches the final de
gassing composition (H20 and some CO2 and H2 ) at a faster rate at
the shallow lava flows found in the S3 area.
The location of Sulfur Bank (Sl) and S2 fumaroles on faults ot
Kilauea Caldera and the long activity, as evidenced by the consider
able rock alteration around them, indicates that they may be close;ly

120
associated with the main magma chamber of' Kilauea volcano. For
this reason SulfUr Bank has long been a prime source of' gases.
Since the first samples collected trom the piped vells at this
fumarole,l it has been suspected that a consistent and thorough
study ot these gases would provide an indication of' impending
eruptions. Ballard and Payne,3 and later Heald et a1. 4 presented
data indicating that the sulfur gases particularly H2S, vere very
sensitive in this respect, increasing significantly preceding
eruptions that occurred during their studies.
The data of' the present study has been examined tor this
ef'fect. The change of' concentration of the gases tound with
respect to time are shawn in Figure 10, and the time periods tor
the tvo eruptions that occurred during the investigation have
been included. Although there are variations in the H2S and S02
composition with time, they are not clearly related to the times
of' eruption. In fact the concentration for these gases remains
nearly constant as the Aloi eruption is approached and passed.
The possibility that the total sulfur gas concentration might be
the indicating factor vas also considered. This data is shown in
Figure 11 as a total sulfur gas to CO2 ratio versus time. The H2
to CO2 ratio was also included, as the data in F1,gure 10 shoved
a ourious "mirror image" relationship between the sulfur gases
and H2• To keep them on the same scale for comparison it vas
necessary to divide this latter ratio by two. Neither of the
ratios show a particular trend with respect to the occurrence ot
the eruptions. Bef'ore any definite conclusions can be drawn, as

CO2
H2 0
5°2
~5
EveMakaophui
Eruption
• • • e :!: • i '· •
•
CI~
:l..lOtCI~
CL_ 2
~~
~ 3
(!)o 4.....I
5
6
7
Months
Figure 10. Variation of the Gases fran SUlfur Bank Fumarole vith TimeI-'l\)I-'

80
76
72
68H2
lC 105
2 CO2
64
60
56
36
32
28
4
3 51965
Months
Figure ll. Total Sulfur Gas to CO2 and H2 to CO2Variations vith Time at Sulfur Bank Fumarole
122
31967

123
to whether or not the variation in the Sulfur Bank gaseous composi
tion can be used to predict eruptions, it is believed that a more
frequent, periodic sampling than was carried out for this in
vestigation would be needed. A program has already been initiated
in this direction, with the collection of samples proceeding at a
rate of one a week.
The gases from the 82 fumarole have never been sampled and
analyzed before this study, and toe 'lew Bamples were collected in
this study to lend much light on the effect of approaching erup
tions on the gas content of 82. The data, which comprise three
sampling periods, is shown in Figure 12 versus time. The period
covered included the Makaopuhi eruption, but no trends relative'
to this eruption are noted in these gases. It might be worthwhile
to make more frequent collections from this source also, with re
gard to eruption prediction.
These two gas sources are discussed further in a later section
with regard to the equilibrium situation (see section III-E).
3. Miscellaneous
Up to this point very little has been sald about CH4 and the
rare gases, Ar and He, which were found less frequently than the
so-called major gases. Methane 'W8.B found only in samples taken
from Makaop,· .. i lava lake. Equilibrium calculations (section III-E)
predict a much lover concentration than was found in the M~aopuhi
samples, in fact so low as to be beyond the limits of the flame
ionization detector (10-6 mole percent). Collections of gases
made from lava flows covering vegetation usually show on analysis a

~ H;O~ -x
~I
o
•
2
.....~
:et 3
~
~4
oo....
I
5
Mokoopuhi
Eruption~
I , I~' I I I I , ,
2 3 4 5 6 7 8 9 101965
Months
Figure 12. Variation of the Gases from 82 Fumarole vith Time~,f::'

125
large content of this gas, predominantly in the early phase of
degassing. stereo photos made before the eruption in Makaopuhi
pit crater shov a rather sparse covering of vegetation. Rough
calculations based on a tree count from these photos, indicate
the carbonaceous gases 'Would be exso1ved from the lava in less
than one~. Methane 'Was not found, however, until about four
months after the eruption. At present there is no way to explain
its presence in the drill hole gases.
The results of the gas analyses in Tables II and HI sho'W Ar
and He to be present in some samples. The gas chromatographic
techniques for separating these two gases (from O2 and H2
respectively) on the molecular sieves column 'Were not worked out
until late in this study so only a few analyses have included
these gases. Ratios of N2 to Ar in the sample generally indicate
an atmospheric source for these gases. This is in agreement vith
results found by HOering89 for isotope studies on N2 and Ar in
volcanic gases • Nitrogen to He ratios indicate the same source
for this gas, vith best agreement in samples having high air con
tamination. Isotopic studies by Wasserberg et al. 90 also indicate
an atmospheric origin for these gases in samples from Kilauea !ki.
In Bome analyses, unidentifiable peaks vere produced on the
:t'lame-ionization detector trace. As this was an indication of
the presence of organic compounds other than the methane sometimes
found, provisions were made in the gas analyses to collect these
samples in a breakoeal tube for mass spectrometric analysis. Pre
liminary analyses or these samples vere a.ttempted using an eight-inch,

126
single focusing mass spectrometer, with a resolution of 2500,
operated in the dynamic mode. Figure 13 shows the results of a
number of condensable gas portions of samples plotted to emphasize
the similar peek intensity pattern that appeared throughout in
varying degrees of intensity. A full interpretation has not yet
been made but indications are that unsuspected organics (m/e •
26, 27, 41, 42, 43) other than methane are present. A further
investigation of these results has been initiated.
E. Equilibrium Calculations
1. Introduction
A theoretical study vas made with the hope of gaining more
knowledge about the nature and extent of attainment of chemical
equilibrium in volcanic gas systems. Because sublimate deposits
contain metal compounds common to those found in ore deposits, a
study vas initiated to investigate equilibrium systems that in
cluded sublimates.
A method of calculating complex equilibria, which vas
developed by White, et &1.91 and is based on the principle that
the free energy of a system has a minimum value at equilibrium,
was adapted by Heald and Naughton62 for computer calculation of
volcanic gas equilibria using the analysis of an actual sample
as a starting composition. The present study follows their
methods and uses a program written by Heald,92 but represents
a more advanced form of his original program.. A listing of the
program is g1ven in Appendix II. It vas written in the
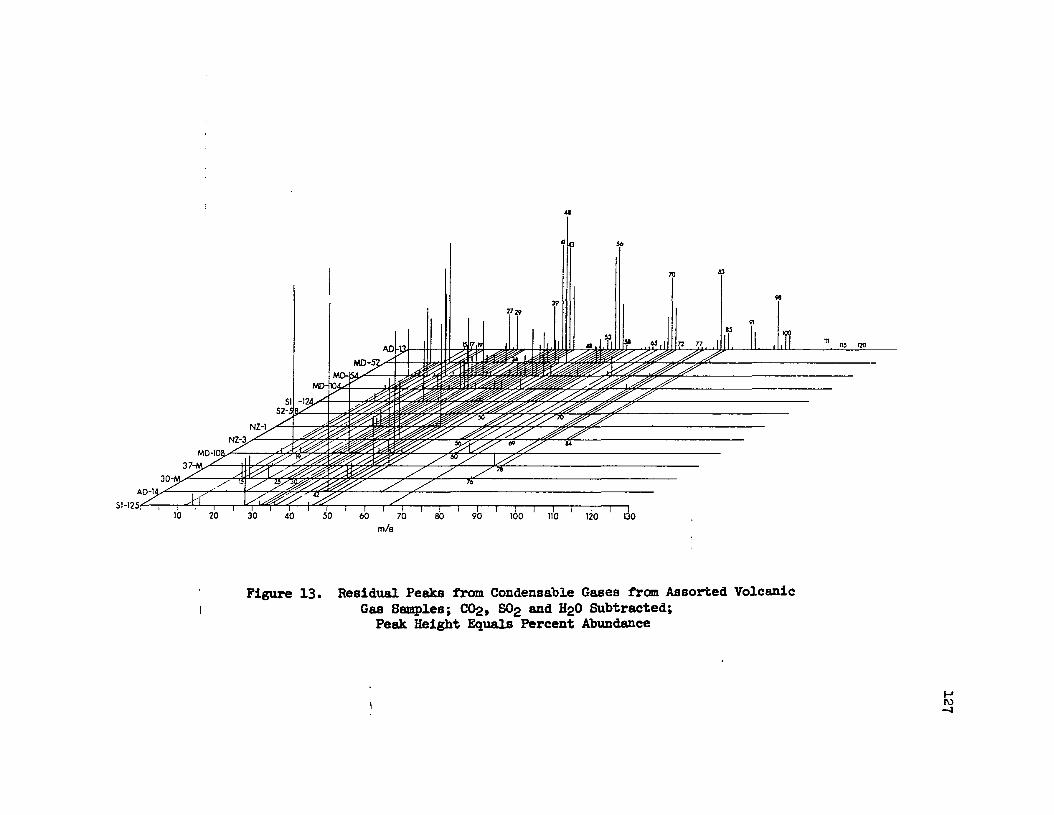
V2939
41
1I 56
70 !3
91
98
Figure 13. Residual Peaks tram Condensable Gases frC!ll Assorted VolcanicGas Samples; CO2, 602 and H20 Subtracted;
Peak Height Equals Percent Abundance
m n5 120
I-JI\)-:I

128
Fortran IV computer language f'or use on the IBM 7040 computer
system and was adapted here f'or use with the University of. Ha.waii
Computing Center's IBM 360 computer.
As with Heald's original program, the eff'ect of temperature
and pressure variations on the equilibrium composition under
study may be determined, and the variety and number of' components
that make up the system of study may be varied. The larger
"memory" (data storage capacity) of' tod8\1 I s comp'.1ters and the
availability of free energy data for a. larger number of' compounds
a.llows one to study systems of considerably grea.ter complex!ty
than heretofore. At present the program is capable of' handling
up to 15 elements and 40 compounds. Unlike Heald's original
procedure,62 which required two separate program runs, one to
determine the major components and the other the minor components
based on the output of the first program, the compositions of
both major and minor components are determined in the same run
with the present system.
There are Bome limitations to this program and to the resulting
calculations of' equilibria in volcanic gas systems that should be
noted:
a. At present the program cannot take into account non-ideal
situations; therefore the calculations are made assuming all
compounds are present as ideal gases.
b. Although the program is designed to handle more than one
phase, lack of data prevents the use of this feature.

129
c. Free energy data often are lacking for compounds be-
lieved to be important in volcanic systems, such as sulfides
and some chlorides (CaC12 for example).
d. The lack of knowledge as to the concentration or many
of the suspected components in vo~ic gases forces one to
make guesses in order to supp~ the computer with a starting
composition. The resulting calculated composition ~ give a
false picture of the equilibrium situation in the system
under study.
2. Results
The calculations were made using the an~ses of samples
selected from Tables II and III as starting compositions. Law air
contamination was used as the basis for selection of an~ses from
Sulfur Bank (No. l26)and S2 (No. 58) fumaroles. The variety of
components present determined which Makaopuhi surface an~ses
vere to be used (NOB. 28 and 3:8), as air contamination was con-
siderable in all of these samples. Equilibrium calculations also
were made using two drill hole samples, one from a high tempera-
ture zone during the ear~ stages of cooling (No. 72) and one from
a low temperature zone in the later stages of cooling (No. 91).
Free energy data was obtained from the J .A.N.A.F. (Joint
Army, Navy, Air Force) tables93 and from the literature,94 and
for each component represented the free energy' of an ideal gas phase.
The results of the equilibrium calculations indicate that, in
general, eqnilibrium between the gases has been achieved, at least

130
for the major components, a.s shown in Ta.ble VII. 1Yith regard to
the drill hole samples, however, the observed composition appears
to represent an equilibrium at temperatures higher than those
found at the temperature of collection. This same effect was
found by Matsuo95 for ~aBes of Showa-Shinzan volcano, and has
been interpreted by him as a quenching of the original equilibrium
as the gases reached the lower temperature at the point of col
lection. The temperature which the observed equilibrium composi
tion of the Makaopuhi surface samples represented is not accur
atel,y known. Heat was lost by radiative transfer, and the molten
lava at the points of collection cooled very rapidly. Therefore
onl,y an estimated temperature range can be given (800 to 9000 C or
llOOo to l200~). It is surprising that under such rapidly
changing conditions these samples would represent an equilibrium
composition at any temperature whatsoever.
That equilibrium was achieved in the Sulfur Bank and S2
fumarole gases, was also surprising. One might expect that the
low temperatures involved would hinder the reactions leading to
an equilibrium situation. \<Then the Sulfur Bank wells were drilled
by Jagger in 192231 it was found that the temperature remained
constant, at 950 C (the boiling temperature of H20 at that alti
tude), throughout the length of the drill hole (70 feet). Per
haps this effect, which may extend deeper, gives hotter gases
coming into the fumarole area, sUffioient time to reach a new
equilibrium at this lower temperature before they reach the top
ot the 'trell. The Sulfur Bank vent temperature was measured

131
TABLE VII
OBSERVED AND EQUILIBRIUM COMPOSITIONS Oll' THE MAJOR GASCOMPONENTS AT THE SAMPLING BrrEB
126-81Oi Ci
3680K 4000K
58-82o C
368~ 4000rc
28-Mo C
1100-1200~ 10000K
0.00003 0.00002
10-11
23.46 1.15
4.65
6.36
87.63
0.17
10-13
0.019
87.65
2.37
0.00001
74.12
2.37
0.00007 0.00002
10-11
74.16
8.71
0.02
0.24
91.03
0.24
8.71
0.02
o C1l00-1200OJr' 12000Jc
72-MD14o C
1233~ 1400~
9l-MD20
0.000003 2.72 0.080
0.038
0.071
0.047
0.066 0.066
99.47 99.67
0.079 0.052
0.00006 10-12
2.20
91.36
2.22
0.032
0.62
91.50
2.84
3.89
0.49
0.009
10-19
95.56
0.49
0.011
95.62~O
It 0 • Observed cCIIlPoaition and the temperature at the time ot collection.
C CI Calculated equilibrium composition and temperature at which agreement with the experimental value is closest.
II Estimated temperature range.

132
during this investigation and found to be 94.50 C. No temperature
data was collected at the S2 :t'umarole, but the assumption that
the temperature at the vents is the same as at Sulfur Bank appears
reasonable.
As was mentioned earlier and is shown in Table VII, the CH4
found in the drill hole samples had not established equilibrium
with the other gases in these samples. In each case the observed
values were several orders of magnitude larger than the calculated
equilibrium values at each temperature. Matsuo96 has found an
excess concentration of CH4 in the fumarolic gases of Showa
shinzan Volcano with respect to the concentration his equilibrium
calculations predicted. He concluded that this CH4 was not of mag
matic origin, but was added to the original gases at a shallow
point beneath the ground, and did not establish equilibrium with
the other components before reaching the fumarole outlet.
According to the previous discussion, however, reactions between
these rising gases should be fast enough that at least an approach
to equilibrium would be achieved. The concentration of methane
found in the drill hole samples remain an anomaly.
The components listed in Table VII represent only those gases
found in the actual analyses atter corrections for air contamina-
tion. A large number of related compounds that might be expected
in a volcanic gas system were also included in the calculations.
These comprised compounds of nitrogen and of sulfur, the halogen
acids, and metal halides. The latter tvo groups of compounds will
be covered in the discussion of sublimates.

133
In the past, discussion of the very important component,
nitrogen, in magmatic gas has always centered around the gases
N2
and NH3
and the equilibrium:
N2
+ 2H3
= 2NH3
Considering N2, H2 and NH3
independently of the other gases in
a volcanic gas system, Ellis58 has shown that NH3 would be ex
pected at temperatures below 400~ and at increased pressures,
would become more stable at higher temperatures. Matsuo,96 study
ing this same equilibrium, considered the possible role of NH4+ and
concluded that its contribution would be negligible. Free energy
data for NH4 (as the gaseous ammonium ion) has recently become
available94 and was incorporated into the equilibrium calculations
of this study elong with N2 and NH3
data. There is direct proof
of the existence of NH3
or NH4 in the gases of Hawaiian volcanoes,
ammonium compounds having been found in the sublimates (NH4Cl)97
and in the fume «NH4)2S04)98 associated with these volcanoes. In
+addition NH4 ion has been found in the water eluate of the silica
gel in the collecting tubes of this investigation.
Originally the N2 content of the analyses in this work were
corrected for atmospheric N2 according to the amount of 02 found
(assumed to be completely atmospheric) and the air ratio of these
two gases. This often left a large amount of N2 (greater than 10
mole percent). Preliminary equilibrium calculations were made
using these large concentrations of N2
and 10-3 mole percent for
NH3 and NH4 in the starting composition. In the resulting
equ1+ibrium composition, N2
changed very little, while NH3 became

134
very small (10-10 ) and NH4 increa.sed by a fa.ctor of ten. This
surprising situation was explored further in the present set of
calculations. All gas an~ses now are corrected by assuming all
N2 found (as well as O2 ) to be atmospheric, as has been indicated
by isotopic studies,89 00 smaller starting concentrations were
used for N2 in equilibrium calculations (10-4 and 10-2 mole per
cent). Starting compositions tor NH4 and NH3 were 10-4 mole per
cent and 10-9 mole percent respectively. These were guesses; the
NH3 was started very small according to the results of the pre-
llminary calculations. The resulting equilibrium calculations are
summarized below:
Starting Equilibrium Starting EquilibriumComponent Composition Composition Composition Composition
4000K l4000K 4000K l4000K
N2 10-4 10-56 10-31 10-2 10-43 10-28
NH3 10-9 10-21 10-21 10-9 10-18 10-20
NH4 10-4 3xlO-4 3xlO-4 10-4 10-2 2xlO-2
(Concentration in moles percent)
It is obvious from these results that NH4 is the important form of
nitrogen in the volcanic gas systems studied, while N2 and NH3 pl8\Y'
very minor roles.
Previous studies by E1lis58 and Heald et al.,4 have investi
gated, theoretically, the role that would be pl8\Y'ed by a variety
of sulfur compounds that either have been found in volcanic
gases or that might exist in such systems in trace quantities.
A similar group of compounds were included in the present study
(H2S, 802 , S2' COS and C82 ). In addition two other elemental

135
forms of sulf'ur (S and Sa)' for which free energy data are now
available, were included in this study, to determine which form
'Would be more likely at the various temperatures involved. The
results are in general agreement with what Ellis and Heald found,
and are summarized as follows:
a. The chief sulfUr gases are H2S and S02' with H2S more
prominent at low temperatures.
b. At temperatures of 1200<>.1< or greater the presence of COS
and S2 in the gas phase becomes probable.
c. CS2 , S, and Sa are very small at all temperatures (10-7
mole percent or less).
3. Equilibrium and the trends in a drill hole
It was noted in section III-D-l, that the trend in the ob-
served composition with depth (temperature) in drill hole No. 14
samples, 72, 73 and 74, (decreasing H20 and increasing H2
, CH4
,
CO2 , H2S and S02) could not be completely explained as due to the
effect of temperature changes on an equilibrium mixture. The
theore\tical variations, that the observed trends were expected to
follow, were determined by calculating a series of equilibrium
compositiona at the temperatures found in this drill hole, using
the analysis of the sample taken at 11 feet (sample 72) as the
starting composition. This would be a correct approach if it
could be assumed that nothing was added to the gas mixture
moving upwards in the drill hole. If an admixture of water or
air occurred at one or more points in the upper reaches of the
hole, the effect on the calculated equilibrium mixture tor the

136
temperature at that point (starting with the observed composition
at 11 feet) 'Would have to be considered.
To test this idea, Table VIII has been compiled. The composi
tion at 11 feet (sample 72) is shown in the first column. In the
second column the corresponding·equilibrium composition has been
listed. Using the composition in column 1 as a starting point,
the equilibrium values at approximately the same temperature found
at a depth of 5 feet are shown in column 3. In column 4, the
actual comPosition found at 5 :feet in drill hole 14 is shown. A
considerable difference is noted, especially in the amount of H20
present in each case. A sample collected at a shallow depth (9l-MD
20) and having a high water content was used to calculate the
equilibrium composition that would be expected at 5 feet (800~)
and this is listed in column 5.
A comparison of column 4 with the columns on either side of it
shows that the observed composition at the 5 foot level in drill
hole 14 is in bette:r agreement with the equilibrium composition
calculated from the shallow sample (column 5) than with the
equilibrium values determined with the deep sample concentration
(column 3). It would appear then that the compositional trend
in drill hole 14 could reasonably be due to the effect of water
(perhaps meteoric water) seeping into the upper portion of the
drill hole and mixing with the gases present. This water addi
tion, as well as any temperature change, must be considered in
calculating the equilibrium composition of the drill hole gas.

• 0 .. Observed composition, mole percent.
C IS Calculated equilibrium composition, mole percent.

138
4. Extension of the equilibrium studies to sublimates
It was pointed out in Section I-A-3 of this paper, that the
most likely role of volcanic gases in the formation of ore
deposits is that of a transport mediwu. Because sublimates are
known to contain most ot the metals commonly found in ore
bodies, these deposits provide the best direct evidence for a
gaseous transport of ore forming metals.
The preliminary experimental work on the collection and
analyses of sublimates from the gas sampling s1tes has revealed
a nwnber of problems, chief of which is the low concentrations of
these substances involved. It was discovered that most of the
"ultrapure" silica gel used in the BEUnpling tubes was contEUni-
nated with some of the compounds being sought: + +3 +NH4' Fe , H ,
Cl-, eu+2. d 80-2EUn 4. In most cases then, nothing was left when
the background was subtracted. In the later stages of the work,
when highly purified silica gel with a low background was used,
the concentration range of the sublimates found was at the very
limit of detection. To complicate the situation it was discovered
that the washing procedure did not completely remove all of the
chloride from the silica gel, resulting in low values for this
important anion. In the few cases where Bome values were ob-
tained there was some difficulty in making use of the data. Be-
cause one has no idea of how much of each cation goes with the
anions found it is difficult to arrive at a concentration that
will be meaningful. In spite of these difficulties, enough in-
formation was obtained to provide values for the starting composition

139
of the computer calculations. The particular sublimate compounds
that could be included in the computer program depended on the
availability of the free energy data for the compounds. Since
free energy data is lacki~ for many of the NH:, eu+2 , Mn+2 and
804-2, compounds found in the sublimates, these could not be in
cluded in the equilibrium calculations. The compounds that have
been used are listed in Appendix II with the program:
The calculations were made using sample number 12 (Table II)
for the starting composition. The sulfUr and nitrogen compounds
-9 -4were started at 10 mole percent, except for NH4
and N2
at 10
mole percent. The technique for selecting the starting composition
of the sublimate compounds is outlined as follows:
a. All of the sublimate compounds (the metal chlorides,
fluorides, and oxides), HBr, HF, MgS, and S10 vere started at
10-9 mole percent, and Hel as 1.0 mole percent. From this
first run one could determine which compound in a series would
be the most likely form to be present in an equilibrium system.
For example, FeCl, FeC12 and FeC13 were started at 10-9 end in
the resulting equilibrium composition FeC12 increased while the
other two became smaller by several powers of ten.
b. For each component in a series that increased, a new
starting composition ~ selected based on the computational
trend and on the estimates made from the analyses of the sub-
limates and the silica gel washings. A value for HF was
estimated from the data of Murata4l on F:Cl ratios in Hawaiian
gases and the value of Cl estimated from the elution analysis

140
of the sampling tube silica gel. These compounds and the
estimated concentration used are as follows:
HelHFFeC12CuClMgC12TiOClNaCl
1:1 1.0 mole percentII 4 x 10-3= 0.05a 0.01a 0.15=0.06= 0.18
The effect of increasing the starting composition of these
dominant sublimate species on the concentration of all other
components was very slight. The equilibrium concentrations ot the
major components changed very little at each temperature. The
.concentration ot each ot the other members ot a series ot metal
compounds increased, but in proportion to the composition ot the
dominant species in that particular series. The silicon com-
pound, SiO, was not included in this study, although it was run
with the program. As there were no other silicon compounds, the
concentration ot SiO did not vary trom the starting value (10-9
mole percent). Work vith the mass spectrometry of molecular
beams trom solid.s hea.ted to high temperatures has revealed the
presence ot many compounds in the high temperature gas phase which
may seem unusual to those schooled in aqueous chemistry. Many
such substances are pertinent to sublimates in volcanic gas
systems, and where thermodynamic data was available these vere
included in the calculations. One ~ point to such substances
as NH4' discussed previously, and to CuCl, FeF, Feel, MgCl,
~C13 and ZnCl as examples. These calculations show that in
some cases these unconventional compounds would have a relatively
141
high partial pressure in an equilibrium combination typical of
volcanic systems.
Samples of sublimate have been extracted from various levels
in the lava lake drill holes, and the salts present have been
extracted by solvents and analyzed by Dr. R. Goguel. 77 In the
earliest stage at which such collections were made (August 1966),
all metals were found to be present as chlorides, with some
secondary sulfates and unidentified alumino-silicates. A rough
estimate of the relative abundances of the sublimate salts at
various temperature levels in the drill holes could be made from
this work. This showed that NaCl and KCl were most abundant in
the hottest zone (hypothermal), CUC12
and ZnC12 in the inter
media.te zone (mesothermal), and FeC12 , MnC12
and Ca and Mg chlorides
and sulfates in the coolest zone (epithermal). This distribution
compares favorably to the presence of compounds of these elements
in ore bodies, in relation to their position relative to the hot
intrusive which presumably was the source of 'the ore substances.
Also it is in general agreement with the equilibrium vapor pres
sure of the chlorides of these elements in volcanic equilibrium
mixtures, where available data enabled the calculation of such
compositions.
The full extension of equilibrium calculations to sublimates,
and the utilization of this powerful tool in identification of
transport species and their sequences, must await the availability
of thermodynamic data for all compounds possible in such systems.

IV. CONCLUSIONS
The f'ollowing conclusions are reached as a result of' the re
search on volcanic gases presented in this dissertation:
A. Regarding the gas collecting techniques
1. An excellent method of' collecting volcanic gas samples
from any depth in a drill hole was f'ound to be the use of
an insulated silica gel sampling tube combined with a
sampling tip pull-off wire.
2. Air contamination of volcanic gases collected f'or this
study resulted during that time when the sample was removed
from the gas vent and before sealing could be accomplished.
B. With regard to the gas analyzing system
1. A precision quartz bourdon tube pressure gauge is a
major improvement in convenience and accuracy over the
mercury manometer generally used for making gas pressure
measurements in an~'zing systems.
2. The by-pass valve-syringe injection techniqul! pro
vides a fast, r9producible calibration method, but cali
bration via the measuring system and sample loop should
be more accurate.
3. The following recommendations are Buggested for future
work with the gas analyzing system:
a. In order to determine the minor components in a
volcanic gas sample, more sensitive detectors Yould
be needed, such as a micro-volume thermistor detector
or an ultra-sensitive He ionization detector.

143
b. An improvement in accuracy and precision of the
results could be achieved through mOl'tl accurate peak
area measurement by means of an electronic digital
integrator.
c. With regard to the gas samples collected during the course
of this investigation
1. The compositiona! variations in gas ana.1:y'ses from
sample to sample and source to source mB\Y' be explained by
any one or all of the following:
a. Air contamination of the sample.
b. Poor precision and accuracy in the gas ana.1:y'ses.
c. The effect of temperature changes on gaseous
equilibrium systemn.
d. The effect of the admixture of water on a gaseous
equilibrium system.
2. The oxygen and nitrogen found in gas samples from
each site is atmospheric air r's.ther than air dissolved in
ground or meteoric water.
3. The degassing trend of Makaopuhi lava lake with time
maiY be explained as a two step process:
a. A rapid and abundant eXBo1ution of gas from a lava
supersaturated with magmatic gases.
b. Afterwards, a constant rate of degassing fed by
gases from a "second boiling" process.
4. The degassing of the 83 :fumarole area may ha.ve followed
the same process as at Makaopuhi lava lake, but on a much
shorter time scale.

144
5. Sampling as :frequent as once a week may be necessary
to determine if' variations in the gas composition at
primary :t'umaroles (such as Sulfur Bank) can be used to
predict volcanic eruptions.
6. Systematic sampling and analysis should yield in
f'ormation on the link between certain :fumaroles and the
volcano, and on the nature of' the gas source.
7. No explanation can be presented f'or the presence of'
methane in the Makaopuhi samples.
8. The argon and helium as f'ound in the gas samples are
of' atmospheric origin.
9. The preliminary examination of' condensable gas frac
tions f'or unsuspected organics shows indication of'
interesting compounds and should be extended.
10. The collection and an~sis of' sublimates from drill
holes and on the silica gel tubes should be made a major
part of' the study of' volcanic gas systems.
D. With regard to the thermodynamic equilibrium studies
1. The major volcanic gases issuing from Sulfur Bank,
S2 fumarole, and Makaopuhi lava lake, represent, in
general, equilibrium compositions.
2. The dominant nitrogen species in volcanic gases is
NH4; N2 and NH3 play only' a small role.
3. With the presently available tree energy data and
knowledge of' sublimate concentrations, it is not possible

145
to determine more than which metal compound of a series
(FeCl. Fec12• FeC13
) would be most probable in a gaseous
ore transport phase.

V. SUMMARY
A chemical study has been made ot Hawaiian volcanic gases from
a variety ot sources at Kilauea volcano on the island of Hawaii.
These can be listed as tollovs:
1. The molten surtace ot a lava lake as it was forming
in Makaopuhi pit crater during the 1965 flank eruption.
2. Gas from the holes drilled through the crust ot the cooling
lava lake at Makaopuhi crater by the staft of the Hawaiian
Volcano Observatory. U. 8. Geological 8urvey.
3. G8bes f'rom the piped-vell at Sulfur Bank tumarole.
4. The natural venting gases ot a solfatara (82) on the east
rim of Kilauea Caldera.
5. The steaming area (83) between the Alai and Aloi pit craters
on the east rift zone of Kilauea Volcano.
The gases were collected in evacuated. silica gel sampling tubes.
For the drill holes the sampling tube vas sheathed in a quartz jacket.
Samples vere opened by means of a pull-oft vireo
Gas anaqsis vas carried on by means of gas solid chromatography.
using molecular sieves 5A and silica gel columns to separate the gases:
He and H2 • Ar and °2 , N2 • CH4• and CO on the molecular sieves.
and C02' H~. and S02 on the silica gel.
Investigations were made to determine the source of air contamina
tion in the samples. by considering the sampling techniques and the
possibility ot air entering the gas sour~ee.
The lava lake sample compositions have been discussed in regard to
the trends vith depth in a drill hole. vith position ot drill holes on

the lava lake, and with time. A great variability in camposition vas
noted for s8mJ?les from one site to another. This has been attributed
to air contamination, poor analyses, and the effect on an equilibrium
canposition ot temperature changes and vater influx. The cOlD.pOsi-
tional variations of the lava lake gases were related to the de-
gassing processes of a cooling rock body. The 83 f'umarole appeared
to show trends indicative ot the same process of degassing ot a small
molten rock. flOW' or body.
Sulfur Bank and 52 fumarole aneJyses were examined tor changes vith
time that could be used to predict volcanic eruptions. The results
vere inconclusive.
Chemical equilibrium calculations were made by computer, using a
method of calculation based OIA minimizing free energy. The major gas
sources samples were examined and found to represent, in general,
systems in thermo~am1c equili"rium. The important nitrogen gas system
+vas studied and NH4 radical was found to be tEe most likely nitrogen gas
under equilibrium conditions.
Results from a preliminary program of collection and analysis ot
sublimates i~ th6 Jrill holes and absorbed on the silica gel tubes
vere used to conduct a stu~ of the equilibrium conditions in a
volcanic gas phase that included sublimate compounds. An indication
ot the torm in which some such solids vere transported vas obtained.
In add!tion the levels of condensation of the compounds in the drill
holes followed that expected trom the partial pressure of those sub-
etrmces a.t the temperature of the respective levels. These studies

were limited by the lack of the:nnodynamic data for Dl8I1Y sublimate
compounds. When these become available, the application of thermo
d;ynamics to the stud1' of ore-b~ forming processes can be greatly
extended.
148

APPENDIX I
Calculation of Gas Sample Composition by Computer
The program for calculation of the mole percent of each component
in an analyzed gas sample is presented here. Fortran IV computer
language was used to write the program for the IBM 7040 computer of
the University of Hawaii Computing Center. The gases included are:
H20, He, H2, Ar, 02' N2, CH4, CO, CO2 , H2S and S02. The meaning of
the symbols used in order of appearance in the program follows:
AREA(I) ca chromatogram peak area.
AMOLE(I) =moles of a particular gas in the sample loop.
BMOLE(I) =moles of a particular gas in the permanent or
condensable gas fractions.
PCMOLE(I) =mole percent of a gas in the sample.
AFP(I) =mole pe:r.~ent corrected for air contamination.
CORG(K) ca moles of a particular gas corrected for air
contamination.
FG(K) = CORG(K).
M ca number of gases analyzed, excluding water.
Pl and P3 =pressure of air in the expansion bulb, for
system volume determination.
P2 and p4 =pressure after expansion of air from the bulb,
for system volume determination.
PPERM =presBure ot the permanent gases.
PCOND =pressure of the condensable gases.

150
VCOND I: volume of the sampling loop.
VTUBE 1:1 volume of the breakseal tube.
WH20 1:1 weight of water in the sample.
NOS I: sample number.
VSYS 1:1 volume of the system.
VPERM 1:1 volume of the permanent gases.
TMPERM I: total moles of permanent gaB~S.
TMCOND 1:1 total moles of condensable gases.
TMH20 1:1 total moles of water.
PCH20 -= mole percent of water.
TALL 1:1 chromatogram peak height.
W 8:1 chromatogram peak width at half-height.
ATT = recorder attfmuation.
PGl 1:1 pressure of an aliquot, of' gas in the sample loop.
SLOPE 1:1 slope of the calibration curve for a particular
gas.
S02L ::t peak. height for the oxidized sulfur film (S02).
PRUN 1:1 pressure of an aliquot of the oxidized gas.
POXID 8:1 total pressure of the oxidized gas.
VOXID 1:1 volume of the oxidized. gas-.
AIRHE 1:1 portion of He in the sample that is to be sub
tracted as air contamination (similarly for
AIRH2, AIRAR, etc.).
PCAIR 1:1 mole percent of air contamination.
AFG I: total moles of air-tree gas.

Numerical factors:
2.306E6 c the gas constant ( R ) in terms of degrees of
rotation for pressure readings by the quartz
Bourdon tube.
2500 :::I necessary to convert peak areas to square inches,
the unite used in the calibration curves. The
peaks are measured with a Bcale of 50 units per
inch.
151
The atmospheric ratios of He, H2 , Ar, etc., to N2 are included
in the program to determine the amount of air contamination, i.e.,
AIRHE, AIRH2, AIRAR, etc. The symbol NAR may be ignored.

H20,11
H
DIMEDSION AREA(10),AMOLE(10),BMOLE(10),PCMOLE(10),AFP(10),COBG(6),1F'G(6)
4U-1WRITE(6,9)
9 FORMAT(lHl,17H1 VOLCANIC GAS ANALYSIS, !!!73H2 MOLE PER CENT,!!TH SAMPLE, 4x,11H3 ,llH 'HE ,llH H2 ,llH AR ,11H 024H N2 ,llH CH4 ,llH CO ,llH C02 ,llH528 ,liB 802 ,IIf)
33 READ{5,6)M,?1,P2,P3,P4,PPERM,PCOHD,VCOBD,VLOOP,VTUBE,WH20,NOS,NAR6 FORMAT{I2,6F7.3,F7.2,2F5.2,F7.4,I4,I2)
IF(M.EQ.99)STOPVSYSl-601.7*(P1-P2)/P2VBys2=601.7*{Pe-p4)/PrVSYSA-(VSYB1+VSYS2)!2"!VPERM-VSYSA+V'roBETMPERM-~!2.302E6TlICOMD-PCOJDItVCOID!2.302E6TMR20mWH20!18.02TMG.ASzaTMPERM+'DlcoND+TMHfoPCH2Oa(nm20 /'J.'tI'IJAS) *100 ~
D02I-1,MREAC(5,7)TALLpW~,PG1,SLOPE
7 FORMkT(2F7.1,F4.0,F7.3,E8.2)IF(TALL.EQ.O.)BMOLE(I)=O.IF(TALL.EQ.Q.)PCMOLE(I)aO.IF(TALL.EQ.O.)GO TO 2IF(I.GT.~)GO TO 55AREA(I)-TALL-W*ATT!2500.AMOLE{I)=ARF..A(I)*SLOPEBMOLE(I)=(PPERM*VPERM!(PG1*VLOOP»OAMOLE(I)PCMOLE(I)~(BMOLE(·)!TMGAS)*lOO.
GO TO 255 AREA(I)=TALLOW*ATT!2500.
AMOLE{I)-AREA(I)*8LOPE I-'\J'II\)

BMOLE(I )=(PCOzmttv'COND!(PG1ttvLOOp) ).AMOLE( I)PCMOLE(I)=(BMOLE(I)!TMGAS)*100.
2 CONTINUEREAD(5,8)S02L,W,ATT,PRUN,POXID,SLOPE,VOXID
8 FORMAT(2F7.1,F4.o,2F7.3,E8.2,FT.2)IF(S02L.EQ.O.) GO TO 15SAREA=S02L-W*ATT!2500.SK>LEl.=SAREAttsLOPESMOLE2=( (POXID*VOXID)!(PRUNttvLOOP) )*SMOLEIBMOLE(9)=BMOLE(9)+(SMOLE2!3.)*2.BMOLE(lO)==BMOLE(10)+SMOLE2!3.PCMOLE(9)=(BMOLE(9)!TMGAS)*lOO.PCMOLE(lO)-(BMOLE(lO)!TMG1\s)*lOO.
15 IF(NAR.EQ.1) GO TO 1111 AIRHE = PCMOLE(5)*2.9E-5
AIRH2 == PCJ«)LE(5)*6. 4E-1AIRAR I: PCMOLE(5)*1.19E-2AIRCH4 a PCMOLE(5)*2.6E-6AIRC02 I: PCMOLE(5)*3.8E-4PCAIR I: AIRHE+AIRH2+AIRAR+AIRCH4+AIRC02+PCMOLE( 4)+PCMOLE( 5)COOO(l) = PCMOLE(l) - AIRHE0000(2) I: PCMOLE(2) - AIRH2ooRG(3) I: PCMOLE(3) - AIRARCORG(4) =o.0000(5) = PCMOLE(6) - AIRCH4CORG(6) == PCMOLE(8) - AIRC02DO 40 K I: 1,6roCK) = O.IF(CORG(K).GE.O.)FG(K) = CORG(K)
40 CONTIBUEAFG == FG(1)+FG(2)+FG(3)+FG(4)+FG(5)+FG(6)+PCMOLE(1)+PCMOLE(9)+PCMO
1LE(lO)+PCH20APP(l) =(PCH20!AFG)*100.AFP(2) I: (FG(1)!AFG)*100.AFP(3) = (FG(2)!AFG)·100.AFP(4) = (FG(3)!AFG)*lOO.
~VIW

AFP(5) = (FG(4)/AFG)·100.All'P(6) =: (FG(5)/AFG)*lOO.APP(T) =(PCMOLE(T)/AFG)·lOO.APP(8) • (FG(6)/AFG)*lOO.AFP(9) = (P~LE(9)/AFG)·100.AFP(lO) = (PCMOLE(lO)/AFG)*loo.GO TO 22 '
20 PCAIR = O.DO 24 K=I,6CORG(K) =o.
24 CONTINUEDO 28 I=I,lOAFP(I) =o.
28 CONTINUE22 WRITE(6,lO)NOS,VSYSA,TMPERM,TMCOND,TMGAS,TMH20,BMOLE,PCH20,PCMOLE,
lPCAIR,CORG,AFP10 FORMAT(lX,I4,3X,13HSYSTEM VOLm.fE,2X,lPE12.5,3X,14HMOLES PERM GAS,2
lX,E12~5,3X,l4HMOLES CONn GAS,2X,El2.5,3X,l5HTOTAL MOLES GAS,2X,E122.5/3X,5HMOLES,3X,1lE1l.4/2X,7HPERCENT~2X,11Ell.4/4x,3HAIR/3X,OPF5.32,21,12HCORRECT GAS , lP3E1l. 4, llX,2E1l. 4,llX,Ell. 4//21,7HPERCENT, 24x,4E11.4,llX,6Ell.4//)'N=N+lIF(N-6)33,33,4END
I-'VI.f:'
APPENDIX II
Compu.ter Progr8.1ll tor Calculating Chemical
Equilibria in Gas Mixtures
The Fortran IV computer program used tor the calculation ot -
thermodyllamic equilibrium compositions ot volcanic gases is pre
sented here. It should be noted that the program is completely
general; it will work with any gas mixture. This program, origi
nally written by Heald,92 has been slightly modified to handle 15
elements and 40 compounds or those elements, which requires that
the IBM 360 computer be used rather than the IBM 7040, due to the
insUfficient "memory" of the latter machine. All symbols and
terms used are defined within the program.

C 1 H2OC 2 H2C 3 02C 4 N2C 5 CH4C 6 coC 7 CO2C 8 H2SC 9 802C 10 8C 11 82C 12 88C 13 COSC 14 C82C 15 NH3C 16 NH4C 17 HCLC 18 coer.C 19 FECLC 20 MGCLC 21 NACLC 22 TICLC 23 TIOCLC 24 ZNCLc 25 FECL2C 26 MGCL2c 27 FECL3C 28 CU3CL3C 29 HFC 30 F:P.FC 31 MGFC 32 N~F
C 33 FEF2...V1
c 34 MGF'20\
C 35 FEOC 36 MOO

C 37 MGSC 38 HBRC 39 SIOC 40 ZnBrC DEFINITIONS OF TERMS USED IB THIS PROGRAMC LIMIT TOTAL NO OF CALCULATIONS IB A GIVEN RUNC Q LIMITS THE CHANGES IN MOLE NUMBERSC UWC MAX NO OF PHASES(=l)C BPHASE NAME OF PHASE(GAS)C JMAX MAX NO OF ELEMENTARY COMPONENTS IB DATA TABLEC NATOMS NAME OF ELEMENTC ITMAX MAX NO OF TEMPERATURES IN DATA TABLEC T TEMP TEMP = TEMP IN DATA TABLEC IMAXLE NO OF COMPOUNDS IN TABLEC NAME NJ.I\ME OF COMPOUND m TABLEC A(I,J) NO OF GRAM ATOMS OF ELEMENT J IN 1 MOLE OOMPOUND IC FZERO STD GIBBS FREE ENERGYC QD CHANGE IN Q DEFINING JUMP TOWARD EQUI COMPC QL LOWEST VALUE OF QC QA PARAMETER DEFIlfING PRECISION OF EQUI MOLE NUMBERSC NOL MAX NO OF ITERATIONSC LG INDEX OF GAS PHASEC INDEX HEADING OF CALCULATIONC INDMAX NO OF WORDS IN HEADING, 360 WORD = 4, NORM = 54 = 3 CARDSC P PRESSUREC JR MAX NO OF COMPONENTS IN DATA TABLEC LR MAX NO OF PHASES IN DATA TABLE . ALWAYS = 1C IR(L) MAX NO OF COMPOUBDS IN PHASE L IC JFIX SELECTION NO OF OOMPOliENTS IN DATA TABLEC LFIX SELECTION NO OF PHASES IN CALCC IFIX SELECTION NO OF COMPOUNDS IN CALCC Y STARTIBG VAWE OF MOLE NUMBERC IDEAL(L) IDEAL SET GREATER THAN 0 TO TREAT PHASE L AS IDEALC PROGRAM M
~VI~

C PROGRAM FOB CALCULATIOIi OF CHEMICAL EQUILIBRIUM COMPOSITIONSC III SYSTEMS OF UP TO 10 EL1!24ElITARY COMPONENTS Am> UP TO 10 PHASES.C BOB-IDEALI'fi OF .AllY OR ALL PHASES.C BOB-IDEALIft OF .AllY OR ALL PHASES.
BEAL-S liAMEDIMEBSIOB Y(45,20),YBAR(20),DEL(~5,20),A(~5,20,20),B(20),IMAX(20),
1IBDEX(1~),HATOMB(20),BPHASE(20),FIDEAL(~5,20),
2FZERO(45,20),~(45,50),PIJ(45,20),DEBAR(20),EXCESS(45,20),
3ALP.HA(45,50),PI(45),U(20),IDEAL(20),x(45,20),W(~5,20)~XBAR(20),
4ALPHAV(2250)OOMMOI NAME(45,20)~X,EXCESR,LAC8BO.IMAX,
1 LM, I, lZERO, A, T, P, 1iPHASE, LMAX, JR, QD,2 QL. QA, BATONS, DiDfAX, IBDEX, IDEAL, BOL, LG
C LIMIT , TOTAL lIUMBER OF CALCULATIONS III A GIVEN RUNREAD 17, LIMIT
17 FORMAT (15)
III - 010 BO ra 0
OVER - O.BO'I'MDl = 0BOT ra 1
C DiPOT DAn PROVIDED BY SUBROUTINE INPUTCALL INPUTDI-IJ(+LJMAX - JR + IHAX!MAX .. JMAX + 1JSraJR+1
C CALCULATIOB OF MATERIAL BALANCE COBDITIONSDO 1006 J .. 1, JRB(J) - O.DO 1006 L • 1, LMAXIMAXL .. IMAX( L)DO 1006 I .. 1, IMAXLB(J) .. B(J) + A(I~L,J) • Y(I,L)
....VIco

1006 COBTIlIUED01150 L :: 1, DlAXIBAB(L) • O.IMAXL • IMAX( L)OOll50 I III 1, IMAXLYBAR(L) • !BAR(L) + Y (I,L)
1150 COBTIlIUEC CALCULATIOll OF FREE EliERGIES
11 F'.l'OT • o.DO 200 L a 1, uaxIMAXL =IMAX(L)DO 141 I • 1, IMAXL
141 X(I.L) • Y(I.L) / YBAR(L)DO 130 I • 1, IMAXLJi"nMP .. FZERO(I,L)/ (1,98646t1T)FIDEAL(I,L) 1:1 Y(I,L) • (FTEHP + ALOG (X(I,L»)IF (L-LG) 130, 170, 130
170 FIDEAL(I,L) • FIDEAL(I,L) + Y(I,L) • ALOG(p)C CALCOLATIOB OF BOB-IDEAL CON'rRIBUTIONS TO FREE ENERGIES DONE mC SUBROUTIBE M1fiVC VERSIOB OF A~ SUPPLIED HEREWITH IS A DUMMY I FOR THE PURPOSE OFC PERMI'TTIllG COMPILATIOB OF THE PROGRAMC IX .ACTUAL FAc:r, THEri THIS PROGRAM CAJilllOT COBSIDER BOll-IDEALC PHASES. WORKIBG VERSION OF Ac:rIV WILL FOLLOW LATER.C MUCH LATER, I FEAR.
130 EXCESS (I,L) • O.IF (IDEAL(L» 142, 142,150
142 LAC • LCALL A(JJ!!V
150 DO 151 I • 1, IMAXL151 F'lO'l • PTOT + FIDEAL(I,L) + EXCESS(I,L)200 COBTIlIUE201 IF (NOTMIB) 301, 202, 301202 IF (BOT) 301, 301, 203203 IF (lio-BOL) 210. 301. 301210 NO • NO + 1
....VI'0

C SlS'l'.fING UP OF MATRIX. DEFDUBG SE'.r OF SD$4'AlfEOUS SYMMETRICC LINEAR EQUATIONS
211 DO 300 K a 1, KMAX212 DO 300 J III: 1, JMAX213 ALPHA(J,IC) .. O.220 IF (K-JR) 240, 240, 230230 IF (K-KMAX) 250, 260, 260240 IF (J-JR) 210, 210, 271250 IF (J-JR) 241, 241, 300260 IF (J-JR) 281, 281, 251270 IF (K-J) 261, 261, 241241 ALPHA(J,K) - ALPHA(K.J)21J2 GO TO 300251 L5 .. J-JR
IMAXL .. IMAX(L5)DO 252 I a 1. IMAXL
252 ALPHA{J,IC} a ALPHA(J,K) + FIDEAL(l.L5) + EXCESS{l.L5)2511 GO TO 300261 DO 263 L .. 1, DlAX
IMAXL iii D(AX( L)DO 263 I .. 1. IMAXL
263 ALPHA(J,K) a ALPHA(J,K} + A(I,L.J) • A(l,L.K) • Y(l.L)2611 GO TO 300'271 L7 &: J-JR
IMAXL III: IMAX(L1)272 DO 273 I =1. IMAXL213 ALPHA(J.IC) iii ALPHA(J,K) + A(l,L7.K) • Y(l,L7)214 GO TO 300281 ALPHA(J.K) 1:1 B(J)282 DO 284 L III 1, DfAX
DfAXL .. IMAX(L)283 DO 2~ I 1:1 1. IMAXL284 ALPHA(J,K) 1:1 ALPHA(J.K) + A(I,L,J) *(FIDEAL(I,L) + EXCESS(I,L»3()') COIiTIBUE
GO TO 18
....0\o

301 OVER III 1.18 IF (OVER) 12, 12, 14
e SOWTIOB OF SIMULTABEOUS ~UATIONS BY StJBROUTINE SIMQe STORE COEFFICIENT PART OF MATRIX ALPHA III VECTOR ALPHAV
12 CALL ARRAY (2, JMAX, JMAX,45 , 50,.ALPHAV,ALPHA)e STORE CO:SSTAIT COLlOOi OF ALPHA IN VECTOR PI AS NEEDED BY SIMQ
00 320 J =: 1, JMAX320 PI(J) - ALPHA(J,KMAX)
CALL SIMQ (ALPHAV, PI, JMAX, BOTMIB)IF(BOTMIN - 1) 9330, 9340, 9330
9340 PRINT 340GO TO 16
.340 FORMAT (lBO, 15HBINGULAR MATRIX)9330 CODTDUE! 13 DO 523 J = JS, JMAX522 LX = J-JR523 U{LA) == PI(J)524 Q == 1.
e CALCULATI01I OF CHANGES IN MOLE NUMBERSe THE PARAMETER Q LIMITS THE CHAIIGES IN MOLE NUMBERS SO THATe 1) ALL MOLE NUMBERS ARE POSITIVEe 2) THE MINIMUM IN THE TOTAL FREE ENERGY IS Bar PASSED
512 DO 600 L = 1, IKAX541 DEBAR(L) == YBAR(L) D (U(L) - 1.)
IMAXL • DIAX(L)513 DO 600 I == 1, IMAXL515 PIJ(I,L) = o.530 DO 531 J = 1, JR531 PIJ(I,L)-PIJ(I,L) + PI(J) - A(I,L,J)
DEL(I,L) D -FIDEAL(I,L) -EXCESS(I,L) + Y(I,L)-(PIJ(I,L) - 1. + U(L1»
550 IF (Y(I,L) + Q-DEL(I,L» 560, 560, 600560 Q • Q • (L. - QD)561 IF (Q-QL) 9964, 550, 550600COli'miUE
~

610 DERFQ m o.620 DO 653 L 1:1 1, IHAX
IMAXL 1:1 IMAX( L)630 DO 653 I :I I, DfAXL640 QUCYl'1:I (Y(I,L) + Q*DEL(I,L» / (Y~(L) + Q*DEBAR(L»642 IF (QOOT.GT.O.) GO TO 643
EXP 1:1 o.EXP Ill: (QUOT-l.) - «(QUOT - 1.)**2)/2.) + «(QUOT - 1.)••3)/3.)DERFQ 1:1 DERFQ + DEL(I,L) * (FZERO(I,L)/(1.98646 * T) + EXP)GO TO 651
643 DERFQ 1:1 DEBFQ + DEL(I,L) * (FZERO(I,L) /(1.98646f1T) + ALOG(QUOT»651 IF (L-LG) 653, 652, 653652 DERFQ 1:1 DERFQ + DEL(I,L) * ALOG (p)653 CONTINUE660 IF (DERFQ) 111, 670, 670670 Q 1:1 Q * (1. - QD)680 IF (Q-QL) 9965, 610, 610711 BOT ::as 0
C CALCULATION OF NEXT-IMPROVED IDLE NUMBERS710 DO 800 L :::r 1, IHAX720 YBAR(L) 1:1 YBAR(L) + QIfDEBAR(L)
D!AXL = IMAX(L)730 ro 800 I 1:1 1, IMAXL740 Y(I,L) III Y(I,L) + Q*DEL(I,L)760 ABEL = Q * ABS (DEL(I,L» - QA * Y(I,L)770 IF (ABEL, ) 800, 800, 780 ,780 NOT 1:1 NOT + 1800 CODTIBUE
GO TO 209968 PRINT 968, INDEX(I), I, L968 FORMAT (1H1, A5,22H DIVISION BY ZERO, I 1:1 , 13, 4HL =, 13)
BO'lKIN = 1GO ro 20 ~
0\I\)

9969 PRINT 969, IIDEX(l), I, L, QUOT969 FORMAT (lHl, A5,36H NmATIVE ARGUMENT OF LOGARITHM, I a , 13,4H L
1-,13/ 10HQUOTIEliT = , lPE12.4)NOTMIB I: 1GO TO 20
9964 PRINT 964, lJlDEX(l}, I, L, DEL(I,L)964 FORMAT (lHl, A5,26H NEnATIVE MOLE BUMBER, I = , 13,4H L =, 13,
1 6H DEL 1:1 , 1PEl2.4)9965 NO'l'MII I: -1
20 IF (BOTMIB) 11, 11, 16920 FORMAT (1H1/(lX,l8A4) }921 P'OBMAT (lBO, 10HGRAM ATOMS / ( A4,lX,lPE12.4})922~ (lBO, 13H'fEMPERATURE • , FlO.3, 2X, 14BDmREES KELVIB )923 FORMAT (lBO, 10HPRESSURE 1:1 , FlO.3, 2X, l.l.HAT.MOSPHER )924 FORMAT (lBO, 9BITERATION , 15)925 FORMAT (I:HO, BHLAMBDA 1:1 , FlO.7 )926 FORMAT (lBO, A4, 6x, 16HPHASE FRACTION - , lPE12.4// 3X, BHCOMPOU
DID , 9X, l.lBMOLE l'iUMBER, TX, 1.3BMOLE FRACTION , 3X, 17HLOG MOLE FR2ACTIOB)
927 FORMAT (lB, 2X, A8, lP2E20.4, OPFl6.5)934 FORMAT (lBO, 19HTOTAL FREE ENERGY 1:1 , lPE20.7)935 FORMAT (liIO, A4 / 3X, 8HCOMPOOlffi, 3X, 17HIDEAL FREE ENERGY , 2X lI
1 18BEXCESS FBEE ENERGY )928 FORMM! (lB, 21:, AS, lP2E20.4)931 FORMAT (lBO, 23HUNKliOWN MULTIPLIERS,PI J(1PE24.4»932 FORMAT (lHO, 22Ht1IIKBOW1f MULTIPLIERS, U / (1PE24.4»933 FOBMM' (1HO, 40HMOLE NUMBERS S'fiLL CHANGIBG BY MORE THAll , F5.2,
18H PERCENT , 15)936 FORMAT (lBO, A4 / 2X, BHCOMPOUBD , 2X, 23HCBJD'IGES IN MOLE NUMBER
18)937 FOmIAT (lB. 2X, AB, 1PE25.4)14 YTOT 1:1 o.
QAX 1:1 100. tfQA ....0\lA)

DO 9935 L 11: 1, LMAXY'l'OT III rooT + Y.BAR(L)DtAXL :I IM.AX(L}DO 9935 I • 1, IMAXLW(I,L) III .ALOG10(X(I,L»
9935 COJiTINUE00 9936 L a 1, LMAXXBAR(L) = YBAR(L) I Y'l'ar
9936 COBTINUEC ,PRIllT-QUT OF THE ABSWERS WILL OCCUR IF .ANY OF THE FOLLOWIliGC COBDITIOBS ARE SATISFIEDC : 1) ITEBATIOB NUMBER REACHES 1.fAXIMUM ALLOWED VALUEC 2} NO MOLE BUMBER CHAllGIm BY K>RE THAN A FRACTIOB QA OF ITSC PREVIOUS VALUEC 3) .ABY FURtHER ClWiGE m THE MOLE NUMBERS WOULD RESULT INC PASSING THE MIl'iIMUM POIBT FOR TOTAL FREE ENERGYC 4) AB ERROR COlfDITIOB(I.E., DIVISION BY ZERO) OCCURSC IF CODDITIOBS 2) OR 3) .ABE SATISFIED, THE EQUILIBRIUM OOMPOSITIOBC IS 0BTAIllED III THE ANSWERS
PBIliT 920, (INDEX(JH), JH • 1, I:llIMAX)PRINT 921, (liATOMS{J), B(J), J III 1, JR)PRINT 922, TPRT~~ 923, PFRIBT 924, NOPRI1i'.r 925, QPRINT 933, QAX, NorDO 1 LillI, LMAXIMAXL lIE IMAX(L)PRIIfT 926, liPHABE(L), XBAR(L}PRI5T 927, (BAME(I,L), Y(I,L), X(I,L), W(I,L), I III 1, IMAXL)
1 C01iT.INUEPRIliT 934, FTOT00 1261 !PI, IloWC ....
0\:':'

!MAXI. III IMAX(L)DO 1262 I III 1, IMAXL
1262 PUNCH 1260, T, N.AME(I,L) ,W(I,L)1260 FORMAT(5x, F5.0, 3X, A8, 4x, Fl6.5)
PRINT 12631263 FORMAT (5X,23HCAROO HAVE BEEN PUNCHED)1261 CONTlliUE .
00 2 LillI, !MAX .IMAXL ., D1AX(L)PRINT 935, NPHASE(L)PRIBT 928, (NAME(I,L), FIDEAL(I,L), EXCESS(I,L), I III: 1, IMAXL)
2 CONTImJEPRINT 931, (PI(J), J =1, JR)PRINT 932, (U(L), L = 1, IlWC)IF (NemaN) 4, 16, 4
4 DO 5 L = 1, IHAXIMAXL III !MAX(L)PRINT 936, liPHASE(L)PRIlfT 937, (B.AME(I,L), DEL(I,L). I III 1, IMAXL)
5 CONT:mtJE16 IF (LM-LIMIT) 10, 15. 1515 srop
END
cccc
SUBROUTIIiE IIiPUT PART OF PROGRAM MSUBROUTIliE FOB READIliG IB I1'iPU'r DATASTABDARD FREE ENERGIES m DAfi TABLE. WITH PROVISION FOR LIBEARTEMPERATURE IBTERPOLATIOBSUBROUTIHE IDPUTREAL-a HAME. LAMEDIMENSION T(20).NPHASE(20).A(50.20).NAME(50).FZERO(45.50).
lNATOMS(20).IBDEX(14o).JFIX(20),LFIX(20),IR(20).IFXI(45.20).2Y(45.20),LPHASE(20).FZAP(45.20).AB(45.20,20). ~
VI

3~(20),IDEAL(20),FAKE(90,20),IFAKE(2)
COMMON LAME(45,20),FAKE,IFAKE,IR,LM,Y,FZAP,AB,TEMP,P,LPHASE,LR,1 JR, QD, QL, QA, LA'l'OMS, IJiDMAX, INDEX, IDEAL, NOL, LG
C LMAX =MAXIMUM NUMBER OF PHASES IN DATA TABLEC NPHASE ,. NAME OP PHASEC .mAX = MAXIMUM BUMBER OF ELDiENTARY COMPOBEliTS IN DATA TABLEC BATOMS =NAME OF EL1!2..fENTC ITMAX = MAX. BO. OF T»n'ERATURES IN TABLE. T II: TEMPERATUREC IMAXLE = NO OF COMPOUNDS IN TABLEC NAME = NAME OF COMPOUliD IN TABLEC A(I,J) .. NO. OF GRAM .ATOK3 OF ELEMENT J IN 1 MOLE OF COMPOUND IC FZERO = STADDARD GIBBS FREE ENERGYC QD = CHANGE IN PARAMETER Q DEFDlIIiG EXTENT OF "JUMP" TOWARDC EQUILIBRIUM COMPOSITION (ANSWER)C QL lIE WWEST ALLOWABLE VALUE OF QC QA = PARAMETER DEFINING PRECISION OF EQUILIBRIUM MOLE BUMBERSC NOL .. MAXIMUM NUMBER OF ITERATIONSC LG .. INDEX OF GAS PHASE
IF (LM ) 100, 100, 200100 READ 7, uwc, (IiPHASE(L), L .. 1, LMAX)
READ 7, JMAX, (NATOMS(J), J a 1, JMAX)READ 9, ITMAXREAD 2, (T(IT), IT .. 1, ITMAX)READ 9, IMAXLEDO liO I =1, IM.AXLEREAD 4, NAME(I), (A(I,J), J .. 1, JMAX)
,liO READ 21,(FZERO(IT,I), IT .. 1, ITMAX): READ 22, QD, QL, QA, NOL, LG
C ABOVE DATA READ IN OBLY ONCE. FOLWWING ARE NEEDED FOR EACHC SEPARATE CALCULATIOli IN A GIVEN RUNC IBDEX = HEADING OF CALCULATIOJi. IBDM.AX = NO. OF WORDS IIIC 1 HEADIIiG (WORD I: 5 CHARACTERS, IBCWDIBG BLAliKS)C Tm.fP III TEMPERATURE. P" PBESSUREC JR, La a MAX. NO. OF COMPOlIENTS, PHASES III CALCULATIONC IR(L) I: MAX. BO. OF COMPOUNDS IN PHASE L
~0\

C JFIX, LFIX, IFIX::I SELECTION NOS. FOR COMPOBE1iTS, PHASES,C COMPOUNDS IN A GIVEN CALCULATIONC Y I:: STARTlllG VAWE OF' K>LE !lUMBER IN A GIVEN CALCULATIONC IN ORDER TO TREAT PHASE L AS IDEAL, SET IDEAL( L) GREATER mAli ZERO
200 READ 9, IHI»oIAXREAD 5, (:amEX( IBD), IIiD ::I 1, IBDMAX)READ li, TEMP, P, ISAMEIF (ISAME) 250, 250, 220
250 READ 8, JR, (JFIx(J), J III 1, JR)READ9,LRDO 210 L =1, LRREAD 6, LFIX(L), IR(L), IDEAL(L)IRL ::I IR(L)READ 10, (IF.XI(I,L), l(I,L), I ::I 1, IRL)
210 CONTINUE220 DO 212 IT :II 1, ITMAX
IF (T(IT) - TEMP) 212, 211, 211211 IDI!' ::I 1'EMP - T(IT)
!DIF =ITGO TO 300
212 CONTINUE300 DO 310 LA I:: 1, LR
LB ::I LFIX(LA)LPHASE(LA) m IiPHASE(LB)IRL I:: IR(LA)DO 310 IA ::I 1, IRLIB • IFXI(IA,LA)LAME(IA,LA) III NAME(IB)FZAP(IA,LA) IS FZERO(IDIF,IB) + TDIF -(FZERO(IDIF,IB) -
1 FZERO(IDIF-l, IB»DO 310 'JA • 1, JRJB =JFIX(JA)AB(IA,LA,JA) ::I A(IB,JB)
310 C01iTINUE~C7\~

DO 320 JA • 1. JRJB • JFIX(JA)
320 LATOMS(JA) • IiATOMS(JB)RETURN
2 POBMAT (mo.6)4 FORMAT (AS. lX. 15F3.2)5 FORMAT (18A4)6 FORMAT (315)7 FO~ (14.17A4)S FORMAT (1614)9 FORMAT (15)
10 FORMIr (15.5X.FlO.9.15.5X.FlO.9.15.5X.FI0.9)11 FORMAT (Flo.6. FlO.9. 110)21~ (TFlO.3)22 FORMAi' (IDO .9. 215)
ElfD
C SUBROUTIliE ACTIV (PART OF PROGRAM M)C OOMMY VERSION. TO PERMIT OPERATION OF MAIN PROGRAM.
SUBROU'l'.IBE MfrIVREAL-S NAMEDIMENSION J(45.20).FREE(45.20).IMAX(20)C<IIMOB HAME(45.20), I. FREE. L. li. !MAXIF (N) 10. 10, 20
10 READ 1.ICOBSTCONm-1CO~T
1 FORMAT (15)20 IMAXL a IMAX(L)
DO 21 I .. 1. IMAXL21 FREE(I.L) .. I(1.L) • COlfST
BETURNEND
~0\(X)

C SUBROU'l'Il'iE .ARRAYCCC PURPOSEC COlfVERT DATA ARRAY FROM SINGLE TO DOUBLE DIMENSION OR VICEC VERSA. THIS SUBROUTIJiE IS USED TO LDiK THE USER PROGRAMC WHICH HAS DOUBLE DIMENSIOll ARRAYS AND THE SSP SUBROUTINESC WHICH OPERATE OB ARRAYS OF DATA IN A VECTOR FASHION.CC USAGEC CALL ARRAY (MODE, I,J,N,M,S,D)CC DESCRIPTION OF PARAMETERSC MODE - CODE IJiDICATIlfG TYPE OF CONVERSIONC 1. - FROM SIBGLE TO DOUBLE DIMENSIONC 2 - FROM DOUBLE TO SIl'lGLE DIMENSIONC I - lUMBER OF ROWS Dr ACTUAL DA1'A MATRIXC J - !lUMBER OF COWMl'fS III ACTUAL DATA MATRIXC B - BUMBEB OF ROWS SPECIFIED FOR THE MATRIX D INC DIMEliBIOBS~C M - lIUMBER OF COLtOOfS SPECIFIED FOR THE MATRIX D INC DIMElfSIOB STATEMENTC S - IF M()])EB1., THIS VECIDR COl'lTAIliS, AS INPUT, A DATAC MATBIX OF SIZE I BY J IN CONSECUTIVE LOCATIONSC COLOMll-WISE. IF MODE=2, IT COBTAIl'lS A DATA~C OF THE SAME SIZE AS OUTPUT. THE LENGTH OF VECTOR SC IS IJ, WBEBE IJ-I-J.C D - IF Jl>DE-1., THIS MATRIX (N BY M) COllTAIliS, AS OUTPUT,C A DATA MATRIX OF SIZE I BY J IN FIRST I ROWS ANDC J COLUMNS. IF MODE=2, IT COBTAIliS A DATA MATRIX OFC THE SAME SIZE AS IBPUT.
~\4:)

e REMARKSe VECroR S CAE BE IN THE SAME LOCATION AS MATRIX D. VECTOR SC IS REFERRED AS A MATRIX IN OTHER SSP ROUTINES, SINCE ITe ccmTAINS A DATA MATRIX.e THIS SUBROUTIBE CONVERTS OBLY GENERAL DATA MATRICES (STORAGEe MODE OF 0).ee SUBROUTINES Ali]) FUNCTION SUBROUTIIfES REQUIREDe BOlEee METHODe BEFER TO mE DIBCU"SSIOli Olf VARIABLE DATA SIZE IN THE SECTIONe DESCRIBDiG OVERALL RULES FOR USAGE IN THIS MAliUAL.ee
SUBROUTINE ARRAY (MODE,I,J,U,M,S,D)DIMENSION S(I),D(I)
eliIaN-1
ee TEST TYPE OF COliVERSIOUe
IF(MODE-1) 100, 100, 120ee OOBVERT FROM SINGLE TO DOUBLE DDlEN3!OUC ~
100 IJmIeJf1liM=UftJoftlDO no !K-1.JIiM=1iM-J1IDO no IIP1,I
I
IJ·IJ-l~1iM-j.
IJ~o

110 D(JiM)=S(IJ)GO TO 140
cC COBVERT FROM DOUBLE TO SmGLE DIMENSIONC
120IJ=OHMaODO 130 K=1,JDO 125 Iir.1,IIJ-IJ+1BM=NM+1
125 S(IJ)=D(NM)130 1iM=BM+1iI
C140 RETURN
END
cccccccccccccccccc
SUBROUTINE SIMQ
PURPOSEOBTAIN SOLUTION OF A SET OF SIMULTABEOUS LIIiEAR EQUATIONS,AXIB
USAGECALL SIMQ(A,B,N,KB)
DESCRIPTION OF PARAMETERSA - MATRIX OF COEFFI"'CIENn:IIInl1~'S STORED COLUMliWISE. THESE ARE
DESTROYED IN THE COMPUTATION. THE SIZE OF MATRIX A 18l'l BY B.
B - VECTOR OF ORIGINAL COllSTABTS (LENGTH If). THESE AREREPLACED BY FIBAL SOLUTIOlf VAWES, VECl'OR X.
l'l - BUMBER OF EQUATIOIfS AlfD VARIABLESKS - OtJTPU'l! DIGIT
o FOR A NORMAL SOWTIOli
...jj

C 1 FOR A SDlGULAB SET nv EQUATIONSee REMARKSe MATRIX A MUST BE GEREBAL.e IF MATRIX IS SINGULAR, SOLUTION VAWES ARE 14EAHIliGLEBB.e All ALTERHAfiVE SOLUTION MAY BE OBTAIBED BY USING MATRIXe IlVERSION(IWiV) ABD MATRIX PRODUCT (GMPRD).ee SUBROUTIliES .AliD FUBCTIOB SUBPROGRAMS REQUIREDe NONEee METHODe METHOD OF SOWTIOli IS BY ELIMINATION USlliG LARGEST PIVOTALe DIVISOR. EACH STAGE OF ELIMINATION CONSISTS OF IBTERCRABGDiGe ROWS WHEN lIECEBSARY TO AVOID DIVISION BY ZERO OR SMALLe ELEMEBTS.e THE FORWARD SOWTIOI TO 0BTAIl'i VARIABLE B IS DOBE INe N S'l'AGES. THE BACK SOLUTION FOR THE OTHER VARIABLES ISe CALCULATED BY SUCCESSIVE SUBSTITUTIONS. FDlAL SOLUTIONe VALUES ABE DEVELOPED IN VECTOR B, WITH VARIABLE 1 in B(1) ,e VARIABLE ~ IN B(2), •••••••• , VARIABLE B IN B(N).e IF NO PIVOT CAN BE FOmlD EXCEEDDlG A TOLERANCE OF 0.0,e THE MATRIX IS CONSIDERED SINGULAR AIm KS IS SET TO 1. THISe TOLERABCE CAN BE MODIFIED BY REPLACING THE FIRST STAT»IENT.e
SUBROUTINE SIMQ(A,B,B,KS)DIMEBBIONA(1),B(1)
ee FORWARD SOLUTIONe
TOL lJI 1.0E-20KS. 0JJ=-liDO 65 J=ll,Ii I-'
~

JY-J+1JJ=JJ+B+1BIGAIIQITcrJJ-J00 30 IaJ,Ii
CC SEARCH FOR MAXIMUM COEFFICIEHT IN COLUMNC
IJIIIIT+IIF(ABS(BIGA)-ABS(A(IJ) » 20,30,30
20 BIGAnA(IJ)lMAX-I
CC TEST FOR PIVOT LESS THAN !OOLERANCE (SINGULAR MATRIX)C
30 COB'fillUEIF(ABS(BIGA)-!OOL) 35,35,40
35 KBm1PRDT 10, IJ, BIGA
10 FOBMAT (lHO,5BIJ III , 15, 5X, 7HBIGA =, 1PE24.4)RETt1IUf
CC DiTERCHABGE ROWS IF NECESSARYC
40 I1aJ+l'l*(J-2)IT=IMAX-JDO 50 K=J,Bnllln-Hi12=I1+ITSAVE-A(n)A(n) a A(I2)A(I2)caSAVE
C I-'~W

C DIVIDE EQUATION BY LEADIIfG COEFFICIENTC
50 A(Il)-A(Il)/BIGASAVE=B(IMAX)B(IMAX)-B(J)B(J)aSAW/BIGA
CC ELIMINATE NEXT VARIABLEC
IF(J-N) 55,70,5555 IQSmIi·(J-l)
DO 65 IX=JY,NIXJ-IQS+IXIT-J-IXDO 60 JX=JY,BIXJXBlIio(JX-l)+IXJJXBlIXJX+IT
60 A(IXJX)-A(IXJX)-(A(IXJ).A(JJX»65 B(IX)-B(IX}-(B(J)*A(IXJ»
CC BACK SOLUTIONC
70 NYmH-l:r.ra-BtIH00 80 Jlllll,NYIAllllIT-JIBaB-JIC=HDO 80 K-l,JB(IB)-B(IB)-A(IA)VB(IC)IAaIA-B
80 IC=Ie-lRETURNEND
....~~

BIBLIOGRAPHY
1. E. T. A11en, "Prelimina.ry tests ot the gases at Sulphur Banks,Hawaii," Bull. Hawaiian Volcano Observatory, 10, 89-93 (1922).
2. T. A. Jaggar, "Chlorine and Volcanism," The Volcano Letter,No. 109, January 27, 1927.
3. J. H. Payne and S. S. Ballard, "The incidence of hydrogen su1f'ideat Kilauea Bolfatara preceding the 1940 Mauna Loa volcanicactivity," Science, 92, 218-219 (1940).
4. E. F. Heald, J. J. Naughton, and I. L. Barnes, "The chemistry ofvolcanic gases, 2. Use of equilibrium calculations in the interpretation of volcanic gas samples," ~. Geophys. Res., 68, 545-557(1963).
5. K. Noguchi and H. Ksmiya, "Prediction of volcanic eruption bymeasuring the chemical composition and amounts of gases," Bull.Volcanolop;ique, 26, 367-378 (1963). --
6. L. V. Surnina and L. G. Voronova, "Value of the investigation ofthe chemical composition of volcanic gases for predicting eruptions," in U.S.G.S. Geophys. Abstracts, 221, 513 (1965).
7. D. E. Hhite and G. A. Waring, "Volcanic Emanations," in "Data ofGeochemistry," 6th edition, M. Fleischer, ed., Geological SurveyProfessional Paper 440, U. S. Government Printing Ottice,Washington, D.C., 1963.
8. K. J. Murata, "Occurrence of CuCl emission in volcanic flames,"Am. ~. Sci., 258, 769-772 (1960).
9. K. B. Krauskopf, "Introduction to Geochemistry," McGraw-Hill, NewYork, 1967, p. 480.
10. P. B. Barton, "The chem1cal~",-,nvironment of ore deposition and theproblem of low-temperature ore transport," in "Researches in Geochemistry," P. H. Abelson, ed., ..Tohn Wiley and Sons, New York1959, pp. 279-300.
11. L. V. Berkner and L. C. Marshal, "The history of growth ot oxygenin the earth's atmosphere," in "The Origin and Evolution otAtmospheres and Oceans," P. J. Brancazio and A. G. W. Cameron,eds., John Wiley and Sons, New York, 1964, pp. 102-126.
12. VI. W. Rubey, "Geologic history ot sea vater" in "The Origin andEvolution ot Atmospheres and Oceans," P. J. Brancazio and A. G.. W.Cameron, Eds., John Wiley and Sons, New York, 1964, pp. 1-63.

116
13. H. C. Urey, "Prim!tive planetary atmospheres and the origin oflite," in "The Origin of Life on the Earth, Symposium ot International Biochemistry (Moscow, 1957)." The Macmillan Co., NewYork, 1959, p. 16.
14. H. D. Holltmd, "Model for the evolution of the earth t s atmosphere,"in "Petrologic Studieo: A Volume to Honor A. F. Buddington,"Princeton University, Princeton, New Jersey, 1962s 447-477.
15. J. H. Dickson, "The volcanological report ot the Royal SocietyExpedition to Tristan du Cunha, 1962. Appendix I, The BiologicalWork ot the Investigation," Philosophical Trans. Royal Soc.,London, Ser. A, 256, 561 (1964). -- -
16. G. C. Kennedy end H. H. Waldron, "Alaskan Volcano InvestigationsReport No.2: Progress ot Investigations in 1946," u. S. Government Printing Office, 1947, 'p. 17.
17. J. W. Judd, "Volcanoes," C. Kegan Paul and Co., London, 1881,p. 215.
18. V. J. Altiere, "Gas Analysis and Testing of Gaseous Materials,".American Gas Association, Inc., New York, 1945, chpts. 5 and 6.
19. A. L. Day and E. S. Shepherd, "Water and volcanic activity,"~ull. Geol. Soc. Am., 24, 573-606 (1913).
20. E. S. Shepherd, "The analysis ot gases obtained trom volcanoesand from rocks," ~. Geol., Supplement, 33, 290-310 (1925).
2l. E. T. Allen and E. G. Zies, "A chemical study of the fumarolesot the Katmai Regior." Natl. Geog. Soc. Papers, Katmai Ser.,No.2, 75-155 (1923).
22. M. Shipley, "The Valley ot Ten Thousand Smokes," Science, 49,589-591 (1919).
23. L. Pauling, "College Chemistry," W. H. Freeman, San Francisco,1955, p. 129.
24. I. L. Grange, "Volcanology, 1921-29," in "White Island,"!. ~. Dep. Sci. Ind~ I!!s. Bull., 127, 25-31 (1959).
25. Ch. E. Stehn, "Volcanic phenomena during the months of Januaryand February 1930," Bull. Netherlands East Indian VolcanologicalSurvey, g, 1-4 (1930r:- --
26. K. N. Phillips, "A chemical study of the fumaroles ot MountHood," Mazama, 18, 44-46 (1936).

111
21. I. Z. Ivanov, "An investigation of the gaseous products of thesatellite volcanoes of the Kliuchevskoi Volcano," Bull.Kamchatka Volcanological Station, No. !, 27-33 (1937).
28. T. A. Jaggar, "Kilauea VolcBDo Laboratory of the University ofHawaii, 1931," Volcano Letter, No. 453, 1-3 (1931).
29. S. S. Ballard, "The volcanic gas problem," Volcano Letter,No. ~, 1-5 (1938).
30. S. S. Ballard and J. H. P~e, "A ohemical study of Kilaueasolf'ataric gases, 1938-40," Volcano Letter, No. 469, 1-3 (1940).
31. T. A. Jaggar, "The borings at Kilauea Volcan07 Monthly WeatherRev., ~, 146-141 (1924).
32. G. C. Kennedy and H. H. Waldron, "Alaskan Volcano InvestigationsReport No.2: Progress of Investigations in 1946," U. S.Government Printing Office, 194'"(, pJ;>. 43, 65.
33. G. Porkelsson, "The Eruption of Helka, 1947-48. Vol. III, No.1,Appendix: Gas Analysis," Visindafilag Islendinga (SocietusScientlarum Islandica), Reykjavik, 1947, pp. 35-36.
34. s. W. Wilson, "The chemical investigation of the hot springs ofthe New Zealand thermal region," Pree., 1th Pacific Sc1. Congress,g, 449 (1953). - - -
35. R. Fabre and M. Chaigneau, "Sur les gaz volcaniques des fumerollesdu mont Pele (Martinique) et de 1a Granda Soufriere de BasseTerre (Guadeloupe)," Compt. rend", 247,15-19 (1958).
36. M. Chaigneau, H. Tazieff and R. Fabre, "Sur l'analyse des emanations volcaniques de l'Archipel des Nouvelles-Hebrides,"Compt. rend., 250, 1760-1165 (1960).
31. Y. Mizutani, "Chemical anal;ysis of volcanic gases," J. EarthSci., Nagoya Univ., 10, 125-134 (1962). - --
38. S. Oana and K. Takahashi, "Report on geological, geophysical andgeochemical studies of Usu Volcano (Showashinzan), II Geol.Survey ~, Rept. No. 110 (1951). ----
39. Ie Iwasaki, T. Ozawa, M. Yoshida, T. Katsura and M. Kamn.da,"Chemical ana.l.ysis of volcanic gases," Bull. Volcanologique,28, 5-16 (1965).
40. J. J. Naughton, E. F. Heald and I. L. BarneD, "The -chemistry ofvolcanic gases, 1. Collection and analysis of equilibrium ndxtures by gas chrom&tography," i!... GeO]?bys. Res., 68, 539-544(1963) •

118
41. K. J. Murata, "An acid tumarolic gas from Kilauea Iki, Hawaii,"Geological Survey ProteEsional Paper 537-C, U. S. GovernmentPrinting Office, Washington, D.C., 1966.
42. G. E. Sigvaldason and G. Eliason, "Preliminary report on collection and analysis of volcanic gases from Surtsey," Surtsey Research Progress Report I, The Surtsey Research Coromittee ,Reykjavik, Iceland, 1965, pp. 34-40.
43. B. Amason, "Measurements on the D/H-ratio in H2-gas and watervapor collected at the volcanic island Surtsey during the year1964, II Surtsey Research Progress Report I, The Surtsey ResearchCommittee, 1965, pp. 27-33.
44. V. J. Altier, "Gas Anal:y'sis and Testing of Gaseous Materials,"American Gas Association, Inc., New York, 1945, chpts. 9, 10.
45. G. A. Burrell and F. M. Seibert, "Sampling and examination otmine gases and natural gas," Bull. Bureau Hines, No. 42, 1913.
46. M. Chaigneau, H. Tazieff and R. Fabre, "Composition des gazvolcaniques due lac de lave permanent du Nyragongo (Congo),"Compt. ren~., 250,2482-2485 (1960).
47. P. Lebeau and A. Damiena, "Sur une methode d' anal:y'se des melangesd'hydrogene et d'hydrocarbures satures gaseux, hydrogene, methane"ethane et propane," ~. rend., 156, 144-146 (1913).
48. J. W. Judd, "Volcanoes, II C. Kegan Paul and Co., London, 1881,pp. 41-42.
49. J. Verhoogan, "New data on volcanic gases: The 1938 eruption otNyamlagira," Am. ;L. Sci., 237, 656-672 (1939).
50. H. Sakai and R. lfagasawa., "Fractionation of sulfur isotopes involcanic gases," Geochim.et Cosmochim. Acta, 32-39 (1960).
51. T. A. Rafter, "Recent sulfur isotope measurements on a varietyof specimens examined in New Zealand," Bull. Volcanologique, 28,178-194 (1965).
52. S. H. Wilson, "Sulfur isotope ratios in relation to volcanologicaland geothermal problems," Bull. Volcanologique, 29, 611-690(1966). .
53. J. R. Hulston and H. J. McCabe, "Mass spectrometer measurementsin the thermal areas of New Zealand, Part 1. Carbon dioxide andresidual gas analyses," Geochim. et Cosmochim. Acta, 26,383-397 (1962). - -- -
54. E. Mazor and G. T. l-1asserburg, '!Helium, neon, argon, krypton andxenon in gas emanations from Yellowstone and Lassen volcanicNational Parks," Geochim. et Cosmochim. Acta, 29, 443-454-{1965).

55.
56.
57.
58.
59.
60.
61.
62.
64.
R. C. Weast, ed., "Handbook of Chemistry and Physics," Chel'dca.lRubber Co., 47th edition, 1966-1967, p. Fl12.
B. D. Gunter and B. ·C. Musgrave, "Gas chromatographic measurements of hydrothermal emanations at Yellowstone National Park,"Geochim. et Cosmochim. Acta, 30, 1175-1189 (1966).
I. Elskens, H. Tazieff and F. Tonant, "A new method for volcanicgas analyses in the field," Bull. Volcanologique, 27, 347-350(1964).
A. J. Ellis, "Chemical equilibrium in magmatic gaf3es," Am. J.Sci., 255, 416-431 (1957). -- -
K. B. Krauskopf, "The use of equilibrium calculations in findingthe composition of a magmatic gas phase," in "Re8ear~he8 inGeochemistry," P. H. Abelson, ed. , John Wi ley and Sons , NewYork, 1964, pp. 260-278.
Y. Shimazu, "A thermodynamic aspect of volcanic gas," J. EarthSci., Nagoya Univ., !!, 197-221 (1960). - --
S. Matsuo, "Establishment of chemical equilibrium in the volctmic gas obtained from the lava lake of Kilauea, Hawaii,"Bull.Volcanologique, 24, 59-71 (1962).
E. F. Heald and J. J. Naughton, "Calculation of chemicalequilibria in volcanic systems by means of computers," Nature,193, 642-044 (1962). -------
H. ~. stearns, "Geology of the state of Hawaii," Pacific Books,Palo Alto, California (1966), PI'. 64-78.
G. A. Macdonald and D. H. Hubbard, "Volcanoes of the National .Parks in Hawaii," Mid-Pacific Press, Honolulu, 1965, 1'1'. 29-35.
179
65. Ibid., 1'1'. 48-50.
66. W. U. Ault and D. H. Richter, "A temperature probe into the meltof Kilauea Iki lava lake in Hawaii," J. Geophys. Res., 67,2809-2812 (1962). - --- --
67. A. C. Trowbridge, "Glossary of Geology and Related Sciences,"American Geo1ogiIJal Institute, Washington, D.C., 2nd edition, 1960.p. 117.
68. J. J. Naughton and K. Terada, "Effect of the eruption of Haw'aiianvolcanoes on the composition and carbon isotope content of&ssoci9.ted volcanic and tumarolic gases," Science, 120, 580-581(1954). ----

180
69. G. A. Macdonald, "Soltataric alteration of rocks at KilaueaVolcano," Am. ~. Sci., g42, 496 (1944).
10. P. G. Jettery and P. J. Kipping, "Gas Analysis by Gas Chromatography," Pergamon Press, New York, 1964, chpts. 8 and 9.
j1. C. T. Hodges and R. F. Matson, "Gas chromatographic separation ofcarbon dioxide, carbon oxysultide, hydrogen sulfide, carbondisulfide, and sulfUr dioxide," Anal. Chem., 31, 1065-1066(1965). - - -
12. P. G. Jeffery and P. J. Kipping, ~. cit., p. 12.
13. E. B. Sandell, "Colorimetric Determinations of Traces of Metals,"Int~rscience, New York, 2nd edition, 1959, p. 538.
14. D. M. Zall, D. Fischer and M. Q. Garner, "Photometric determination of chlorides in water," Anal. Chem., 28, 1665-1668 (1956).
15. A. J. Ellis and J. A. Richie, "r.tethods for collection and analysisof geothermal fluidS," Dominion -Laboratory Rept. No. 2039,D.S.LR., New Zealand, 21-22 (1961). - ---
16. G. H. Bro'Wll and E. M. Sallee, "Quantitative Chel'listry," PrenticeHall, Englewood Cliffs, New Jersey, 1963, pp. 450-451.
77. R. Goguel, Private communication.
78. M. Sato and T. L. Wright, "Oxygen fugacities directly measuredin magmatic gases," Science, 153, 1103-1105 (1966).
19. H. P. Eugster and D. R. Wones, "Stability relations of theferruginous biotite, annite," ~. Petrol., J, 82-125 (1962).
80. K. Yubara, "Nitrogen gas in hot spring waters," Memoirs CoIl.Sci., Univ. Kyoto, .S~r .• !' 31, 1-22 (1966). --
81. A. T. James and A. J. P. Martin, "Gas-liquid partition chromatography; a technique for the analysis of volatile material,"Analyst, 11, 915-932 (1952).
82. E. M. Heald, "A Chemical Study of Hawaiian Magmatic Gases,"Ph.D. Dissertation, University of Hawaii, 1961, pp. 59-60.
83. Y. Suva, "Chemical analysis of volcanic gases by gas chromatography," ~. Earth Sci., Nagoya Univ., 13, 12-22 (1965).
84. J. M. Gill and F. T. Tao, "Quantitation and gas chromatography,"as abstracted in Previews and Reviews, Varian Aerograph ~.,Walnut Creek, Calif., No.1, 2-3 (1961).
181
85. D. A. Skoog and D. M. West, "Fundamentals ot An~ical Chemistry,"Holt, Rinehart and Winston, New York, 1963, p. 52.
86. D. L. Peck, T. L. Wright rwd J. G. Moore, "CrystaJ.lization ottheo1eiitic basalt in Alae lava lake, Hawaii, Bull.Vo1canologique, 29, 629-656 (1966). -
87. S. BJornsson, "Radon in magmatic gas at Surtsey and its possibleuse in detendJ'ling the content of vater in the magma," SUrtseyResearch Progress Report II, The Surtsey Research Society,Reykjavik, Iceland, 1966, pp. 97-100.
88. D. H. Richter and J. G. Moore, "Petrology ot Kilauea Iki lava lake,Hawaii," Geological Survey Professional Paper 537-B, U.S. Government Printing Ottice, Washington, D. C., 1966.
89. T. C. Hoering, "Cosmological and geological implications of isotope ratio variations," Nuclear Sci. Ser., !!R1. No.3 (N.A.S.-N.R.C. Publication 572), 161-l70U95m:- - -
90. G. J. E. Wasserburgh, E. Mazor and R. E. Zartman," Isotopic and~.hE'JDical composition of some terrestial gases," in "Earth Scienceand Meteoritics," J. Geiss and E. D. Goldberg, ed., NorthHolland Press, Amsterdam, 1963, pp. 210-240.
91. W. B. White, 8. M. Johnson and G. B. Danzig, "Chemical equilibriain complex mixtures," !. ~. ~., 28, 751-755 (1958).
92. E. F. Heald, Personal communication vith I. L. Barnes ot theUniversity ot Hawaii statt.
93. "J.A.N.A.F. Thermochemical Tables, PB 168370," Clearing House torFederal Scientitic and Technical Intormation, Dept. ot Commerce,Washington, D. C., 1965 (addendum 1966).
94. A. P. Altshuller, "Thermodynamic properties ot the ammonium ion,"ir. hr1. £!!!!!. ~., 11., 3480-3481 (1955).
95. S. Matsuo, "On the origin ot volcanic gases," !.~ Sc1.,Naggra Univ., ~, 222-255 (1960).
96. S. Matsuo, "On the chemical nature ot tumarol1c gases ot VolcanoShovashinzan, Hokkaido, Japan," !.~ SciL., Nagoya !!!:!!!.., 2.,80-100 (1961).
97. G. A. Macdonald and J. P. Eaton, "Hawaiian volcanoee during 1955,"!!.~.G.~. Survey Bull., !!2.. 1111, 92 (1964).
98. R. D. Cadle, A. F. Wartburg, E. R. Frank and J. P. Lodge, "Particlesin volcanic fume," Nature, 213, 581 (1967).