finansbank kurumsal sunum formatı
TRANSCRIPT

0
Investor Presentation
9M’16 Results
November, 2016

1
Executive summary
Structurally attractive Turkish Economy Underpinning A Dynamic Banking Sector
• Turkish market presents a strong opportunity among emerging markets thanks to large and growing economy energized by a highly
attractive demographic profile
• In this macro backdrop, banking sector has a promising future, with growth opportunities implied by current product and volume
penetration figures, and a profitability higher than that of emerging market peers
One of the Top Performing Banks in the Market
• QNB Finansbank is one of the strongest players in this market with 5th ranking across most categories among privately owned banks
• It has a very strong distribution network balanced between a branch footprint covering 99% of banking business in the market and
best in market digital offerings
• It has shown strong financial performance beyond its scale even in most volatile market conditions driven by differentiation,
adaptability and right people brought together
New Shareholder Opens a New Frontier to QNB Finansbank
• Recent acquisition by QNB positions QNB Finansbank as the Turkish bank with the strongest shareholder
• QNB is the largest player in Middle East and Africa by all critical measures and has the highest ratings among all banks with a
presence in Turkey
• Its presence across a wide geography overlaps well with Turkey’s key foreign trade partners bringing opportunities in this area
• With the new shareholder, QNB Finansbank will add a new growth chapter in its successful history capturing its fair share in
Corporate and Commercial Banking while sustaining its success in Retail and SME Banking
• QNB Finansbank already started seeing positive impact of new shareholder structure in funding costs and trade volumes
• With shifting credit volumes to Corporate and Commercial, in addition to the various measures it has taken across the years in
improving risk profile of the bank, asset quality will stay under control in the short term and improve in the long term

2
Contents
QNB Finansbank and QNB Group at a Glance
Loan-based Balance Sheet Delivering High Quality Earnings
Solid Financial Performance
Appendix
2
3
4
5
Macro-economic Overview1

3
Macro-economic Overview

4
Structurally attractive Turkish economy underpinning a dynamic banking
sector(1)
Source: IMF WEO – Apr’16; ECB; CIA World Fact Book; Central Banks; BRSA; Turkstat; IMF FSI
(1) EUZ: Eurozone, BR: Brazil, RU: Russia, PL: Poland, SA: South Africa, TR: Turkey
(2) 2010-2014 average
Large economy with low GDP / capita…
GDP
2015, USD, tn
11.5
1.81.3
0.7 0.5 0.3
EUZ BR RU TR PL SA
34.2 8.6 9.1 9.4 12.5 5.7
GDP per
capita (USD, k)
…high real GDP growth…
GDP Growth, Constant Prices
2015, %
4.0 3.6
1.7 1.3
-3.7 -3.8
TR PL EUZ SA RU BR
…and highly attractive demographic
profile
Population by Age Groups
%
28
26
24
16
15
20
17
17
11
12
38
43
44
46
44
7
8
8
14
15
6
7
8
13
15
SA
TR
BR
RU
PL
0-14 15-24 25-54 55-64 65+
Underlevered population…
Household debt / GDP
2015, %
52.6
36.7 36.5
25.619.3
14.3
EUZ SA PL BR TR RU
…with further penetration potential…
Loans / GDP
2015, %
116.8
78.569.2 61.5 54.5 50.1
EUZ SA TR PL BR RU
…and a high return on assets
Banking Sector Pre-tax RoA
2010–2015 average, %
2.1
1.7 1.6(2)1.5
1.1
TR RU BR SA PL

5
QNB Finansbank and QNB
Group at a Glance
6
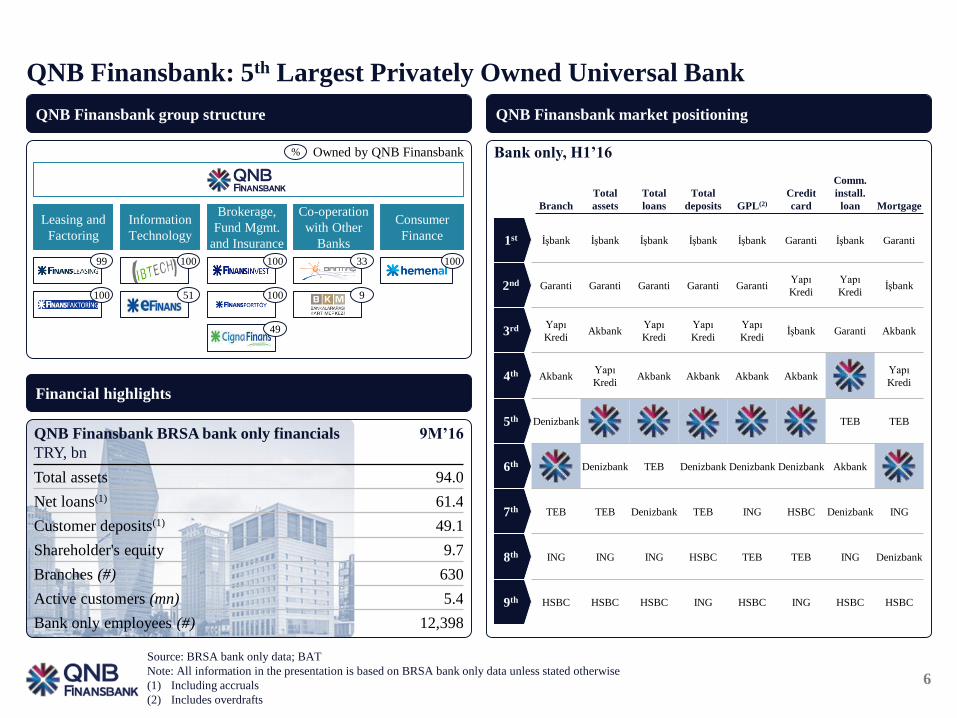
QNB Finansbank: 5th Largest Privately Owned Universal Bank
Source: BRSA bank only data; BAT
Note: All information in the presentation is based on BRSA bank only data unless stated otherwise
(1) Including accruals
(2) Includes overdrafts
QNB Finansbank group structure
Financial highlights
QNB Finansbank BRSA bank only financials
TRY, bn
9M’16
Total assets 94.0
Net loans(1) 61.4
Customer deposits(1) 49.1
Shareholder's equity 9.7
Branches (#) 630
Active customers (mn) 5.4
Bank only employees (#) 12,398
Leasing and
Factoring
Information
Technology
Brokerage,
Fund Mgmt.
and Insurance
Co-operation
with Other
Banks
Consumer
Finance
99
100
% Owned by QNB Finansbank
100
51
100
100
49
33
9
100
QNB Finansbank market positioning
1st
2nd
3rd
4th
5th
6th
7th
8th
9th
İşbank İşbank İşbank İşbank İşbank Garanti İşbank Garanti
Garanti Garanti Garanti Garanti GarantiYapı
Kredi
Yapı
Krediİşbank
Yapı
KrediAkbank
Yapı
Kredi
Yapı
Kredi
Yapı
Krediİşbank Garanti Akbank
AkbankYapı
KrediAkbank Akbank Akbank Akbank
Yapı
Kredi
Denizbank TEB TEB
Denizbank TEB Denizbank Denizbank Denizbank Akbank
TEB TEB Denizbank TEB ING HSBC Denizbank ING
ING ING ING HSBC TEB TEB ING Denizbank
HSBC HSBC HSBC ING HSBC ING HSBC HSBC
Branch
Total
deposits GPL(2)
Credit
card
Comm.
install.
loan Mortgage
Total
assets
Total
loans
Bank only, H1’16

7
QNB Finansbank covers Turkish geography through a diverse distribution
network and market’s only “pure digital bank”
297k active mobile banking customers
Mobile banking
184k active internet banking customers
Internet banking
157 inbound agents
Call center
126 field service personnel
Field service
630 branches2,878 ATMs around Turkey
733 inbound agents
812k active internet banking customers
405 inhouse and 91 outsource personnel
ATMs
Call center
Internet banking
Direct sales
248k POS terminals
POS
79 outbound agents
Telesales
1,218k active mobile banking customers
Mobile banking
9M’16
Covering 71 out of 81 cities of Turkey(1)
Source: BRSA Finturk
(1) Representing 99% of banking activity in Turkey in terms of total loans and deposits by cities

8
1.0
1.2
1.4
1.6
1.8
2.0
2.2
0 50 100 150 200 250 300
QNB Finansbank has shown success beyond its scale in volatile market settings
Source: BRSA bank only data
(1) Excluding sale of Finans Emeklilik in Q4’12 from QNB Finansbank; excluding sale of Deniz Emeklilik in Q3’11 and one-off dividend income in Q2’12
from Denizbank; excluding sale of Yapi Kredi Emeklilik in Q3’13 from Yapi Kredi
Financial performance since 2010
Average RoA(1)
Between Q1’10 and Q2’16, quarterly
Asset Size
TRY, bn, Q2’16
Drivers of QNB Finansbank’s performance resilience
DifferentiationUnique practices delivering market
leading financial results
Adaptability
Entrepreneurial culture and
capabilities to adapt to changing
market conditions
Right people
Right people brought together via a
clear guidance of meritocracy and an
aspiration for diversity that forms the
basis of everything

9
QNB’s recent acquisition of Finansbank has brought a strong support to one of
market’s leading performers
Shareholder
Structure
Ratings
Corporate
Information
Qatar National Bank
%
99.88
Other
0.12
%
Moody’s Fitch
Foreign Currency
Long-termBa1 BBB
Foreign Currency
Short-termNP F2
Moody’s Fitch S&P
Foreign Currency
Long-termAa3 AA- A+
Foreign Currency
Short-termP-1 F1+ A-1
• Largest bank in Qatar by market cap., assets, loans,
deposits and profit
• Largest bank in MEA by total assets, loans, deposits and
profit
• Operating in more than 30 countries around the world
across 3 continents,
• More than 1,200 locations, supported by more than 4,300
ATMs and employing more than 27,300 staff
• Focused on traditional banking activities, complemented
by ancillary services (investment banking, brokerage,
leasing, factoring, asset management)
• Important partnerships in insurance with leading
international institutions (Sompo Japan in basic insurance
and Cigna in life insurance and private pensions)
Qatar Investment Authority
50.0
Private Sector
50.0
QNB Finansbank QNB Group

10
QNB is the leading financial institution by all measures in the MEA region
9M’16
195.9
131.6 121.4 116.9 113.0
Total Assets
USD, bn
139.9
78.769.2 62.2 60.2
Loans
USD, bn
137.5
84.8 82.972.6 71.8
Deposits
USD, bn
2.65
1.871.62
1.471.23
Net Profit
USD, bn
2.45 2.34 2.23 2.19
1.54
Top MEA Banking Brands
Source: Companies’ September 2016 Press Release or Financial Statements if available; Brand Finance 2015; Bloomberg
33.6
27.2
22.6
15.5 15.3
Top MEA Banks by Market Cap
USD, bn, as of 2015As of 2015

11
QNB ownership brings a strong geographic reach to QNB
Finansbank especially with important trade partners of Turkey…
(1) Through ownership of 20.0% shares of Ecobank as of 30 June 2016, including ordinary and QNB’s convertible preferred shares
(2) Excluding Saudi Arabia, for which QNB got approval from authorities to open a branch
(3) Dormant
Top 40 trade
partners of Turkey
QNB presence
QNB footprint(1)
Vietnam
Egypt
India
China
Singapore
Indonesia
France
United Kingdom
Switzerland
UAE
LibyaJordan
Iran(3)
Qatar
Tunisia
Yemen
Syria
Iraq
Kuwait
Lebanon
Bahrain
Oman
Palestine
South Sudan
Sudan
Algeria
Mauritania
Togo
Myanmar
Turkey
Middle East(2)
Europe
Sub-Saharan Africa
Asia
North Africa
QNB Finansbank Foreign Trade Market Share
%
4
5
6
7
New ownership’s positive impact on foreign
trade presence already started
Shareholder change
Q1’15 Q2’15 Q3’15 Q4’15 Q1’16 Q2’16 Q3’16

12
…and with QNB, QNB Finansbank has the strongest shareholder of all banks
in Turkish market
Source: Bloomberg; company reports; ECB; Central Bank of Russia
(1) Only banking entities are illustrated; as of September 2016
(2) Market share by assets as of 2015
(3) BNP Paribas is among the 10 largest banks in the World and the largest French bank
(4) Global Finance Safest Banks in the World
Major
Banks
Akbank Sabancı Holding Not rated N/A
IsbankIsbank Pension
FundNot rated N/A
Garanti BBVA A3 A- BBB+ 12%
Yapi KrediUnicredit
Koç Holding
Baa1
Baa3
BBB+
Not rated
BBB-
BBB-
10%
N/A
QNB
FinansbankQNB Aa3 AA- A+ 42%
Denizbank Sberbank Ba2 BBB- N/A 29%
TEBBNP Paribas
Çolakoğlu Holding
A1 A+
Not rated
A Not
disclosed(3)
Moody’s Fitch S&P
Parent’s
Market Share
in Domestic
Market(1)(2)
Parent’s Foreign Currency
Long-term Rating
QNB’s exceptional strength is underlined by
all three major rating agencies
“Our stable outlook on Qatar National Bank (QNB) reflects the bank’s
resilient financial performance supported by its core franchise in Qatar
as well as its expected extraordinary support from the Qatari
Government”
May 31st, 2016
“The standalone rating reflects: (1) consistently high profitability levels,
supported by QNB's dominant market position and government
relationships; (2) strong asset quality and sound capitalization; (3)
strong funding and liquidity metrics supported by growth in both its
domestic private and international deposit base and (4) increasing
business diversification derived from non-domestic operations.”
May 20th, 2016
“Profitability is stronger than that of most peers. Risk appetite is fairly
conservative despite rapid growth and expansion into some higher-risk
markets. We note however that QNB has a good track record of
integrating and managing subsidiaries in weaker operating
environments”
April 21st, 2016
Controlling
Shareholder
QNB has superior ratings and dominant presence in domestic market
Only bank ranked
among top 50 safest
banks(3) in the world
with presence in Turkey
Only bank ranked
among top 50 safest
banks(4) in the world
with presence in Turkey

13
Change in shareholder already delivering improvement in cost of funding
Source: BRSA; Bloomberg
(1) Eurobonds of Garanti, Akbank, Isbank and Yapi Kredi issued around the same time as QNB Finansbank
-20
0
20
40
60
80
100
3
4
5
6
7
Peers’ average(1)
QNB Finansbank
QNB Finansbank’s deposit interest rate costs already
converged to the sector…
….while wholesale funding costs declined immediately
following announcement of acquisition
Gap with non-state banks in TRY time deposit pricing
bps
Eurobond yields
Percent, 2014 issuances
Q2 Q3 Q4
2014
Q1 Q2 Q3 Q4
2015
Q1 Q2
2016
Q3Q2 Q3 Q4
2014
Q1 Q2 Q3 Q4
2015
Q1 Q2
2016
Q3

14
The new shareholder opens a new frontier of growth for one of Turkey’s top
performers
Source: BAT; BRSA
(1) Among private banks operating in given year
(2) Including overdraft
(3) Excluding commercial auto and mortgage loans
1987-2004: fast growth
behind leadership in Corp. &
Comm. Banking
2005-2011: Retail banking
boom with market leading
growth and success
2012-2016: Business banking
growth with productivity and
risk focus
2016 beyond: Sustained
success in Retail and SME
while leap frogging market in
Corp. & Comm. Banking
Total Assets
Ranking in Private Banks(1)
Market share
%
Market share
%
Market share
%
35
96
1987 2001 2004
6.9
14.2
7.5
10.5
1.2
6.0
4.25.0
2005 2010
Credit cards
Mortgage
GPL(2)
Retail deposits
8.1
9.1
7.38.0
3.7
5.1
2.63.2
2011 2015
Commercial credit cards
Commercial
installment loans(3)
SME loans
Business demand deposits
2.4
~4.5
9M'16 Next 3-5 years
Corporate & Commercial
banking

15
Change in business mix combined with measures taken in credit risk
management across segments translates to better asset quality
(1) Including TRY 82 mn free provisions. If included, 2014 CoR would be 2.1%
(2) Including TRY 18 mn free provisions. If included, 2015 CoR would be 2.1%
(3) Excluding commercial credit cards
(4) Based on BRSA segment definition
2.7
2.3(1)2.2(2)
2.1
2013 2014 2015 9M'16
Loan Composition
% of total loans
1722
2731
28
35
3532
16
129 915
16 16 15
2415 14 13
2013 2014 2015 9M'16
Credit cards(3)
SCoR
9M’16, %
General purpose
loans
Mortgage
SME(4)
Corporate &
Commercial
3.7
3.4
0.2
2.1
0.8
Shift towards business banking helps improve cost of risk
CoR on a declining trend
Cost of Risk
%

16
Loan-based Balance Sheet
Delivering High Quality
Earnings

17
Asset size exceeded TRY 94 billion with 14% average annual growth over last
three years
(1) FX-indexed TRY loans are shown in FX assets
65% 67% 67% 65%
13% 12% 11% 12%
13% 12% 12% 14%
9% 9% 10% 9%
2013 2014 2015 9M'16
100%=
Other
Cash & banks
Securities
Loans
75.2
IEA
49.555.1
60.9 62.9
2013 2014 2015 9M'16
7.8 8.7 8.510.4
2013 2014 2015 9M'16
94.066.0 85.7
Loan heavy balance sheet
Total Assets
TRY, bn
Recent slowdown in TRY assets growth
due to shift to business banking
TRY Assets
TRY, bn
Faster growth of FX assets
FX Assets(1)
USD, bn
+14%CAGR
+10%
+9%CAGR
+3%
+11%CAGR
+22%

18
Sustained and successful execution of the growth strategy…
(1) Based on BRSA segment definition
(2) Excluding commercial credit cards
31% 28% 25% 24%
24%
15%14% 13%
28%
35%35%
32%
17% 22%27% 31%
2013 2014 2015 9M'16
100%=
Credit card(2)
Consumer
Corporate &
Commercial
SME
Business
banking(1)
42.4 49.8 56.5 60.623.0 21.4 21.6 22.2
2013 2014 2015 9M'16
19.428.4
34.9 38.5
2013 2014 2015 9M'1620%
80%
23%
77%
16%
84%TRY Loans
FX Loans(2) 24%
76%
Loan book continued to shift towards business banking
Performing Loans by Segment and Currency
TRY, bn
Retail loans are almost flat over the
period
Retail Loans
TRY, bn
Significant growth in business loans
Business Loans
TRY, bn
+14%CAGR
+7% -1%CAGR
+3%
+28%CAGR
+10%

19
…focused on business banking loans and selective retail banking
segments
(1) Based on BRSA segment definition
(2) Including GPL, overdraft and mortgage loans
(3) Including overdraft
(4) Credit card outstandings from individual clients
Business banking
Retail banking
Caution in SME loans in last quarters;
growth to resume with market stability
SME Loans(1)
TRY, bn
Strong growth in corp. & comm. loans
supported also by FX rates
Corp. & Comm. Loans(1)
TRY, bn
Selective growth in consumer loans...
Consumer Loans(2)
TRY, bn
...mainly driven by GPLs...
General Purpose Loans(3)
TRY, bn
...with stabilized volume in credit
cards…
Credit Card Loans(4)
TRY, bn
…as well as in mortgages
Mortgage Loans
TRY, bn
6.6 5.9 5.0 5.3
2013 2014 2015 9M'16
12.0
17.519.9 19.5
2013 2014 2015 9M'16
7.310.9
15.018.9
2013 2014 2015 9M'16
10.07.6 7.7 7.8
2013 2014 2015 9M'16
13.0 13.8 13.9 14.4
2013 2014 2015 9M'16
6.37.9 8.9 9.1
2013 2014 2015 9M'16
+4%CAGR
+4%
-8%CAGR
+7%
-9%CAGR
+1%
+14%CAGR
+2%
+19%CAGR
-2%
+41%CAGR
+26%
20
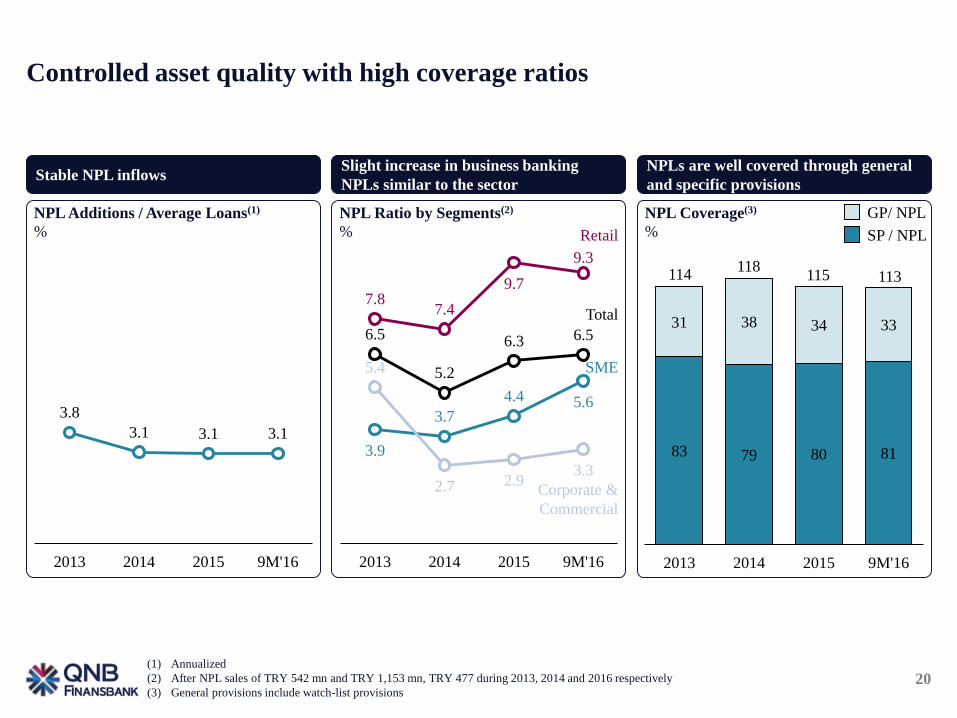
Controlled asset quality with high coverage ratios
(1) Annualized
(2) After NPL sales of TRY 542 mn and TRY 1,153 mn, TRY 477 during 2013, 2014 and 2016 respectively
(3) General provisions include watch-list provisions
7.87.4
9.7
9.3
3.9
3.7
4.4 5.6
5.4
2.7 2.93.3
6.5
5.2
6.3 6.5
2013 2014 2015 9M'16
Retail
SME
Corporate &
Commercial
83 79 80 81
31 38 34 33
2013 2014 2015 9M'16
114118
115
GP/ NPL
SP / NPL
113
Stable NPL inflows
NPL Additions / Average Loans(1)
%
Slight increase in business banking
NPLs similar to the sector
NPL Ratio by Segments(2)
%
NPLs are well covered through general
and specific provisions
NPL Coverage(3)
%
Total
3.8
3.1 3.1 3.1
2013 2014 2015 9M'16

21
…and tighter lending across the board in consumer loans
Source: Credit Bureau
(1) Probability of default: estimated using sector and QNB Finansbank’s breakdown of new volumes / cards underwritten and observed PD of each score
interval with QNB Finansbank data
(2) Q3’16 excludes Sep’16 data
80
100
120
140
Q3'1
3
Q4'1
3
Q1'1
4
Q2
'14
Q3'1
4
Q4'1
4
Q1'1
5
Q2'1
5
Q3
'15
Q4'1
5
Q1'1
6
Q2'1
6
Q3'1
6
80
100
120
140
Q3'1
3
Q4'1
3
Q1'1
4
Q2'1
4
Q3
'14
Q4'1
4
Q1'1
5
Q2'1
5
Q3'1
5
Q4
'15
Q1'1
6
Q2'1
6
Q3'1
6
80
100
120
140
Q3
'13
Q4'1
3
Q1'1
4
Q2'1
4
Q3'1
4
Q4'1
4
Q1'1
5
Q2'1
5
Q3'1
5
Q4'1
5
Q1'1
6
Q2'1
6
Q3'1
6
QNB Finansbank credit cards
Implied limit weighted PD(1)(2)
Indexed to sector for each period
QNB Finansbank general purpose loans
Implied limit weighted PD(1)(2)
Indexed to sector for each period
QNB Finansbank mortgages
Implied limit weighted PD(1)(2)
Indexed to sector for each period

22
Securities portfolio increased to 11.4 bn TRY, making up 12% of assets
Growth in securities portfolio driven by FX securities
Total Securities
TRY, bn
90% of TRY securities are indexed / variable rate
TRY Securities
TRY, bn
Strong growth in FX securities with investments in 2016
FX Securities
USD, bn32% 41% 42% 42%
66%59% 58% 58%
2% 0% 0% 0%
2013 2014 2015 9M'16
100%=
Trading
Available for sale
11.4
Held to maturity
TRY Securities
FX Securities 17%
83%
24%
76%
30%
70%
37%
63%
8.7 9.2 9.2
+10%CAGR
100% 100% 100% 100%
2013 2014 2015 9M'16
Fixed
100%= 0.7 0.9 1.0 1.4
31% 30% 35% 33%
53% 57% 56% 57%
16% 12% 9% 10%
2013 2014 2015 9M'16
Fixed
CPI
FRN
100%= 7.3 7.0 6.4 7.2+23%
-1%CAGR
+12%
+30%CAGR
+46%

23
Well-diversified funding structure underpinned by solid deposit base
47% 46% 46% 44%
9% 8% 9%8%
22% 24% 22% 26%
11% 11% 13% 11%
12% 11% 11% 10%
2013 2014 2015 9M'16
66.0 75.2 43.7 46.4 48.353.6
2013 2014 2015 9M'16
10.512.4 12.9 13.5
2013 2014 2015 9M'16
85.7 94.0100%=
Equity
Other Liabilities
Demand
Deposits
Time
Deposits
IBL
Borrowings
Use of diversified funding sources while increasingly leveraging new shareholder
structure and ratings to refrain from deposit competition
Total Liabilities
TRY, bn
Modest growth in TRY liabilities
TRY Liabilities
TRY, bn
Recent slowdown in FX liabilities
growth due to costly FX deposits release
FX Liabilities
USD, bn
+14%CAGR
+10%
+8%CAGR
+11%
+10%CAGR
+5%

24
Slight increase in L/D ratio driven mostly due to opportunistic use of non-
deposit funding sources
(1) Including TRY bonds
26.0 26.9 28.6 30.8
2013 2014 2015 9M'16
110
117120
122
2013 2014 2015 9M'16
5.0 5.87.5 8.0
2013 2014 2015 9M'16
5.1 5.9 6.3 6.1
2013 2014 2015 9M'16
Recent contraction in FX deposits in line with the sector due
to movement to TRY deposits in addition to cost optimization
FX Deposits
USD, bn
Stable TRY deposits grwoth
TRY Deposits
TRY, bn
Impressive growth in demand deposits
Demand Deposits
TRY, bn
Loan-to-deposit ratio in line with the sector
Loan-to-deposit ratio(1)
%
+7%CAGR
-4%
+21%CAGR
+6%
+6%CAGR
+8%

25
Disciplined use of non-deposit funding and strong capital base
(1) Non-deposit funding
(2) Unrealized capital buffers with 58 bps through reversal of general provisions as per new regulation and 267 bps through potential conversion of sub-loan to
Basel III
12.6 13.012.0 12.5
2013 2014 2015 9M'16
Tier 1
CAR 17.0 17.0
15.414.5
Borrowings(1) by Type
% of borrowings % of liabilities
27.4%
9.8%
11.3%
35.6%
15.9%
9M'16
Bank deposits
Sub-debt
Bonds issued
Funds borrowed
Repo
4.2
9.3
3.0
2.6
7.2
Low reliance on institutional borrowings and repo funding;
strong long-term opportunity with new shareholder structure
Capital adequacy at comfortable level with additional buffer
despite exchange rate impact and sub-loan amortization
Capital Adequacy
%
325 bps CAR
buffer(2)

26
A structured approach to market and liquidity risk management
• TRY interest rate sensitivity is actively managed in the international swap market
• Hedge swap book stands at TRY 12.3 bn as of Q3’16.
• Net change in Economic Value / Equity is constantly monitored under several scenarios
• Low sensitivity to interest rate increases demonstrates that QNB Finansbank is one of the more
conservative in the market in managing interest rate risk (11.9% losses / equity as of Q2’16, which is well
below the regulatory limit of 20%)
Focused ALM
leads to low
interest rate
sensitivity
Prudent
management of
liquidity risk
Low risk appetite
for trading risks
• Strong framework is in place to ensure sufficient short-term and long-term liquidity
• Internal metrics and early warning signals are determined besides regulatory limits
• Continuous monitoring and reporting are in place to support effective management in addition to contingency
plans for extreme situations
• Low trading risk appetite is reflected by the limit structure both on portfolio and product level
• Best-in-class measurement methodologies are in place with daily monitoring of all market risk metrics
(VaR, sensitivities, etc.) in addition to stress tests and what-if analysis

27
Solid Financial Performance

28
Focus on real banking income generation Real banking growth
5.9
4.8 4.75.1
2013 2014 2015 9M'16
2,800 2,7423,145
2,2982,732
1,032 1,334
1,314
1,004
1,002
481476
351
310
338
2013 2014 2015 9M'15 9M'16
100%=
Trading & other income
Fees and
commissions
Net interest
Income(1)
Real
banking
income
4,3134,551
4,810
3,613
4,072
1.71.9
1.61.5
1.4
1.6
1.4 1.4
2013 2014 2015 9M'16
Operating income driven from core banking activities
Total Operating Income
TRY, mn
NIM in expansion trend
NIM after Swap
%
Stable fee generation despite regulations
Fees / Assets(2)
%
+6%CAGR
+13%
+13%+8%CAGR
Fees excluding account maintenance
All fees
(1) Including swap expenses
(2) Including commission refunds in 2014 and 2015

29
Exceptional spread management in both TRY and FX fronts
(1) Adjusted for FX rate changes
(2) Blended of time and demand deposits
15.1 15.115.5
16.7
7.9
9.910.5
11.3
7.1
8.8 9.19.8
0
3
6
9
12
15
18
2013 2014 2015 9M'16
Loan
yield
Blended
cost(2)
5.2
4.74.4
4.6
2.9
2.21.9
2.12.7
1.81.5 1.7
0
3
6
2013 2014 2015 9M'16
7.9 6.3 6.4 6.9LtD
spread
Time
deposit
cost
Loan
yield
Blended
cost(2)
Time
deposit
cost
Loan-to-deposit spread expansion for TRY side during first
nine months of 2016
TRY Spread
%, period average
Consistent loan-to-deposit spreads for FX side
FX Spread(1)
%, period average
2.5 2.9 2.9 2.9LtD
spread

30
Sustained fee generation despite regulatory interventions with strong
performance across diversified business segments
55% 59%
20%22%
12%5%
10% 10%
3% 5%
9M'15 9M'16
+39%
+8%
flat
-59%
+7%
YoY Change
8% YoY growth in fee generation excluding regulations impact on account
maintenance fees
Cumulative Net Fees and Commissions
TRY, mn
flat
Payment
systems
1,004 1,002
Account
maintenance
Others
Insurance
Loans
100%=
Reported
+8%Adjusted(1)
23.9
29.327.3
24.6
19.6
25.6 24.4 23.4
2013 2014 2015 9M'16
Recent decrease in the share of fees in total
income due to denominator effect
Fees / Total Income
%
Fees excluding account maintenance
All fees
(1) When regulatory impact of account maintenance fees is excluded
(2) Including commission refunds in 2014 and 2015

31
Cost of risk at comfortable level
Loan Composition
% of total loans
1722
2731
28
35
3532
16
129 915
16 16 15
2415 14 13
2013 2014 2015 9M'16
Credit cards(3)
SCoR
9M’16, %
General purpose
loans
Mortgage
SME(4)
Corporate &
Commercial
3.7
3.4
0.2
2.1
0.8
Shift towards business banking helps improve cost of risk
(1) Including TRY 82 mn free provisions. If excluded, 2014 CoR would be 2.1%
(2) Including TRY 18 mn free provisions. If excluded, 2015 CoR would be 2.1%
(3) Excluding commercial credit cards
(4) Based on BRSA segment definition
2.7
2.3(1)2.2(2)
2.1
2013 2014 2015 9M'16
CoR on a declining trend
Cost of Risk
%

32
Controlled expenditures growth
(1) Including one-off fine of TRY 32.7 million from Ministry of Customs and Trade in 2015
40% 41% 39% 38% 41%
53% 50% 54% 53% 49%
7% 9% 8% 8% 9%
2013 2014 2015 9M'15 9M'16
Staff
Depreciation &
Amortization
General &
Administration
3.93.3 3.3 3.1
2013 2014 2015 9M'16
53.2 51.356.9
51.3
2013 2014 2015 9M'16
100%= 2,334 2,737 2,0882,294 2,032
Improvement in cost / income ratio despite commission
refunds
Cost(1) / Income
%
Strong efficiency improvement generating growth with limited
OpEx increase
OpEx(1) / Assets
%
Controlled OpEx growth
OpEx(1)
TRY, mn+9%CAGR +3%

33
Key financial ratios
(1) Excluding TRY 82 mn free provisions. If included, 2014 CoR would be 2.3%
(2) Excluding TRY 18 mn free provisions. If included, 2015 CoR would be 2.2%
Bank only figures 2013 2014 2015 9M’15 9M’16 YoY
RoAE 9.8% 10.9% 8.0% 10.2% 12.2% +2.0pps
RoAA 1.2% 1.2% 0.9% 1.1% 1.3% +0.2pps
Cost / Income 53.2% 51.3% 56.9% 56.2% 51.3% -5.0pps
NIM after swap expenses 5.9% 4.7% 4.7% 4.7% 5.1% +0.4pps
Loans / Deposits 116.0% 123.8% 121.8% 120.9% 125.2% +4.3pps
Loans / (Dep. + TRY Bonds) 109.9% 117.4% 120.5% 118.3% 122.2% +3.9pps
NPL Ratio 6.5% 5.2% 6.3% 5.9% 6.5% +0.6pps
Coverage 82.8% 79.2 80.4% 79.9% 80.8% +0.9pps
Cost of Risk 2.7% 2.1% 2.1% 1.9% 2.1% +0.2pps
CAR 17.0% 17.0% 15.4% 15.0% 14.5% -0.5pps
Tier I Ratio 12.6% 13.0% 12.0% 11.6% 12.5% +1.0pps
Leverage 8.6 8.8 9.5 10.1 9.7 -0.4
(1) (2)
Profitability
Liquidity
Asset Quality
Solvency

34
Key strategies in 2016 and going forward
• Real banking, i.e., minimum market risk
• Prudent credit risk management
• High CAR, high liquidity at all times
• Leverage wholesale funding opportunities presented by new shareholder structure
Long Term
Sustainable
Strategy
• Maintain solid, above the market growth in Corporate & Commercial and SME segments
• Measured growth in consumer lending with general purpose loans and renewed emphasis on
credit cards with “high card spend” – a driver of acquiring volume (an SME business)
• Profitability and downstream business focus in Corporate & Commercial segments
• Continued emphasis on building a stable deposit base through new channels, offerings to
untapped segments and customer groups (enpara.com)
• Focus on fee generation and operating expenses control as well as continuing improvement
on cost of risk front thanks to the shift in loan book mix towards less risky segments
Mid Term
Strategic
Actions

35
Appendix

36
Finansbank BRSA Bank-Only Summary Financials
(1) Includes dividends, trading profit / loss, other operating income, gain on equity method
(2) Represents provision for loan or other receivable losses
(3) Includes banks, interbank, other financial institutions
(4) Including subsidiaries
TRY, mn 2013 2014 2015 9M’15 9M’16
Net interest income 3,163 3,088 3,947 2,837 3,292
Net fees and
commissions income1,032 1,334 1,314 1,004 1,002
Other income(1) 118 130 (451) (228) (222)
Total income 4,313 4,551 4,810 3,613 4,072
Provisions(2) (1,081) (1,076) (1,170) (769) (921)
Operating expenses (2,294) (2,334) (2,737) (2,032) (2,088)
Total expenses (3,375) (3,409) (3,907) (2,801) (3,009)
Profit before tax 938 1,142 903 812 1,063
Tax (203) (265) (197) (138) (212)
Net income 734 877 706 673 851
TRY, mn 2013 2014 2015 9M’15 9M’16
Cash & Banks(3) 8,515 9,108 10,313 12,209 13,139
Securities 8,731 9,165 9,197 9,356 11,357
Net Loans 42,910 50,344 57,273 57,194 61,424
Fixed Assets(4) 1,344 2,380 2,283 2,244 2,517
Other Assets 4,510 4,209 6,661 9,406 5,551
Total Assets 66,010 75,206 85,727 90,410 93,988
Customer Deposits 36,980 40,652 47,009 47,306 49,062
Borrowings 14,301 17,964 18,835 20,296 24,602
Bonds Issued 3,955 5,373 4,336 5,004 3,906
Funds Borrowed 3,351 4,898 5,640 6,962 8,755
Sub-debt 1,951 2,122 2,662 2,820 2,780
Bank Deposit 1,341 1,423 1,557 1,466 2,409
Repo 3,703 4,147 4,639 4,044 6,752
Other 7,080 8,017 10,860 13,870 10,620
Equity 7,648 8,574 9,024 8,937 9,704
Balance SheetIncome Statement
37
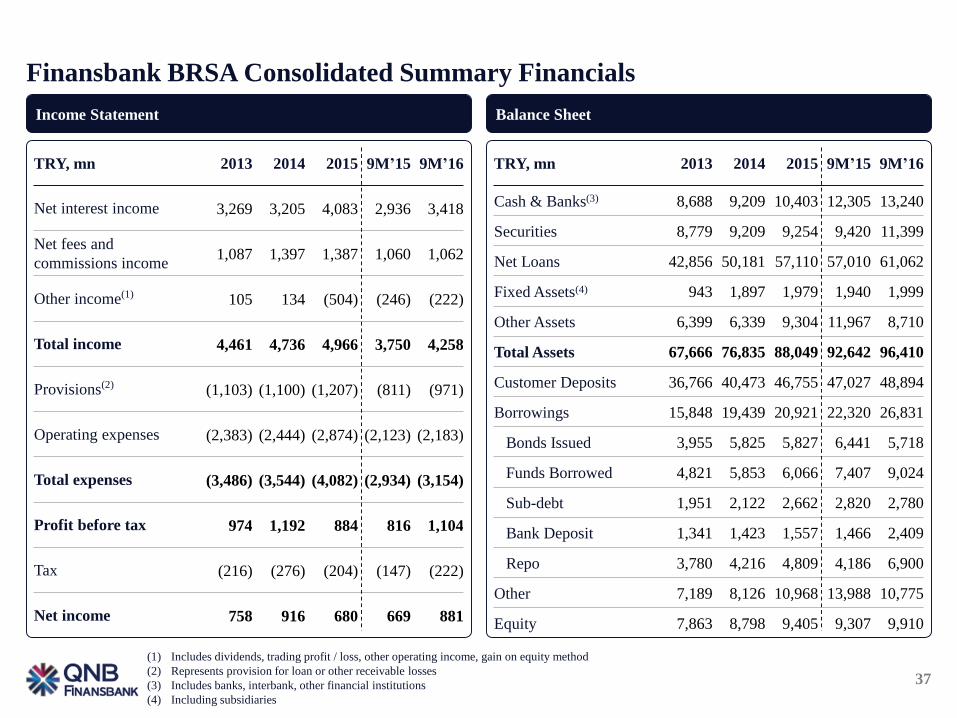
Finansbank BRSA Consolidated Summary Financials
(1) Includes dividends, trading profit / loss, other operating income, gain on equity method
(2) Represents provision for loan or other receivable losses
(3) Includes banks, interbank, other financial institutions
(4) Including subsidiaries
TRY, mn 2013 2014 2015 9M’15 9M’16
Net interest income 3,269 3,205 4,083 2,936 3,418
Net fees and
commissions income1,087 1,397 1,387 1,060 1,062
Other income(1) 105 134 (504) (246) (222)
Total income 4,461 4,736 4,966 3,750 4,258
Provisions(2) (1,103) (1,100) (1,207) (811) (971)
Operating expenses (2,383) (2,444) (2,874) (2,123) (2,183)
Total expenses (3,486) (3,544) (4,082) (2,934) (3,154)
Profit before tax 974 1,192 884 816 1,104
Tax (216) (276) (204) (147) (222)
Net income 758 916 680 669 881
TRY, mn 2013 2014 2015 9M’15 9M’16
Cash & Banks(3) 8,688 9,209 10,403 12,305 13,240
Securities 8,779 9,209 9,254 9,420 11,399
Net Loans 42,856 50,181 57,110 57,010 61,062
Fixed Assets(4) 943 1,897 1,979 1,940 1,999
Other Assets 6,399 6,339 9,304 11,967 8,710
Total Assets 67,666 76,835 88,049 92,642 96,410
Customer Deposits 36,766 40,473 46,755 47,027 48,894
Borrowings 15,848 19,439 20,921 22,320 26,831
Bonds Issued 3,955 5,825 5,827 6,441 5,718
Funds Borrowed 4,821 5,853 6,066 7,407 9,024
Sub-debt 1,951 2,122 2,662 2,820 2,780
Bank Deposit 1,341 1,423 1,557 1,466 2,409
Repo 3,780 4,216 4,809 4,186 6,900
Other 7,189 8,126 10,968 13,988 10,775
Equity 7,863 8,798 9,405 9,307 9,910
Balance SheetIncome Statement

38
Borrowings and IssuancesType of Borrowing Maturity Currency Outstanding Principal (mn) Tenor (Years)
TRY Bond Oct-16 TRY 120.00 0.25
TRY Bond Oct-16 TRY 239.31 0.25
TRY Bond Jan-17 TRY 19.70 0.51
TRY Bond Oct-16 TRY 68.50 0.49
TRY Bond Oct-16 TRY 79.38 0.29
TRY Bond Nov-16 TRY 195.90 0.25
TRY Bond Nov-16 TRY 7.49 0.27
TRY Bond Nov-16 TRY 88.09 0.25
TRY Bond Nov-16 TRY 150.00 0.25
TRY Bond Feb-17 TRY 66.00 0.50
TRY Bond Dec-16 TRY 163.21 0.25
TRY Bond Dec-16 TRY 50.00 0.25
Eurobond Nov-17 USD 350.00 5.00
Eurobond Apr-19 USD 500.00 5.00
Eurobond Feb-17 USD 15.00 1.00
Eurobond Mar-17 USD 20.00 1.01
Eurobond Dec-16 EUR 3.00 0.25
EIB Oct-17 EUR 7.81 7.01
Securitisation Nov-24 EUR 45.83 11.91
Securitisation Nov-17 EUR 6.25 4.91
EBRD May-20 EUR 50.00 5.27
EFSE Dec-19 EUR 25.00 5.01
PROPARCO Jul-25 EUR 20.00 10.32
Subordinated Debt Oct-20 USD 325.00 11.07
Subordinated Debt Oct-21 USD 200.00 12.01
Subordinated Debt Dec-21 USD 125.00 12.01
Subordinated Debt Dec-21 USD 260.00 10.01
EIB Nov-19 USD 8.43 7.00
EIB Nov-20 USD 12.09 7.01
EIB Mar-21 USD 43.87 7.01
EIB Apr-21 USD 25.51 7.01
Securitisation Nov-17 USD 37.50 4.91
Securitisation Aug-20 USD 100.00 4.92
Securitisation Aug-20 USD 100.00 4.92
Securitisation Aug-20 USD 50.00 4.92
Securitisation Aug-20 USD 30.00 4.92
Syndication Nov-16 EUR 365.00 1.01
Syndication Nov-16 EUR 11.00 0.99
Syndication Nov-16 USD 40.00 1.00
Syndication Nov-16 USD 59.50 1.01
EIB Dec-21 EUR 30.00 6.01
EFSE Dec-22 EUR 15.00 6.97

39
Disclaimer
QNB Finansbank (the “Bank”) has prepared this Presentation for the sole purposes of providing information which
include forward looking projections and statements relating to the Bank (the “Information”). No representation or
warranty is made by the Bank for the accuracy or completeness of the Information contained herein. The
Information is subject to change without any notice. Neither the Presentation nor the Information can construe any
investment advise, or an offer to buy or sell the Bank’s shares. This Presentation and/or the Information cannot be
copied, disclosed or distributed to any person other than the person to whom the Presentation and/or Information
delivered or sent by the Bank or who required a copy of the same from the Bank. QNB Finansbank expressly
disclaims any and all liability for any statements including any forward looking projections and statements,
expressed, implied, contained herein, or for any omissions from Information or any other written or oral
communication transmitted or made available.