financing pv technology - europa - ws...financing pv technology eleni despotou/pieterjan...
TRANSCRIPT
Financing PV technology
Eleni Despotou/Pieterjan VanbuggenhoutEuropean Phtotovoltaic Industry Association
Brussels, 20 June 2011

2
Outline
• Photovoltaics: state-of-the art
• The Solar Europe Industry Initiative

Photovoltaics: State-of-the art

4
2010… an extroardinary year for photovoltaics

5
Global breakdown in 2010
Global cumulative installedcapacity in 2010 => 39.5GW

6
Market evolution – different scenarios until 2020
36 GW/y - 12 %
17 GW/y - 6 %
10 GW/y - 4 %
2.4 %
1.15 %
7
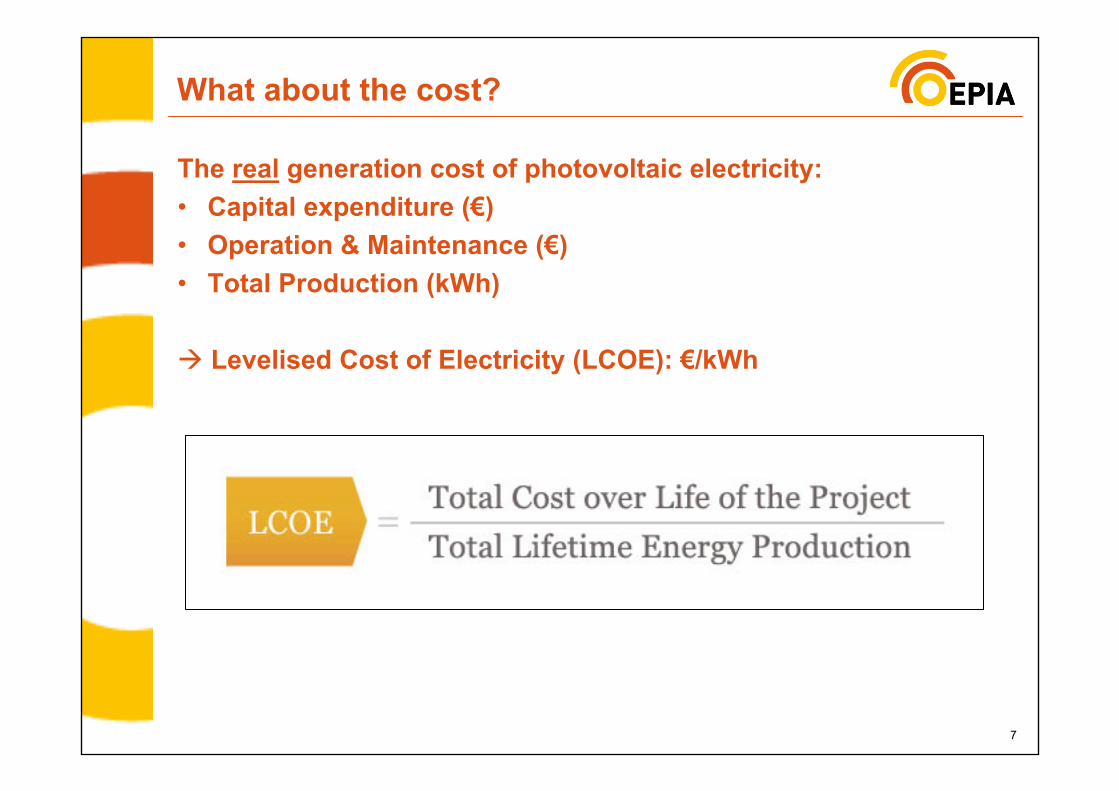
The real generation cost of photovoltaic electricity:• Capital expenditure (€)• Operation & Maintenance (€)• Total Production (kWh)
Levelised Cost of Electricity (LCOE): €/kWh
What about the cost?

8
LCOE [€nominal/kWh]0.40
0.35
0.30
0.25
0.20
0.15
0.10
0.05
0.002020
0.19
0.08
2019
0.19
0.08
2018
0.20
0.08
2017
0.21
0.09
2016
0.22
0.09
2015
0.24
0.10
2014
0.25
0.16
0.11
2013
0.27
0.12
2012
0.29
0.13
2011
0.32
0.14
2010
0.36
The generation cost of PV in Europe is expected to decline by around 50% until 2020
European PV LCOE range projection 2010 – 2020
Source: EPIA/ A.T. Kearney / Phoenix Solar LCOE model; various input sources
Band of LCOE reflects:• Four different system
size segments• Crystalline Silicon and
Thin Film technologies• Differences in national
installed system and operations cost
• Differences in national irradiation
• Different WACC for different countries considered
• VAT for residential segment
Thanks to Phoenix Solar for granting permission to EPIA to use existing cost model !
The Solar Europe Industry Initiative

10
Goal of the Solar Europe Industry Initiative
Source: EPIA and EU PVTP, SEII Implementation Plan 2010-2012
11
Four different project types
1. Industrial technology development
2.Manufacturing facilities
3.Generation capacities
4.Solar resource forecasting and monitoring

12
TYPE 1: Industrial technology development
What is it?• pilot-line demonstration• equipment and product standardisation • building-integrated photovoltaics (BIPV)• novel technologies• technical concepts for very high levels of grid penetration• printed photovoltaics• novel applications of nanotechnology for enhanced performance• “PV/smart-grid units”
Financial details• 100% equity or grants • 5-50 M€ per project• payment upfront, exit in 5-7 years

13
TYPE 1: Industrial technology development
Typical issues• Difficulty for start-ups to raise capital• Technology development risk
How to tackle this?• Joint private/public R&D programs• Grants• ARPA-E program in the USA (see http://www.arpa-e.energy.gov):
financing dependent on proven ability to attract private capital for next phase

14
TYPE 2: Manufacturing facilities
What is it?• new manufacturing facilities• strong impact on the economics of solar PV • strategic relevance for the presence and competitiveness of the European
manufacturing industry
Financial details• Corporate Finance: Equity/Debt ratio - 20/80 or higher• 50 to 250 M€• 10 to 15 years typically

15
TYPE 2: Manufacturing facilities
Typical issues• Availability of debt • High cost of capital• Price pressure, reduced margins and missed sales targets. In the worst case
scenarios losses could amount to values in the order of 90% of the asset.
How to tackle this?• Soft or competitive loans• Loan guarantees• Other forms of securitisation

16
TYPE 3: Generation capacities
What is it?• for technologies ready for commercialisation but with little or no field track
record, for which the perceived financial risk is still high• portfolio-of-installations approach to realise more installations in different
locations
FINANCIAL DETAILS• Project Finance: Equity/Debt - 30/70 or higher• 10 up to 120 M€• 20 years typically

17
TYPE 3: Generation capacities
Typical issues• Debt for technologies which are considered not ‘bankable’ is either too
expensive or not available• Returns for equity investors on these projects are likely to be uneconomical
due to lower leverage• Technology risk: lower performance ratio than expected in the budget,
consequently lower energy, hence cash, generated by the project (worst-case losses are expected to be less than 30%)
How to tackle this?• Different financial solutions, such as soft loans or loan guarantees• Most banks would accept a 1-2 year successful operation as a sufficient
track record• Revolving facilities in order to make the financing instruments as effective
as possible

18
TYPE 4: Solar resource forecasting and monitoring
What is it?• solar resource evaluation (also by means of real-time satellite data)• solar irradiation prediction models • statistical methods for PV plant behaviour prediction exploiting also artificial
intelligence (AI) techniques• fault detection techniques based on both deterministic plant modelling and
AI
FINANCIAL DETAILS• Corporate Finance + EU grants: Joint private/public partnership. EU Grants
50-70% of the investment costs should be expected.• 10 to 25 M€• typically 3-5 years

19
TYPE 4: Solar resource forecasting and monitoring
Typical issues• Competition with open source similar products• What is the real interest to pay for these services? related to the
respective regulatory environment
How to tackle this?• Joint private/public partnership• EU grants of 50-70% of the investment costs
20
www.epia.orgCredits pictures:BP Solar, Concentrix, First Solar,
Isofoton ,Photowatt, Siliken
Text: -Guido Agostinelli (GoodEnergies)-Fabrizio Bonemazzi (Enel Green Power)-Wim Sinke (EU PVTP)-Pieterjan Vanbuggenhout (EPIA)

22

23
Global market forecasts until 2015
24
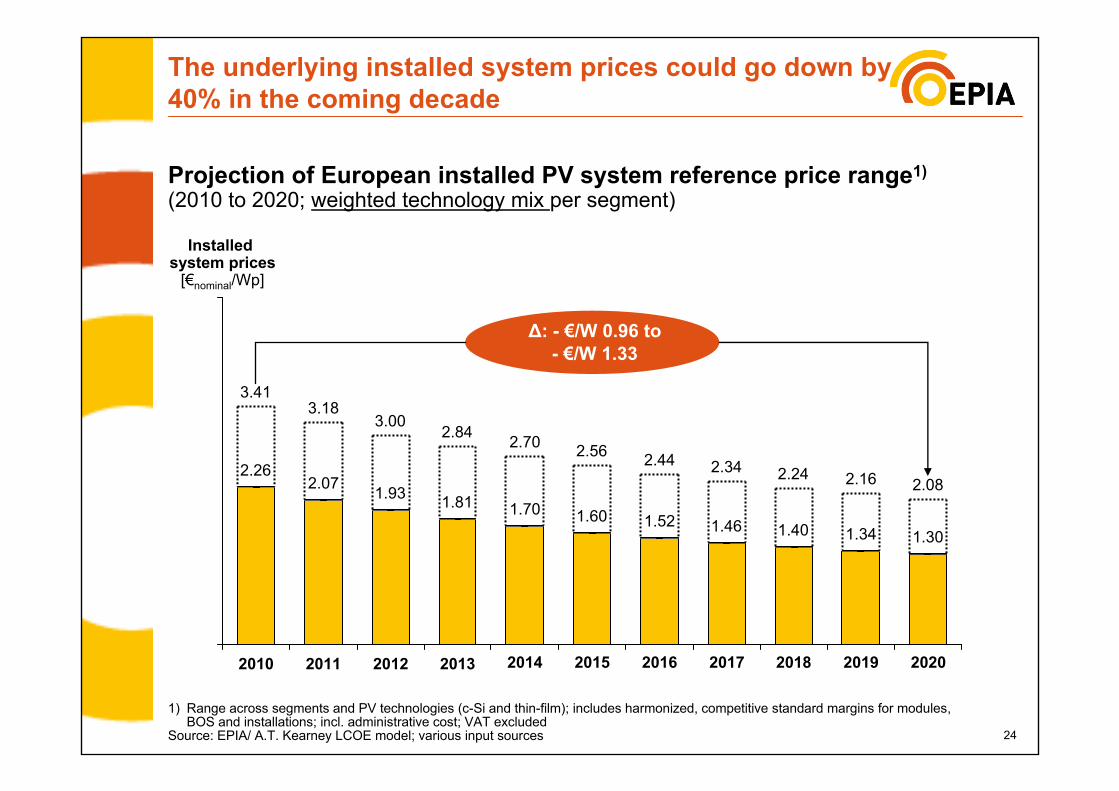
The underlying installed system prices could go down by 40% in the coming decade
Projection of European installed PV system reference price range1)
(2010 to 2020; weighted technology mix per segment)
Installed system prices
[€nominal/Wp]
2020
1.30
2.08
1.34
2.16
2018
1.40
2.24
2017 2019
1.46
2.34
2016
1.521.70
2.70
2013 2015
2.44
1.81
2.84
2012
1.931.60
2011
2.07
3.18
2010
2.26
3.41
2.56
2014
3.00
1) Range across segments and PV technologies (c-Si and thin-film); includes harmonized, competitive standard margins for modules, BOS and installations; incl. administrative cost; VAT excluded
Source: EPIA/ A.T. Kearney LCOE model; various input sources
∆: - €/W 0.96 to- €/W 1.33

25
Evolution of Global Annual PV Market
16.6 GW
26
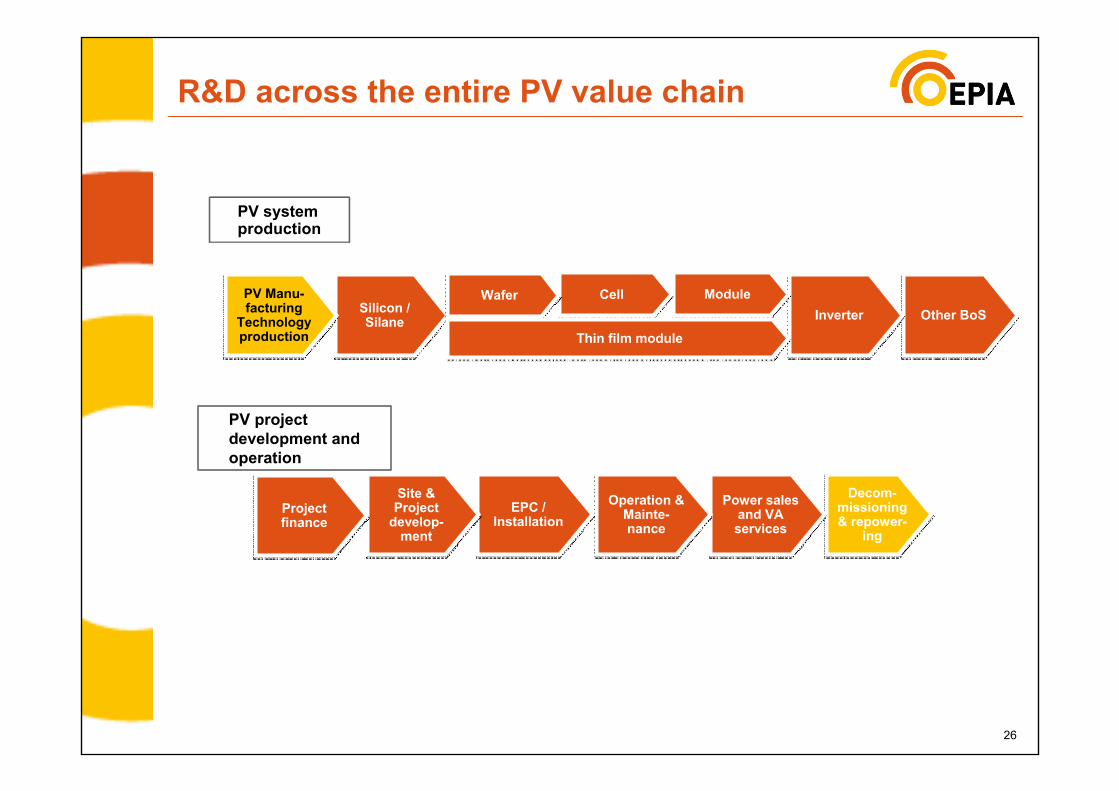
R&D across the entire PV value chain
Other BoSOther BoSInverterInverterModuleModule
Silicon / Silane
Silicon / Silane
Cell Cell WaferWaferPV Manu-facturing
Technology production
PV Manu-facturing
Technology production
PV system production
Decom-missioning& repower-
ing
Decom-missioning& repower-
ing
Power salesand VA services
Power salesand VA services
Operation & Mainte-nance
Operation & Mainte-nance
EPC / Installation
EPC / Installation
Site & Project
develop-ment
Site & Project
develop-ment
Project financeProject finance
PV project development and operation
• Thin film module• Thin film module

27
A wide range of technologies…

28
… for a large number of applications
Ground-Mounted PV
29
Conditions for sustainable market growth
EPIA advocates for:
www.epia.org/publications
1 - A sustainable, market driven, support scheme
2 - Easy and transparent administrative process
3 – Fast and efficient gridconnection schemes