financing options for the renewal of the permit for the ... · for the operation of luftseilbahn...
TRANSCRIPT
Financing options for the renewal of the permit
for the operation of
Luftseilbahn Küssnacht – Seebodenalp
by
Florian Süss
MAS Thesis
Department of Management, Technology and Economics
Chair of Entrepreneurial Risks
Supervisors:
Prof. Dr. Didier Sornette
Dr. Peter Cauwels
Christina Annen
August 2013

Abstract 2
Abstract
The main goal of this MAS thesis is to discuss the profitability for different scales of
investments (strategic options) for the renewal of the Luftseilbahn Küssnacht – See-
bodenalp and to valuate various kinds of financing the investments (financing options).
We outline different strategic options for the future operation and calculate the neces-
sary investments. The analysis of the financial situation of the company shows how
much of the investments can be financed with available equity. With the net present
value method, the profitability of the investment project is calculated for various scenar-
ios under different assumptions. To finance the gap between the available capital and
the necessary investments, we describe and discuss different financing methods and
apply them to the different strategic options.
The calculations show that it is difficult to finance anything on the top of the absolutely
necessary investments. However, collecting the necessary funding to continue operation
seems realistically achievable.

Content 3
Content
Abstract ............................................................................................................................ 2
Content ............................................................................................................................. 3
List of tables .................................................................................................................... 5
Acknowledgements ......................................................................................................... 6
1 Introduction ......................................................................................................... 7
1.1 History of the company ......................................................................................... 7
1.2 Goal ....................................................................................................................... 7
1.3 Assumptions .......................................................................................................... 8
1.4 Constraints ............................................................................................................. 8
2 Strategic Options ................................................................................................. 9
2.1 Different options .................................................................................................... 9
2.1.1 Option A: Status quo ............................................................................................. 9
2.1.2 Option B: Operating with higher speed ................................................................. 9
2.1.3 Option C: Operating with bigger cabin ............................................................... 10
2.1.4 Closing down ....................................................................................................... 10
2.2 Necessary investments ......................................................................................... 10
2.3 Capacity per option .............................................................................................. 11
2.4 Depreciation on new investments ........................................................................ 12
3 Financial situation ............................................................................................. 14
3.1 Current financial identifiers ................................................................................. 14
3.1.1 Income statement 2012 ........................................................................................ 14
3.1.2 Balance sheet 2012 .............................................................................................. 15
3.1.3 Capital distribution .............................................................................................. 16
3.1.4 Development 2006 to 2012 ................................................................................. 16
3.2 Estimation capital at the end of 2017 .................................................................. 17
3.3 Capital needs per strategic option ........................................................................ 20
4 Investment project evaluation .......................................................................... 22
4.1 Calculations option A .......................................................................................... 24
4.1.1 Scenario 1 ............................................................................................................ 24
4.1.2 Scenario 2 ............................................................................................................ 25
4.1.3 Scenario 3 ............................................................................................................ 26
4.1.4 Scenario 4 ............................................................................................................ 26

Content 4
4.1.5 Summary .............................................................................................................. 27
4.2 Calculations option B .......................................................................................... 28
4.2.1 Scenario 1 ............................................................................................................ 28
4.2.2 Scenario 2 ............................................................................................................ 29
4.3 Option C .............................................................................................................. 29
4.3.1 Scenario 1 ............................................................................................................ 29
4.3.2 Scenario 2 ............................................................................................................ 30
4.4 Conclusion ........................................................................................................... 31
5 Financing possibilities ....................................................................................... 32
5.1 Share capital ........................................................................................................ 32
5.1.1 Description .......................................................................................................... 32
5.1.2 Discussion ............................................................................................................ 32
5.2 Bank loans ........................................................................................................... 32
5.2.1 Description .......................................................................................................... 32
5.2.2 Discussion ............................................................................................................ 33
5.3 Non bank loans .................................................................................................... 33
5.3.1 Description .......................................................................................................... 33
5.3.2 Discussion ............................................................................................................ 34
5.4 Other Sources ...................................................................................................... 34
6 Application to LKS ............................................................................................ 35
6.1 General considerations ........................................................................................ 35
6.2 Comparable companies ....................................................................................... 36
6.3 Financial ratios proposed by Seilbahnen Schweiz .............................................. 36
6.4 Financing examples ............................................................................................. 37
6.4.1 Option A .............................................................................................................. 37
6.4.2 Option B .............................................................................................................. 40
6.4.3 Option C .............................................................................................................. 40
6.5 Conclusion ........................................................................................................... 41
7 Further activities ............................................................................................... 42
7.1 Marketing possibilities ........................................................................................ 42
7.2 Open points .......................................................................................................... 42
7.3 Next steps ............................................................................................................ 42
References ...................................................................................................................... 43

List of tables 5
List of tables
Table 1: Costs cable car .................................................................................................. 10
Table 2: Costs building infrastructure ............................................................................ 11
Table 3: Total costs ......................................................................................................... 11
Table 4: Capacity per strategic option ............................................................................ 12
Table 5: Depreciation rate for investments ..................................................................... 12
Table 6: Depreciation amount per year ........................................................................... 13
Table 7: Income statement 2012 ..................................................................................... 14
Table 8: Balance sheet 2012 ........................................................................................... 15
Table 9: Comparison income statements 2006-2012 ...................................................... 16
Table 10: Income statement forecast .............................................................................. 18
Table 11: Balance sheet forecast .................................................................................... 19
Table 12: Sensitivity test: growth revenues 2.5%, growth expenses 0% ....................... 20
Table 13: Sensitivity test: growth revenues 0%, growth expenses 2.5% ....................... 20
Table 14: Capital needs per option ................................................................................. 21
Table 15: Option A – Scenario 1 .................................................................................... 24
Table 16: Option A – Scenario 2 .................................................................................... 25
Table 17: Option A – Scenario 3 .................................................................................... 26
Table 18: Option A – Scenario 4 .................................................................................... 27
Table 19: Option B – Scenario 1 .................................................................................... 28
Table 20: Option B – Scenario 2 .................................................................................... 29
Table 21: Option C – Scenario 1 .................................................................................... 30
Table 22: Option C – Scenario 2 .................................................................................... 31
Table 23: Example viability ............................................................................................ 35
Table 24: Financial ratios in combination with strategic options ................................... 37
Table 25: Bank loan option A ......................................................................................... 39

Acknowledgements 6
Acknowledgements
I would like to express my gratitude to Prof. Dr. Didier Sornette for the opportunity to
write my thesis under his guidance and the access to the academic research and material
on the topic. I would like to thank Dr. Peter Cauwels for the assistance during the prepa-
ration and execution of the thesis, and for the interesting discussions and challenging on
the results.
Finally, I would like to thank all members of the company of Luftseilbahn Küssnacht –
Seebodenalp that helped me during the thesis making me all necessary information
available fast and uncomplicated and providing me help for all arising questions. I espe-
cially want to thank Christina Annen and Paul Annen for the close and efficient collabo-
ration during all phases of the thesis.
This thesis was a great opportunity to get an insight into the business of cable cars and
the difficulty of financing investments from a theoretical and practical view. I hope the
results presented in this thesis help to find a decision about the direction of the future
operation of the Luftseilbahn Küssnacht – Seebodenalp.

Introduction 7
1 Introduction
The Luftseilbahn (cable car) Küssnacht – Seebodenalp AG (further called ‘LKS’) has to
renew the operating concession (Betriebskonzession) in order to get the operating ap-
proval (Betriebsbewilligung) to continue with the operation. The current concession is
valid until the end of 2017. To get the new operating concession for the next 25 years,
several investments to the infrastructure of the cable car and the valley respectively
mountain station are required.
In this thesis, different renewal options (strategic options) are described and the conse-
quences for the financing of the required investments are discussed (financing options).
This section gives an overview of the current situation of the LKS and the necessity for
the investments in the near future.
1.1 History of the company
The LKS was put into operation on the 31st of July in 1954. The company is organized
as a stock corporation. The shares are widely distributed, most of them to local persons
and companies. The shareholders do not hold the shares to make a profit out of the in-
vestment, but mainly as a sponsorship or sympathetic contribution to the LKS. This
gives it a crowd-sourcing type of business model ‘avant la lettre’.
During the almost 60 years of operation, the LKS passed through several renewal tasks,
starting with the enhancement to cabins holding 10 persons in 1957, followed by regular
improvements and maintenance works.
In the year 1997, the LKS was renewed for the last time. The total investment of CHF
830’000 were used, beside the general maintenance for the engines and brakes, basically
for 2 points: the complete renewal of the electrical control equipment and the video sur-
veillance. The investments were financed (beside own means and provisions) with a
short-term loan from a bank, a contribution of the canton and an interest-free loan from
the government.
1.2 Goal
The goal of the thesis is to discuss the different strategic options for the renewal and to
outline different financing options. The strategic options are valuated and checked if
they can be executed economically profitable. Finally, a suggestion about the strategic
option and a proposal how to finance it are made.
Introduction 8
1.3 Assumptions
The following assumptions are central to the calculations and reasoning of the numbers:
The renewal takes place at end of 2017 / beginning of 2018. All capital must be
available at the end of 2017.
The annual growth of the revenues and expenses is 1%.
The renewal leads to a bigger turnover because of the bigger capacity of the cable
car. The size of the increase varies in the different scenarios.
The renewal works are executed in the off-season, where there is almost no traffic,
and the timespan when the cable car is not operating does not exceed the current
maintenance time by much. Together with some expected additional rides after the
re-opening, the revenues are not expected to drop in 2017 and 2018 because of the
renewal works.
All assumptions are described in detail in the section where it comes into consideration.
1.4 Constraints
An unresolved issue for the LKS is the problematic with the parking spaces – there are
not enough parking spaces available near the valley station. This problematic is not dis-
cussed in detail in this thesis, but briefly mentioned in section 7.2.
The road to the Seebodenalp has a big impact on the number of persons travelling by
cable car. The future treatment of this road (renewal, quota of cars, etc.) is a political
issue and is not considered in this thesis. It is assumed, that the road stays as it is.
Out of scope are extended marketing activities that could influence the course of busi-
ness heavily.

Strategic Options 9
2 Strategic Options
The board of the company initiated a study of the possibilities to go on with the busi-
ness of the LKS (see [3]). As a result of this study, three strategic options were identi-
fied. An additional possibility is to close down the business. The different options are
described in the following sections, and table 3 compares the financial needs for each
option. Details on the necessary investments can be retrieved in section 2.2.
Currently, the cable car (Pendelbahn) has two cabins with a capacity of 12 persons each,
but due to regulations from the last operating concession and because the facilities are
quite old, the LKS is allowed to transport only 10 persons per ride.
The necessary investments for the different options and the consequences in regards to
the capacity of the LKS are computed in this section.
2.1 Different options
2.1.1 Option A: Status quo
This option is called status quo because only the necessary investments to get the new
operating concession are executed. The investments with this option are moderate, but
as not all facilities are renewed, some additional tasks may be necessary in the future to
keep the operation running.
The current cabin of the cable car is kept (it can be re-painted to be perceived as reno-
vated), and the capacity of the cabins stays at 12 persons (but the full capacity of 12
persons can be used again after the renewal works). As some regulations changed since
the last renewal of the LKS, infrastructure work is required at the valley and the moun-
tain station.
The total investments for this option result to CHF 2’481’000. Details about the neces-
sary investments can be found in section 2.2.
2.1.2 Option B: Operating with higher speed
In this option, investments to operate the cable car with a higher speed (‘Schneller
fahren’) are calculated (additionally to the necessary investments to go on with the
business). This requires no new engine and cabins, but several adaptations to the infra-
structure. The current cabins are kept, but with the faster rides, the total capacity of the
cable car can be enhanced. Some additional works to switch to a bigger cabin in a later
stage are included in the investments for this option.

Strategic Options 10
The total investments for this option result to CHF 4’945’000.
2.1.3 Option C: Operating with bigger cabin
With this option, additionally to the investments necessary for options A and B, bigger
cabins are acquired with a capacity of 16 persons each. A new engine is needed for that.
The total investments for this option result to CHF 7’820’000.
2.1.4 Closing down
An additional possibility would be to close down the business. This option is not con-
sidered in the thesis. When closing down the business, the current installations are more
or less worthless. Closing down the business is not likely to be performed because of
the importance of the LKS for the district and the region.
2.2 Necessary investments
The following tables summarize the necessary investments for the strategic options A, B
and C. The numbers are retrieved from the board of the company and outlined in [3]. If
the table states ‘included’ for a specific topic, the costs for this part are included in an-
other part.
Table 1: Costs cable car
Costs in CHF 1’000 Option A Option B Option C
Pylons (Stützen) 1’250 Included Included
Supporting ropes (Tragseile) 80 Included Included
Pull ropes spanning weights (Zug-
seilspanngewichte)
345 345 345
Cabin 10 10 Included
Cable car infrastructure valley and
mountain station maintenance
208 Included Included
Static works 8 - -
Additional Costs for ‘Faster opera-
tion’
- 4’010 4’010
Additional costs for new cabin and
engine
- - 2’585
Total cable train infrastructure 1’901 4’365 6’940
Strategic Options 11
The costs for pylons come from the pylon construction itself and the headers to hold the
ropes. Currently, the cable car is built with 6 pylons. For all three strategic options, the
number of pylons is reduced to 3, in order to minimize maintenance costs.
For option A, no new pull ropes are necessary, but some maintenance costs to treat the
current pull ropes apply. For the other options, new pull ropes and stronger supporting
ropes are necessary.
Table 2: Costs building infrastructure
Costs in CHF 1’000 Option A Option B Option C
New constructions valley and
mountain station
500 500 800
Sanitary installations 80 80 80
Total building infrastructure 580 580 880
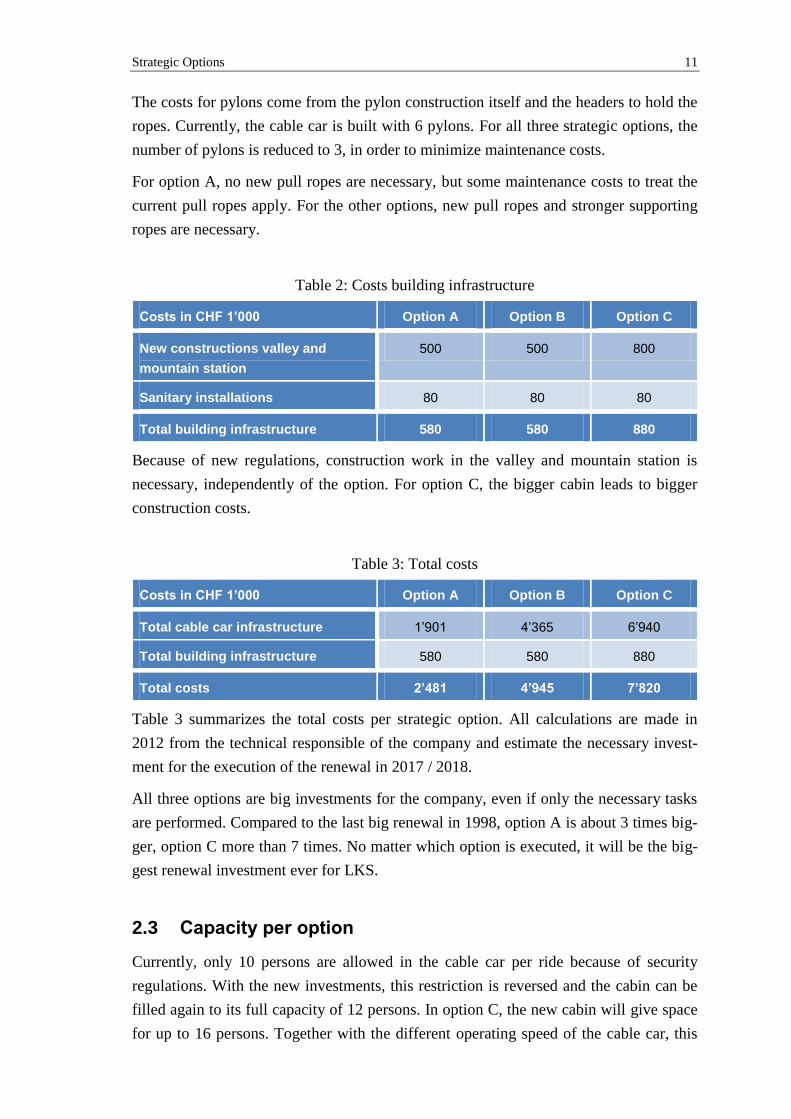
Because of new regulations, construction work in the valley and mountain station is
necessary, independently of the option. For option C, the bigger cabin leads to bigger
construction costs.
Table 3: Total costs
Costs in CHF 1’000 Option A Option B Option C
Total cable car infrastructure 1’901 4’365 6’940
Total building infrastructure 580 580 880
Total costs 2’481 4’945 7’820
Table 3 summarizes the total costs per strategic option. All calculations are made in
2012 from the technical responsible of the company and estimate the necessary invest-
ment for the execution of the renewal in 2017 / 2018.
All three options are big investments for the company, even if only the necessary tasks
are performed. Compared to the last big renewal in 1998, option A is about 3 times big-
ger, option C more than 7 times. No matter which option is executed, it will be the big-
gest renewal investment ever for LKS.
2.3 Capacity per option
Currently, only 10 persons are allowed in the cable car per ride because of security
regulations. With the new investments, this restriction is reversed and the cabin can be
filled again to its full capacity of 12 persons. In option C, the new cabin will give space
for up to 16 persons. Together with the different operating speed of the cable car, this

Strategic Options 12
leads to an increase of the persons that the cable car can transport per hour. Table 4 out-
lines the new capacity per strategic option and compares it to the current capacity.
Table 4: Capacity per strategic option
Current situ-
ation
Option A Option B Option C
Persons in cabin 10 12 12 16
Speed pylons (m/s) 5.5 5.5 6 6
Speed field (m/s) 6 6 7 7
Persons / hour 77 92 102 137
Increase to current
capacity
19% 32% 78%
There is an increase of the capacity of the cable car of 19% even with the investments
only for status quo. With the big expenditure of option C, the capacity can be increased
by 78%.
2.4 Depreciation on new investments
The depreciation rates on the cable car equipment are regulated by the federal law, de-
scribed in [2]. All current infrastructure (cable car, buildings) is depreciated to 0 by the
end of 2017, so for the following years, only the new investments need to be considered
for the depreciation.
The following depreciation rates are defined for cable cars in [2]:
4%: buildings, pylons, spanning weight
10%: cabins, electrical and mechanical equipment, supporting ropes
15%: roles, pylon headers
20%: security installations, supporting ropes
Table 5 shows the depreciation rate for the different parts of the investments:
Table 5: Depreciation rate for investments
In CHF 1’000 Total Option A Total Option B Total Option C
4% 1575 1575 1875
10% 306 2070 3945
15% 600 600 600
20% 0 700 1400

Strategic Options 13
With these numbers, the depreciation amount per year can be calculated as outlined in
table 6:
Table 6: Depreciation amount per year
In CHF 1’000 Total Option A Total Option B Total Option C
Year 1 – 5 183.6 500 839.5
Year 6 183.6 360 559.5
Year 7 153.6 330 529.5
Year 8 – 10 93.6 270 469.5
Year 11 - 25 63 63 75

Financial situation 14
3 Financial situation
In this section, the current financial situation of the company is discussed and the avail-
able capital at the end of 2017 for investments is estimated.
3.1 Current financial identifiers
3.1.1 Income statement 2012
Table 7 shows the income statement from the annual report (see [1]):
Table 7: Income statement 2012

Financial situation 15
The numbers are compared to the year 2011 and come up to a quite average perfor-
mance (see section 3.1.4 for a comparison of more years). On the revenue side, there are
no special items to find. On the expenses side, there is a onetime expenditure for the
social security of the employees of CHF 12’000 (included in personnel expenses). The
item disposal of provisions corresponds to a liquidation of provisions made in 2006.
Starting in 2012, the company pays a contribution of CHF 5’000 to the RigiPlus AG, a
company that centralizes the marketing activities for the touristic region of Rigi. It is
expected that this leads to more passengers for the LKS in the long run.
3.1.2 Balance sheet 2012
Table 8 shows the balance sheet of the LKS at the end of 2012 (see [1]):
Table 8: Balance sheet 2012
Financial situation 16
The balance sheet shows that the company itself is almost completely funded by the
shareholders (equity/debt-ratio is around 90%) and that currently there are no long-term
debts. The position ‘debtor SBB’ is an account at the SBB, which can be turned into
money at any time. The installations are almost completely depreciated. The item ‘secu-
rities’ is a long-term investment which can be turned into money at the end of 2017.
3.1.3 Capital distribution
Currently, the share capital is divided into 1’200 shares of a nominal value of CHF 100,
500 or 1’000, and the top 13 shareholders hold 36.18% of the total share capital. The
LKS never paid dividends to the shareholders, the share capital is not considered as an
investment in its proper sense but more as a sympathetic contribution to the LKS and
the touristic region of central Switzerland.
3.1.4 Development 2006 to 2012
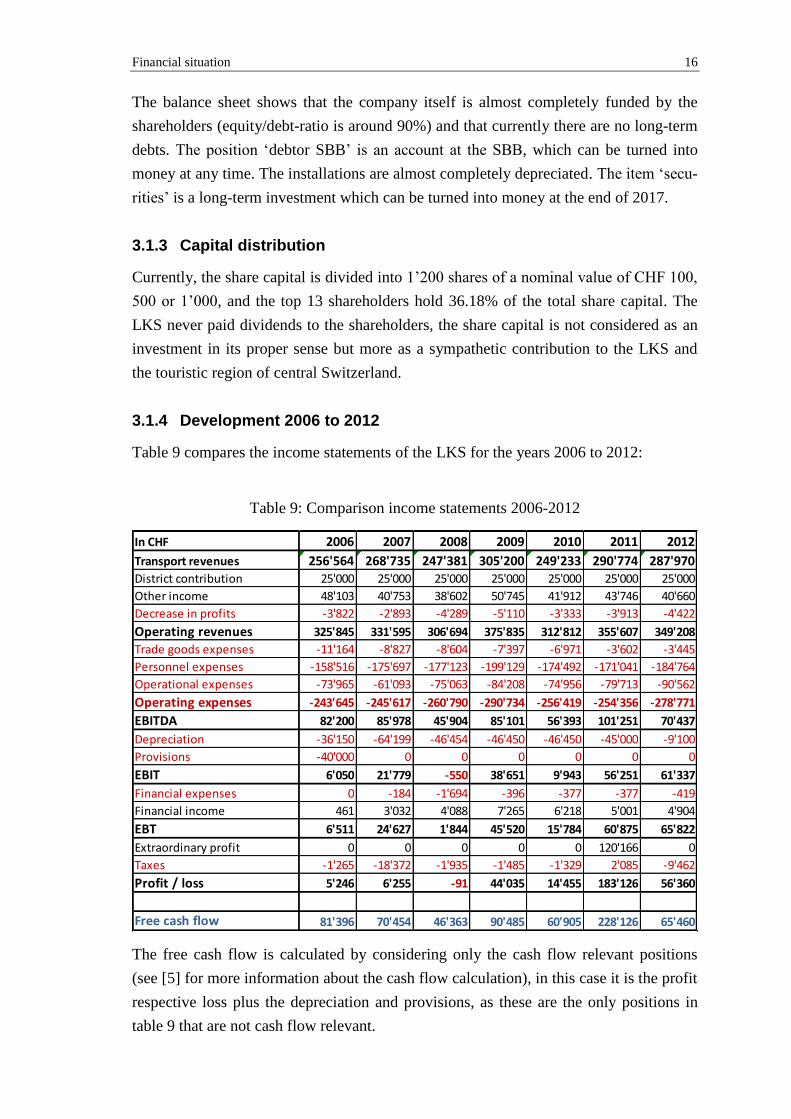
Table 9 compares the income statements of the LKS for the years 2006 to 2012:
Table 9: Comparison income statements 2006-2012
The free cash flow is calculated by considering only the cash flow relevant positions
(see [5] for more information about the cash flow calculation), in this case it is the profit
respective loss plus the depreciation and provisions, as these are the only positions in
table 9 that are not cash flow relevant.
In CHF 2006 2007 2008 2009 2010 2011 2012
Transport revenues 256'564 268'735 247'381 305'200 249'233 290'774 287'970District contribution 25'000 25'000 25'000 25'000 25'000 25'000 25'000
Other income 48'103 40'753 38'602 50'745 41'912 43'746 40'660
Decrease in profits -3'822 -2'893 -4'289 -5'110 -3'333 -3'913 -4'422
Operating revenues 325'845 331'595 306'694 375'835 312'812 355'607 349'208
Trade goods expenses -11'164 -8'827 -8'604 -7'397 -6'971 -3'602 -3'445
Personnel expenses -158'516 -175'697 -177'123 -199'129 -174'492 -171'041 -184'764
Operational expenses -73'965 -61'093 -75'063 -84'208 -74'956 -79'713 -90'562
Operating expenses -243'645 -245'617 -260'790 -290'734 -256'419 -254'356 -278'771
EBITDA 82'200 85'978 45'904 85'101 56'393 101'251 70'437
Depreciation -36'150 -64'199 -46'454 -46'450 -46'450 -45'000 -9'100
Provisions -40'000 0 0 0 0 0 0
EBIT 6'050 21'779 -550 38'651 9'943 56'251 61'337
Financial expenses 0 -184 -1'694 -396 -377 -377 -419
Financial income 461 3'032 4'088 7'265 6'218 5'001 4'904
EBT 6'511 24'627 1'844 45'520 15'784 60'875 65'822
Extraordinary profit 0 0 0 0 0 120'166 0
Taxes -1'265 -18'372 -1'935 -1'485 -1'329 2'085 -9'462
Profit / loss 5'246 6'255 -91 44'035 14'455 183'126 56'360
Free cash flow 81'396 70'454 46'363 90'485 60'905 228'126 65'460

Financial situation 17
The operational revenue is divided into winter and summer revenue, usually the summer
revenue corresponds to around 75% of the total revenue. Therefore the LKS is not de-
pendent of snow conditions as many other cable car companies. But of course, the
weather conditions during the year have a big impact to the financial success as for most
of the companies that operate in the touristic sector. Table 9 shows that the transport
revenues can change quite a lot between the years, this deviation is a result of the
weather conditions.
With the numbers in table 9, 2012 can be considered as a reference year in matters of
the revenues, as it is quite arbitrary on the revenue side based on the last few years and
because the weather conditions in 2012 were quite average. On the expenditure side, in
the year 2012, there was made a one-time expenditure for personnel costs (social securi-
ty) of CHF 12’000.-. This expenditure will not occur regularly in the future.
The compound annual growth rate (CAGR, details for the calculation see in [8]) is the
geometric mean growth rate for given time period. For the operating revenues, the
CAGR for the years 2006 to 2012 results to 1.16%. The CAGR for the expenses for the
years 2006 to 2012 (if from the value for 2012, the extraordinary items for the social
security of CHF 12’000 and RigiPlus of CHF 5’000 are subtracted), results to 1.20%.
3.2 Estimation capital at the end of 2017
With the numbers and explanations in section 3.1, a forecast about the financial situa-
tion at the end of the year 2017 is carried out. This estimates the availability of own
funds for the investments and shows the necessary additional capital for the different
strategic options.
Tables 10 and 11 show the predicted income, free cash flow and capital until 2017 for
an expected annual growth rate of the revenues of 1.16% and of the expenses of 1.20%
(same growth rate as the CAGR for the last 6 years, see above). All future revenues ex-
cept the district contribution and all future expenses are calculated with that annual
growth rate. The numbers for 2012 are taken from the annual report.

Financial situation 18
Table 10: Income statement forecast
For the personnel expenses, the value for 2013 and the following years is smaller than
the value for 2012, because the one-time expenditure of CHF 12’000 for social security
of the employees will not be paid in future. The profit for the years 2013 to 2017 is gen-
erally bigger than in the years before, because the cable car is almost completely depre-
cated and not much depreciation cost is due in the next years. However, this does not
affect the cash flow.
2012 2013 2014 2015 2016 2017
Transport revenues 287'970 291'310 294'690 298'108 301'566 305'064District contribution 25'000 25'000 25'000 25'000 25'000 25'000
Other income 40'660 41'132 41'609 42'091 42'580 43'074
Decrease in profits -4'422 -4'475 -4'529 -4'583 -4'638 -4'694
Operating revenues 349'208 352'967 356'770 360'616 364'508 368'444
Trade goods expenses -3'445 -3'486 -3'528 -3'571 -3'613 -3'657
Personnel expenses -184'764 -174'837 -176'935 -179'058 -181'207 -183'382
Operatinal expenses -90'562 -91'649 -92'749 -93'862 -94'988 -96'128
Operating expenses -278'771 -269'972 -273'212 -276'490 -279'808 -283'166
EBITDA 70'437 82'995 83'558 84'126 84'699 85'278
Depreciation -9'100 -9'100 -9'100 -9'100 -9'100 0
Provisions 0 0 0 0 0 0
EBIT 61'337 73'895 74'458 75'026 75'599 85'278
Financial expenses -419 -424 -429 -434 -439 -445
Financial income 4'904 4'961 5'018 5'077 5'136 5'195
EBT 66'660 79'280 79'905 80'537 81'174 90'918
Taxes -9'462 -9'576 -9'690 -9'807 -9'924 -10'044
Profit / Loss 57'198 69'704 70'215 70'730 71'250 80'874
Free cash flow 66'298 78'804 79'315 79'830 80'350 80'874

Financial situation 19
Table 11: Balance sheet forecast
In order to see what happens if the growth rates change, tables 12 and 13 display the
same calculations for an annual revenues growth rate of 2.5% and an expenses growth
rate of 0%, respectively revenues growth rate of 0% and expenses growth rate of 2.5%:
ASSETS 2012 2013 2014 2015 2016 2017
Liquid Assets 450'622 624'360 703'575 783'305 863'555 944'430
Accounts Receivable 165'034 70'000 70'000 70'000 70'000 70'000
Stock 353 353 353 353 353 353
Accrued Income 15'449 15'449 15'449 15'449 15'449 15'449
Current Assets 631'458 710'162 789'377 869'107 949'357 1'030'232
Securities 100'000 100'000 100'000 100'000 100'000 100'000
Cable Car 36'001 27'001 18'001 9'001 1 1
Shares 3'000 3'000 3'000 3'000 3'000 3'000
Office Equipment 390 390 390 390 390 390
Immovable Properties 29'200 29'200 29'200 29'200 29'200 29'200
Fixed Assets 168'591 159'591 150'591 141'591 132'591 132'591
Total Assets 800'049 869'753 939'968 1'010'698 1'081'948 1'162'823
EQUITY AND LIABILITIES 2012 2013 2014 2015 2016 2017
Accounts Payables 32'019 32'019 32'019 32'019 32'019 32'019
Accrued Expenses 16'065 16'065 16'065 16'065 16'065 16'065
Short-Term Liabilities 48'084 48'084 48'084 48'084 48'084 48'084
Provisions Ropes 28'920 28'920 28'920 28'920 28'920 28'920
Provisions Maintenance 15'000 15'000 15'000 15'000 15'000 15'000
Long-Term Liabilities 43'920 43'920 43'920 43'920 43'920 43'920
Total Liabilities 92'004 92'004 92'004 92'004 92'004 92'004
Share Capital 440'000 440'000 440'000 440'000 440'000 440'000
Reserves 14'000 14'000 14'000 14'000 14'000 14'000
Accumulated Profit 01.01. 197'685 254'045 323'749 393'964 464'694 535'944
Profit / Loss 31.12. 56'360 69'704 70'215 70'730 71'250 80'874
Equity 708'045 777'749 847'964 918'694 989'944 1'070'819
Total Equity and Liabilities 800'049 869'753 939'968 1'010'698 1'081'948 1'162'823
Equity / Debt ratio 88.5% 89.4% 90.2% 90.9% 91.5% 92.1%

Financial situation 20
Table 12: Sensitivity test: growth revenues 2.5%, growth expenses 0%
Table 13: Sensitivity test: growth revenues 0%, growth expenses 2.5%
The comparison of these different growth scenarios shows, that the available funds at
the end of 2017 are quite sensitive to the assumed growth rates. The total assets change
by almost CHF 240’000 if we change the scenario from a growth in revenues to a
growth in expenses.
3.3 Capital needs per strategic option
With the estimations in section 3.2, the necessary additional capital for the strategic
options can be calculated. The calculation is done with an expected annual growth rate
of revenues of 1.16% and expenses of 1.20% according to the CAGR of the last six
years (see section 3.1.4).
2012 2013 2014 2015 2016 2017
Operating revenues 349'208 357'424 365'845 374'477 383'324 392'393
Operating expenses -278'771 -266'771 -266'771 -266'771 -266'771 -266'771
EBITDA 70'437 90'653 99'074 107'706 116'553 125'622
Profit / Loss 57'198 77'536 86'083 94'844 103'823 122'127
Free cash flow 66'298 86'636 95'183 103'944 112'923 122'127
2012 2013 2014 2015 2016 2017
Current Assets 631'458 717'994 813'078 916'921 1'029'744 1'151'871
Fixed Assets 168'591 159'591 150'591 141'591 132'591 132'591
Total Assets 800'049 877'585 963'669 1'058'512 1'162'335 1'284'462
Total Liabilities 92'004 92'004 92'004 92'004 92'004 92'004
Equity 708'045 785'581 871'665 966'508 1'070'331 1'192'458
Total Equity and Liabilities 800'049 877'585 963'669 1'058'512 1'162'335 1'284'462
2012 2013 2014 2015 2016 2017
Operating revenues 349'208 349'097 348'984 348'868 348'749 348'627
Operating expenses -278'771 -273'440 -280'276 -287'283 -294'465 -301'827
EBITDA 70'437 75'657 68'708 61'585 54'284 46'800
Profit / Loss 57'198 62'192 55'011 47'650 40'106 41'473
Free cash flow 66'298 71'292 64'111 56'750 49'206 41'473
2012 2013 2014 2015 2016 2017
Current Assets 631'458 702'650 766'661 823'312 872'418 913'890
Fixed Assets 168'591 159'591 150'591 141'591 132'591 132'591
Total Assets 800'049 862'241 917'252 964'903 1'005'009 1'046'481
Total Liabilities 92'004 92'004 92'004 92'004 92'004 92'004
Equity 708'045 770'237 825'248 872'899 913'005 954'477
Total Equity and Liabilities 800'049 862'241 917'252 964'903 1'005'009 1'046'481

Financial situation 21
The total capital, available at the time of the investment, is expected to be close to CHF
1’162’000, whereof around CHF 32’000 are fixed assets, so CHF 1’130’000 are availa-
ble and can be made into money at any time. The necessary working capital for the op-
eration is quite low, as there is no stock required. To have some reserves and to guaran-
tee the liquidity of the company, a necessary working capital of CHF 180’000 can be
assumed, which results to about 60% of the expenses for a year.
As a result, around CHF 950’000 of the investments can be financed with available eq-
uity, which leads to the following capital needs per strategic option:
Table 14: Capital needs per option
In CHF 1’000 Investment Available liquid
assets
Required addi-
tional capital
Option A 2’481 950 1’531
Option B 4’945 950 3’995
Option C 7’820 950 6’870

Investment project evaluation 22
4 Investment project evaluation
This section estimates the future cash flow for the different strategic options outlined in
section 2 and valuates the renewal projects with different assumptions, independently of
the capital sources and financing options.
The following parameters differ between the scenarios:
Raise of revenues by 2018:
Generally, there is a growth of the revenues expected after the renewal, because
of the following reasons:
o Most of the turnover is made in nice-weather summer days, when the ca-
ble car runs at full capacity. During these days, the number of persons
who want to use the cable car exceeds the current capacity. Therefore,
with the bigger capacity, more persons can ride with the LKS on these
days.
o A new / renewed cable car is likely to attract more people than if the
business just goes on.
o There are ongoing and new marketing activities, for example the partici-
pation in RigiPlus.
The different scenarios use values from a small growth up to a growth propor-
tional to the increased capacity of the cable car.
Raise of expenses by 2018:
The expenses are not likely to grow in the same proportion as the revenues be-
cause of the following reasons:
o During operational hours, the current staffing of the company will be ad-
equate also for a double amount of passengers (personnel cost will not
grow as much as income).
o The operational cost for the cable car will grow because of more trans-
ported persons. However, the costs will not grow proportionally to the
income, because the number of rides almost stays the same (for options
B and C there are some more rides because of the faster operation).
The scenarios deal with expenses growths that are generally smaller than the
revenues growth.
Annual growth of revenues and expenses:
In agreement with LKS, to have simpler numbers, the annual growth of the rev-
enues and expenses for the years after 2018 is assumed to be 1% in the scenarios
below. This value is close to the CAGR for 2006 to 2012 (see section 3.1.4), but

Investment project evaluation 23
a bit more conservative than using the exact numbers as long as the revenues are
more than 25% higher than the expenses (because the difference of the exact
CAGR compared to using 1% for expenses is 25% higher than the difference of
the exact CAGR for revenues compared to using 1%).
Discount factor:
The discount factor varies between the scenarios. The following ideas influence
the chosen value of the discount factor:
o In [7], Pablo Fernandez, Javier Aguirreamalloa and Pablo Linares per-
formed a survey to get information about the commonly used discount
factor. Answers were collected from companies active in different sec-
tors and from professors, in many different countries. The answers from
Swiss companies and professors showed an average risk-free rate of
1.3%, and an average risk premium of 5.6%.
o Equity usually is expensive capital for investments. In the special case of
a regional cable car, the equity often is cheap, for the LKS even for free
(no dividends are paid and the shareholders do not hold the shares to earn
money with them).
o For small amounts, a bank credit can be retrieved for moderate condi-
tions because the loan can be secured with land properties.
Therefore, the scenarios are based on a discount factor of 1.5% to 4%.
The big amounts of depreciation often lead to a loss for the company in the first years
after the investments. For the more expensive financing options, some of the invest-
ments might not be activated in the balance sheet, what could lead to smaller deprecia-
tion. Or it might be possible not to depreciate the complete amount, what would lead to
a longer time span until all the investments are depreciated. Because of the high depre-
ciation and therefore no profit in the income statement, the tax expenses will be close to
zero for a long time. It is possible, that after the investments are depreciated to big parts,
there are higher tax expenses in later years. The tax expenses are not considered in the
calculations.
The depreciation is included in the calculations as proposed by the government. Be-
cause the depreciation is not cash flow relevant, it doesn’t change the cash flow calcula-
tions and the project valuation.
The following sections estimate the future cash flows and results of the operation of the
business for the different strategic options and valuate the investment projects. For all
scenarios, the net present value (NPV) is calculated (sum of all net inflows minus the
sum of all net outflows). The future cash flows are discounted with the chosen discount
rate. The calculations are made for 25 years, which corresponds to the duration of the
new operation concession. So, the net present value of a scenario can be calculated by

Investment project evaluation 24
subtracting the investment costs (not discounted, as they are due at the beginning of the
project) from the discounted cumulated free cash flow at the end of 2042. Details about
the calculation of the net present value can be found in the publication by Prof. Dr.
Christoph Lengwiler and Prof. Dr. Philipp Lütolf in section 2.2 [5].
The net present value (negative or positive) determines if the investment project with
the chosen assumptions is profitable.
4.1 Calculations option A
For option A, the total investments are CHF 2’481’000. In the following tables, the cash
flow is calculated for several scenarios with different assumptions.
4.1.1 Scenario 1
In scenario 1, the calculations are made with the following assumptions:
Raise of revenues by 2018: 10%
Raise of expenses by 2018: 5%
Annual growth of revenues and expenses: 1%
Discount factor: 4%
The raise of revenues by 2018 of 10% is realistic because of the bigger capacity of the
cable car, the raise of expenses of half of the raise of revenues seems adequate because
the staffing and the number of rides will not change after the renewal for this scenario.
The discount factor of 4% is small in case of an investment with a monetary motive,
because the average risk free rate and the average risk premium added results to 6.9%
for Switzerland (see above). But for the special case with cheap equity and moderate
interest for loans, 4% is probably too high. The annual growth of revenues and expenses
after 2018 is assumed to be 1%. Table 15 shows the calculations for scenario 1:
Table 15: Option A – Scenario 1
In CHF 2017 2018 2019 2020 2030 2040 2042
Operating revenue 363'659 404'025 408'065 412'146 455'266 502'897 513'005
Operating expenses -280'758 -297'744 -300'721 -303'729 -335'505 -370'607 -378'056
EBITDA 82'901 106'281 107'344 108'418 119'760 132'290 134'949
Depreciation 0 -183'600 -183'600 -183'600 -63'000 -63'000 -63'000
Provisions 0 0 0 0 0 0 0
EBIT 82'901 -77'319 -76'256 -75'182 56'760 69'290 71'949
Profit / Loss 77'924 -77'319 -76'256 -75'182 56'760 69'290 71'949
Free Cash Flow 77'924 106'281 107'344 108'418 119'760 132'290 134'949
Cumulated Discounted
Free Cash Flow 106'281 209'332 309'249 1'155'711 1'777'343 1'880'255

Investment project evaluation 25
The net present value for the project results to CHF -600’745 (investments subtracted
from cumulated discounted free cash flow in 2042). With these assumptions, the project
is clearly not profitable.
4.1.2 Scenario 2
In scenario 2, the calculations are made with the following assumptions:
Raise of revenues by 2018: 10%
Raise of expenses by 2018: 5%
Annual growth of revenues and expenses: 1%
Discount factor: 1.5%
All numbers are equal to scenario 1 (see section 4.1.1), except the discount factor
changed to 1.5%. This is a very low discount factor, but for the special conditions that
could fit the LKS (investments partly funded with cheap capital, low interest costs for
loans because of securities), it is realistic to achieve a medium discount factor for the
total capital as low as 1.5%.
Table 16 shows the calculations for scenario 2:
Table 16: Option A – Scenario 2
The parameters are still moderate, but the discount factor is adapted to the availability
of cheap equity. The net present value of the project results to CHF 18’131, a small
profitable outcome.
If the annual growth for revenues and expenses after the year 2018 changes to 0.5%, the
cumulated discounted free cash flow results to CHF 2’347’611, making the project loss-
making with a net present value of CHF -133’389. Changing the annual growth to 1.5%,
the cumulated discounted free cash flow is CHF 2’662’989, what results to a profitable
project with a net present value of CHF 181’989.
In CHF 2017 2018 2019 2020 2030 2040 2042
Operating revenue 363'659 404'025 408'065 412'146 455'266 502'897 513'005
Operating expenses -280'758 -297'744 -300'721 -303'729 -335'505 -370'607 -378'056
EBITDA 82'901 106'281 107'344 108'418 119'760 132'290 134'949
Depreciation 0 -183'600 -183'600 -183'600 -63'000 -63'000 -63'000
Provisions 0 0 0 0 0 0 0
EBIT 82'901 -77'319 -76'256 -75'182 56'760 69'290 71'949
Profit / Loss 77'924 -77'319 -76'256 -75'182 56'760 69'290 71'949
Free Cash Flow 77'924 106'281 107'344 108'418 119'760 132'290 134'949
Cumulated Discounted
Free Cash Flow 106'281 212'015 317'205 1'339'759 2'310'857 2'499'131

Investment project evaluation 26
4.1.3 Scenario 3
In scenario 3, the calculations are made with the following assumptions:
Raise of revenues by 2018: 15%
Raise of expenses by 2018: 7.5%
Annual growth of revenues and expenses: 1%
Discount factor: 2%
The assumptions in this scenario are moderate optimistic, with a raise of revenues by
15% in 2018, and a raise of expenses by half of that. The discount factor is assumed to
be 2% in this scenario, half of a percent higher than in scenario 2. The annual growth of
the revenues and expenses after 2018 is set to 1%
Table 17 shows the calculations for scenario 3:
Table 17: Option A – Scenario 3
Comparing the investment cost and the cumulated discounted free cash flow, this sce-
nario shows a profitable net present value of CHF 124’817.
If the discount factor is set to 1.5%, the resulting cumulated discounted free cash flow in
2042 results to CHF 2’764’270. If the annual growth after 2018 changes to 0% (addi-
tionally to changing the discount factor to 1.5%), the resulting cumulated discounted
free cash flow changes to CHF 2’441’619. These additional calculations show that there
is a very fine line between a profitable and a loss-making outcome for the project.
4.1.4 Scenario 4
In scenario 4, the calculations are made with the following assumptions:
Raise of revenues by 2018: 19%
Raise of expenses by 2018: 9.5%
Annual growth of revenues and expenses: 1%
Discount factor: 2%
In CHF 2017 2018 2019 2020 2030 2040 2042
Operating revenue 363'659 422'390 426'614 430'880 475'960 525'755 536'323
Operating expenses -280'758 -304'833 -307'881 -310'960 -343'493 -379'430 -387'057
EBITDA 82'901 117'557 118'732 119'920 132'466 146'325 149'266
Depreciation 0 -183'600 -183'600 -183'600 -63'000 -63'000 -63'000
Provisions 0 0 0 0 0 0 0
EBIT 82'901 -66'043 -64'868 -63'680 69'466 83'325 86'266
Profit / Loss 77'924 -66'043 -64'868 -63'680 69'466 83'325 86'266
Free Cash Flow 77'924 117'557 118'732 119'920 132'466 146'325 149'266
Cumulated Discounted
Free Cash Flow 117'557 233'915 349'086 1'438'122 2'421'039 2'605'817

Investment project evaluation 27
The assumptions in this scenario are optimistic, with a raise of revenues of 19% in
2018. This value corresponds to the growth of the capacity of the cable car for option A
(see table 4). The expenses are expected to rise by half of the revenues in 2018. The
other assumptions are equal to scenario 3.
Table 18 shows the calculations for scenario 4:
Table 18: Option A – Scenario 4
For these optimistic assumptions with a raise in revenues according to the raise in ca-
pacity of the cable car, the net present value is CHF 324’769 and therefore shows a
clearly profitable outcome.
If the annual growth after 2018 is changed to 0%, the net present value drops to CHF
3’773. Again, this shows that there is a small edge in the assumptions to stay on the
profitable side for the investment project.
4.1.5 Summary
The calculations in the different scenarios for option A show that it is difficult to make a
profitable project on the investments. The returning cumulated discounted free cash
flow exceeds the necessary investments of CHF 2’481’000 only if the assumptions are
on the edge. So the parameters need to be set quite optimistic to result in a positive re-
turn on investments.
With a discount factor of 4% (which is too low in case of investments to make money,
but too high in the case of free equity capital), the revenues have to rise by 19% and
expenses by only 5% in 2018 to make the project profitable.
With a discount factor of 2%, an increase of the revenues by 12% and of the expenses
by 6% would just be profitable. Given a discount factor of 1.5%, an increase of the
revenues by 10% and of the expenses by 5% would make the project profitable.
In CHF 2017 2018 2019 2020 2030 2040 2042
Operating revenue 363'659 437'082 441'453 445'867 492'515 544'043 554'978
Operating expenses -280'758 -310'504 -313'609 -316'745 -349'884 -386'490 -394'258
EBITDA 82'901 126'577 127'843 129'122 142'631 157'553 160'720
Depreciation 0 -183'600 -183'600 -183'600 -63'000 -63'000 -63'000
Provisions 0 0 0 0 0 0 0
EBIT 82'901 -57'023 -55'757 -54'478 79'631 94'553 97'720
Profit / Loss 77'924 -57'023 -55'757 -54'478 79'631 94'553 97'720
Free Cash Flow 77'924 126'577 127'843 129'122 142'631 157'553 160'720
Cumulated Discounted
Free Cash Flow 126'577 251'864 375'872 1'548'474 2'606'813 2'805'769

Investment project evaluation 28
The additional calculations for scenarios above for the annual growth after the year
2018 show that the net present value for the project is very volatile to the chosen value.
Even a small change as described in scenario 2 can switch the project from being profit-
able to loss-making.
4.2 Calculations option B
For option B, investments of CHF 4’945’000 are necessary.
4.2.1 Scenario 1
In scenario 1, the calculations are made with the following assumptions:
Raise of revenues by 2018: 20%
Raise of expenses by 2018: 10%
Annual growth of revenues and expenses: 1%
Discount factor: 4%
The increase in the revenues of 20% by 2018 seems realistic because of the increased
capacity of the cable car, the increase in expenses of 10% (half of the increase in reve-
nues) is also suitable because the staffing and the number of rides doesn’t change signif-
icantly. The chosen discount factor of 4% is realistic, because for the big increase of the
investment volume compared to option A, is cannot be expected that the capital can be
gathered for the same cost of capital.
Table 19 displays the calculations for scenario 1:
Table 19: Option B – Scenario 1
The net present value results to CHF -2’665’784, a big loss of money. With this scenar-
io, it is impossible to legitimate the investments from a financial point of view. There-
fore, in scenario 2 a very optimistic calculation is shown.
In CHF 2017 2018 2019 2020 2030 2040 2042
Operating revenue 363'659 440'755 445'162 449'614 496'653 548'614 559'642
Operating expenses -280'758 -311'922 -315'041 -318'192 -351'482 -388'254 -396'058
EBITDA 82'901 128'833 130'121 131'422 145'172 160'360 163'583
Depreciation 0 -183'600 -183'600 -183'600 -63'000 -63'000 -63'000
Provisions 0 0 0 0 0 0 0
EBIT 82'901 -54'767 -53'479 -52'178 82'172 97'360 100'583
Profit / Loss 77'924 -54'767 -53'479 -52'178 82'172 97'360 100'583
Free Cash Flow 77'924 128'833 130'121 131'422 145'172 160'360 163'583
Cumulated Discounted
Free Cash Flow 128'833 253'749 374'867 1'400'935 2'154'468 2'279'216

Investment project evaluation 29
4.2.2 Scenario 2
In scenario 2, the calculations are made with the following assumptions:
Raise of revenues by 2018: 32%
Raise of expenses by 2018: 10%
Annual growth of revenues and expenses: 1%
Discount factor: 2%
The raise of revenues by 2018 of 32% corresponds to the increased capacity of the cable
car for option B (see table 4). This assumption is very optimistic itself, and additionally
the raise in expenses of only 10% is quite optimistic as well. The discount factor is set
to 2% for this scenario, difficult to realize but feasible with cheap equity capital.
Table 20 displays the calculations for scenario 2:
Table 20: Option B – Scenario 2
Even with these optimistic numbers, the net present value for the project shows a loss of
more than CHF 1 million. If the calculations are done with a discount factor of 0, the
resulting cumulated discounted free cash flow is CHF 4.8 million, so even if all capital
is free of capital cost, the net present value is negative.
These calculations make option B not realizable from a financial point of view.
4.3 Option C
For option C, investments of CHF 7’820’000 are necessary.
4.3.1 Scenario 1
In scenario 1, the calculations are made with the following assumptions:
Raise of revenues by 2018: 40%
Raise of expenses by 2018: 20%
In CHF 2017 2018 2019 2020 2030 2040 2042
Operating revenue 363'659 484'830 489'678 494'575 546'319 603'476 615'606
Operating expenses -280'758 -311'922 -315'041 -318'192 -351'482 -388'254 -396'058
EBITDA 82'901 172'908 174'637 176'383 194'837 215'221 219'547
Depreciation 0 -183'600 -183'600 -183'600 -63'000 -63'000 -63'000
Provisions 0 0 0 0 0 0 0
EBIT 82'901 -10'692 -8'963 -7'217 131'837 152'221 156'547
Profit / Loss 77'924 -10'692 -8'963 -7'217 131'837 152'221 156'547
Free Cash Flow 77'924 172'908 174'637 176'383 194'837 215'221 219'547
Cumulated Discounted
Free Cash Flow 172'908 344'052 513'451 2'115'255 3'560'974 3'832'753

Investment project evaluation 30
Annual growth of revenues and expenses: 1%
Discount factor: 4%
The raise in revenues by 40% is optimistic, but achievable with the bigger cabin and the
big increase in the capacity of the cable car. The raise of expenses of 20% seems realis-
tic because the current staffing and number of drives does not change significantly. The
discount factor of 4% seems feasible if a good part of the investments can be financed
with cheap equity money.
Table 21 shows the calculations for scenario 1:
Table 21: Option C – Scenario 1
These assumptions are legitimate and quite defensive. They result to a big loss on the
project, the net present value is almost CHF -5 million. Therefore, scenario 2 calculates
the project with optimistic assumptions.
4.3.2 Scenario 2
In scenario 2, the calculations are made with the following assumptions:
Raise of revenues by 2018: 78%
Raise of expenses by 2018: 25%
Annual growth of revenues and expenses: 1%
Discount factor: 2%
The raise of revenues of 78% is very optimistic and corresponds to the raise in capacity
for option C (see table 4). The raise of expenses of 25% is very low compared to the
raise in revenues and therefore optimistic as well. The discount factor of 2% is very low
in reference to the big investment amount and difficult to realize.
Table 22 shows the calculations for scenario 2:
In CHF 2017 2018 2019 2020 2030 2040 2042
Operating revenue 363'659 514'214 519'356 524'550 579'429 640'050 652'915
Operating expenses -280'758 -340'279 -343'681 -347'118 -383'435 -423'550 -432'064
EBITDA 82'901 173'935 175'674 177'431 195'994 216'500 220'851
Depreciation 0 -183'600 -183'600 -183'600 -63'000 -63'000 -63'000
Provisions 0 0 0 0 0 0 0
EBIT 82'901 -9'665 -7'926 -6'169 132'994 153'500 157'851
Profit / Loss 77'924 -9'665 -7'926 -6'169 132'994 153'500 157'851
Free Cash Flow 77'924 173'935 175'674 177'431 195'994 216'500 220'851
Cumulated Discounted
Free Cash Flow 173'935 342'583 506'103 1'891'384 2'908'719 3'077'140

Investment project evaluation 31
Table 22: Option C – Scenario 2
Even with these very optimistic growth assumptions, the net present value of the project
is CHF -1’184’943. To make it profitable, the discount factor (besides the very optimis-
tic other assumptions) needs to be set to 0.5%.
Given all these calculations, it makes no sense to go for strategic option C from a finan-
cial point of view.
4.4 Conclusion
The calculations in this section show that it is very difficult to get a positive return on
investment for the project. This is no surprise, as many similar cable car companies
struggle with the same problems and have trouble showing profitable operational re-
sults.
For options B and C, from a financial point of view, there is no positive return on in-
vestment to expect, not even with the very optimistic assumptions in scenario 2 of each
of these options – even if the cost of capital is zero, it is almost impossible to get a posi-
tive return on investments. However, this covers only the financial view. There might be
other reasons that could legitimate to go for these options.
For option A, the calculations show that it is difficult to get a positive return on invest-
ment, but with specific assumptions, it is possible to get a profitable project. The edge is
quite close, and the investments are not free of risk.
As a result, only option A could make sense from an entrepreneurial point of view.
In CHF 2017 2018 2019 2020 2030 2040 2042
Operating revenue 363'659 653'786 660'324 666'927 736'703 813'778 830'135
Operating expenses -280'758 -354'457 -358'002 -361'582 -399'411 -441'198 -450'066
EBITDA 82'901 299'329 302'322 305'346 337'292 372'580 380'069
Depreciation 0 -183'600 -183'600 -183'600 -63'000 -63'000 -63'000
Provisions 0 0 0 0 0 0 0
EBIT 82'901 115'729 118'722 121'746 274'292 309'580 317'069
Profit / Loss 77'924 115'729 118'722 121'746 274'292 309'580 317'069
Free Cash Flow 77'924 299'329 302'322 305'346 337'292 372'580 380'069
Cumulated Discounted
Free Cash Flow 299'329 595'605 888'859 3'661'817 6'164'568 6'635'057

Financing possibilities 32
5 Financing possibilities
This section outlines different financing possibilities and compares them. Basically,
there exist 2 different kinds of financing: equity financing (for example with share capi-
tal) and debt financing (for example with a bank loan).
Of course all available reserves and equity can be used for the investments. They are not
listed below because these capital sources have to be used anyway to get enough foreign
capital for any investment.
5.1 Share capital
5.1.1 Description
As a public company, LKS can issue more shares to expand the share capital.
5.1.2 Discussion
For common companies, equity capital is more expensive then debt capital (because in
case of bankruptcy, the equity capital is the money that is paid back last – higher risk
requires higher return), this can make several percentage of cost for the capital. The
shareholders are paid out with dividends.
For the LKS, the situation is exactly the other way around: here the debt capital is ex-
pensive because of the interest payments, and the equity capital is ‘for free’. The reason
is that the LKS never paid dividends up to now, and therefore has no costs for the share
capital. The shareholders of the LKS do not see themselves as investors in its proper
sense, but more as sponsors. Most of the shareholders are locals that have an emotional
connection to the company or to the mountain, or profit in an indirect way from the ca-
ble car (gastronomy or supplier for example).
In order to finance the necessary investments, it is important that the share capital is
seen as ‘free’ capital in future as well. In case of an increase of the share capital, the
new shareholders should not expect any monetary return on their investment.
5.2 Bank loans
5.2.1 Description
Bank loans can be a good capital source, but it is usually quite difficult to get, especially
when the future process of the business operation is unclear. For a bank, it is important

Financing possibilities 33
that the loan can be secured to minimize the risk of losing the money, therefore the
lending politics are quite defensive.
5.2.2 Discussion
A meeting with the Cantonal Bank of Schwyz (with Walter Rupf on 11.07.2013)
showed the conditions to get a loan from the bank.
For unsecured loans (security for the bank only with future cash flows), the following
conditions apply:
The lending company must be able to repay the complete loan within 7 years
(viability – Tragbarkeit). It is possible to get a loan life span of more than 7
years, the viability only defines the maximal amount of credit.
The current interest rate is around 4.5% per year.
If the loan can be covered (e.g. by land property), the conditions change in the following
way:
The company still has to be able to repay the complete loan within 7 years (no
change in the maximum amount of credit), unless the secured items create more
cash flow (this is usually not the case for land property of a cable car company).
The interest rate is around 2% lower than for unsecured loans.
Section 6.1 contains a calculation of the amount of credit that could be received depend-
ing on specific assumptions.
5.3 Non bank loans
5.3.1 Description
Loans can come from other sources than from banks, for example from private per-
sons. If a private person accepts looser conditions than a bank, some money on top of
the maximum acquirable bank loan could be collected. In the realm of possibilities is
also that another company can be persuaded to invest some money into the LKS, for
example one of the touristic companies in the region of Rigi that has an interest in the
future of the LKS.
Another source of capital could come from the district of Küssnacht (they already do-
nate an annual amount of money for the operation of the LKS). For such a big and nec-
essary investment project as the renewal of the LKS, the district could decide to help to
finance the investments with a loan, a premium rate loan, an interest-free loan or a sub-
sidy.

Financing possibilities 34
Another possibility, which is specific to touristic companies, is a premium interest gov-
ernmental loan. On average, the Swiss cable car companies have around 9% of the
total capital as interest-free loan from the government, distributed from the different
REVs (Regionaler Entwicklungs-Verband) to the single companies (details see in [5]).
Some conditions apply to get such money, but as for the last renewal, the LKS could
finance a part of the investments with an interest-free governmental loan, it might be
that this will be the case again.
5.3.2 Discussion
Beside bank loans, especially no interest or premium interest loan from the government
and investments from the district of Küssnacht have to be taken into consideration. Up
to now, the LKS never took a loan from a private person or another company, however
it is imaginable that there are private persons or companies that are willing to buy bonds
of the LKS with some return on their money. But it would be better for the LKS if these
subjects could be convinced to buy shares instead of bonds.
5.4 Other Sources
Another financing possibility could be to lease some equipment. It is quite common for
cable car companies to lease for example the cabins, but this only applies for cable cars
with standard components as cabins that can be used for other companies as well. For
the LKS, the equipment is very specific, therefore it is not likely that some of it can be
leased.
In the realm of possibility could be to have some cross-subsidization. The LKS owns
land properties in the center of Küssnacht, which is quite wanted. It would be possible
to finance a part of the investment costs by building accommodation properties for ex-
ample on the land and to integrate the cable car into the project. Examining the possibil-
ity of cross-subsidization is not in the scope of this thesis.

Application to LKS 35
6 Application to LKS
This section brings the calculations in sections 4 and 5 together. The financing possibili-
ties are applied to the specific case of the LKS and different alternatives are discussed.
6.1 General considerations
Generally, it is a good idea to gather as much capital as possible from the equity side
(shares), as in this special case of a regional positioned cable car, the equity (share capi-
tal) is cheaper than debt capital (in the current situation, it is even for free). The limiting
factor for equity capital is the number of persons that are willing to buy shares. It is im-
portant for a share capital increase that the new capital is not gathered from profit-
oriented investors. The attitude of the shareholders must not change, because if the
share capital has similar costs as debt capital or even more in the future, the total capital
would change completely and the LKS could not operate profitably in the future.
The financing with a bank loan (the case was discussed with the cantonal bank of
Schwyz, see section 5.2) is dependent on the future cash flows and the viability (Trag-
barkeit). With the available land property of the LKS, the bank loan can be secured and
the capital costs are moderate, but the amount of available loan is restricted. Table 23
shows an example of a calculation of the viability with a free cash flow of CHF 100’000
per year and an interest rate of 2.5% (the current interest rate for secured loans, see sec-
tion 5.2.2):
Table 23: Example viability
The free cash flow is used for interest payments and to repay the loan. The total loan has
to be repaid within 7 years.
This example shows, that with these identifiers, the maximum bank loan expected is
around CHF 650’000, because this is the amount that could be paid back within 7 years.
Year Amount 01.01. Interest Amortization Amount 31.12.
1 650'000 16'250 83'750 566'250
2 566'250 14'156 85'844 480'406
3 480'406 12'010 87'990 392'416
4 392'416 9'810 90'190 302'227
5 302'227 7'556 92'444 209'782
6 209'782 5'245 94'755 115'027
7 115'027 2'876 97'124 17'903
8 17'903 448 99'552 -81'650
9 -81'650 -2'041 102'041 -183'691
10 -183'691 -4'592 104'592 -288'283
Application to LKS 36
Finally, premium financing possibilities as loans with premium interest rates or inter-
est–free loans should be used with first priority.
It is difficult to find other financing possibilities than the described ones. The cable car
business is not considered as profitable in general, therefore, investors with clear finan-
cial aims are not likely to invest in this business.
6.2 Comparable companies
The Luftseilbahn Adliswil – Felsenegg ([10]) made renewal investments for a bigger
cable car, but comparable to the investments now discussed for LKS. In 2008, the cab-
ins (with 30 persons each), supporting ropes and different other parts were replaced (see
[4]). The total investments for these renewals were CHF 3’432’425. Therefore, the in-
vestments were somewhere between strategic option A and B for LKS, but the LAF has
a capacity (and therefore a possible cash flow) of around 2.5x the capacity of LKS.
The financing of the investments was as follows:
Equity financing 312’547
Bank loan 1’600’000
Interest revenue 69’028
District, commune, privates 1’450’850
Almost half of the total investments were financed by a bank loan (with a linear repay
within 15 years and no premium conditions), and 42% came from private or communal
sponsors.
This example shows that it is difficult to finance an investment for a cable car without
the help from sponsors from private, commune, district or government.
6.3 Financial ratios proposed by Seilbahnen Schweiz
The federation of the Swiss cable cars (see [6]) proposes in its publication about the
financial situation of cable car companies (see [9]) ranges in which important financial
ratios should be to allow a successful operation. The ratios mainly apply for bigger
companies, but most of them are also valid for small companies such as LKS.
The most important ratios are:
Free cash flow / investment cost > 3.8%:
For the year 2012, this ratio cannot be computed for LKS. The free cash flow /
total equity is 8.18%, what is a similar calculation and fulfills the proposal.
Free cash flow / revenues > 28%:
The value for LKS in 2012 is 18.74%, below the proposed range.

Application to LKS 37
Equity / total capital > 40%:
The value for LKS in 2012 is 87%, this proposal is by far fulfilled.
Table 24 displays the fulfillment of the proposal for these ratios for the different strate-
gic options. The most realistic scenario from section 4 is chosen for every option (sce-
nario 2 for option A, scenario 1 for option B and C), and the ratios are calculated for the
year 2018. The total capital is set to the investment costs for the specific option plus
CHF 200’000 working capital, and it is assumed that, beside the currently available eq-
uity, the investments are financed with debt capital.
Table 24: Financial ratios in combination with strategic options
Option A - Scenario 2 Option B – Scenario 1 Option C – Scenario 1
Free cash flow
/ investments
4.28% 3.49% 2.22%
Free cash flow
/ revenues
26.3% 29.2% 33.8%
Equity / total
capital
42.9% 22.4% 14.3%
The results in table 24 show, that it is difficult to fulfill the proposed results for these
financial ratios for all options. For options B and C, a good part of the investments have
to be financed by additional equity to stay in the proposed range for the ‘equity / total
capital’ ratio. The ‘free cash flow / investments’ ratio is in the proposed range for option
A only. For option B, the generated free cash flow is shortly below and for option C
well below the proposed range. The ‘free cash flow / revenues’ ratio is fulfilled for op-
tions B and C, but marginally not fulfilled for option A.
6.4 Financing examples
The following sections show financing examples for the different strategic options. The
calculations for option A are outlined in detail, for options B and C, only the resulting
values (with similar calculations as in option A) are stated.
6.4.1 Option A
Summary for option A:
Total investments CHF 2’481’000
Available equity CHF 950’000
Missing capital CHF 1’531’000

Application to LKS 38
In the next sections, exemplary calculations are made for the different capital sources.
Scenario 2 of option A (see section 4.1.2) is taken as base scenario, because it is moder-
ate from the assumptions (small rise in revenues of 10%, raise in expenses of 5%) and
results to a small positive net present value for the project (the assumed discount factor
of 1.5% is still at the upper limit, given a big part of the required capital can be retrieved
as equity with no capital cost).
6.4.1.1 Interest-free governmental loan
At the last renewal in 1998, the REV (Regionaler Entwicklungs-Verband, distributor of
governmental loans) contributed with an interest-free loan of CHF 150’000 with a pay-
back timespan of 15 years. As the total amount for the investments was CHF 830’000,
the REV financed 18% of the investments.
As currently, 9% of the total capital of cable car companies consists of interest-free
loans from the REV, and this is a medium value (not all companies just renewed their
infrastructure, so most of them already paid back the loan partly), LKS can expect to get
an interest-free loan in the same range.
18% of the investments for option A result to CHF 446’580. To be in a similar range as
for the last renewal, the interest-free loan could be something like CHF 375’000 (15%
of the total investments). With a similar repay period of 15 years, the annual pay back
amount results to CHF 25’000.
6.4.1.2 Bank loan
In scenario 2 of option A, the free cash flow for the first seven years (which is used
from the banks to compute the viability) is on average CHF 109’523. For easier compu-
tation, CHF 110’000 is taken as average value. As the payback amount for the interest-
free loan from the REV reduces the cash flow, the amount of CHF 25’000 is subtracted
from the free cash flow, therefore the resulting medium free cash flow is CHF 85’000.
Table 25 shows the obtainable bank loan for the assumptions above and an interest rate
of 2.5%:
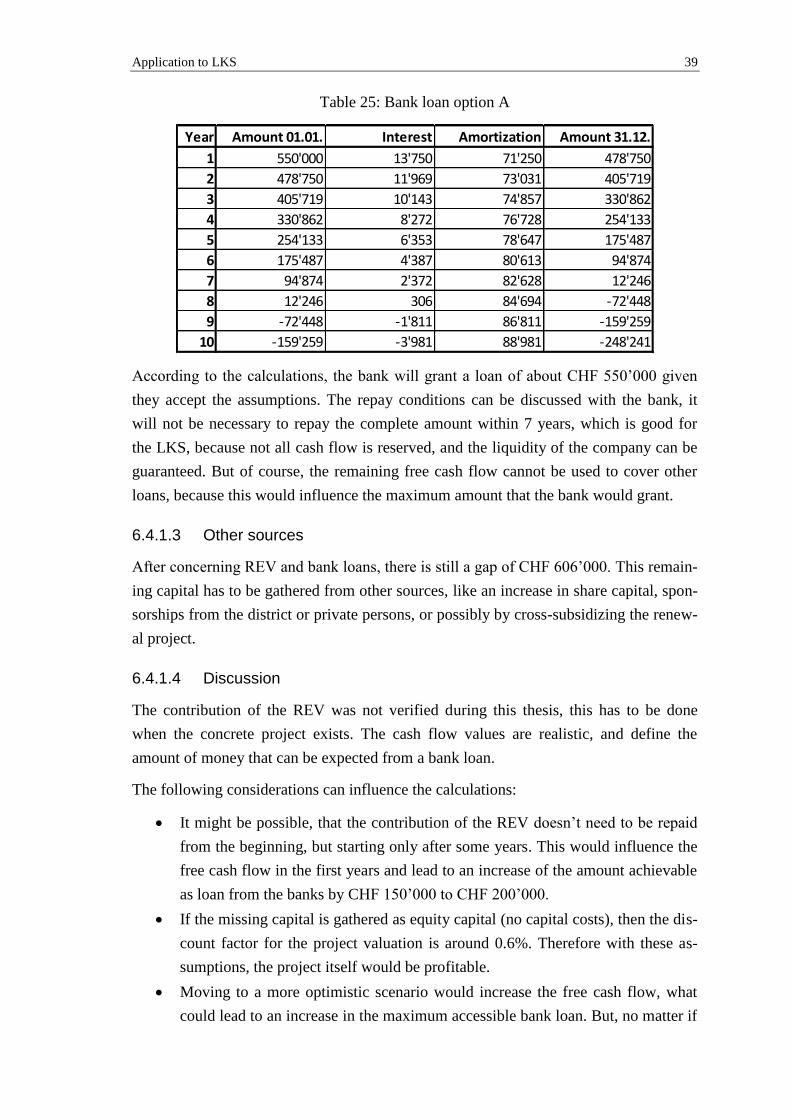
Application to LKS 39
Table 25: Bank loan option A
According to the calculations, the bank will grant a loan of about CHF 550’000 given
they accept the assumptions. The repay conditions can be discussed with the bank, it
will not be necessary to repay the complete amount within 7 years, which is good for
the LKS, because not all cash flow is reserved, and the liquidity of the company can be
guaranteed. But of course, the remaining free cash flow cannot be used to cover other
loans, because this would influence the maximum amount that the bank would grant.
6.4.1.3 Other sources
After concerning REV and bank loans, there is still a gap of CHF 606’000. This remain-
ing capital has to be gathered from other sources, like an increase in share capital, spon-
sorships from the district or private persons, or possibly by cross-subsidizing the renew-
al project.
6.4.1.4 Discussion
The contribution of the REV was not verified during this thesis, this has to be done
when the concrete project exists. The cash flow values are realistic, and define the
amount of money that can be expected from a bank loan.
The following considerations can influence the calculations:
It might be possible, that the contribution of the REV doesn’t need to be repaid
from the beginning, but starting only after some years. This would influence the
free cash flow in the first years and lead to an increase of the amount achievable
as loan from the banks by CHF 150’000 to CHF 200’000.
If the missing capital is gathered as equity capital (no capital costs), then the dis-
count factor for the project valuation is around 0.6%. Therefore with these as-
sumptions, the project itself would be profitable.
Moving to a more optimistic scenario would increase the free cash flow, what
could lead to an increase in the maximum accessible bank loan. But, no matter if
Year Amount 01.01. Interest Amortization Amount 31.12.
1 550'000 13'750 71'250 478'750
2 478'750 11'969 73'031 405'719
3 405'719 10'143 74'857 330'862
4 330'862 8'272 76'728 254'133
5 254'133 6'353 78'647 175'487
6 175'487 4'387 80'613 94'874
7 94'874 2'372 82'628 12'246
8 12'246 306 84'694 -72'448
9 -72'448 -1'811 86'811 -159'259
10 -159'259 -3'981 88'981 -248'241

Application to LKS 40
a more optimistic scenario is realistic, it is doubtful that the banks would deal
with such a scenario. Moreover, it is possible that scenario 2 is already too opti-
mistic for dealing with the banks, what would lead to a smaller amount than the
banks are willing to grant as bank loan.
In general, the option A is difficult to finance, but can be possible with the assumptions
of a small growth.
6.4.2 Option B
Summary for option B:
Total investments CHF 4’945’000
Available equity CHF 950’000
Missing capital CHF 3’995’000
If the calculations for a contribution of the REV are done with 15% of the total invest-
ment amount, this results to around CHF 750’000 and a repay amount of CHF 50’000
per year, if the repay period is set to 15 years. This value is very high compared to the
amount that LKS got for the last investment, so it is arguable if it is realistic.
Taking a mix of scenario 1 and scenario 2 (realistic and optimistic) leads to a free cash
flow of around CHF 150’000 per year. After subtracting the repay amount of the REV
contribution, there is a remaining free cash flow of CHF 100’000, what leads to maxi-
mum amount that can be retrieved as a bank loan of CHF 650’000.
After these transactions, there is still a gap of CHF 2’595’000 that must be financed
from other sources. Changing the assumptions can move the missing amount a few
percentages, but in general, the amount is too big to be financed realistically from own
means.
To realize option B, the availability of a sponsor supporting with an amount in the scale
of the missing capital is necessary.
6.4.3 Option C
Summary for option C:
Total investments CHF 7’820’000
Available equity CHF 950’000
Missing capital CHF 6’870’000
If the similar calculations as for option A and B are made, this leads to a contribution
from the REV of CHF 1’173’000 and a yearly repay of CHF 78’200. Considering a mix
of scenario 1 and 2 (which is very optimistic) leads to a free cash flow of about CHF

Application to LKS 41
240’000 per year, which results to around CHF 160’000 after subtracting the repay
amount. With that, about CHF 1’050’000 can be expected as bank loan.
The missing amount that has to be collected from other sources is more than CHF
5’500’000.
Even more than for option B, to realize option C, LKS is heavily dependent on a spon-
sor which finances most of the investments.
6.5 Conclusion
Considering all calculations and discussions outlined in this thesis, in my opinion, only
the financing of the investments for option A seems feasible. Already for the necessary
investments to go on with the operation of the cable car, there is a gap of around CHF
600’000 that cannot be financed with bank loans, interest-free governmental loans or
available equity. I guess it is difficult, but possible, to collect that amount as share capi-
tal from private persons and as subsidy or interest-free loan from the district and realize
option A.
To go for options other than A, external financing is necessary. The depreciation for
options B or C would turn the result of the company to a negative number for many
years, if all investments are capitalized in the balance sheet and have to be depreciated.
As a conclusion, option A seems difficult but feasible to me. To realize options B or C,
there is another party with non-monetary interests required (for example if the invest-
ments are treated as an infrastructure project instead of maintaining the road to the See-
bodenalp).

Further activities 42
7 Further activities
7.1 Marketing possibilities
To improve the cash flow situation with regard to the renewal, some marketing activi-
ties could be imagined. For example, a possibility is to use the road to go sledding in
winter (it was used for sledding in the past) or drive down with a scooter (Trottinett) in
summer. Another idea is to build a downhill bike track to attract more passengers.
With the collaboration in RigiPlus, the number of passengers is expected to increase in
the long run. As that collaboration only started in 2012, the effect cannot be outlined
yet.
7.2 Open points
The situation with the missing parking spaces is not considered in this thesis. Current-
ly, there exist 80 parking spaces close to the valley station. For strategic option A (with
the moderate higher capacity, the board estimates that at around 40 additional parking
spaces are required (see [3]), for options B and C even more.
Another open point, but not in the responsibility of the LKS, is the road to the See-
bodenalp. It is a political issue for the district whether to have the road up there and if
the use of the road should be restricted or not (currently, there are no restrictions). At
the Seebodenalp, a collection of land-owners supplies parking spaces for persons travel-
ling by car. The road is not in proper conditions anymore, for example if it should be
used by busses, investments for the maintenance of the road are necessary.
7.3 Next steps
In a next step, the topic is presented to the population of Küssnacht, to start the public
discussion about the future of the LKS. Afterwards, it is time for a leading decision to-
gether with the district of Küssnacht, in which direction to go with the LKS.
After having a decision, the concrete financing of the chosen strategic option and the
renewal project can be approached.

References 43
References
[1] Luftseilbahn Küssnacht - Seebodenalp (2012): Jahresbericht 2012,
http://www.luftseilbahnseebodenalp.ch/pdf/jahresbericht_2012.pdf.
[2] Schweizerische Eidgenossenschaft (1995): Depreciation for cable cars,
http://www.estv.admin.ch/bundessteuer/dokumentation/00242/00382/index.html
?lang=de&download=NHzLpZeg7t,lnp6I0NTU042l2Z6ln1acy4Zn4Z2qZpnO2
Yuq2Z6gpJCDdIN,gmym162epYbg2c_JjKbNoKSn6A--.
[3] Luftseilbahn Küssnacht – Seebodenalp (2012): Strategic Analysis VR,
05VR_Sitzung_März_2012_final.pptx.
[4] Luftseilbahn Adliswil - Felsenegg (2008): Schlussabrechnung Teil-Erneuerung,
Schlussabr_Teil-Erneuerung_ZVV.xls.
[5] Prof. Dr. Christoph Lengwiler, Prof. Dr. Philipp Lütolf (2010): Handbuch
Bergbahnfinanzierung, Hochschule Luzern.
[6] Seilbahnen Schweiz: www.seilbahn.org.
[7] Pablo Fernandez, Javier Aguirreamalloa and Pablo Linares (2013): Market
Risk Premium and Risk Free Rate used for 51 countries in 2013: a survey with
6,237 answers.
[8] Emily Chan (2012): Harvard Business School Confidential: Secrets of Success.
[9] Prof. Dr. Philipp Lütolf (2012): Finanzsituation von Bergbahnen in der
Schweiz, Hochschule Luzern.
[10] Luftseilbahn Adliswil - Felsenegg: www.laf.ch.