financing implementation of the water related sdgs in …. water summit... · financing...
TRANSCRIPT

Financing Implementation of the Water Related SDGs in Myanmar
3rd Asia-Pacific Water Summit
Dr. Wah Wah Maung
Director General
Central Statistical Organization
Ministry of Planning and Finance
Myanmar

Water Based Economy
• quantify the economic value of water resources
• return on investments in environmental restoration and water-related infrastructure, and the ecosystem benefits and services
Water
• advancing the “Blue Economy” Based
• ensuring that businesses, communities and agriculture are able to leverage the abundant water resources to support strong economies and a high quality of life for residents
Economy

Sustained Use of Water
Population Growth
Urbanization Process
Industrial Growth
Transport: Water Ways, Marine
Agriculture
Inefficient Use of Water Resources, Water Management System, Climate Change
Pressure to Water Management System

Financing Resilient Water Infrastructure and Services
Financing
Financing of a sustainable water sector can focus SDGs 2030 Agenda
Can achieve a number of targets
Water
• Growth with equity
• Strategic Framework, Policies and Action Plan
Sector
• Financing Sources: State Budget, Grant, Loans, International Assistance, PPP

Increasing Water Security: Key Dimension I
• Household water security covers
– both drinking water (SDG target 6.1) and
– sanitation (SDG target 6.2),
– both have clear targets (100% coverage by 2030)

Increasing Water Security: Key Dimension II
• Economic Water Security– Asia and the Pacific faces a serious water threat
– Water demand in agriculture, industry, and the domestic sectors will increase by 30%–40% in 2050.

Increasing Water Security: Key Dimension
• Urban Water Security– water systems in the city as source of supply (drinking
water) and threat (flooding) toward a more comprehensive water-sensitive cities approach.
– High infrastructure requirements to improve the wastewater and flooding components of the urban water security dimension

Increasing Water Security: Key Dimension
• Environmental Water Security– Index of environmental water security (KD4) quantifies the pressures
on the health of flowing surface waters across the region
(i) the river health index (RHI), the inverse of a metric of threat to water security, that incorporates the potential impacts of many variables that tend to have detrimental impacts on river health;
(ii) flow alteration, which describes the extent to which rivers are changed due to dams, weirs, and direct extractions;
(iii) environmental governance, which expresses the efforts of governments to protect the environment in their country.

Increasing Water Security: Key Dimension
• Resilience to Water-Related Disasters – On average, 205 million people were affected by such disasters each
year during that period. Weather-related disasters are becoming increasingly frequent, due to a sustained rise in the number of floods and storms.
– Flooding alone accounts for 47% of all weather-related disasters in 1995–2015, affecting 2.3 billion people, the majority (95%) in Asia. While

Water availability and use in Myanmar
• The prime source of water is the precipitation of rain.
• Three available water sources:
(a) Surface Water
(b) Ground Water or
Underground Water
(a) Rain or Snow

Common Water Usage Patterns
✓Domestic use –Bathing, Washing, Flushing, Cooking, Drinking
✓Garden watering use
✓Fire fighting
✓Industrial use
✓Commercial use
✓Agricultural use
✓Unaccountable or losses

Countries with the lowest level of wastewater treatment in the Asia-Pacific Region
*Estimate. Note: The percentage of wastewater treated is very much dependant on the conditions in the countries’ largest/larger cities, where the percentage is generally higher, and rarely a reliable indicator of conditions in the smaller urban centres of towns and rural areas, for which data are often lacking. Source: Adapted from ADB (2013, Appendix 4, p.100).

Wastewater production and treatment
• Domestic wastewater into the municipalopen drains and pipe system in municipalityareas or/and common effluent treatmentplant.

Which goals does the Government of Myanmar aim to achieve and how does the Government practice
wastewater policies at a national level with the goals?
• Improving River System• Managing waste water• Awareness campaign for the effective and efficient use of water• Improving infrastructure including rural infrastructure• The Institutions: Environmental Conservation Department (ECD) of the
Ministry of Natural Resources and Environmental Conservation (MONREC), Yangon City Development Committee (YCDC), Mandalay City Development Committee (MCDC) and Nay Pyi Taw City Development Committee (NCDC)
National Policy Development and Institutions in Myanmar
Myanmar’s Household Water Security

Percentage Distribution Of Households With Good Sources
Of WaterGood Sources of Water (%)
S.N. DescriptionPiped Water , Artesian Well , Covered Well
2001 2006 2012
I. UNION 51.26 61.66 65.18
II. REGION / STATE
1Kachin State 45.77 56.64 65.70
2Kayah State 28.23 43.80 46.41
3Kayin State 23.31 42.29 40.07
4Chin State 92.89 45.00 59.10
5Sagaing Region 56.99 60.73 74.93
6Tanintharyi Region 67.97 54.02 59.95
7Bago Region (East) 81.30 67.9065.47
8Bago Region (West) 55.70 55.29
9Magway Region 60.20 70.02 66.58
10Mandalay Region 59.22 68.24 87.26
11Mon State 23.55 36.80 63.02
12Rakhine State 22.98 43.68 40.20
13Yangon Region 83.28 84.63 76.26
14Shan State (South) 44.61 73.67
50.8815Shan State (North) 23.18 45.88
16Shan State (East) 64.27 70.28
17Ayeyarwady Region 20.28 48.99 53.72
18Nay Pyi Taw 77.96

Myanmar Water Based Economy

Types of Water Resource by States and Regions2016-2017 (Acres)
Canals,Reservoirs, River,Stream Fishery Pond Total
Tanks and Embankment and Under Water
Union 642361 4835439 404893 5882693
1 . Naypyitaw 21958 31462 2988 56408
2 . Kachin State 29609 437914 91964 559487
3 . Kayah State 4114 16917 3522 24553
4 . Kayin State 4536 57984 3462 65982
5 . Chin State 97 209968 408 210473
6 . Sagaing Region 155681 448330 41674 645685
7 . Tanintharyi Region 153 419803 332 420288
8 . Bago Region 116426 564184 69274 749884
9 . Magway Region 56472 573803 9592 639867
10 . Mandalay Region 89751 255809 17685 363245
11 . Mon State 7446 250641 3301 261388
12 . Rakhine State 15639 382065 1604 399308
13 . Yangon Region 50612 228121 41229 319962
14 . Shan State 9103 175830 25995 210928
15 . Ayeyarwady Region 80764 782608 91863 955235
Source : Department of Agricultural Land Management and Statistics.
States and Regions

Irrigable and Flood Protection Areas(Thousand Acres)
Irrigable Area Flood Protection
Period Embankments Drainage Work Total
No. Area No. Area No. Area No. Area No. Area No. Area
(1) (2) (3) (4) (5) (6) (7) (8) (9) (10) (11) (12) (13)
2012 - 2013 169 1375 247 1874 416 3249 228 2804 214 860 442 3664
2013 - 2014 171 1388 256 1914 427 3302 223 2804 236 902 459 3706
2014 - 2015 192 1433 261 1862 453 3295 231 2804 239 894 470 3698
2015 - 2016 212 1351 269 1649 481 3000 225 2804 235 892 460 3696
2016 - 2017 143 1390 256 1591 399 2981 229 2815 237 878 466 3694
Weir Tank Total
Source: Department of Irrigation and Management of Water Utilization.
19
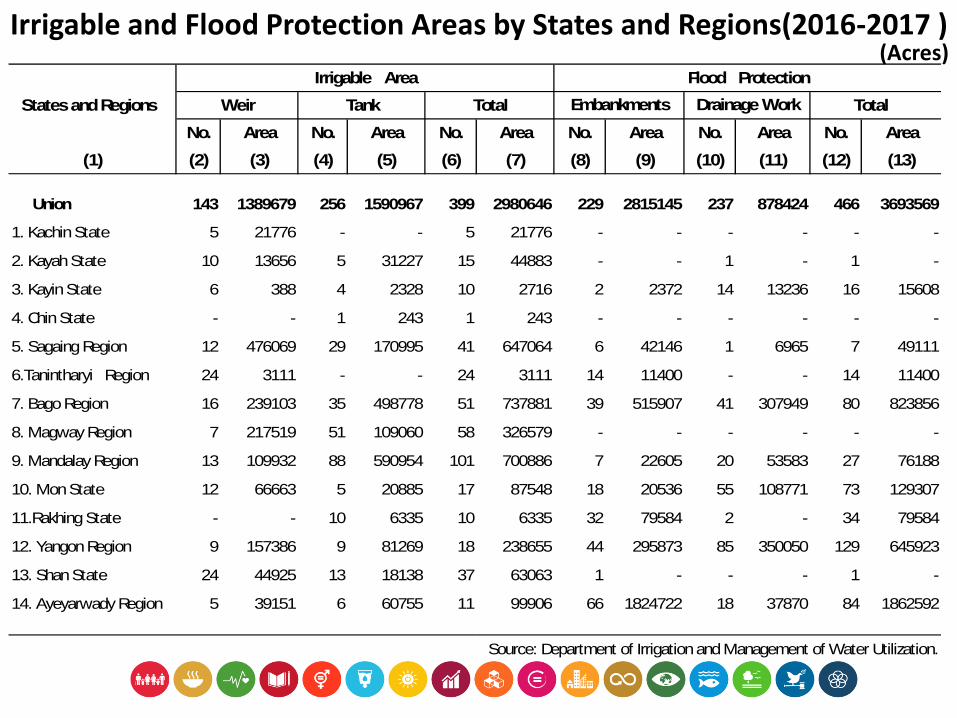
Irrigable and Flood Protection Areas by States and Regions(2016-2017 )
Irrigable Area Flood Protection
States and Regions Weir Tank Total Total
No. Area No. Area No. Area No. Area No. Area No. Area
(1) (2) (3) (4) (5) (6) (7) (8) (9) (10) (11) (12) (13)
Union 143 1389679 256 1590967 399 2980646 229 2815145 237 878424 466 3693569
1. Kachin State 5 21776 - - 5 21776 - - - - - -
2. Kayah State 10 13656 5 31227 15 44883 - - 1 - 1 -
3. Kayin State 6 388 4 2328 10 2716 2 2372 14 13236 16 15608
4. Chin State - - 1 243 1 243 - - - - - -
5. Sagaing Region 12 476069 29 170995 41 647064 6 42146 1 6965 7 49111
6.Tanintharyi Region 24 3111 - - 24 3111 14 11400 - - 14 11400
7. Bago Region 16 239103 35 498778 51 737881 39 515907 41 307949 80 823856
8. Magway Region 7 217519 51 109060 58 326579 - - - - - -
9. Mandalay Region 13 109932 88 590954 101 700886 7 22605 20 53583 27 76188
10. Mon State 12 66663 5 20885 17 87548 18 20536 55 108771 73 129307
11.Rakhing State - - 10 6335 10 6335 32 79584 2 - 34 79584
12. Yangon Region 9 157386 9 81269 18 238655 44 295873 85 350050 129 645923
13. Shan State 24 44925 13 18138 37 63063 1 - - - 1 -
14. Ayeyarwady Region 5 39151 6 60755 11 99906 66 1824722 18 37870 84 1862592
Drainage WorkEmbankments
Source: Department of Irrigation and Management of Water Utilization.
(Acres)

Area of Selected Crops Under Irrigation
Total Ground - Sesa- Pulses Sugar- Other Other
Period Irrigated Paddy Wheat Maize nut mum cane Food Cotton Jute non-food
Area Crops Crops
(1) (2) (3) (4) (5) (6) (7) (8) (9) (10) (11) (12) (13)
2012 - 2013 6419.25 4618.81 91.77 126.98 72.53 156.73 255.56 30.89 1001.55 18.14 0.57 45.72
2013 - 2014 6695.86 4805.28 94.44 144.59 79.79 209.92 281.36 27.71 1004.57 7.81 * 40.39
2014 - 2015 6626.09 4632.88 92.78 140.91 77.98 281.61 287.51 29.31 1017.83 23.36 * 41.92
2015 - 2016 6651.84 4640.51 90.10 140.74 86.45 285.66 330.55 28.27 1007.80 4.82 * 36.88
2016 - 2017 6705.10 4636.13 78.37 146.00 88.58 335.49 336.50 27.63 1016.54 3.87 * 35.99
Note: * Less than 0.5 Source : Department of Agricultural Land Management and Statistics.
(Thousand Acres)

Area of Selected Crops under Weir
Period Total Paddy Wheat Maize Grou
nd
Sesa
mPulses Sugar Other Cotton Jute Other
-nut -um -cane food non-
food Crops Crops
(1) (2) (3) (4) (5) (6) (7) (8) (9) (10) (11) (12) (13)
2012-2013 3946 2567 12 29 29 23 1049 1 182 - 1 53
2013-2014 3929 2560 13 31 28 22 1052 1 168 - * 54
2014-2015 3937 2564 13 30 29 23 1065 1 158 - * 54
2015-2016 3934 2557 9 31 28 19 1087 1 147 - * 55
2016-2017 3940 2563 9 31 27 18 1098 1 139 - * 54
Note: * Less than 0.6 Source : Department of Agricultural Land Management and Statistics.
(Thousand Acres)
22

INLAND AND OVERSEAS SHIPPING STATISTICS
Particular 2005-2006 2010-2011 2011-2012 2012-2013 2013-2014 2014-2015 2015-2016 2016-2017
INLAND WATERWAYS
1.Valid certified private
water craft (Number)
a.Riverine 3636 4588 4901 2160 2281 2217 2344 2800
b.Coastal 140 253 298 348 386 409 486 529
2.Inland Water Transport (Public)
(Number)
a.Powered Craft 319 239 236 225 225 211 178 163
b.Dumb Craft 197 190 193 187 188 172 162 153
SHIPPING
1.Overseas Shipping (000 ton)
(Yangon)
a.Loaded 1173 3256 4268 4883 5329 3409 3111 2466
b.Unloaded 3253 8600 8866 10244 12519 16014 18915 11583
2.Number of Vessels
a.Myanma Five Star Line 26 23 22 22 22 19 19 16
b.Chartered - 8 7 5 - - - 9
3.Coastal Shipping (000 ton)
(Yangon)
a.Loaded 111 278 336 423 405 363 368 543
b.Unloaded 207 270 310 386 400 615 679 1236
4.Number of Lighthouses 27 26 26 26 26 26 26 26
a.With Lighthouse keeper 10 9 9 9 9 9 9 7
b.Without Lighthouse keeper 17 17 17 17 17 17 17 19
Sources: 1. Customs Department.
2. Department of Marine Administration.
3. Inland Water Transport.
4. Myanma Five Star Line.
5. Myanma Port Authority.

PRINCIPAL COMMODITIES TRANSPORTED BY INLAND WATERWAYS
in thousand
Particular Unit 2005-2006 2010-2011 2011-2012 2012-2013 2013-2014 2014-2015 2015-2016 2016-2017
TOTAL Ton 4262 4786 3347 2117 1898 1787 1375 951
Ton-miles 455175 753689 519879 332004 283118 282353 187806 110193
Rice Ton 2 - - 4 31 44 11 16
Ton-miles 224 - - 1785 3894 5383 1482 2267
Cement Ton 1 6 1 5 0.3 1 - -
Ton-miles 155 2267 414 2143 179 597 - -
Petroleum Coke Ton 4 - - - - - - -
Ton-miles 1637 - - - - - - -
Fertilizer Ton - - - - - - - -
Ton-miles - - - - - - - -
Miscellaneous Ton 4210 4763 3330 2076 1855.7 1741.3 1364 935
Ton-miles 425579 740632 510453 307824 271899 276034 186324 107926
Timber Ton 45 17 16 32 11 0.7 - -
Ton-miles 27580 10790 9012 20252 7146 339 - -
Source: Inland Water Transport.

SEABORNE SHIPPING TONNAGE OF CARGO HANDLED AT THE PORT OF YANGON
in ton
Particular 2005-2006 2010-2011 2011-2012 2012-2013 2013-2014 2014-2015 2015-2016 2016-2017
INTERNATIONAL
(a)Loaded 1172890 3255635 4267657 4882715 5328703 3409298 3111346 2465937
(b)Unloaded 3252813 8599975 8866010 10244127 12519267 16014329 18914808 11582910
COASTAL
(a)Loaded 111104 278056 335751 423016 404895 362784 367672 543220
(b)Unloaded 207461 269590 309608 386352 400096 615340 679388 1235902
Source: Customs Department.

MERCHANT SHIPPING : FOREIGN TRADE
Total With Cargo In Ballast
Year Number Tonnage Number Tonnage Number Tonnage
of Registered of Registered of Registered
Times (000) Times (000) Times (000)
ENTRY
2005-2006 674 3253 674 3253 - -
2010-2011 1691 8600 1469 8600 222 -
2011-2012 1746 8866 1389 8866 357 -
2012-2013 2118 10244 1582 10244 536 -
2013-2014 2339 12519 1834 12519 505 -
2014-2015 2352 16014 2022 16014 330 -
2015-2016 2408 18915 2286 18915 122 -
2016-2017 1350 11583 1285 11583 65 -
CLEARANCE
2005-2006 265 1173 265 1173 - -
2010-2011 1682 3256 1192 3256 490 -
2011-2012 1748 4268 779 4268 969 -
2012-2013 2033 4883 797 4883 1236 -
2013-2014 2187 5329 868 5329 1319 -
2014-2015 2224 3409 662 3409 1562 -
2015-2016 2413 3111 844 3111 1569 -
2016-2017 1390 2466 575 2466 815 -
Source: Customs Department.

MERCHANT SHIPPING : COASTAL TRADE
Total With Cargo In Ballast
Year Number Tonnage Number Tonnage Number Tonnage
of Registered of Registered of Registered
Times (000) Times (000) Times (000)
ENTRY
2005-2006 583 207 583 207 - -
2010-2011 884 270 710 270 174 -
2011-2012 1053 310 816 310 237 -
2012-2013 1251 386 904 386 347 -
2013-2014 1069 400 800 400 269 -
2014-2015 1072 615 827 615 245 -
2015-2016 1289 679 910 679 379 -
2016-2017 1365 543 972 543 393 -
CLEARANCE
2005-2006 398 111 398 111 - -
2010-2011 922 278 769 278 153 -
2011-2012 1093 336 907 336 186 -
2012-2013 1324 423 1085 423 239 -
2013-2014 1108 405 889 405 219 -
2014-2015 1102 363 777 363 325 -
2015-2016 1195 368 812 368 383 -
2016-2017 1394 1236 786 1236 608 -
Source:Source: Customs Department.

NUMBER AND CAPACITY OF VESSELS ARRIVING AT AND DEPARTING FROM MYANMAR PORTS
Port Year
Number Gross Tonnage(000) Net Tonnage(000)
Vessels Schooners Total Vessels Schooners Total Vessels Schooners Total
ARRIVALS
TOTAL 2011-2012 3400 3870 7270 13497 983 14480 6572 480 7052
2012-2013 4245 4144 8389 18342 1310 19652 8376 518 8894
2013-2014 4832 5388 10220 25600 1133 26733 12028 537 12565
2014-2015 4636 5029 9665 25741 1269 27010 12051 588 12651
2015-2016 5141 6520 11661 29879 1728 31607 13271 726 13997
2016-2017 4911 7322 12233 30909 1298 32207 14068 491 14559
DEPARTURE
TOTAL 2011-2012 3363 3901 7264 13344 990 14334 6524 487 7011
2012-2013 4172 4189 8361 18107 1155 19262 8297 548 8845
2013-2014 4839 5424 10263 25654 1219 26873 11714 536 12250
2014-2015 4624 5020 9644 25752 1261 27013 11871 585 12456
2015-2016 5177 7319 12496 30011 1684 31695 13302 769 14071
2016-2017 4824 7325 12149 31062 7216 38278 13991 437 14428
2016-2017 1270 4866 6136 1671 6910 8531 618 296 914
Source: Myanma Port Authority.

VESSELS ARRIVING AT AND DEPARTING FROM THE PORT OF YANGON BY GROSS TONNAGE
Year
Vessels by Gross Tonnage
Under 1001- 2001- 3001- 4001- 5001- 6001- 7001- 8001- 9001- Above Total
1000 2000 3000 4000 5000 6000 7000 8000 9000 10000 10001
ARRIVALS
2005-2006 186 254 49 128 236 71 11 93 43 75 110 1256
2010-2011 195 176 177 117 277 145 129 147 85 175 149 1772
2011-2012 158 166 139 88 219 234 100 192 60 139 219 1714
2012-2013 272 170 128 78 210 198 83 221 52 234 357 2003
2013-2014 343 179 133 89 227 242 88 155 67 289 523 2335
2014-2015 278 153 73 90 142 194 56 167 183 384 534 2254
2015-2016 229 153 59 117 131 82 93 159 330 401 818 2572
2016-2017 149 144 60 147 68 91 34 91 171 262 1192 2409
DEPARTURES
2005-2006 188 250 50 125 238 71 12 93 42 75 106 1250
2010-2011 189 177 176 118 277 143 129 148 86 174 152 1769
2011-2012 156 167 139 88 219 235 100 192 60 139 216 1711
2012-2013 342 172 139 76 196 202 76 204 50 214 323 1994
2013-2014 343 179 133 89 227 242 88 155 67 289 523 2335
2014-2015 279 153 73 90 141 194 56 167 183 383 533 2253
2015-2016 230 153 59 117 131 82 93 159 330 401 818 2573
2016-2017 149 144 60 147 68 91 34 91 171 262 1192 2409
Source: Myanma Port Authority.

SEABORNE CARGO BY PRINCIPAL COMMODITY
in ton
Commodity 2005-2006 2010-2011 2011-2012 2012-2013 2013-2014 2014-2015 2015-2016 2016-2017
GRAND TOTAL 10238715 18438641 21722343 24167636 24049913 26075970 31057188 31924983
OUTSHIPMENT
Petrol Oil and Lubricants 69491 49267 40475 68095 60547 44203 20982(r) 18628
Rice and Rice Products 221335 594685 849726 702683 549675 604874 305643 834769
Minerals 42426 42633 55242 25222 8402 1448 5244 198866
Timber 1730382 1646058 1855418 1441025 1698044 869562 585422 735707
General Cargo 2661326 3798602 4460149 4390905 4809360 4930340 5291013(r) 6475481
TOTAL 4724960 6131245 7261010 6627930 7126028 6450427 6208304 8084451
INSHIPMENT
Petrol Oil and Lubricants 1618868 2028570 2607280 2224361 2351798 3467039 4369661 5017410
General Cargo 3894887 10278826 11854053 15315345 14572087 16158504 20479223 18823122
TOTAL 5513755 12307396 14461333 17539706 16923885 19625543 24848884 23840532
Source: Myanma Port Authority.

PASSENGER STATISTICS OF THE PORT OF YANGON
Particular 2005-2006 2010-2011 2011-2012 2012-2013 2013-2014 2014-2015 2015-2016 2016-2017
SEA-GOING PASSENGER
a.Inward 28434 6814 8014 8893 13186 20050 13864(r) 5964
b.Outward 24632 6869 7483 9421 13567 20063 13852(r) 6288
c.Total 53066 13683 15497 18314 26753 40113 27716(r) 12252
INLAND PASSENGER (000)
a.Inward 2697 7170 7816 6864 5881 5638 5195 4891
b.Outward 2842 7340 7945 6979 6345 5372 5606 5278
c.Total 5539 14510 15761 13843 12226 11010 10801 10169
Source: Myanma Port Authority.

Myanmar Water Related Disaster

Sr. Region and StateDeath
PopulationAnimal
Male Female Total1 Kachin 12 Kayah 2 23 Kayin4 Chin5 Sagaing 2 2 46 Tanintharyi 2 2 3 287 Bago8 Magwe 4 4 7039 Mandalay 4 4 8 8
10 Mon 211 Rakhine12 Yangon 1 113 Shan 1 114 Ayeyarwaddy 1 3 215 Nay Pyi Taw Council 1 0 3 28987
Total 29 29731
Myanmar Disaster Loss and Damage (2016)

Sr. Region and State
Damage and Loss
Ho
use
Sch
oo
l
Pag
od
a
Mo
nas
teri
es
clin
ic
Off
ice
Bu
ildin
g/
Oth
ers
Bo
x C
ulv
ert
Bri
dge
Ro
ad
1 Kachin 1307 3 1 24 1 10 1
2 Kayah 15 1
3 Kayin
4 Chin 8 1 5 10 2
5 Sagaing 186 18 2 15 36 25
6 Tanintharyi 4629 3 2 17 7 3
7 Bago 1
8 Magwe 925 19 29 1 64 25 6
9 Mandalay 198 1 1 4 12 25
10 Mon 260 3 12 1 4 50 51
11 Rakhine
12 Yangon
13 Shan 15 2 1 13 5 5
14 Ayeyarwaddy 154 10 2 84 11 8
15Nay Pyi Taw Council
1899 355 17 21 63 21 5
Total 9596 415 2 64 21 3 293 1 188 132
Myanmar Disaster Loss and Damage (2016)

Sr. Region and State
Damage and LossDamage and
Loss value (Kyat Million)
Agricultural Land (Acre)
Fish Ponds (Acre)
Prawn Ponds (Acre)
1 Kachin 3933.5 240.652 Kayah 2418 1 70.413 Kayin4 Chin 345.615 Sagaing 501.45 16 676.676 Tanintharyi 23553.89 1162.087 Bago 78 Magwe 32671 1224 930.999 Mandalay 23525 5280.65
10 Mon 8541 2008.311 Rakhine12 Yangon 755 347.813 Shan 58458 8659 15290.1514 Ayeyarwaddy 6427 224.9415 Nay Pyi Taw Council 247470 11988 92691.53
Total 407498.84 21418 1225 119276.78
Myanmar Disaster Loss and Damage (2016)

Myanmar’s Water Related SDGs Indicators
Indicator Year Value Source of Publication
6.1.1
Percentage of population
using improved drinking
water sources*
2015 80.6%WHO/UNICEF Joint Monitoring
Programme (JMP)
6.1.1
Percentage of population
using improved drinking
water sources*
2015-16 80.2%2015-16 Demographic and
Health Survey
6.1.1
Percentage of population
using improved drinking
water sources*
2014 69.5%Myanmar 2014 Population and
Housing Census
6.2.1
Proportion of population
using improved sanitation
facilities*
2015 79.5%WHO/UNICEF Joint Monitoring
Programme (JMP)
6.2.1
Proportion of population
using improved sanitation
facilities*
2015-16 48.1%2015-16 Demographic and
Health Survey
6.2.1
Proportion of population
using improved sanitation
facilities*
2014 74.3%Myanmar 2014 Population and
Housing Census

Myanmar’s Water Related SDGs Indicators
Indicator Year Value Source of Publication
6.4.2
Level of water stress:
freshwater withdrawal as
a proportion of available
freshwater resources
1998-2002 2.85%
FAO - AQUASTAT
http://www.fao.org/nr/water/a
quastat/main/index.stm
6.5.1Degree of IWRM
Implementation (0-100)2011 1.8
UNEP - IWRM
surveyhttp://iwrmdataportal.un
epdhi.org/Data.html?Country=
Myanmar
6.a.1
Amount of water- and
sanitation-related official
development assistance
that is part of a
government-coordinated
spending plan
2014
14.58 million
constant 2014
USD
OECD statistics – CRS
databasehttps://stats.oecd.org/I
ndex.aspx?DataSetCode=CRS1

Water and Sanitation Related Assistances to Myanmar
Source: https://mohinga.info/en/dashboard/sector/140

Water and Sanitation Related Assistances to Myanmar
Source: https://mohinga.info/en/dashboard/sector/140

Water and Sanitation Related Assistances to Myanmar

Water and Sanitation Related Assistances to Myanmar

Water and Sanitation Related Assistances to Myanmar

Statistics is being collected on wastewater related SDGs in Myanmar, what are the
bottlenecks and opportunities?• Statistics being collected from the Institutions: Environmental
Conservation Department (ECD) of the Ministry of Natural Resources and Environmental Conservation (MONREC), Yangon City Development Committee (YCDC), Mandalay City Development Committee (MCDC) and Nay Pyi Taw City Development Committee (NCDC)
• Bottlenecks: Resource Allocation, Budget Constraints, Low Technology of Recycling, Raising Awareness to be participated by all the stakeholders, Holistic national water resources policy doesn’t exist
• Opportunities: SDGs, Policy Recommendations to the Higher Authority, International Development Assistance, Political Commitment and Policy Support, To incorporate with the National Plan
• Example: “ Myanmar Integrated Water Resources Management (IWRM) strategic study” is part of the bilateral IWRM cooperation between Myanmar and the Netherlands.

Issues and Way Forwards• Insufficient environmental related statistics (data
generation)• Lag behind in advanced measuring instrument and
techniques( for quality control and environmental issues)• Existing knowledge and expertise needs to be upgraded(
authorities as well as public)• Awareness on 4 Rs: Reduce, Recycle, Reuse, Refuse• Skills, experience and training needs• Little action on water quality monitoring• Inadequate budget, staffs and purification techiques• Integration of National Water Policy into IWRM Strategy• Law enforcement to prevent environmental problem• Implementation of IWRM on the ground• Rural water strategy• PPP: Local service providers

Thank you for your kind [email protected]