financial statements - vale.com · noncontrolling interest 17. intangibles 18. property, plant and...
TRANSCRIPT

Financial Statements December 31, 2017
IFRS in US$

2
Vale S.A. Financial Statements Contents
Page Report of independent registered public accounting firm 3 Management’s Report on Internal Control over Financial Reporting 5 Consolidated Income Statement 6 Consolidated Statement of Comprehensive Income 7 Consolidated Statement of Cash Flows 8 Consolidated Statement of Financial Position 9 Consolidated Statement of Changes in Equity 10 Notes to the Financial Statements 11
1. Corporate information 2. Basis for preparation of the financial statements 3. Information by business segment and by geographic area 4. Special events occurred during the year 5. Costs and expenses by nature 6. Financial results 7. Deferred revenue - Gold stream transaction 8. Income taxes 9. Basic and diluted earnings (loss) per share 10. Accounts receivable 11. Inventories 12. Recoverable taxes 13. Other financial assets and liabilities 14. Non-current assets and liabilities held for sale and discontinued operations 15. Investments in associates and joint ventures 16. Noncontrolling interest 17. Intangibles 18. Property, plant and equipment 19. Impairment and onerous contracts 20. Loans, borrowings, cash and cash equivalents and financial investments 21. Liabilities related to associates and joint ventures 22. Financial instruments classification 23. Fair value estimate 24. Derivative financial instruments 25. Provisions 26. Asset retirement obligations 27. Litigation 28. Employee benefits 29. Stockholders’ equity 30. Related parties 31. Commitments 32. Risk management 33. Additional information about derivatives financial instruments

3
KPMG Auditores Independentes
Rua do Passeio, 38 - Setor 2 - 17º andar - Centro
20021-290 - Rio de Janeiro/RJ - Brasil
Caixa Postal 2888 - CEP 20001-970 - Rio de Janeiro/RJ - Brasil
Telefone +55 (21) 2207-9400, Fax +55 (21) 2207-9000
www.kpmg.com.br Report of Independent Registered Public Accounting Firm
To the Stockholders and Board of Directors
Vale S.A.
Rio de Janeiro – RJ
Opinions on the Consolidated Financial Statements and Internal Control Over Financial Reporting
We have audited the accompanying consolidated statements of financial position of Vale S.A. and subsidiaries (“Vale” or
“the Company”) as of December 31, 2017 and 2016, and the related consolidated statements of income, comprehensive
income (loss), changes in equity and cash flows for each of the years in the three-year period ended December 31, 2017,
and the related notes (collectively, the “consolidated financial statements”). We also have audited the Company’s internal
control over financial reporting as of December 31, 2017, based on criteria established in Internal Control - Integrated
Framework (2013) issued by the Committee of Sponsoring Organizations of the Treadway Commission.
In our opinion, the consolidated financial statements referred to above present fairly, in all material respects, the financial
position of the Company as of December 31, 2017 and 2016, and the results of its operations and its cash flows for each
of the years in the three-year period ended December 31, 2017, in conformity with International Financial Reporting
Standards as issued by the International Accounting Standards Board. Also in our opinion, the Company maintained, in all
material respects, effective internal control over financial reporting as of December 31, 2017, based on criteria established
in Internal Control - Integrated Framework (2013) issued by the Committee of Sponsoring Organizations of the Treadway
Commission.
Basis for Opinion
The Company’s management is responsible for these consolidated financial statements, for maintaining effective internal
control over financial reporting, and for its assessment of the effectiveness of internal control over financial reporting,
included in the accompanying Management’s Report on Internal Control over Financial Reporting. Our responsibility is to
express an opinion on the Company’s consolidated financial statements and an opinion on the Company’s internal control
over financial reporting based on our audits. We are a public accounting firm registered with the Public Company Accounting
Oversight Board (United States) (“PCAOB”) and are required to be independent with respect to the Company in accordance
with the U.S. federal securities laws and the applicable rules and regulations of the Securities and Exchange Commission
and the PCAOB.
We conducted our audits in accordance with the standards of the PCAOB. Those standards require that we plan and
perform the audits to obtain reasonable assurance about whether the consolidated financial statements are free of material
misstatement, whether due to error or fraud, and whether effective internal control over financial reporting was maintained
in all material respects.

4
Our audits of the consolidated financial statements included performing procedures to assess the risks of material
misstatement of the consolidated financial statements, whether due to error or fraud, and performing procedures that
respond to those risks. Such procedures included examining, on a test basis, evidence regarding the amounts and
disclosures in the consolidated financial statements. Our audits also included evaluating the accounting principles used and
significant estimates made by management, as well as evaluating the overall presentation of the consolidated financial
statements. Our audit of internal control over financial reporting included obtaining an understanding of internal control over
financial reporting, assessing the risk that a material weakness exists, and testing and evaluating the design and operating
effectiveness of internal control based on the assessed risk. Our audits also included performing such other procedures as
we considered necessary in the circumstances. We believe that our audits provide a reasonable basis for our opinions.
Definition and Limitations of Internal Control Over Financial Reporting
A company’s internal control over financial reporting is a process designed to provide reasonable assurance regarding the
reliability of financial reporting and the preparation of financial statements for external purposes in accordance with generally
accepted accounting principles. A company’s internal control over financial reporting includes those policies and procedures
that (1) pertain to the maintenance of records that, in reasonable detail, accurately and fairly reflect the transactions and
dispositions of the assets of the company; (2) provide reasonable assurance that transactions are recorded as necessary
to permit preparation of financial statements in accordance with generally accepted accounting principles, and that receipts
and expenditures of the company are being made only in accordance with authorizations of management and directors of
the company; and (3) provide reasonable assurance regarding prevention or timely detection of unauthorized acquisition,
use, or disposition of the company’s assets that could have a material effect on the financial statements.
Because of its inherent limitations, internal control over financial reporting may not prevent or detect misstatements. Also,
projections of any evaluation of effectiveness to future periods are subject to the risk that controls may become inadequate
because of changes in conditions, or that the degree of compliance with the policies or procedures may deteriorate.
KPMG Auditores Independentes
We have served as the Company’s auditor since 2014.
Rio de Janeiro, RJ
February 27, 2018
KPMG Auditores Independentes, uma sociedade simples brasileira e firma-membro da rede KPMG de firmas-membro independentes e afiliadas à KPMG International Cooperative (“KPMG International”), uma entidade suíça.
KPMG Auditores Independentes, a Brazilian entity and a member firm of the KPMG network of independent member firms affiliated with KPMG International Cooperative (“KPMG International”), a Swiss entity.

5
Management’s Report on Internal Control over Financial Reporting The management of Vale S.A (Vale) is responsible for establishing and maintaining adequate internal control over financial reporting. The Vale’s internal control over financial reporting is a process designed to provide reasonable assurance regarding the reliability of financial reporting and the preparation of financial statements for external purposes in accordance with generally accepted accounting principles. The company’s internal control over financial reporting includes those policies and procedures that: (i) pertain to the maintenance of records that, in reasonable detail, accurately and fairly reflect the transactions and dispositions of the assets of the company; (ii) provide reasonable assurance that transactions are recorded to permit preparation of financial statements in accordance with generally accepted accounting principles, and that receipts and expenditures of the company are being made only in accordance with authorizations of management and directors of the company; and (iii) provide reasonable assurance regarding prevention or timely detection of unauthorized acquisition, use, or disposition of the company’s assets that could have a material effect on the financial statements. Because of its inherent limitations, internal control over financial reporting may not prevent or detect misstatements. Also, projections of any evaluation of the effectiveness to future periods are subject to the risk that controls may become inadequate because of changes in conditions, and that the degree of compliance with the policies or procedures may deteriorate. Vale’s management has assessed the effectiveness of the company’s internal control over financial reporting as of December 31, 2017 based on the criteria established in Internal Control – Integrated Framework (2013) issued by the Committee of Sponsoring Organizations of the Treadway Commission (COSO). Based on such assessment and criteria, Vale’s management has concluded that the company’s internal control over financial reporting are effective as of December 31, 2017. The effectiveness of the company’s internal control over financial reporting as of December 31, 2017 has been audited by KPMG Auditores Independentes, an independent registered public accounting firm, as stated in their report which appears herein. February 27th, 2018. Fabio Schvartsman Chief Executive Officer Luciano Siani Chief Financial Officer and Investors Relations

6
Consolidated Income Statement In millions of United States dollars, except earnings per share data
Year ended December 31
Notes 2017 2016 2015
Continuing operations Net operating revenue 3(d) 33,967 27,488 23,384 Cost of goods sold and services rendered 5(a) (21,039) (17,650) (18,751)
Gross profit 12,928 9,838 4,633 Operating expenses Selling and administrative expenses 5(b) (531) (507) (612) Research and evaluation expenses (340) (319) (395) Pre operating and operational stoppage (413) (453) (942) Other operating expenses, net 5(c) (420) (267) (207)
(1,704) (1,546) (2,156) Impairment and other results on non-current assets 15, 18 and 19 (294) (1,240) (8,708)
Operating income (loss) 10,930 7,052 (6,231) Financial income 6 3,404 7,968 7,792 Financial expenses 6 (6,423) (6,125) (18,446) Equity results in associates and joint ventures 15 98 309 (445) Impairment and other results in associates and joint ventures 15, 19 and 21 (180) (1,220) (349)
Income (loss) before income taxes 7,829 7,984 (17,679) Income taxes 8 Current tax (849) (943) (332) Deferred tax (646) (1,838) 5,581
(1,495) (2,781) 5,249 Net income (loss) from continuing operations 6,334 5,203 (12,430) Net income (loss) attributable to noncontrolling interests 21 (8) (501)
Net income (loss) from continuing operations attributable to Vale's stockholders 6,313 5,211 (11,929)
Discontinued operations 14 Loss from discontinued operations (813) (1,227) (190) Net income (loss) attributable to noncontrolling interests (7) 2 10
Loss from discontinued operations attributable to Vale's stockholders (806) (1,229) (200)
Net income (loss) 5,521 3,976 (12,620) Net income (loss) attributable to noncontrolling interests 14 (6) (491)
Net income (loss) attributable to Vale's stockholders 5,507 3,982 (12,129)
Earnings (loss) per share attributable to Vale's stockholders: Basic and diluted earnings (loss) per share (restated): 9 Common share (US$) 1.05 0.77 (2.33)
The accompanying notes are an integral part of these financial statements.

7
Consolidated Statement of Comprehensive Income In millions of United States dollars
Year ended December 31
2017 2016 2015
Net income (loss) 5,521 3,976 (12,620)
Other comprehensive income (loss): Items that will not be reclassified subsequently to the income statement Translation adjustments (717) 6,460 (18,128) Retirement benefit obligations (46) (70) 69
Total items that will not be reclassified subsequently to the income statement, net of tax (763) 6,390 (18,059)
Items that may be reclassified subsequently to the income statement Translation adjustments 1,026 (3,677) 10,244 Available-for-sale financial instruments - 1 1 Cash flow hedge - 10 816 Net investments hedge (95) - - Transfer of realized results to net income (11) (78) (369)
Total of items that may be reclassified subsequently to the income statement, net of tax 920 (3,744) 10,692
Total comprehensive income (loss) 5,678 6,622 (19,987)
Comprehensive income (loss) attributable to noncontrolling interests 13 111 (543)
Comprehensive income (loss) attributable to Vale's stockholders 5,665 6,511 (19,444)
From continuing operations 5,696 6,642 (19,550) From discontinued operations (31) (131) 106
5,665 6,511 (19,444)
Items above are stated net of tax and the related taxes are disclosed in note 8. The accompanying notes are an integral part of these financial statements.

8
Consolidated Statement of Cash Flows In millions of United States dollars
Year ended December 31
2017 2016 2015
Cash flow from operating activities: Income (loss) before income taxes from continuing operations 7,829 7,984 (17,679) Continuing operations adjustments for: Equity results in associates and joint ventures (98) (309) 445 Impairment and other results on non-current assets 294 1,240 8,708 Impairment and other results in associates and joint ventures 180 1,220 349 Depreciation, amortization and depletion 3,708 3,487 3,719 Financial results, net 3,019 (1,843) 10,654 Changes in assets and liabilities: Accounts receivable 1,277 (2,744) 1,671 Inventories (339) 288 (217) Suppliers and contractors 232 243 658 Provision - Payroll, related charges and others remunerations 372 133 (578) Other taxes assets and liabilities, net (297) (109) (222) Deferred revenue - Gold stream - 524 532 Other assets and liabilities, net (615) 441 (456)
15,562 10,555 7,584 Interest on loans and borrowings paid (1,686) (1,663) (1,457) Derivatives paid, net (240) (1,602) (1,202) Interest on participative stockholders' debentures paid (135) (84) (65) Income taxes (563) (388) (544) Income taxes - Settlement program (488) (417) (384)
Net cash provided by operating activities from continuing operations 12,450 6,401 3,932 Cash flow from investing activities: Financial investments redeemed (invested) (90) 12 308 Loans and advances - net receipts (payments) (note 21) (445) (210) (17) Guarantees and deposits - net receipts (payments) (48) (41) (67) Additions to investments (93) (239) (65) Additions to property, plant and equipment and intangible (3,831) (4,951) (8,114) Proceeds from disposal of assets and investments (note 15) 922 543 1,456 Dividends and interest on capital received from associates and joint ventures 227 193 318 Proceeds from gold stream transaction - 276 368
Net cash used in investing activities from continuing operations (3,358) (4,417) (5,813) Cash flow from financing activities: Loans and borrowings Additions 1,976 6,994 4,995 Repayments (8,998) (7,717) (2,753) Transactions with stockholders: Dividends and interest on capital attributed to stockholders (1,456) (250) (1,500) Dividends and interest on capital paid to noncontrolling interest (126) (291) (15) Transactions with noncontrolling stockholders (note 15) (98) (17) 1,049
Net cash provided by (used in) financing activities from continuing operations (8,702) (1,281) 1,776 Net cash provided by (used in) discontinued operations (note 14) (252) (118) 140
Increase in cash and cash equivalents 138 585 35 Cash and cash equivalents in the beginning of the year 4,262 3,591 3,974 Effect of exchange rate changes on cash and cash equivalents (60) 86 (418) Effects of disposals of subsidiaries and merger, net on cash and cash equivalents (12) - -
Cash and cash equivalents at end of the year 4,328 4,262 3,591
Non-cash transactions: Additions to property, plant and equipment - capitalized loans and borrowing costs 370 653 761
The accompanying notes are an integral part of these financial statements.

9
Consolidated Statement of Financial Position In millions of United States dollars
Notes December 31, 2017 December 31, 2016
Assets Current assets Cash and cash equivalents 20 4,328 4,262 Accounts receivable 10 2,600 3,663 Other financial assets 13 2,022 292 Inventories 11 3,926 3,349 Prepaid income taxes 781 159 Recoverable taxes 12 1,172 1,625 Others 538 628
15,367 13,978 Non-current assets held for sale 14 3,587 8,589
18,954 22,567 Non-current assets Judicial deposits 27(c) 1,986 962 Other financial assets 13 3,232 626 Prepaid income taxes 530 527 Recoverable taxes 12 638 727 Deferred income taxes 8(a) 6,638 7,343 Others 267 276
13,291 10,461 Investments in associates and joint ventures 15 3,568 3,696 Intangibles 17 8,493 6,871 Property, plant and equipment 18 54,878 55,419
80,230 76,447
Total assets 99,184 99,014
Liabilities Current liabilities Suppliers and contractors 4,041 3,630 Loans and borrowings 20 1,703 1,660 Other financial liabilities 13 374 767 Taxes payable 8(d) 697 657 Provision for income taxes 355 171 Liabilities related to associates and joint ventures 21 326 292 Provisions 25 1,394 952 Dividends and interest on capital 29(d) 1,441 816 Others 1,604 1,197
11,935 10,142 Liabilities associated with non-current assets held for sale 14 1,179 1,090
13,114 11,232 Non-current liabilities Loans and borrowings 20 20,786 27,662 Other financial liabilities 13 2,894 2,087 Taxes payable 8(d) 4,890 4,961 Deferred income taxes 8(a) 1,719 1,700 Provisions 25 7,027 5,748 Liabilities related to associates and joint ventures 21 670 785 Deferred revenue - Gold stream 1,849 2,090 Others 1,463 1,725
41,298 46,758
Total liabilities 54,412 57,990
Stockholders' equity 29 Equity attributable to Vale's stockholders 43,458 39,042 Equity attributable to noncontrolling interests 1,314 1,982
Total stockholders' equity 44,772 41,024
Total liabilities and stockholders' equity 99,184 99,014
The accompanying notes are an integral part of these financial statements.

10
Consolidated Statement of Changes in Equity In millions of United States dollars
Share capital
Results on conversion
of shares Capital reserve
Results from operation with noncontrolling
interest Profit
reserves Treasury
stocks
Unrealized fair value
gain (losses)
Cumulative translation
adjustments Retained earnings
Equity attributable to
Vale’s stockholders
Equity attributable to noncontrolling
interests
Total stockholders'
equity
Balance at December 31, 2014 61,614 (152) - (449) 19,985 (1,477) (1,713) (22,686) - 55,122 1,199 56,321
Loss - - - - - - - - (12,129) (12,129) (491) (12,620) Other comprehensive income: Retirement benefit obligations - - - - - - 70 - - 70 (1) 69 Cash flow hedge - - - - - - 447 - - 447 - 447 Available-for-sale financial instruments - - - - - - 1 - - 1 - 1 Translation adjustments - - - - (5,371) - 203 (2,665) - (7,833) (51) (7,884) Transactions with stockholders: Dividends and interest on capital of Vale's stockholders - - - - (1,500) - - - - (1,500) - (1,500) Dividends of noncontrolling interest - - - - - - - - - - (32) (32) Acquisitions and disposal of noncontrolling interest (note 15) - - - (253) - - - (336) - (589) 1,455 866 Capitalization of noncontrolling interest advances - - - - - - - - - - 36 36 Appropriation to undistributed retained earnings - - - - (12,129) - - - 12,129 - - -
Balance at December 31, 2015 61,614 (152) - (702) 985 (1,477) (992) (25,687) - 33,589 2,115 35,704
Net income (loss) - - - - - - - - 3,982 3,982 (6) 3,976 Other comprehensive income: Retirement benefit obligations - - - - - - (70) - - (70) - (70) Cash flow hedge - - - - - - 7 - - 7 - 7 Available-for-sale financial instruments - - - - - - 1 - - 1 - 1 Translation adjustments - - - - 195 - (93) 2,387 102 2,591 117 2,708 Transactions with stockholders: Dividends and interest on capital of Vale's stockholders - - - - - - - - (1,061) (1,061) - (1,061) Dividends of noncontrolling interest - - - - - - - - - - (268) (268) Acquisitions and disposal of noncontrolling interest (note 15) - - - 3 - - - - - 3 (1) 2 Capitalization of noncontrolling interest advances - - - - - - - - - - 25 25 Appropriation to undistributed retained earnings - - - - 3,023 - - - (3,023) - - -
Balance at December 31, 2016 61,614 (152) - (699) 4,203 (1,477) (1,147) (23,300) - 39,042 1,982 41,024
Net income - - - - - - - - 5,507 5,507 14 5,521 Other comprehensive income: Retirement benefit obligations - - - - - - (46) - - (46) - (46) Net investments hedge (note 24b) - - - - - - - (95) - (95) - (95) Translation adjustments - - - - (158) - 10 447 - 299 (1) 298 Transactions with stockholders: Dividends and interest on capital of Vale's stockholders - - - - (658) - - - (1,475) (2,133) - (2,133) Dividends of noncontrolling interest - - - - - - - - - - (202) (202) Acquisitions and disposal of noncontrolling interest (note 15) - - - (255) - - - - - (255) (512) (767) Capitalization of noncontrolling interest advances - - - - - - - - - - 33 33 Appropriation to undistributed retained earnings 4,032 (4,032) - - - Merger of Valepar (note 29) - - 1,139 - - - - - - 1,139 - 1,139
Balance at December 31, 2017 61,614 (152) 1,139 (954) 7,419 (1,477) (1,183) (22,948) - 43,458 1,314 44,772
The accompanying notes are an integral part of these financial statements.

11
Notes to the Financial Statements Expressed in millions of United States dollar, unless otherwise stated
1. Corporate information Vale S.A. (the “Parent Company”) is a public company headquartered in the city of Rio de Janeiro, Brazil with securities traded on the stock exchanges of São Paulo – B3 S.A. (Vale3), New York - NYSE (VALE), Paris - NYSE Euronext (Vale3) and Madrid – LATIBEX (XVALO). Vale S.A. and its direct and indirect subsidiaries (“Vale” or “Company”) are global producers of iron ore and iron ore pellets, key raw materials for steelmaking, and producers of nickel, which is used to produce stainless steel and metal alloys employed in the production of several products. The Company also produces copper, metallurgical and thermal coal, manganese ore, ferroalloys, platinum group metals, gold, silver and cobalt. The information by segment is presented in note 3. On December 22, 2017 after the conversion of the class “A” preferred shares into common shares, the Company migrated to the special listing segment of B3 S.A. (“Novo Mercado”), and became a company with no defined controlling shareholder (further details in the notes 4 and 29). As of this date, Vale’s common shares are traded in the Novo Mercado.
2. Basis for preparation of the financial statements a) Statement of compliance The consolidated financial statements of the Company (“financial statements”) have been prepared and are being presented in accordance with the International Financial Reporting Standards (“IFRS”) as issued by the International Accounting Standards Board (“IASB”). b) Basis of presentation The financial statements have been prepared under the historical cost convention as adjusted to reflect: (i) the fair value of financial instruments measured at fair value through income statement or available-for-sale financial instruments measured at fair value through the statement of comprehensive income; and (ii) impairment of assets. The issue of these financial statements was authorized by the Board of Directors on February 27, 2018. c) Consolidation and investments in associates and joint ventures The financial statements reflect the assets, liabilities and transactions of the Parent Company and its direct and indirect controlled entities (“subsidiaries”). These subsidiaries are consolidated when the Company is exposed or has rights to variable returns from its involvement with the investee and has the ability to direct the significant activities of the investee. The Company also consolidates subsidiaries that Vale does not own the majority of the voting capital, but has control through other means, such as a stockholder’s agreement. Intercompany balances and transactions, which include unrealized profits, are eliminated. The entities over which the Company has joint control (“joint ventures”) or significant influence, but not control (“associates”) are presented in note 15. Those investments are accounted for using the equity method. For interests in joint arrangements not classified as joint ventures (“joint operations”), the Company recognizes its share of assets, liabilities and net income. Unrealized gains on downstream or upstream transactions between the Company and its associates and joint ventures are eliminated fully or proportionately to the Company’s interest.

12
The material consolidated entities in each business segment are as follows: Location Main activity/Business % Ownership % Voting capital % Noncontrolling interest
Direct and indirect subsidiaries Companhia Portuária da Baía de Sepetiba Brazil Iron ore 100.0% 100.0% 0.0% Mineração Corumbaense Reunida S.A. Brazil Iron ore and manganese 100.0% 100.0% 0.0% Minerações Brasileiras Reunidas S.A. (“MBR”) Brazil Iron ore 62.5% 98.3% 37.5% Salobo Metais S.A. Brazil Copper 100.0% 100.0% 0.0% PT Vale Indonesia Indonesia Nickel 59.2% 59.2% 40.8% Vale International Holdings GmbH Austria Holding and research 100.0% 100.0% 0.0% Vale Canada Limited Canada Nickel 100.0% 100.0% 0.0% Vale International S.A. Switzerland Trading and holding 100.0% 100.0% 0.0% Vale Malaysia Minerals Sdn. Bhd. Malaysia Iron ore 100.0% 100.0% 0.0% Vale Manganês S.A. Brazil Manganese and ferroalloys 100.0% 100.0% 0.0% Vale Moçambique S.A. Mozambique Coal 81.0% 81.0% 19.0% Vale Nouvelle Caledonie S.A.S. New Caledonia Nickel 95.0% 95.0% 5.0% Vale Oman Distribution Center LLC Oman Iron ore and pelletizing 100.0% 100.0% 0.0% Vale Oman Pelletizing Company LLC Oman Pelletizing 70.0% 70.0% 30.0%
Investments held by investors in Vale’s subsidiaries are classified as noncontrolling interests. The Company treats transactions with noncontrolling interests as transactions with equity owners of the Company as described in note 16. For purchases from noncontrolling interests, the difference between any consideration paid and the proportion acquired of the carrying value of net assets of the subsidiary is recorded in stockholders’ equity. Gains or losses on disposals to noncontrolling interest are also directly recorded in stockholders’ equity in “Results from operation with noncontrolling interest”. As explained in note 14, the Fertilizer Segment is presented as discontinued operations, which includes the following subsidiaries: Location Main activity/Business % Ownership % Voting capital % Noncontrolling interest
Direct and indirect subsidiaries Compañia Minera Miski Mayo S.A.C. Peru Fertilizers 40.0% 51.0% 60.0% Vale Fertilizantes S.A. Brazil Fertilizers 100.0% 100.0% 0.0% Vale Cubatão Fertilizantes Ltda. Brazil Fertilizers 100.0% 100.0% 0.0%
d) Functional currency and presentation currency The financial statements of the Company and its associates and joint ventures are measured using the currency of the primary economic environment in which the entity operates (“functional currency”), which in the case of the Parent Company is the Brazilian real (“R$”). For presentation purposes, these financial statements are presented in United States dollar (“US$”) as the Company believes that this is how international investors analyze the financial statements. Transactions in foreign currencies are translated into the functional currency using the exchange rate prevailing at the transaction date. The foreign exchange gains and losses resulting from the translation at the exchange rates prevailing at the end of the year are recognized in the income statement as “financial income or expense”. The exceptions are transactions for which gains and losses are recognized in the statement of comprehensive income. The income statement and statement of financial position of the subsidiaries for which the functional currency is different from the presentation currency are translated into the presentation currency as follows: (i) assets, liabilities and stockholders’ equity, except for the components described in item (iii) are translated at the closing rate at the statement of financial position date; (ii) income and expenses are translated at the average exchange rates, except for specific significant transactions that, are translated at the rate at the transaction date and; (iii) capital, capital reserves and treasury stock are translated at the rate at each transaction date. All resulting exchange differences are recognized directly in the comprehensive income as “translation adjustments”. When a foreign operation is partially disposed of or sold, foreign exchanges differences that were recognized in equity are recognized in the income of statement. The exchange rates used by the Company to translate its foreign operations are as follows: Closing rate Average rate for the year ended
2017 2016 2015 2017 2016 2015
US Dollar ("US$") 3.3080 3.2591 3.9048 3.1925 3.4833 3.3387 Canadian dollar ("CAD") 2.6344 2.4258 2.8171 2.4618 2.6280 2.6020 Australian dollar ("AUD") 2.5849 2.3560 2.8532 2.4474 2.5876 2.4979 Euro ("EUR" or "€") 3.9693 3.4384 4.2504 3.6088 3.8543 3.6999

13
e) Significant accounting policies Significant and relevant accounting policies for the understanding of the recognition and measurement basis used on the preparation of these financial statements were included in the respective notes. The accounting policies applied in the preparation of these financial statements are consistent with those adopted and disclosed in the financial statements of prior years. The Company has not early adopted any standards and interpretations that have been issued or amended but are not yet effective for the year ended December 31, 2017. The following new accounting standards were issued by IASB, but are not yet effective for 2017. The Company has performed an assessment on the Company’s financial statements and the current expected impacts are detailed below: – IFRS 9 Financial instrument – In July 2014, the IASB issued the final version of IFRS 9 that replaces IAS 39 Financial Instruments: Recognition and Measurement. This standard addresses the classification and measurement of financial assets and liabilities, new impairment model and new rules for hedge accounting. This standard shall apply for annual periods beginning on or after January 1, 2018. The Company has reviewed its financial assets and liabilities and is expecting the following impact from the adoption of the new standard on 1 January 2018: - Classification and measurement – IFRS 9 establishes a new approach to determine whether a financial asset should be measured at amortized cost or fair value, based on the cash flow characteristics and the business model in which an asset is held. The Company does not currently expect the impact of these changes to be significant. - Impairment – IFRS 9 requires “expected credit loss” impairment model for accounts receivables measured at amortized cost, on either a 12-month or the lifetime basis, rather than only incurred credit losses as is the case under IAS 39. Given that Vale’s account receivables are short-term in nature and considering its credit rating and risk management policies in place, the Company does not expect these changes will have a significant impact on its financial statements. - Hedge accounting – the changes in IFRS 9 relating to hedge accounting will have no impact as the Company does not currently apply cash flow or fair value hedge accounting. The Company currently applies the net investment hedge, which there is no changes introduced by this new standard. – IFRS 15 Revenue from Contracts with Customers – In May 2014, the IASB issued IFRS 15, which replaces IAS 18 Revenues and the related interpretations. IFRS 15 introduces the five-step model for revenue recognition from contracts with customers. The new standard is based on the core principle that revenue is recognized when the control of a good or service transfers to a customer of an amount that reflects the consideration to which the entity expects to be entitled in exchange for those goods or services. This standard shall apply for annual periods beginning on or after January 1, 2018. The Company will adopt this new standard on the required effective date using the modified retrospective method. Accordingly, the Company will not be required to restate the comparative figures. During 2017, the Company performed a detailed assessment of IFRS 15, based on the contractual arrangements across the Company’s main revenue streams. The result of this assessment and the impacts identified in relation to the IFRS 15 first adoption are summarized as follows: Vale's revenue is predominantly derived from commodities sales, where the point of recognition is dependent on the sales arrangement, which is governed by parameters established by the International Commercial Terms (Incoterms). There will be no significant impact on the timing of commodities revenue recognition under IFRS 15, since usually the transfer of risks and rewards and the transfer of control under the sales contracts are at the same point in time.

14
However, a significant proportion of Vale’s sales are under CFR (Cost and Freight) or CIF (Cost, Insurance and Freight) Incoterms, in which the Company is responsible for providing shipping services after the date that Vale transfers control of the goods to the customers. Currently, the revenue from shipping services are recognized upon loading, as well as the related costs, and are not considered a separate service under IAS 18. Under IFRS 15, the provision of shipping services for CFR and CIF contracts will be a distinct service and, therefore, a separate performance obligation to which a proportion of the transaction price should be allocated and recognized over time as the shipping services are provided. The impact on the timing of revenue recognition of the proportion allocated to the shipping service is deemed not significant to the Company's year-end results. Therefore, such revenue will not be presented separately in the Company’s financial statements. The accounting treatment for contracts with provisional pricing features that are currently considered as an embedded derivative in accordance with IAS 39 - Financial Instruments, shall remain unmodified in accordance with IFRS 15 and IFRS 9 - Financial Instruments. In addition, IFRS 15 introduces a new disclosure requirement for the provisional prices impact on the financial statements. When applicable, systems and processes will be amended to allow the disclosure of this information in the Company's financial statements. IFRS 15 also requires the Company to treat deferred revenue related to the gold stream transaction as variable and, therefore must be adjusted each time there is a change in the underlying production profile. The Company does not expect to record a significant adjustment upon transition to this new standard. – IFRS 16 Lease – In January 2016, the IASB issued IFRS 16, which replaces IAS 17 Leases and related interpretations. The IFRS 16 set forth that the lessee must recognize all leases on the statement of financial position, as the distinction between operating and finance leases is removed. The standard provides certain exemptions from recognizing leases on the statement of financial position, including where the underlying asset is of low value or the lease term is 12 months or less. Under the new standard, the Company will be required to recognize right of use lease assets and lease liabilities on the statement of financial position. Liabilities are measured based on the present value of future lease payments over the lease term. The right of use lease asset generally reflects the lease liability. This standard shall apply for annual periods beginning on or after January 1, 2019. The Company has commenced the qualitative analysis of its main contracts and will continue to assess the quantitative potential effect of IFRS 16 during 2018, which depends on the decision regarding the transition method and the use of practical expedients and/or exemptions. It is therefore not yet possible to estimate the amount of right-of-use assets and lease liabilities that will have to be recognised on adoption of the new standard and how this may affect the Company’s income statement. The information on the main operating leases is presented in note 31. f) Critical accounting estimates and judgments The preparation of financial statements requires the use of certain critical accounting estimates and the application of judgment by management in applying the Company’s accounting policies. These estimates are based on the experience, best knowledge, information available at the statement of financial position date and other factors, including expectations of future events that are believed to be reasonable under the circumstances. Changes in facts and circumstances may lead to the revision of these estimates. Actual future results may differ from the estimates. The significant estimates and judgments applied by Company in the preparation of these financial statements are as follows: Note Significant estimates and judgments 7 Deferred revenue - Gold stream transaction 8 Deferred income taxes 15 Consolidation 18 Mineral reserves and mine useful life 19 Impairment of non-current assets 21 Liabilities related to associates and joint ventures 23 Fair values estimate 26 Asset retirement obligation 27 Litigation 28 Employee postretirement obligations

15
3. Information by business segment and by geographic area The Company operated five reportable segments during this year: Ferrous Minerals, Coal, Base Metals, Fertilizers (presented as discontinued operations) and Others. The segments are aligned with products and reflect the structure used by Management to evaluate Company performance. The responsible bodies for making operational decisions, allocating resources and evaluating performance are the Executive Boards and the Board of Directors. The performance of the operating segments is assessed based on a measure of adjusted EBITDA. The information presented to the Executive Board on the performance of each segment is derived from the accounting records, adjusted for reallocations between segments. The main activities of the operating segments are as follows: Ferrous minerals - Ferrous minerals comprises the production and extraction of iron ore, iron ore pellets and its logistic services (railroads, ports and terminals), manganese, ferroalloys and others ferrous products and services. Coal - Coal comprises the extraction of metallurgical and thermal coal and its logistic services (railroads, ports and terminals). Base metals - Base metals include the production and extraction of non-ferrous minerals, and are presented as nickel and its by-products (ferro-nickel, copper, gold, precious metals and others) and copper (copper concentrated). Fertilizers (Discontinued operations) - Fertilizers include the production of the three major groups of nutrients (potash, phosphate and nitrogen) and other fertilizers products. The group of assets related to this segment is classified as "Non-current assets and liabilities associated with non-current assets held for sale" (note 14). Others - Other comprises sales and expenses of other products, services, research and evaluation, investments in joint ventures and associates of other business and contingencies not directly related to the core business. a) Adjusted EBITDA The definition of adjusted EBITDA for the Company is the operating income or loss excluding (i) the depreciation, depletion and amortization, (ii) results on measurement or sales of non-current assets, (iii) impairment, (iv) onerous contracts and plus (v) dividends received and interest from associates and joint ventures.
Year ended December 31, 2017
Net operating
revenue
Cost of goods sold and services
rendered
Sales, administrative and other operating
expenses
Research and
evaluation
Pre operating and operational
stoppage
Dividends received and interest from associates
and joint ventures Adjusted
EBITDA
Ferrous minerals Iron ore 18,524 (7,950) (284) (88) (181) 30 10,051 Iron ore Pellets 5,653 (2,876) (65) (19) (7) 81 2,767 Ferroalloys and manganese 469 (278) (12) - (4) - 175 Other ferrous products and services 483 (306) 5 (2) - 19 199
25,129 (11,410) (356) (109) (192) 130 13,192 Coal 1,567 (1,354) (44) (14) (4) 179 330 Base metals Nickel and other products 4,667 (3,437) (152) (49) (75) - 954 Copper 2,204 (979) (27) (13) - - 1,185
6,871 (4,416) (179) (62) (75) - 2,139 Others 400 (375) (281) (155) (9) 97 (323)
Total of continuing operations 33,967 (17,555) (860) (340) (280) 406 15,338
Discontinued operations (Fertilizers) 1,746 (1,606) (102) (12) (25) 3 4
Total 35,713 (19,161) (962) (352) (305) 409 15,342

16
Year ended December 31, 2016
Net operating revenue
Cost of goods sold and services
rendered
Sales, administrative and other operating
expenses
Research and evaluation
Pre operating and operational
stoppage
Dividends received and interest from associates
and joint ventures
Adjusted EBITDA
Ferrous minerals
Iron ore 15,784 (6,622) (486) (91) (150) 10 8,445
Iron ore Pellets 3,827 (2,002) (73) (13) (22) 103 1,820
Ferroalloys and manganese 302 (231) (4) - (11) - 56
Other ferrous products and services 438 (269) (8) (2) (4) - 155
20,351 (9,124) (571) (106) (187) 113 10,476
Coal 839 (872) 35 (15) (41) - (54)
Base metals
Nickel and other products 4,472 (3,204) (95) (78) (114) 4 985
Copper 1,667 (924) (25) (5) - - 713
Other base metals products - - 150 - - - 150
6,139 (4,128) 30 (83) (114) 4 1,848
Others 159 (259) (157) (116) (1) 76 (298)
Total of continuing operations 27,488 (14,383) (663) (320) (343) 193 11,972
Discontinued operations (Fertilizers) 1,875 (1,545) (87) (22) (16) 4 209
Total 29,363 (15,928) (750) (342) (359) 197 12,181
Year ended December 31, 2015
Net operating revenue
Cost of goods sold and services
rendered
Sales, administrative and other operating
expenses
Research and evaluation
Pre operating and operational
stoppage
Dividends received and interest from associates
and joint ventures
Adjusted EBITDA
Ferrous minerals
Iron ore 12,330 (7,604) (398) (121) (124) 22 4,105
Iron ore Pellets 3,600 (2,121) 9 (4) (24) 225 1,685
Ferroalloys and manganese 162 (175) 1 - (19) - (31) Other ferrous products and services 470 (341) 8 (3) (2) 8 140
16,562 (10,241) (380) (128) (169) 255 5,899
Coal 526 (839) (140) (22) (61) 28 (508)
Base metals
Nickel and other products 4,693 (3,393) (154) (103) (411) - 632
Copper 1,470 (903) (32) (8) (1) - 526
Other base metals products - - 230 - - - 230
6,163 (4,296) 44 (111) (412) - 1,388
Others 133 (139) (160) (134) - 35 (265)
Total of continuing operations 23,384 (15,515) (636) (395) (642) 318 6,514
Discontinued operations (Fertilizers) 2,225 (1,469) (37) (82) (70) - 567
Total 25,609 (16,984) (673) (477) (712) 318 7,081
Adjusted EBITDA is reconciled to net income (loss) as follows: From Continuing operations Year ended December 31
2017 2016 2015
Adjusted EBITDA from continuing operations 15,338 11,972 6,514
Depreciation, depletion and amortization (3,708) (3,487) (3,719) Dividends received and interest from associates and joint ventures (406) (193) (318) Impairment and other results on non-current assets (294) (1,240) (8,708)
Operating income (loss) 10,930 7,052 (6,231) Financial results, net (3,019) 1,843 (10,654) Equity results in associates and joint ventures 98 309 (445) Impairment and other results in associates and joint ventures (180) (1,220) (349) Income taxes (1,495) (2,781) 5,249
Net income (loss) from continuing operations 6,334 5,203 (12,430) Net income (loss) attributable to noncontrolling interests 21 (8) (501)
Net income (loss) attributable to Vale's stockholders 6,313 5,211 (11,929)

17
From Discontinued operations
Year ended December 31
2017 2016 2015
Adjusted EBITDA from discontinued operations 4 209 567
Depreciation, depletion and amortization (1) (347) (310) Dividends received and interest from associates and joint ventures (3) (4) - Impairment of non-current assets (885) (1,738) (157)
Operating income (loss) (885) (1,880) 100 Financial results, net (28) 20 (147) Equity results in associates and joint ventures (2) 3 6 Income taxes 102 630 (149)
Loss from discontinued operations (813) (1,227) (190) Net income (loss) attributable to noncontrolling interests (7) 2 10
Loss attributable to Vale's stockholders (806) (1,229) (200)
b) Assets by segment Year ended December 31, 2017
Product inventory
Investments in associates and joint
ventures
Property, plant and equipment and
intangible (i)
Additions to property, plant and equipment and
intangible (ii)
Depreciation, depletion and
amortization (iii)
Ferrous minerals 1,770 1,922 36,103 2,679 1,767 Coal 82 317 1,719 118 297 Base metals 1,009 13 23,603 1,010 1,614 Others 6 1,316 1,946 24 30
Total 2,867 3,568 63,371 3,831 3,708
Year ended December 31, 2016
Product inventory
Investments in associates and joint
ventures
Property, plant and equipment and
intangible (i)
Additions to property, plant and equipment
and intangible (ii)
Depreciation, depletion and
amortization (iii)
Ferrous minerals 1,134 1,808 34,834 3,246 1,618 Coal 126 285 1,907 612 191 Base metals 1,110 12 23,372 1,057 1,658 Others 3 1,591 2,177 36 20
Total 2,373 3,696 62,290 4,951 3,487
(i) Goodwill is allocated mainly in ferrous minerals and base metals segments in the amount of US$2,157 and US$1,953 in December 31, 2017 and US$1,246 and US$1,835 in December 31, 2016, respectively. (ii) Includes only cash effect. (iii) Refers to amounts recognized in the income statement.
c) Investment in associates and joint ventures, intangible and property, plant and equipment by geographic area December 31, 2017 December 31, 2016
Investments in associates and joint ventures Intangible
Property, plant and
equipment Total
Investments in associates and joint ventures Intangible
Property, plant and equipment Total
Brazil 2,993 6,231 33,782 43,006 3,172 4,720 34,509 42,401 Canada - 2,118 10,967 13,085 - 2,002 10,267 12,269 Americas, except Brazil and Canada 200 - 427 627 185 - 30 215 Europe - - 394 394 - - 639 639 Indonesia - - 2,787 2,787 - - 2,972 2,972 Asia, except Indonesia 372 - 1,100 1,472 339 - 1,201 1,540 Australia - - 45 45 - - 43 43 New Caledonia - - 2,965 2,965 - - 3,087 3,087 Mozambique - 143 1,532 1,675 - 149 1,715 1,864 Oman - 1 868 869 - - 956 956 Other regions 3 - 11 14 - - - -
Total 3,568 8,493 54,878 66,939 3,696 6,871 55,419 65,986

18
d) Net operating revenue by geographic area Year ended December 31, 2017
Ferrous
minerals Coal Base metals Others Total
Americas, except United States and Brazil 593 - 1,009 70 1,672 United States of America 355 - 872 83 1,310 Germany 1,097 - 292 - 1,389 Europe, except Germany 1,721 396 1,985 11 4,113 Middle East/Africa/Oceania 1,768 171 13 - 1,952 Japan 1,927 130 399 - 2,456 China 13,442 - 576 - 14,018 Asia, except Japan and China 1,332 711 1,539 - 3,582 Brazil 2,894 159 186 236 3,475
Net operating revenue 25,129 1,567 6,871 400 33,967
Year ended December 31, 2016
Ferrous
minerals Coal Base metals Others Total
Americas, except United States and Brazil 334 20 1,172 - 1,526 United States of America 232 - 749 24 1,005 Germany 1,077 - 302 - 1,379 Europe, except Germany 1,482 218 1,552 17 3,269 Middle East/Africa/Oceania 1,252 95 20 - 1,367 Japan 1,292 121 328 - 1,741 China 11,985 63 699 - 12,747 Asia, except Japan and China 912 305 1,173 - 2,390 Brazil 1,785 17 144 118 2,064
Net operating revenue 20,351 839 6,139 159 27,488
Year ended December 31, 2015
Ferrous
minerals Coal Base metals Others Total
Americas, except United States and Brazil 359 18 1,122 - 1,499 United States of America 30 - 804 21 855 Germany 1,042 - 391 - 1,433 Europe, except Germany 1,464 102 1,530 - 3,096 Middle East/Africa/Oceania 1,009 97 84 - 1,190 Japan 1,512 74 373 - 1,959 China 8,400 44 651 - 9,095 Asia, except Japan and China 1,081 169 990 - 2,240 Brazil 1,665 22 218 112 2,017
Net operating revenue 16,562 526 6,163 133 23,384
Accounting policy
Revenue is recognized when Vale transfers to its customers all of the significant risks and rewards of ownership of the product sold or when the services are rendered. Net revenue excludes any applicable sales taxes and is recognized at the fair value of the consideration received or receivable to the extent that it is probable that economic benefits will flow to Vale and the revenues can be reliably measured. Depending on the contract, revenue sales can be recognized when the product is available at the loading port, loaded on the ship, at the port of discharge or at the custumer’s warehouse. Service revenues are recognized in the amount by which the services are rendered and accepted by the customer. In some cases, the sale price is determined on a provisional basis at the date of sale and adjustments to the sales price subsequently occur based on movements in the quoted market or contractual prices up to the date of final pricing. Revenue is recognized based on the estimated fair value of the total consideration receivable, and the provisionally priced sales mechanism embedded within these sale arrangements has the character of a derivative. Accordingly, the fair value of the final sales price adjustment is re-estimated continuously and changes in fair value are recognized as operational revenue in the income statement. Amounts billed to customers for shipping related to products sold by the Company are recognized as revenue when the Company is responsible for shipping. Shipping costs are recognized as operating costs.

19
Commodity price risk – The commodity price risk arises from volatility of iron ore, nickel, copper and coal prices. The Company is mostly exposed to the fluctuations in the iron ore and copper price. The selling price these products can be measured reliably at each period, since the price is quoted on an active market. As of December 31, 2017, the Company had 33 million tons (2016: 36 million tons) provisionally priced based on iron ore forward prices and 106 thousand tons (2016: 116 thousand tons) provisionally priced based on copper forward prices. The final price of these sales will be determined during the first quarter of 2018. A 10% change in the price of iron ore realized on the provisionally priced sales, all other factors held constant, would increase or reduce net income by US$227. A 10% change in the price of copper realized on the provisionally priced sales, all other factors held constant, would increase or reduce net income by US$86.
4. Special events occurred during the year The special events occurred during the year are those that, in the Company’s judgment, have significant effect on: (i) its operations; and/or (ii) corporate governance structure; and/or (iii) the income statement due to their size and nature. To determine whether an event or transaction should be disclosed as “special events”, the Company considers quantitative and qualitative factors, such as frequency and magnitude. The special events identified by the Company are as follows: a) Vale’s corporate governance restructuring At the General Extraordinary Shareholders’ Meeting, held on June 27, 2017, shareholders approved the corporate restructuring of the Company proposed by Valepar S.A. (former controlling shareholder). The corporate restructuring was based on (i) conversion of Vale class “A” preferred shares into common shares; (ii) amendment of Vale’s by-laws, so as to adjust to Novo Mercado rules; and (iii) the merger of Valepar S.A. into Vale. The transaction was concluded on November 21, 2017 and the restructuring was approved at the General Extraordinary Shareholder’s Meeting on December 21, 2017. Further details are disclosed in note 29. b) Events with significant effect on the income statement Year ended December 31
2017 2016 2015
Nacala Logistic Corridor 458 - - Samarco Provision (180) (1,109) - Impairment of non-current assets - Fertilizers business (885) (1,738) - Impairment of non-current assets and onerous contracts (271) (1,174) (8,769) Gold stream transaction - 150 230 Deferred income tax in foreign jurisdiction - - 2,952
Total (878) (3,871) (5,587)
Nacala Logistic Corridor – In March 2017, the Company concluded the transaction with Mitsui to sell 15% of its stake in Vale Moçambique and 50% of its stake in the Nacala Logistics Corridor and recognized a gain in the income statement of US$458. Further details are disclosed in note 15. Samarco – In 2017, the Company recognized in the income statement the amount of US$38 (2016: US$1,038 (R$3,733 million)) in respect of the additions to the provision to comply with the reparation and compensation programs related to the dam failure of Samarco Mineração S.A. The Company also expensed an amount of US$142 (2016: US$71) applied by Samarco to funds its working capital requirements. Further details are disclosed in note 21.
Fertilizers – In December 2016, the Company approved the sale of fertilizers assets and the acquisition of a noncontrolling interest in The Mosaic Company (“Mosaic”). The Company assessed the fair value less cost of sell of the fertilizer business segment and an impairment loss of US$1,738 was recognized in the income statement from discontinued operations in the year ended December 31, 2016. In January 2018 (subsequent event), the Company and Mosaic concluded the transaction, which was preceded by final adjustments agreed by the parties under the original terms and conditions of the negotiation. As consequence of these adjustments, an impairment loss of US$729 was recognized in the income statement from discontinued operations in December 2017. Additionally, in November 2017, the Company entered into an agreement with Yara International ASA to sell its nitrogen assets located in Cubatão, Brazil and an impairment loss of US$156 was recognized in the income statement from discontinued operations in the year ended December 31, 2017. Further details are disclosed in note 14.

20
Impairment of non-current assets and onerous contracts – In 2017, the Company placed an underground mine in Sudbury in “care and maintenance” and an impairment of US$133 was recognized in the income statement. In 2016, the Company recognized an impairment loss of US$1,174 mainly by the reduction in the nickel price projections. In 2015, the Company recognized an impairment loss of US$8,769 mainly by: (i) the reduction in estimated future coal prices combined with the increase of logistics costs and (ii) the reduction the recoverable values of the VNL and VNC CGUs. Further details are disclosed in note 19.
Gold stream transaction – In March 2015 and August 2016, a gold transaction with Wheaton Precious Metals Corp. (“WPW”) entered into 2013, was amended to include in each contract an additional 25% of the gold extracted as by-product of the Salobo copper mine. Furthermore, the Company recognized a gain of the result on sale of mineral rights in the amount of US$150 and US$230 in the year ended December 31, 2016 and 2015, respectively, see note 7. Deferred income tax - In 2015, in the first adoption of the Law 12.973, the Company recognized assets deferred income tax related to accumulated losses of subsidiaries abroad in the amount of US$2,952, see note 8.
5. Costs and expenses by nature
a) Cost of goods sold and services rendered Year ended December 31
2017 2016 2015
Personnel 2,295 2,087 2,092 Materials and services 3,814 3,108 2,954 Fuel oil and gas 1,313 1,233 1,207 Maintenance 3,096 2,747 2,518 Energy 963 694 482 Acquisition of products 543 511 829 Depreciation and depletion 3,484 3,267 3,236 Freight 3,346 2,509 3,496 Others 2,185 1,494 1,937
Total 21,039 17,650 18,751
Cost of goods sold 20,426 17,148 18,233 Cost of services rendered 613 502 518
Total 21,039 17,650 18,751
b) Selling and administrative expenses Year ended December 31
2017 2016 2015
Personnel 234 209 253 Services 77 72 106 Depreciation and amortization 91 120 131 Travel expenses 8 8 11 Taxes and rents 12 13 16 Others 109 85 95
Total 531 507 612
c) Others operational expenses (incomes), net Year ended December 31
2017 2016 2015
Provision for litigation 169 137 11 Profit sharing program 149 76 15 Disposals (reversals) of materials and inventories 17 (23) 55 Others 85 77 126
Total 420 267 207

21
6. Financial result
Year ended December 31
2017 2016 2015
Financial expenses Loans and borrowings gross interest (1,697) (1,768) (1,647) Capitalized loans and borrowing costs 370 653 761 Derivative financial instruments (533) (484) (3,553) Indexation and exchange rate variation (a) (2,617) (2,964) (13,825) Participative stockholders' debentures (625) (417) 965 Expenses of REFIS (397) (514) (547) Others (924) (631) (600)
(6,423) (6,125) (18,446) Financial income Short‐term investments 176 92 140 Derivative financial instruments 987 1,740 1,076 Indexation and exchange rate variation (b) 1,939 6,058 6,465 Others 302 78 111
3,404 7,968 7,792
Financial results, net (3,019) 1,843 (10,654)
Summary of indexation and exchange rate variation Loans and borrowings (257) 5,099 (10,460) Others (421) (2,005) 3,100
Net (a) + (b) (678) 3,094 (7,360)
As from January 1, 2017, the Company applies net investment hedge accounting in foreign operation. Further details are disclosed in note 24.
7. Deferred revenue - Gold stream transaction
In 2013, the Company entered into a gold transaction with Wheaton Precious Metals Corp. (“WPM”), and amended in March 2015 and August 2016, to sell 75% of the gold extracted as a by-product of the Salobo copper mine and 70% of the gold extracted as a by-product of Sudbury nickel mines. The transactions were bifurcated into two identifiable components (i) the sale of the mineral rights and, (ii) the services for gold extraction on the portion in which Vale operates as an agent for WPM gold extraction. The result on sale of mineral rights from the additional transactions of US$150 and US$230 was recognized in the years ended December 31, 2016 and 2015, respectively, under "Other operating expenses, net".
Critical accounting estimates and judgments
Defining the gain on sale of mineral interest and the deferred revenue portion of the transaction requires the use of critical accounting estimates as follows: - Discount rates used to measure the present value of future inflows and outflows; - Allocation of costs between nickel or copper and gold based on relative prices; - Expected margin for the independent elements (sale of mineral rights and service for gold extraction) based on Company’s best estimate.

22
8. Income taxes a) Deferred income tax assets and liabilities December 31, 2017 December 31, 2016
Taxes losses carryforward 4,471 6,194 Temporary differences: Employee post retirement obligations 684 620 Provision for litigation 457 215 Timing differences arising on assets 1,268 1,264 Fair value of financial instruments 549 167 Allocated goodwill (2,433) (2,247) Others (77) (570)
448 (551)
Total 4,919 5,643
Assets 6,638 7,343 Liabilities (1,719) (1,700)
4,919 5,643
Changes in deferred tax are as follows: Assets Liabilities Total
Balance at December 31, 2015 7,904 1,670 6,234
Taxes losses carryforward (1,391) - (1,391) Timing differences arising on assets 298 - 298 Fair value of financial instruments (802) - (802) Allocated goodwill - (342) 342 Others (285) - (285)
Effect in income statement (2,180) (342) (1,838) Transfers between asset and liabilities 322 322 - Translation adjustment 900 36 864 Other comprehensive income (19) 14 (33) Effect of discontinued operations Income tax 627 - 627 Transfer to net assets held for sale (211) - (211)
Balance at December 31, 2016 7,343 1,700 5,643
Taxes losses carryforward (2,143) - (2,143) Timing differences arising on assets 103 - 103 Fair value of financial instruments 388 - 388 Allocated goodwill - (109) 109 Others 897 - 897 Effect in income statement (755) (109) (646) Transfers between asset and liabilities 40 40 - Translation adjustment (24) 75 (99) Other comprehensive income (68) 13 (81) Effect of discontinued operations Income tax 102 - 102
Balance at December 31, 2017 6,638 1,719 4,919
Law 12.973 - The Brazilian corporate tax law was amended at the end of 2014 and became effective as from fiscal year 2015. The change provided that profits from foreign subsidiaries are taxable in Brazil, on an accrual basis, applying the differential between the nominal local tax rate and the Brazilian tax rates (34%) considering the profit before tax in local GAAP (Generally Accepted Accounting Principles) and local currency. Accordingly, from January 1st, 2015 the results from foreign subsidiaries are recognized on that basis.
In accordance with article 77 of law 12.973, the losses generated by the foreign subsidiaries, before income taxes and the equity results, may be offset against their future profits, subject to certain conditions. In 2015, in the first adoption, the Company recognized deferred income tax assets related to accumulated losses of subsidiaries abroad in the amount of US$2,952. Based on Company’s projections, the deferred tax assets are expected to be utilized up to 5 years. The tax loss carryforward does not expire in the Brazilian jurisdiction and the compensation is limited to 30% of the taxable income for the year. For local results taxable in Brazil, there is no restriction to compensated profits from foreign subsidiaries against previously recorded deferred tax assets.

23
b) Income tax reconciliation – Income statement The total amount presented as income taxes in the income statement is reconciled to the rate established by law, as follows: Year ended December 31
2017 2016 2015
Income (loss) before income taxes 7,829 7,984 (17,679) Income taxes at statutory rates ‐ 34% (2,662) (2,715) 6,011 Adjustments that affect the basis of taxes: Income tax benefit from interest on stockholders' equity 728 87 356 Tax incentives 372 344 61 Equity results 35 107 (151) Unrecognized tax losses of the year (432) (708) (901) Nondeductible effect of impairment (43) (97) (1,865) Others 507 201 1,738
Income taxes (1,495) (2,781) 5,249
c) Tax incentives In Brazil, Vale has tax incentives to partially reduce the income tax generated by the operations conducted in the North and Northeast regions that includes iron ore, manganese, copper and nickel. The incentive is calculated based on the taxable income of the incentive activity (tax operating income) and takes into account the allocation of tax operating income into different incentives applicable to different tranches of production during the periods specified for each product, generally 10 years. Most of our incentives are expected to expire up to 2024. An amount equal to that obtained with the tax saving must be appropriated in retained earnings reserve account in stockholders’ equity, and cannot be distributed as dividends to stockholders. In addition to those incentives, 30% of the income tax due based on the tax operating income can be reinvested on the purchase of machinery and equipment, subject to subsequent approval by the regulatory agency responsible, Superintendência do Desenvolvimento da Amazonia (“SUDAM”) and the Superintendência do Desenvolvimento do Nordeste (“SUDENE”). The reinvestment is accounted in retained earnings reserve account, which restricts the distribution as dividends to stockholders. Vale is subject to the revision of income tax by local tax authorities in a range up to 10 years depending on jurisdiction where the Company operates. d) Income taxes - Settlement program (“REFIS”) The balance mainly relates to REFIS to settle most of the claims related to the collection of income tax and social contribution on equity gains of foreign subsidiaries and affiliates from 2003 to 2012. As at December 31, 2017, the balance of US$5,375 (US$485 as current and US$4,890 as non-current) is due in 130 remaining monthly installments, bearing interest at the SELIC rate (Special System for Settlement and Custody), while at December 31, 2016, the balance was US$5,419 (US$458 as current and US$4,961 as non-current). As at December 31, 2017, the SELIC rate was 7,0% per annum (13.75% per annum at December 31, 2016). Accounting policy
The recognition of income taxes as deferred taxes is based on temporary differences between carrying amount and the tax basis of assets and liabilities as well as taxes losses carryforwards. The deferred income taxes assets and liabilities are offset when there is a legally enforceable right on the same taxable entity. The deferred taxes assets arising from taxes losses and temporary differences are not recognized when is not probable that future taxable profit will be available against which temporary differences and/or tax losses can be utilized. Income taxes are recognized in the income statement, except for items recognized directly in stockholders’ equity. The provision for income tax is calculated individually for each entity of the Company based on Brazilian tax rates, on an accrual basis, by applying the differential between the nominal local tax rates (based on rules enacted in the location of the entity) and the Brazilian tax rate.

24
Critical accounting estimates and judgments
Deferred tax assets arising from tax losses, negative social contribution basis and temporary differences are registered taking into account the analysis of future performance, considering economic and financial projections, prepared based on internal assumptions and macroeconomic environment, trade and tax scenarios that may be subject to changes in the future. The assumptions of future profits are based on production and sales planning, commodity prices, operational costs, restructuring plans, reclamation and planned capital costs.
9. Basic and diluted earnings (loss) per share As disclosed in note 29, the Company converted its class “A” preferred shares into common shares, without changing the amount of share capital. Therefore, the weighted average number of shares was restated as if the conversion had occurred at the beginning of the last comparative year presented. The basic and diluted earnings (loss) per share are presented below: Year ended December 31
2017 2016 2015
Net income (loss) attributable to Vale's stockholders: Net income (loss) from continuing operations 6,313 5,211 (11,929) Loss from discontinued operations (806) (1,229) (200)
Net income (loss) 5,507 3,982 (12,129)
Thousands of shares (restated) Weighted average number of shares outstanding - common shares 5,197,432 5,197,432 5,197,432 Basic and diluted earnings (loss) per share from continuing operations (restated): Common share (US$) 1.21 1.00 (2.30) Basic and diluted loss per share from discontinued operations (restated): Common share (US$) (0.16) (0.23) (0.03) Basic and diluted earnings (loss) per share (restated): Common share (US$) 1.05 0.77 (2.33)
The Company does not have potential outstanding shares with dilutive effect on the earnings (loss) per share.
10. Accounts receivable December 31, 2017 December 31, 2016
Accounts receivable 2,660 3,723 Impairment of accounts receivable (60) (60)
2,600 3,663
Accounts receivable related to the steel sector - % 82.90% 83.44%
Year ended December 31
2017 2016 2015
Impairment of accounts receivable recorded in the income statement (4) (5) 11
There is no customer that individually represents over 10% of accounts receivable or revenues. Accounting policy
Accounts receivable are financial instruments classified in the category loan and receivables and are the total amount due from sale of products and services rendered by the Company. Accounts receivable are initially recognized at fair value and subsequently measured at amortized cost, less provision for impairment of accounts receivable, when applicable.

25
Commercial credit risk management - For the commercial credit exposure, which arises from sales to final customers, the risk management area, in accordance with the current delegation level, approves or request the approval of credit risk limits for each counterparty. Vale attributes an internal credit risk rating for each counterparty using its own quantitative methodology for credit risk analysis, which is based on market prices, external credit ratings and financial information of the counterparty, as well as qualitative information regarding the counterparty’s strategic position and history of commercial relations. Based on the counterparty’s credit risk, risk mitigation strategies may be used to manage the Company`s credit risk. The main credit risk mitigation strategies include non-recourse sale of receivables, insurance instruments, letters of credit, corporate and bank guarantees, mortgages, among others. Vale has a diversified accounts receivable portfolio from a geographical standpoint, with Asia, Europe and Brazil the regions with more significant exposures. According to each region, different guarantees can be used to enhance the credit quality of the receivables.
11. Inventories December 31, 2017 December 31, 2016
Product inventory 2,219 1,573 Work in progress 648 800 Consumable inventory 1,059 976
Total 3,926 3,349
In 2017, the Company recognized in the income statement a provision in respect of the net realizable value of product inventory, in the amount of US$86 (2016: US$199 and 2015: US$518). Product inventories by segments are presented in note 3(b). Accounting policy
Inventories are stated at the lower of cost or the net realizable value. The inventory production cost is determined on the basis of variable and fixed costs, direct and indirect costs of production, using the average cost method. At each statement of financial position date, inventories are assessed for impairment and a provision for losses on obsolete or slow-moving inventory may be recognized. The write-downs and reversals are included in “Cost of goods sold and services rendered”.
12. Recoverable taxes Recoverable taxes are presented net of provisions for losses on tax credits. December 31, 2017 December 31, 2016
Value-added tax 887 724 Brazilian federal contributions 880 1,599 Others 43 29
Total 1,810 2,352
Current 1,172 1,625 Non-current 638 727
Total 1,810 2,352
26
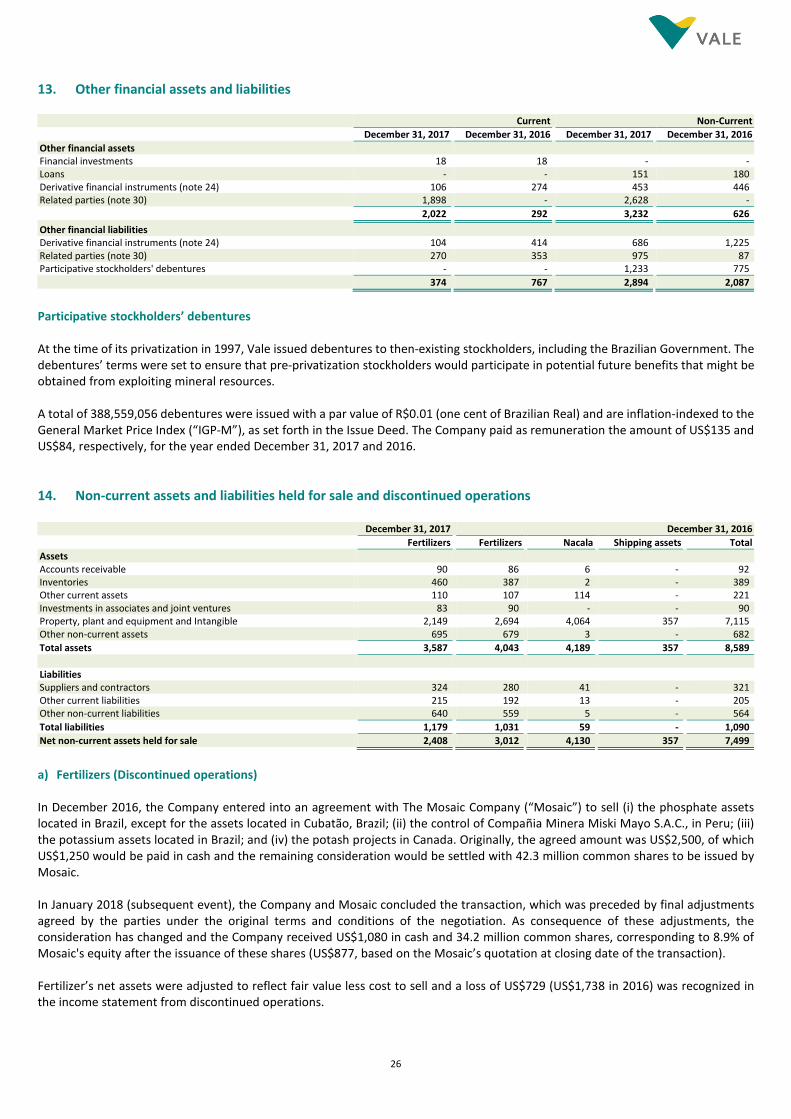
13. Other financial assets and liabilities Current Non-Current
December 31, 2017 December 31, 2016 December 31, 2017 December 31, 2016
Other financial assets Financial investments 18 18 - - Loans - - 151 180 Derivative financial instruments (note 24) 106 274 453 446 Related parties (note 30) 1,898 - 2,628 -
2,022 292 3,232 626
Other financial liabilities Derivative financial instruments (note 24) 104 414 686 1,225 Related parties (note 30) 270 353 975 87 Participative stockholders' debentures - - 1,233 775
374 767 2,894 2,087
Participative stockholders’ debentures At the time of its privatization in 1997, Vale issued debentures to then-existing stockholders, including the Brazilian Government. The debentures’ terms were set to ensure that pre-privatization stockholders would participate in potential future benefits that might be obtained from exploiting mineral resources. A total of 388,559,056 debentures were issued with a par value of R$0.01 (one cent of Brazilian Real) and are inflation-indexed to the General Market Price Index (“IGP-M”), as set forth in the Issue Deed. The Company paid as remuneration the amount of US$135 and US$84, respectively, for the year ended December 31, 2017 and 2016.
14. Non-current assets and liabilities held for sale and discontinued operations December 31, 2017 December 31, 2016
Fertilizers Fertilizers Nacala Shipping assets Total
Assets Accounts receivable 90 86 6 - 92 Inventories 460 387 2 - 389 Other current assets 110 107 114 - 221 Investments in associates and joint ventures 83 90 - - 90 Property, plant and equipment and Intangible 2,149 2,694 4,064 357 7,115 Other non-current assets 695 679 3 - 682
Total assets 3,587 4,043 4,189 357 8,589
Liabilities Suppliers and contractors 324 280 41 - 321 Other current liabilities 215 192 13 - 205 Other non-current liabilities 640 559 5 - 564
Total liabilities 1,179 1,031 59 - 1,090
Net non-current assets held for sale 2,408 3,012 4,130 357 7,499
a) Fertilizers (Discontinued operations) In December 2016, the Company entered into an agreement with The Mosaic Company (“Mosaic”) to sell (i) the phosphate assets located in Brazil, except for the assets located in Cubatão, Brazil; (ii) the control of Compañia Minera Miski Mayo S.A.C., in Peru; (iii) the potassium assets located in Brazil; and (iv) the potash projects in Canada. Originally, the agreed amount was US$2,500, of which US$1,250 would be paid in cash and the remaining consideration would be settled with 42.3 million common shares to be issued by Mosaic. In January 2018 (subsequent event), the Company and Mosaic concluded the transaction, which was preceded by final adjustments agreed by the parties under the original terms and conditions of the negotiation. As consequence of these adjustments, the consideration has changed and the Company received US$1,080 in cash and 34.2 million common shares, corresponding to 8.9% of Mosaic's equity after the issuance of these shares (US$877, based on the Mosaic’s quotation at closing date of the transaction). Fertilizer’s net assets were adjusted to reflect fair value less cost to sell and a loss of US$729 (US$1,738 in 2016) was recognized in the income statement from discontinued operations.
27
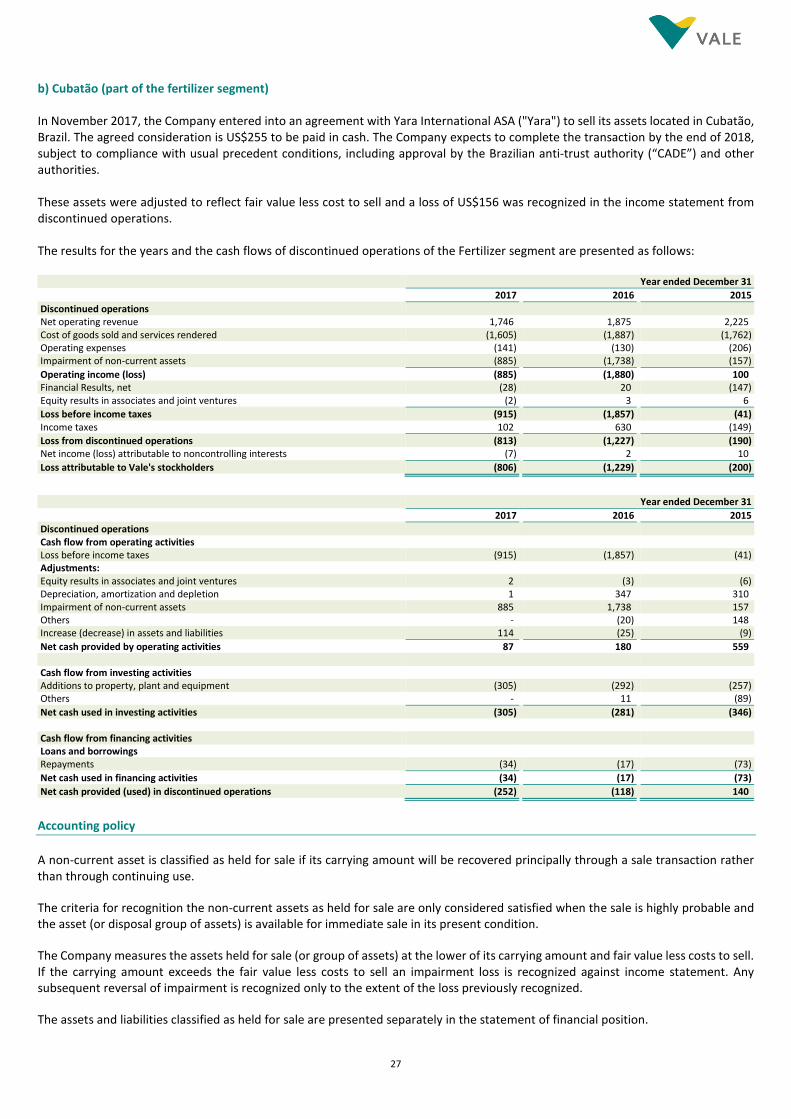
b) Cubatão (part of the fertilizer segment) In November 2017, the Company entered into an agreement with Yara International ASA ("Yara") to sell its assets located in Cubatão, Brazil. The agreed consideration is US$255 to be paid in cash. The Company expects to complete the transaction by the end of 2018, subject to compliance with usual precedent conditions, including approval by the Brazilian anti-trust authority (“CADE”) and other authorities. These assets were adjusted to reflect fair value less cost to sell and a loss of US$156 was recognized in the income statement from discontinued operations. The results for the years and the cash flows of discontinued operations of the Fertilizer segment are presented as follows: Year ended December 31
2017 2016 2015
Discontinued operations Net operating revenue 1,746 1,875 2,225 Cost of goods sold and services rendered (1,605) (1,887) (1,762) Operating expenses (141) (130) (206) Impairment of non-current assets (885) (1,738) (157)
Operating income (loss) (885) (1,880) 100 Financial Results, net (28) 20 (147) Equity results in associates and joint ventures (2) 3 6
Loss before income taxes (915) (1,857) (41) Income taxes 102 630 (149)
Loss from discontinued operations (813) (1,227) (190) Net income (loss) attributable to noncontrolling interests (7) 2 10
Loss attributable to Vale's stockholders (806) (1,229) (200)
Year ended December 31
2017 2016 2015
Discontinued operations Cash flow from operating activities Loss before income taxes (915) (1,857) (41) Adjustments: Equity results in associates and joint ventures 2 (3) (6) Depreciation, amortization and depletion 1 347 310 Impairment of non-current assets 885 1,738 157 Others - (20) 148 Increase (decrease) in assets and liabilities 114 (25) (9)
Net cash provided by operating activities 87 180 559 Cash flow from investing activities Additions to property, plant and equipment (305) (292) (257) Others - 11 (89)
Net cash used in investing activities (305) (281) (346) Cash flow from financing activities Loans and borrowings Repayments (34) (17) (73)
Net cash used in financing activities (34) (17) (73)
Net cash provided (used) in discontinued operations (252) (118) 140
Accounting policy
A non-current asset is classified as held for sale if its carrying amount will be recovered principally through a sale transaction rather than through continuing use.
The criteria for recognition the non-current assets as held for sale are only considered satisfied when the sale is highly probable and the asset (or disposal group of assets) is available for immediate sale in its present condition.
The Company measures the assets held for sale (or group of assets) at the lower of its carrying amount and fair value less costs to sell. If the carrying amount exceeds the fair value less costs to sell an impairment loss is recognized against income statement. Any subsequent reversal of impairment is recognized only to the extent of the loss previously recognized.
The assets and liabilities classified as held for sale are presented separately in the statement of financial position.

28
The classification as a discontinued operation occurs through disposal, or when the operation meets the criteria to be classified as held for sale if this occurs earlier. A discontinued operation is a component of a Company business comprising cash flows and operations that may be clearly distinct from the rest of the Company and that represents an important separate line of business or geographical area of operations.
The result of discontinued operations is presented in a single amount in the income statement, including the results after income tax of these operations less any impairment loss. Cash flows attributable to operating, investing and financing activities of discontinued operations are disclosed in a separate note.
When an operation is classified as a discontinued operation, the income statements of the prior periods are restated as if the operation had been discontinued since the beginning of the comparative period.
Any noncontrolling interest relating to a group disposal held for sale is presented in the stockholders’ equity and are not reclassified in the statement of financial position.
15. Investments in associates and joint ventures The material non-consolidated entities of the Company are as follows:
Location Main activity/Business % Ownership % Voting capital % Noncontrolling
interest
Joint ventures Aliança Geração de Energia S.A. Brazil Energy 55.0% 55.0% 45.0% Companhia Coreano-Brasileira de Pelotização Brazil Pellets 50.0% 50.0% 50.0% Companhia Hispano-Brasileira de Pelotização Brazil Pellets 50.9% 51.0% 49.1% Companhia Ítalo-Brasileira de Pelotização Brazil Pellets 50.9% 51.0% 49.1% Companhia Nipo-Brasileira de Pelotização Brazil Pellets 51.0% 51.1% 49.0% Companhia Siderúrgica do Pecém ("CSP") Brazil Steel 50.0% 50.0% 50.0% MRS Logística S.A. Brazil Logistics 48.2% 46.8% 51.8% Nacala Corridor Holding Netherlands B.V. Netherlands Coal 50.0% 50.0% 50.0% Samarco Mineração S.A. Brazil Pellets 50.0% 50.0% 50.0% Direct and indirect associates Henan Longyu Energy Resources Co., Ltd. China Coal 25.0% 25.0% 75.0% VLI S.A. Brazil Logistics 37.6% 37.6% 62.4%
a) Changes during the year Changes in investments in associates and joint ventures as follows:
2017 2016
Associates Joint ventures Total Associates Joint ventures Total
Balance at January 1st, 1,437 2,259 3,696 1,323 1,617 2,940
Additions (i) 1 92 93 1 238 239 Disposals - - - (7) - (7) Translation adjustment (2) (28) (30) 175 338 513 Equity results in income statement 57 41 98 69 240 309 Equity results from discontinued operations - - - 3 - 3 Equity results in statement of comprehensive income - (152) (152) - - - Dividends declared (ii) (57) (226) (283) (37) (165) (202) Transfer to held for sale - - - (90) - (90) Others 5 141 146 - (9) (9)
Balance at December 31, 1,441 2,127 3,568 1,437 2,259 3,696
(i) Refers to the Coal and Other segments in the amounts of US$75 and US$18, respectively, on December 31, 2017 and US$187 and US$52, respectively, on December 31, 2016. (ii) In 2017, the Company received dividends in the amount of US$227, of which US$179 were declared during 2017.
The investments by segments are presented in note 3(b).

29
b) Acquisitions and divestiture 2017 Nacala Logistic Corridor - In December 2014 and as amended in November 2016, the Company signed an agreement with Mitsui & Co., Ltd. (“Mitsui”) to transfer 50% of its stake of 66.7% in Nacala Logistic Corridor, which comprises entities that holds railroads and port concessions located in Mozambique and Malawi. Also, Mitsui committed to acquire 15% participation in the holding entity of Vale Moçambique, which holds the Moatize Coal Project. In March 2017, the transaction was concluded and Vale received a consideration of US$690. After the completion of the transaction, the Company (i) holds 81% of Vale Moçambique and retains the control of the Moatize Coal Project and (ii) shares control of the Nacala Logistic Corridor structure (Nacala BV), with Mitsui. As a consequence of sharing control of Nacala BV, the Company: (i) derecognized the assets and liabilities classified as held for sale in the total amount of US$4,144, from which US$4,063 refers to property, plant and equipment and intangibles; (ii) derecognized US$14 related to cash and cash equivalents; (iii) recognized a gain of US$447 in the income statement related to the sale and the re-measurement at fair value, of its remaining interest at Nacala BV based on the consideration received; (iv) reclassified the gain related to the cumulative translation adjustments on to income statements in the amount of US$11; The result of the transaction regarding the assets from Nacala’s logistic corridor was recognized in the income statement as “Impairment and other results on non-current assets”. The results of the transaction with the coal holding entity was recognized in “Results from operation with noncontrolling interest” in the amount of US$105, directly in Stockholders’ Equity. The consideration received was recognized in the statement of cash flows in “Proceeds from disposal of assets and investments” in the amount of US$435 and “Transactions with noncontrolling stockholders” in the amount of US$255. After the conclusion of the transaction, Vale has outstanding loan balances with Nacala BV and Pangea Emirates Ltd due to the deconsolidation of Nacala Logistic Corridor, the balances as at December 31, 2017 are disclosed in note 30. In November 2017, Nacala B.V. signed financing contracts in the form of a project finance in order to receive US$2.7 billion contracted that will be used to settle a portion of the loan with the Company. The receipt of the proceeds is subject to precedent conditions for a project finance. 2016 Thyssenkrupp Companhia Siderúrgica do Atlântico Ltd (“CSA”) – In April 2016, the Company sold 100% of its interest at CSA (26.87%) for a non-significant amount. The transaction resulted in a loss of US$75 due to recycling the “Cumulative translation adjustments” recognized in the income statement as “Impairment and others results in associates and joint ventures”. 2015 Energy generation assets - In December 2013, the Company signed agreements with CEMIG Geração e Transmissão S.A. (“CEMIG GT”) to incorporate two joint ventures, Aliança Norte Participações S.A. and Aliança Geração de Energia S.A and exchange of assets and shares. The transaction was completed in the first quarter of 2015, in which Vale received cash proceeds of US$97 and recognized a gain of US$18 as “Impairment and others results in associates and joint ventures” and a gain of US$193 as “Impairment and others results of non-current assets”. Shandong Yankuang International Coking Co., Ltd. (“Yankuang”) - In 2015, the Company completed the sale 100% of its interest at Yankuang, a producer of coking coal, methanol and other products. In this transaction, Vale recognized a gain of US$79 as “Impairment and others results in associates and joint ventures”.

30
Investments in associates and joint ventures (continued) Investments in associates and joint ventures Equity results in the income statement Dividends received
Year ended December 31 Year ended December 31
Associates and joint ventures % ownership % voting capital December 31, 2017 December 31, 2016 2017 2016 2015 2017 2016 2015
Ferrous minerals Baovale Mineração S.A. 50.00 50.00 26 26 7 9 - 1 - - Companhia Coreano-Brasileira de Pelotização 50.00 50.00 89 68 50 17 25 19 26 19 Companhia Hispano-Brasileira de Pelotização 50.89 51.00 82 59 41 15 14 16 27 16 Companhia Ítalo-Brasileira de Pelotização 50.90 51.00 80 69 40 16 21 17 9 14 Companhia Nipo-Brasileira de Pelotização 51.00 51.11 137 108 93 29 46 29 41 30 MRS Logística S.A. 48.16 46.75 517 488 69 57 43 29 10 22 Samarco Mineração S.A. 50.00 50.00 - - - - (167) - - 146 VLI S.A. 37.60 37.60 968 969 29 36 46 19 - 8 Zhuhai YPM Pellet Co. 25.00 25.00 23 21 - - - - - - Others - - - - (2) - - -
1,922 1,808 329 179 26 130 113 255 Coal Henan Longyu Energy Resources Co., Ltd. 25.00 25.00 317 285 20 (4) (3) - - 28
317 285 20 (4) (3) - - 28 Base metals Korea Nickel Corp. 25.00 25.00 13 12 1 (1) (3) - 4 - Teal Minerals Inc. 50.00 50.00 - - - (3) (129) - - -
13 12 1 (4) (132) - 4 - Others Aliança Geração de Energia S.A. 55.00 55.00 571 582 27 46 50 29 39 30 Aliança Norte Energia Participações S.A. 51.00 51.00 160 148 (2) (6) 1 - - - California Steel Industries, Inc. 50.00 50.00 200 185 42 33 (27) 27 4 - Companhia Siderúrgica do Pecém 50.00 50.00 262 527 (264) 25 (307) - - - Mineração Rio Grande do Norte S.A. 40.00 40.00 101 129 13 48 40 41 32 3 Thyssenkrupp Companhia Siderúrgica do Atlântico Ltd. - - - - - - (80) - - - Others 22 20 (68) (8) (13) - 1 2
1,316 1,591 (252) 138 (336) 97 76 35
Total 3,568 3,696 98 309 (445) 227 193 318

31
c) Summarized financial information The summarized financial information about relevant associates and joint-ventures for the Company are as follows: December 31, 2017
Joint ventures Associates
Aliança Geração de Energia CSP Pelletizing (i) MRS Logística Henan Longyu VLI S.A.
Current assets 137 759 760 309 1,072 738 Non-current assets 1,200 3,712 310 2,063 422 4,170
Total assets 1,337 4,471 1,070 2,372 1,494 4,908
Current liabilities 86 1,060 301 454 226 537 Non-current liabilities 213 2,887 5 844 - 1,799
Total liabilities 299 3,947 306 1,298 226 2,336
Stockholders'equity 1,038 524 764 1,074 1,268 2,574
Net income (loss) 49 (528) 442 143 79 77
December 31, 2016
Joint ventures Associates
Aliança Geração de Energia CSP Pelletizing (i) MRS Logística Henan Longyu VLI S.A.
Current assets 115 743 392 233 903 389 Non-current assets 1,208 3,809 318 2,091 456 4,169
Total assets 1,323 4,552 710 2,324 1,359 4,558
Current liabilities 165 664 109 433 200 677 Non-current liabilities 100 2,835 3 877 19 1,304
Total liabilities 265 3,499 112 1,310 219 1,981
Stockholders'equity 1,058 1,053 598 1,014 1,140 2,577
Net income (loss) 84 49 152 118 (17) 95
(i) Aggregate entity information: Companhia Coreano-Brasileira de Pelotização, Companhia Hispano-Brasileira de Pelotização, Companhia Ítalo-Brasileira de Pelotização, Companhia Nipo-Brasileira de Pelotização.
The stand-alone financial information may differ from the financial information reported herein, since they may be adjusted, when necessary to Vale’s accounting policies including eventual goodwill, provisional price adjustment, etc. Accounting policy
Joint arrangements investments - Joint arrangements are all entities over which the Company has shared control with one or more parties. Joint arrangement investments are classified as either joint operations or joint ventures depending on the contractual rights and obligations of each investor.
The joint operations are recorded in the financial statements to represent the Company's contractual rights and obligations. The Company does not have material joint operations.
Interests in joint ventures are accounted for using the equity method, after initially being recognized at cost. The Company's investment in joint ventures includes the goodwill identified in the acquisition, net of any accumulated impairment loss.
The Company's interest in the profits or losses of its joint ventures is recognized in the income statement and participation in the changes in reserves is recognized in the Company's reserves. When the Company's interest in the losses of an associate or joint venture is equal to or greater than the carrying amount of the investment, including any other receivables, the Company does not recognize additional losses, unless it has incurred obligations or made payments on behalf of the joint venture.

32
Critical accounting estimates and judgments
Judgment is required in some circumstances to determine whether after considering all relevant factors, the Company has control, joint control or significant influence over an entity. Significant influence includes situations of collective control.
The Company holds the majority of the voting capital in five joint arrangements (Aliança Geração de Energia S.A., Aliança Norte Energia Participações S.A., Companhia Hispano-Brasileira de Pelotização, Companhia Ítalo-Brasileira de Pelotização and Companhia Nipo-Brasileira de Pelotização), but management have concluded that the Company does not have a sufficiently dominant voting interest to have the power to direct the activities of the entity. As a result, these entities are accounted under equity method due to shareholder’s agreements where relevant decisions are shared with other parties.
16. Noncontrolling interest a) Summarized financial information The summarized financial information, prior to the eliminations of the intercompany balances and transactions, about subsidiaries with material noncontrolling interest are as follows: December 31, 2017
MBR PTVI VNC
Vale Moçambique S.A.
Compañia Mineradora Miski Mayo S.A.C. (i) Others (ii) Total
Current assets 408 394 251 381 78 - Non-current assets 3,041 1,586 2,046 1,653 436 - Related parties - Stockholders 591 147 115 253 6 -
Total assets 4,040 2,127 2,412 2,287 520 - Current liabilities 170 128 142 128 36 - Non-current liabilities 288 237 202 32 97 - Related parties - Stockholders 226 3 1,318 8,232 9 -
Total liabilities 684 368 1,682 8,392 142 - Stockholders' equity 3,356 1,759 730 (6,105) 380 -
Equity attributable to noncontrolling interests 1,342 735 37 (1,101) 228 73 1,314
Net income (loss) 434 (15) (572) (659) (11) -
Net income (loss) attributable to noncontrolling interests 174 (6) (28) (104) (6) (16) 14
Dividends paid to noncontrolling interests 113 - - - - 13 - (i) Discontinued operations (ii)Dividends paid to noncontrolling interests relates to Vale Oman Pelletizing

33
December 31, 2016
MBR PTVI VNC
Vale Moçambique S.A.
Compañia Mineradora Miski Mayo S.A.C. (i) Others Total
Current assets 32 444 383 386 94 - Non-current assets 3,182 1,668 2,101 1,796 429 - Related parties - Stockholders 551 132 79 358 13 -
Total assets 3,765 2,244 2,563 2,540 536 - Current liabilities 106 139 124 95 35 - Non-current liabilities 198 261 177 29 99 - Related parties - Stockholders 37 6 1,055 7,861 11 -
Total liabilities 341 406 1,356 7,985 145 - Stockholders' equity 3,424 1,838 1,207 (5,445) 391 -
Equity attributable to noncontrolling interests 1,406 741 40 (272) 235 (168) 1,982
Net income (loss) 400 2 (807) (541) 3 - -
Net income (loss) attributable to noncontrolling interests 165 1 (40) (27) 2 (107) (6)
Dividends paid to noncontrolling interests 262 - - - 28 - -
December 31, 2015
MBR PTVI VNC
Vale Moçambique S.A.
Compañia Mineradora Miski Mayo S.A.C. (i) Others Total
Net income (loss) 250 36 (1,916) (3,766) 16 - -
Net income (loss) attributable to noncontrolling interests 66 15 (373) (188) 10 (21) (491)
Dividends paid to noncontrolling interests - - - - 40 - -
(i) Discontinued operation The stand-alone financial information may differ from the financial information reported herein, since they may be adjusted, when necessary to Vale’s accounting policies including eventual goodwill, provisional price adjustment, etc. b) Acquisitions and divestments In March 2017, the Company concluded the transaction with Mitsui to sell 15% of its stake in Vale Moçambique and 50% of its stake in the Nacala Logistics Corridor. After the completion of the transaction, the Company holds 81% of Vale Moçambique and shares control of the Nacala Logistic Corridor with Mitsui. Further details are disclosed in note 15.

34
17. Intangibles Changes in intangibles are as follows:
Goodwill Concessions Right of use Software Total
Balance at December 31, 2015 2,956 1,814 207 347 5,324
Additions - 1,100 1 13 1,114 Disposals - (12) - - (12) Amortization - (248) (2) (153) (403) Impairment of discontinued operations (note 14) (30) - - - (30) Translation adjustment 188 570 9 61 828 Transfers - 77 (68) 74 83 Effect of discontinued operations Transfer to net assets held for sale (33) - - - (33)
Balance at December 31, 2016 3,081 3,301 147 342 6,871
Cost 3,081 4,467 222 1,570 9,340 Accumulated amortization - (1,166) (75) (1,228) (2,469)
Balance at December 31, 2016 3,081 3,301 147 342 6,871
Additions - 980 - 26 1,006 Disposals - (9) - - (9) Amortization - (209) (2) (142) (353) Translation adjustment 65 (79) 7 3 (4) Merger of Valepar (note 29) 964 - - - 964 Transfers - 18 - - 18
Balance at December 31, 2017 4,110 4,002 152 229 8,493
Cost 4,110 5,075 241 1,554 10,980 Accumulated amortization - (1,073) (89) (1,325) (2,487)
Balance at December 31, 2017 4,110 4,002 152 229 8,493
a) Goodwill - The goodwill arose from the acquisition of iron ore and nickel businesses. In 2017, the goodwill was recognized on the acquisition of Vale controlling interest by Valepar, based on the expected future returns on the ferrous segment. As the fundamentals are still valid on the date of the merger of Valepar by Vale, the goodwill was fully recognized. The Company has not recognized the deferred taxes over the goodwill, since there are no differences between the tax basis and accounting basis. The Company assess periodically the recoverable amount of the goodwill. b) Concessions - The concessions refer to the agreements with governments for the exploration and the development of ports and railways. The Company holds railway concessions which are valid over a certain period of time. Those assets are classified as intangible assets and amortized over the shorter of their useful lives and the concession term at the end of which they will be returned to the government. c) Right of use - Refers to intangible identified in the business combination of Vale Canada Limited (“Vale Canada”) and to the usufruct
contract between the Company and noncontrolling stockholders to use the shares of Empreendimentos Brasileiros de Mineração S.A.
(owner of Minerações Brasileiras Reunidas S.A. shares). The amortization of the right of use will expire in 2037 and Vale Canada's
intangible will end in September of 2046.
Accounting policy
Intangibles are carried at the acquisition cost, net of accumulated amortization and impairment charges. The estimated useful lives are as follows: Useful life
Concessions 3 to 50 years Right of use 22 to 31 years Software 5 years

35
18. Property, plant and equipment Changes in property, plant and equipment are as follows:
Land Building Facilities Equipment Mineral
properties Others Constructions
in progress Total
Balance at December 31, 2015 766 9,101 8,292 7,307 10,304 7,206 11,126 54,102
Additions (i) - - - - - - 5,240 5,240 Disposals (1) (8) (9) (19) (125) (384) (20) (566) Assets retirement obligation - - - - 311 - - 311 Depreciation, amortization and depletion - (517) (705) (906) (795) (631) - (3,554) Transfers to non-current assets held for sale - - - - - (497) - (497) Impairment (note 19) (1) (448) (175) (110) (165) (88) 70 (917) Impairment of discontinued operations (note 14) (53) - (65) - (1,590) - - (1,708) Translation adjustment 111 702 960 639 748 861 1,731 5,752 Transfers 26 2,177 1,253 978 230 1,110 (5,857) (83) Effect of discontinued operations Transfer to net assets held for sale (124) (333) (80) (1,095) (538) (62) (429) (2,661)
Balance at December 31, 2016 724 10,674 9,471 6,794 8,380 7,515 11,861 55,419
Cost 724 16,678 15,664 11,953 16,066 11,319 11,861 84,265 Accumulated depreciation - (6,004) (6,193) (5,159) (7,686) (3,804) - (28,846)
Balance at December 31, 2016 724 10,674 9,471 6,794 8,380 7,515 11,861 55,419
Additions (i) - - - - - - 3,392 3,392 Disposals - (11) (57) (67) (138) (212) (151) (636) Assets retirement obligation - - - - 425 - - 425 Depreciation, amortization and depletion - (587) (736) (814) (618) (754) - (3,509) Impairment (note 19) (20) - - (34) (131) - (86) (271) Translation adjustment 79 (122) (105) (83) 222 47 38 76 Transfers (65) 2,146 3,213 1,097 929 1,597 (8,935) (18)
Balance at December 31, 2017 718 12,100 11,786 6,893 9,069 8,193 6,119 54,878
Cost 718 19,163 18,292 12,840 17,471 12,461 6,119 87,064 Accumulated depreciation - (7,063) (6,506) (5,947) (8,402) (4,268) - (32,186)
Balance at December 31, 2017 718 12,100 11,786 6,893 9,069 8,193 6,119 54,878
(i) Includes capitalized borrowing costs. a) Disposals of assets In June 2016, Vale approved a plan to dispose of its fleet of eleven ships. As consequence, these assets were reclassified to non-current assets held for sale and a loss of US$66 was recognized in the income statement as “Impairment and other results on non-current assets”. In the year ended December 31, 2016, the Company concluded the sale of three Very Large Ore Carriers (“VLOC’s”) and four Capesize vessels for US$409. In the year ended December 31, 2017, the Company concluded the sale of four VLOC’s and two Floating Transfer Stations in the amount of US$391. The Company recognized a loss of US$133 in the income statement as “Impairment and other results on non-current assets”. Additionally, in 2017, the Company recognized a loss of US$348 in the income statement as "Impairment and other results on non-current assets" due to non-viable projects and operating assets written off through sale or obsolescence. Accounting policy
Property, plant and equipment is recorded at the cost of acquisition or construction, net of accumulated depreciation and impairment charges. Mineral properties developed internally are determined by (i) direct and indirect costs attributed to build the mining facilities, (ii) financial charges incurred during the construction period, (iii) depreciation of other fixed assets used during construction, (iv) estimated decommissioning and site restoration expenses, and (v) other capitalized expenditures during the development phase (phase when the project demonstrates its economic benefit to the Company, and the Company has ability and intention to complete the project). The depletion of mineral properties is determined based on the ratio between production and total proven and probable mineral reserves.

36
Property, plant and equipment, other than mineral properties are depreciated using the straight-line method based on the estimated useful lives, from the date on which the assets become available for their intended use and are capitalized, except for land which is not depreciated. The estimated useful lives are as follows: Useful life
Buildings 15 to 50 years Facilities 3 to 50 years Equipment 3 to 40 years Others: Locomotives 12 to 25 years Wagon 30 to 44 years Railway equipment 5 to 33 years Ships 20 years Others 2 to 50 years
The residual values and useful lives of assets are reviewed at the end of each reporting period and adjusted if necessary. a) Mineral reserves Critical accounting estimates and judgments
The estimates of proven and probable reserves are regularly evaluated and updated. These reserves are determined using generally accepted geological estimates. The calculation of reserves requires the Company to make assumptions about expected future conditions that are uncertain, including future ore prices, exchange rates, inflation rates, mining technology, availability of permits and production costs. Changes in assumptions could have a significant impact on the proven and probable reserves of the Company. The estimated volume of mineral reserves is used as basis for the calculation of depletion of the mineral properties, and also for the estimated useful life which is a major factor to quantify the provision for asset retirement obligation, environmental recovery of mines and impairment of long lived asset. Any changes to the estimates of the volume of mine reserves and the useful lives of assets may have a significant impact on the depreciation, depletion and amortization charges and assessments of impairment.
b) Expenditures and stripping costs (i) Exploration and evaluation expenditures - Expenditures on mining research are accounted for as operating expenses until the effective proof of economic feasibility and commercial viability of a given field can be demonstrated. From then on, the expenditures incurred are capitalized as mineral properties. (ii) Expenditures on feasibility studies, new technologies and others research - The Company also conducts feasibility studies for many businesses which it operates including researching new technologies to optimize the mining process. After these costs are proven to generate future benefits to the Company, the expenditures incurred are capitalized. (iii) Maintenance costs - Significant industrial maintenance costs, including spare parts, assembly services, and others, are recorded in property, plant and equipment and depreciated through the next programmed maintenance overhaul. (iv) Stripping Costs - The cost associated with the removal of overburden and other waste materials (“stripping costs”) incurred during the development of mines, before production takes place, are capitalized as part of the depreciable cost of the mineral properties. These costs are subsequently amortized over the useful life of the mine. Post-production stripping costs are included in the cost of inventory, except when a new project is developed to permit access to a significant ore deposits. In such cases, the cost is capitalized as a non-current asset and is amortized during the extraction of the ore deposits, over the useful life of the ore deposits. Stripping costs are measured at fixed and variable costs directly and indirectly attributable to its removal and, when applicable, net of any impairment losses measured in the same basis adopted for the cash generating unit of which it belongs.

37
19. Impairment and onerous contracts The impairment losses (reversals) recognized in the year are presented below: Income statement
Impairment (reversals)
Segments by class of assets Assets or cash-generating unit 2017 2016 2015
Property, plant and equipment and intangible Iron ore North system - (160) 55 Coal Australia - 27 635 Base metals – nickel Stobie 133 - - Base metals – nickel Newfoundland (VNL) - 631 3,460 Base metals – nickel Nouvelle Caledonie (VNC) - 284 1,462 Base metals – nickel Onça Puma - - (252) Coal Mozambique - - 2,403 Iron ore Midwest system - - 522 Several segments Other assets 138 135 127
Impairment of non-current assets 271 917 8,412 Onerous contracts - 257 357
Impairment of non-current assets and onerous contracts 271 1,174 8,769
Investments in associates and joint ventures Iron ore Samarco Mineração S.A. - - 132 Base metals - Copper Teal Minerals Inc. - 314
Impairment of investments in associates and joint ventures - - 446
a) Impairment of non-financial assets The Company has carried out an impairment test for the assets that a triggering event was identified. The recoverable amount is assessed by reference to the higher of value in use (“VIU”) and fair value less costs of disposal (“FVLCD”). The recoverable amount of each Cash Generating Units (“CGU”) under the impairment testing was assessed using FVLCD model, through discounted cash flow techniques, which is classified as “level 3” in the fair value hierarchy. The cash flows were discounted using a post-tax discount rate ranging from 6% to 9%, which represents an estimate of the rate that a market participant would apply having regard to the time value of money and the risks specific to the asset. The Company used its weighted average cost of capital (“WACC”) as a starting point for determining the discount rates, with appropriate adjustments for the risk profile of the countries in which the individual CGU operate. Iron ore and pellets - During 2017, the Company did not identify any changes in the circumstances or indicators that would require reassessment of the carrying amount of the iron ore and pellets CGUs. Of the total goodwill (note 17), US$2,157 is allocated to the group of ferrous mineral CGUs. The impairment analysis based on FVLCD model demonstrates that there were no impairment loss in relation to the individual CGUs or goodwill. In 2016, based on the market circumstances, the Company decided to resume Norte ́s system pelletizing plant, based on the studies carried out by management that demonstrates its economic feasibility. Accordingly, the Company reversed the full impairments of US$160 recorded in 2013 and 2015. In 2015, the Company recognized an impairment loss of US$522 due to lack of competitiveness in the Midwest system because of the complex logistic system associated with the decline in iron ore prices. Accordingly, long-lived assets were fully impaired. Coal - Based on the 2017 impairment triggering assessment, the Company has identified trigger of impairment in the Mozambique CGU, driven by a reduction in the proven and probable reserves due to a geological revision undertaken by Management in the last quarter of 2017. However, coal price projections have increased, triggering a discussion around impairment reversal review. The Company carried out an impairment test based on FVLCD model and concluded that there were no changes in the impairment previously recognized. In 2016, the future mining plans of the coal assets in Australia were revised and an impairment loss of US$27 was recognized in the income statement (US$635 in 2015).

38
In 2015, due to a reduction in the estimated future coal prices, at that point in time, associated with an increase in the logistics costs, the Company recognized an impairment loss of US$2,403 in relation to the coal asset in Mozambique. Nickel - Based on the 2017 impairment trigger assessment, the Company has identified impairment indicators in the nickel CGUs, driven by a decrease in the nickel long-term price projections. The Company carried out an impairment test based on FVLCD model and concluded that there were no changes in the impairment previously recognized. Except for an underground mine in Sudbury that was affected by seismic activities and the cost to repair the asset is deemed not recoverable in the current market conditions. Therefore, the Company has placed this asset on “care and maintenance” and an impairment of US$133 was recognized in the income statement. Of the total goodwill (note 17), US$1,953 is allocated to the group of nickel CGUs. The impairment analysis based on FVLCD model demonstrates that there were no impairment loss in relation to the individual CGUs or goodwill. In 2016, the decrease in long term nickel price projections, that significantly reduced the recoverable amounts of the VNL and VNC CGUs, associated with significant capital investments in new processing facilities in recent years, resulted in impairment losses of US$631 and US$284 (2015 - US$3,460 and US$1,462), respectively. b) Onerous contract
In 2016, the Company recognized a provision of US$257 (US$357 in 2015) for the costs in respect of certain long-term contracts in
the Midwest system for fluvial transportation and port structure, with minimum guaranteed volume.
c) Impairment of investments in associates and joint ventures In 2015, the Company recognized an impairment of US$132 in its investment in Samarco (note 21) and US$314 in Teal Minerals Inc. (“Teal”).Teal recognized an impairment of property, plant and equipment due to the revision of future mining plans and the decrease of the copper price. Accounting policy
Impairment of non-Financial assets - Non-financial assets are reviewed for impairment whenever events or changes in circumstances indicate that the carrying amount might not be recoverable. An impairment loss is recognized for the amount by which the asset´s carrying value exceeds its recoverable amount. The recoverable amount is the higher of an asset’s fair value less costs of disposal (“FVLCD”) and value in use (”VIU”). FVLCD is generally determined as the present value of the estimated future cash flows expected to arise from the continued use of the asset from a market participant’s perspective, including any expansion prospects. VIU model is determined as the present value of the estimated future cash flows expected to arise from the continued use of the asset in its present form. Value in use is determined by applying assumptions specific to the Company’s continued use and cannot take into account future development. These assumptions are different to those used in calculating fair value and consequently the VIU calculation is likely to give a different result to a FVLCD calculation.
Assets that have indefinite useful life and are not subject to amortization, such as goodwill, are tested annually for impairment.
For the purposes of assessing impairment, assets are grouped at the lowest levels for which there are separately identifiable cash flows (Cash Generating Units (CGUs)). Goodwill is allocated to Cash Generating Units or Cash Generating Units groups that are expected to benefit from the business combinations in which the goodwill arose and are identified in accordance with the operating segment.
Non-current assets (excluding goodwill) in which the Company recognized impairment in the past are reviewed whenever events or changes in circumstances indicate that the impairment may no longer be applicable. In such cases, an impairment reversal will be recognized.
Onerous Contracts - For certain long-term contracts, a provision is recognized when the present value of the unavoidable cost to meet the Company’s obligation exceeds the economic benefits that could be received from those contracts.

39
Critical accounting estimates and judgments
The Company determines its cash flows based on the budgets approved by management, which require the use of the following assumptions: (i) mineral reserves and mineral resources measured by internal experts; (ii) costs and investments based on the best estimate of projects as supported by past performance; (iii) sale prices consistent with projections available in reports published by industry considering the market price when appropriate; (iv) the life of each cash-generating unit (ratio between production and mineral reserves); and (v) discount rates that reflect specific risks relating to the relevant assets in each cash-generating unit. These assumptions are subject to risk and uncertainty. Hence, there is a possibility that changes in circumstances will change these projections, which may affect the recoverable amount of the assets.
20. Loans, borrowings, cash and cash equivalents and financial investments a) Net debt The Company evaluates the net debt with the objective of ensuring the continuity of its business in the long term, being able to generate value to its stockholders, through the payment of dividends and capital gain. December 31, 2017 December 31, 2016
Debt contracts in the international markets 17,288 21,130 Debt contracts in Brazil 5,201 8,192
Total of loans and borrowings 22,489 29,322 (-) Cash and cash equivalents 4,328 4,262 (-) Financial investments 18 18
Net debt 18,143 25,042
b) Cash and cash equivalents Cash and cash equivalents includes cash, immediately redeemable deposits and short-term investments with an insignificant risk of change in value. They are readily convertible to cash, being US$1,790 denominated in R$, indexed to the Brazilian Interbank Interest rate (“DI Rate”or”CDI”), US$2,395 denominated in US$, mainly time deposits and US$143 denominated in other currencies. c) Loans and borrowings i) Total debt Current liabilities Non-current liabilities
December 31, 2017 December 31, 2016 December 31, 2017 December 31, 2016
Debt contracts in the international markets Floating rates in: US$ 310 234 2,764 5,489 EUR - - 240 211 Fixed rates in: US$ - - 12,588 13,083 EUR - - 900 1,583 Other currencies 17 17 206 209 Accrued charges 263 304 - -
590 555 16,698 20,575
Debt contracts in Brazil Floating rates in: R$, indexed to TJLP, TR, IPCA, IGP-M and CDI 447 402 3,195 5,621 Basket of currencies and US$ indexed to LIBOR 339 343 708 1,217 Fixed rates in: R$ 68 66 173 216 Accrued charges 259 294 12 33
1,113 1,105 4,088 7,087
1,703 1,660 20,786 27,662

40
The future flows of debt payments principal, per nature of funding and interest are as follows: Principal
Bank loans Capital markets Development agencies Total Estimated future
interest payments (i)
2018 161 - 1,020 1,181 1,245 2019 849 - 901 1,750 1,149 2020 983 831 761 2,575 1,090 2021 574 1,353 696 2,623 945 Between 2022 and 2025 503 3,529 950 4,982 2,727 2026 onwards 87 8,585 172 8,844 5,929
3,157 14,298 4,500 21,955 13,085
(i) Estimated future payments of interest, calculated based on interest rate curves and foreign exchange rates applicable as at December 31, 2017 and considering that all amortization payments and payments at maturity on loans and borrowings will be made on their contracted payments dates. The amount includes the estimated values of future interest payments (not yet accrued), in addition to interest already recognized in the financial statements.
At December 31, 2017, the average annual interest rates by currency are as follows: Loans and borrowings Average interest rate (i) Total debt
US$ 5.39% 16,940 R$ (ii) 8.14% 4,147 EUR (iii) 3.34% 1,177 Other currencies 3.23% 225
22,489
(i) In order to determine the average interest rate for debt contracts with floating rates, the Company used the rate applicable at December 31, 2017. (ii) R$ denominated debt that bears interest at IPCA, CDI, TR or TJLP, plus spread. For a total of US$2,329 the Company entered into derivative transactions to mitigate the exposure to the cash flow variations of the floating rate debt denominated in R$, resulting in an average cost of 1.89% per year in US$. (iii) Eurobonds, for which the Company entered into derivatives to mitigate the exposure to the cash flow variations of the debt denominated in EUR, resulting in an average cost of 4.29% per year in US$.
ii) Reconciliation of debt to cash flows arising from financing activities Cash flow Non-cash changes
December 31, 2016 Additions Repayments Interest paid Transferences
Effect of exchange rate
Interest accretion
December 31, 2017
Loans and borrowings Current 1,660 - (8,998) (1,686) 8,971 59 1,697 1,703 Non-current 27,662 1,976 - - (8,971) 119 - 20,786
Total 29,322 1,976 (8,998) (1,686) - 178 1,697 22,489
iii) Credit and financing lines Available amount
Type Contractual
currency Date of agreement Period of the
agreement Total amount December 31, 2017
Credit lines Revolving credit facilities US$ May 2015 5 years 3,000 3,000 Revolving credit facilities US$ June 2017 5 years 2,000 2,000 Financing lines BNDES - CLN 150 R$ September 2012 10 years 1,174 6 BNDES - S11D e S11D Logística R$ May 2014 10 years 1,863 307
In June 2017, the Company signed a US$2,000 revolving credit facility, which will be available for five years, to replace the US$2,000 line that was signed in 2013, which was cancelled. At December 31, 2017, the total available amount in revolving credit facilities remains at US$5,000. Liquidity risk - The revolving credit facilities available today were acquired from a syndicate of several global commercial banks. To mitigate such risk, Vale has a revolving credit facilities to assist the short term liquidity management and to enable more efficiency in cash management, being consistent with the strategic focus on cost of capital reduction.

41
iv) Funding In February 2017, the Company issued through Vale Overseas Limited guaranteed notes due August 2026 totaling US$1,000. The notes bears 6.250% coupon per year, payable semi-annually, and were sold at a price of 107.793% of the principal amount. The notes were consolidated with, and formed a single series with, Vale Overseas’s US$1,000 6.250% notes due 2026 issued on August, 2016. Vale applied the net proceeds from the offering to the early redemption of Vale’s €750 notes (due in March 2018). In September 2017, the Company redeemed all of its 5.625% guaranteed notes due 2019 issued through Vale Overseas Limited totaling US$1,000. Additionally, the Company conducted a Tender Offer for the outstanding 4.625% guaranteed notes due 2020 issued by its subsidiary Vale Overseas Limited. The total principal amount of 2020 Notes accepted for purchase pursuant to the Tender Offer was US$501 from a total of US$1,000. v) Guarantees As at December 31, 2017 and 2016, loans and borrowings are secured by property, plant and equipment and receivables in the amount of US$275 and US$472, respectively. The securities issued through Vale’s 100%-owned finance subsidiary Vale Overseas Limited are fully and unconditionally guaranteed by Vale.
vi) Covenants Some of the Company’s debt agreements with lenders contain financial covenants. The primary financial covenants in those agreements require maintaining certain ratios, such as debt to EBITDA and interest coverage. The Company has not identified any instances of noncompliance as at December 31, 2017 and 2016. Accounting policy
Loans and borrowings are initially measured at fair value, net of transaction costs incurred and are subsequently carried at amortized cost and updated using the effective interest rate method. Any difference between the proceeds (net of transaction costs) and the redemption value is recognized in the Income statement over the period of the loan, using the effective interest rate method. The fees paid in obtaining the loan are recognized as transaction costs. Loans and borrowing costs are capitalized as part of property, plants and equipment if those costs are directly related to a qualified asset. The capitalization occurs until the qualified asset is ready for its intended use. The average capitalization rate is 22%. Borrowing costs that are not capitalized are recognized in the income statement in the period in which they are incurred.
21. Liabilities related to associates and joint ventures In March 2016 Samarco and its shareholders, Vale S.A. and BHP Billiton Brasil Ltda. (“BHPB”), entered into an Agreement (“Framework Agreement”) with the Brazilian federal government, the two Brazilian states (Espírito Santo and Minas Gerais) and other governmental authorities, in connection with the lawsuit related to the Samarco dam failure (Note 27), in order to implement the programs for remediation and compensation of the areas and communities affected. The Framework Agreement has a 15-year term, renewable for successive one-year periods until all the obligations under the Framework Agreement have been satisfied. Under the Framework Agreement, Samarco, Vale S.A. and BHPB have established a foundation (“Fundação Renova” or “Foundation”) to develop and implement social and economic remediation and compensation, to be funded by Samarco. To the extent that Samarco does not meet its funding obligations to the foundation, each of Vale S.A. and BHPB will provide, under the terms of the Framework Agreement, funds to the Foundation in proportion to its 50% equity interest in Samarco. As the consequence of the dam failure, governmental authorities ordered the suspension of Samarco’s operations.

42
Due to the uncertainties regarding Samarco's future cash flow, Vale S.A. maintains a provision for the obligation to comply with the reparation and compensation programs under the Framework Agreement (pro rata to its proportional equity interest in Samarco). The movements in the provisions are as follows: 2017 2016
Balance at January 1st, 1,077 -
Additions / Provision recognized 38 1,163 Payments (294) (139) Interest accretion 182 72 Translation adjustment (7) (19)
Balance at December 31, 996 1,077 Current liabilities 326 292 Non-current liabilities 670 785
Liabilities 996 1,077
In addition to the provision above, Vale S.A. made available in the year ended December 31, 2017 the amount of US$142, which was fully used to fund Samarco’s working capital and was recognized in Vale´s income statement as “Impairment and other results in associates and joint ventures”. Vale S.A intends to make available until the first half of 2018 up to US$48 to Samarco to support its working capital requirements, without any binding obligation to Samarco in this regard. Such amounts will be released by the shareholders, simultaneously and pursuant to the same terms and conditions, subject to the fulfillment of certain milestones. The summarized financial information of Samarco are as follows: December 31, 2017 December 31, 2016
Current assets 66 164 Non-current assets 6,016 5,978
Total assets 6,082 6,142 Current liabilities 5,481 4,851 Non-current liabilities 3,636 3,415
Total liabilities 9,117 8,266 Negative reserves (3,035) (2,124)
Loss (930) (965)
Under Brazilian legislation and the terms of the joint venture agreement, Vale does not have an obligation to provide funding to Samarco. Therefore, Vale’s investment in Samarco was impaired in full and no provision was recognized in relation to the Samarco’s negative reserves. The contingencies related to the Samarco dam failure are disclosed in note 27. Critical accounting estimates and judgments
The provision requires the use of assumptions that may be mainly affected by: (i) changes in scope of work required under the Framework Agreement as result of further technical analysis and the ongoing negotiations with the Federal Prosecution Office, (ii) resolution of uncertainty in respect of the resumption of Samarco´s operations; (iii) updates in the discount rate; and (iv) resolution of existing and potential legal claims. As a result, future expenditures may differ from the amounts currently provided and changes to key assumptions could result in a material impact to the amount of the provision in future reporting periods. At each reporting period, Vale S.A. will reassess the key assumptions used by Samarco in the preparation of the projected cash flows and will adjust the provision, if required.

43
22. Financial instruments classification The Company classifies its financial instruments in accordance with the purpose for which they were acquired, and determines the classification and initial recognition according to the following categories: December 31, 2017 December 31, 2016
Financial assets
Loans and receivables or
amortized cost
At fair value through
profit or loss Total
Loans and receivables or
amortized cost
At fair value through
profit or loss Total
Current Cash and cash equivalents 4,328 - 4,328 4,262 - 4,262 Financial investments 18 - 18 18 - 18 Derivative financial instruments - 106 106 - 274 274 Accounts receivable 2,600 - 2,600 3,663 - 3,663 Related parties 1,898 - 1,898 - - -
8,844 106 8,950 7,943 274 8,217 Non-current Derivative financial instruments - 453 453 - 446 446 Loans 151 - 151 180 - 180 Related parties 2,628 - 2,628 - - -
2,779 453 3,232 180 446 626
Total of financial assets 11,623 559 12,182 8,123 720 8,843
Financial liabilities Current Suppliers and contractors 4,041 - 4,041 3,630 - 3,630 Derivative financial instruments - 104 104 - 414 414 Loans and borrowings 1,703 - 1,703 1,660 - 1,660 Related parties 270 - 270 353 - 353
6,014 104 6,118 5,643 414 6,057 Non-current Derivative financial instruments - 686 686 - 1,225 1,225 Loans and borrowings 20,786 - 20,786 27,662 - 27,662 Related parties 975 - 975 87 - 87 Participative stockholders' debentures - 1,233 1,233 - 775 775
21,761 1,919 23,680 27,749 2,000 29,749
Total of financial liabilities 27,775 2,023 29,798 33,392 2,414 35,806
The classification of financial assets and liabilities by currencies are as follows: December 31, 2017
Financial assets R$ US$ CAD EUR Others currencies Total
Current Cash and cash equivalents 1,790 2,395 48 11 84 4,328 Financial investments 1 17 - - - 18 Derivative financial instruments 60 46 - - - 106 Accounts receivable 246 2,334 6 14 2,600 Related parties - 1,898 - - - 1,898
2,097 6,690 54 11 98 8,950 Non-current Derivative financial instruments 384 69 - - - 453 Loans 5 146 - - - 151 Related parties - 2,628 - - - 2,628
389 2,843 - - - 3,232
Total of financial assets 2,486 9,533 54 11 98 12,182
Financial liabilities Current Suppliers and contractors 2,464 1,108 386 49 34 4,041 Derivative financial instruments 95 9 - - - 104 Loans and borrowings 768 880 18 37 - 1,703 Related parties - 270 - - - 270
3,327 2,267 404 86 34 6,118 Non-current Derivative financial instruments 638 48 - - - 686 Loans and borrowings 3,379 16,060 207 1,140 - 20,786 Related parties 78 897 - - - 975 Participative stockholders' debentures 1,233 - - - - 1,233
5,328 17,005 207 1,140 - 23,680
Total of financial liabilities 8,655 19,272 611 1,226 34 29,798

44
December 31, 2016
Financial assets R$ US$ CAD EUR Others currencies Total
Current Cash and cash equivalents 961 2,899 45 56 301 4,262 Financial investments 1 17 - - - 18 Derivative financial instruments 104 170 - - - 274 Accounts receivable 337 3,310 - 1 15 3,663
1,403 6,396 45 57 316 8,217 Non-current Derivative financial instruments 400 46 - - - 446 Loans 35 96 49 - - 180
435 142 49 - - 626
Total of financial assets 1,838 6,538 94 57 316 8,843
Financial liabilities Current Suppliers and contractors 1,897 948 612 96 77 3,630 Derivative financial instruments 317 97 - - - 414 Loans and borrowings 752 827 17 64 - 1,660 Related parties - 353 - - - 353
2,966 2,225 629 160 77 6,057 Non-current Derivative financial instruments 1,052 173 - - - 1,225 Loans and borrowings 5,869 19,790 209 1,794 - 27,662 Related parties 87 - - - - 87 Participative stockholders' debentures 775 - - - - 775
7,783 19,963 209 1,794 - 29,749
Total of financial liabilities 10,749 22,188 838 1,954 77 35,806
23. Fair value estimate Due to the short-term cycle, it is assumed that the fair value of cash and cash equivalents balances, financial investments, accounts receivable and accounts payable approximate their book values. For the measurement and determination of fair value, the Company uses various methods including market, income or cost approaches, in order to estimate the value that market participants would use when pricing the asset or liability. The financial assets and liabilities recorded at fair value are classified and disclosed in accordance with the following levels: Level 1 – Unadjusted quoted prices on an active, liquid and visible market for identical assets or liabilities that are accessible at the measurement date; Level 2 - Quoted prices (adjusted or unadjusted) for identical or similar assets or liabilities on active markets; and Level 3 - Assets and liabilities, for which quoted prices, do not exist, or where prices or valuation techniques are supported by little or no market activity, unobservable or illiquid. a) Assets and liabilities measured and recognized at fair value: December 31, 2017 December 31, 2016
Level 2 Level 3 Total Level 2 Level 3 Total
Financial assets Derivative financial instruments 289 270 559 405 315 720
Total 289 270 559 405 315 720
Financial liabilities Derivative financial instruments 581 209 790 1,190 449 1,639 Participative stockholders' debentures 1,233 - 1,233 775 - 775
Total 1,814 209 2,023 1,965 449 2,414
There were no transfers between Level 1 and Level 2, or between Level 2 and Level 3 in the year ended December 31, 2017.

45
The following table presents the changes in Level 3 assets and liabilities for the year ended December 31, 2017:
Derivative financial instruments
Financial assets Financial liabilities Balance at December 31, 2016 315 449 Gain recognized in income statement (45) (240) Balance at December 31, 2017 270 209
Methods and techniques of evaluation i) Derivative financial instruments Financial instruments are evaluated by calculating their present value through the use of instrument yield curves at the closing dates. The curves and prices used in the calculation for each group of instruments are detailed in the "market curves”. The pricing method used for European options is the Black & Scholes model. In this model, the fair value of the derivative is a function of the volatility in the price of the underlying asset, the exercise price of the option, the interest rate and period to maturity. In the case of options which income is a function of the average price of the underlying asset over the period of the option, the Company uses Turnbull & Wakeman model. In this model, in addition to the factors that influence the option price in the Black-Scholes model, the formation period of the average price is also considered. In the case of swaps, both the present value of the assets and liability are estimated by discounting the cash flow by the interest rate of the currency in which the swap is denominated. The difference between the present value of assets and liability of the swap generates its fair value. For the TJLP swaps, the calculation of the fair value assumes that TJLP is constant, that is the projections of future cash flow in Brazilian Reais are made on the basis of the last TJLP disclosed. Contracts for the purchase or sale of products, inputs and costs of selling with future settlement are priced using the forward yield curves for each product. Typically, these curves are obtained on the stock exchanges where the products are traded, such as the London Metals Exchange (“LME”), the Commodity Exchange (“COMEX”) or other providers of market prices. When there is no price for the desired maturity, Vale uses an interpolation between the available maturities. The fair value for derivatives are within level 3 are measured using discounted cash flows and option model valuation techniques with main unobservable inputs discount rates, stock prices and commodities prices. Participative stockholders’ debentures - Consist of the debentures issued during the privatization process (note 13), which fair values are measured based on the market approach. Reference prices are available on the secondary market. Critical accounting estimates and judgments
The fair values of financial instruments that are not traded in active markets are determined using valuation techniques. Vale uses its own judgment to choose between the various methods. Assumptions are based on the market conditions, at the end of the year. An analysis of the impact if actual results are different from management's estimates is present on note 33 (sensitivity analysis).
b) Fair value of financial instruments not measured at fair value The fair value estimate for level 1 is based on market approach considering the secondary market contracts. For loans allocated to level 2, the income approach is adopted and the fair value for both fixed-indexed rate debt and floating rate debt is determined on a discounted cash flows basis using LIBOR future values and Vale’s bonds curve. The fair values and carrying amounts of loans and borrowings (net of interest) are as follows: Financial liabilities Balance Fair value Level 1 Level 2
December 31, 2017 Debt principal 21,955 23,088 14,935 8,153
December 31, 2016 Debt principal 28,691 27,375 13,874 13,501

46
24. Derivative financial instruments a) Derivatives effects on statement of financial position Assets
December 31, 2017 December 31, 2016
Current Non-current Current Non-current
Derivatives not designated as hedge accounting Foreign exchange and interest rate risk CDI & TJLP vs. US$ fixed and floating rate swap 38 - 132 1 IPCA swap 9 82 7 61 Eurobonds swap - 27 - - Pré-dolar swap 22 32 1 23
69 141 140 85 Commodities price risk Nickel 22 3 4 2 Bunker oil 15 - 130 -
37 3 134 2 Others - 309 - 359
- 309 - 359
Total 106 453 274 446
Liabilities
December 31, 2017 December 31, 2016
Current Non-current Current Non-current
Derivatives not designated as hedge accounting Foreign exchange and interest rate risk CDI & TJLP vs. US$ fixed and floating rate swap 95 410 293 638 IPCA swap 41 20 57 Eurobonds swap 4 - 7 45 Euro Forward - - 46 - Pré-dolar swap 5 24 5 32
104 475 371 772
Commodities price risk Nickel - - 5 2
Bunker oil - - 38 -
- - 43 2 Others - 211 - 451
- 211 - 451
Total 104 686 414 1,225
b) Effects of derivatives on the income statement, cash flow and other comprehensive income
Year ended December 31
Gain (loss) recognized
in the income statement Financial settlement
inflows (outflows) Gain (loss) recognized
in other comprehensive income
2017 2016 2015 2017 2016 2015 2017 2016 2015
Derivatives not designated as hedge accounting Foreign exchange and interest rate risk CDI & TJLP vs. US$ fixed and floating rate swap 152 869 (1,172) (181) (513) (330) - - - IPCA swap 43 78 (61) (20) (25) 7 - - - Eurobonds swap 36 (19) (130) (39) (142) (13) - - - Euro forward 46 (46) - - - - - - - Pré-dolar swap 36 77 (139) (1) (90) (42) - - -
313 959 (1,502) (241) (770) (378) - - - Commodities price risk Nickel 30 (42) (49) 4 (30) (62) - - - Bunker oil (80) 268 (742) (3) (799) (270) - - -
(50) 226 (791) 1 (829) (332) - - - Others 191 74 (142) - - - - - -
Derivatives designated as cash flow hedge accounting Bunker oil - - (439) - - (450) - - 435 Foreign exchange - (3) (42) - (3) (42) - 2 17
- (3) (481) - (3) (492) - 2 452
Total 454 1,256 (2,916) (240) (1,602) (1,202) - 2 452

47
During 2015, the Company implemented bunker oil purchase cash flows protection program and recognized as cost of goods sold and services rendered and financial expense the amounts of US$439 and US$2,477, respectively. In 2016, all derivatives impacts were charged to financial results. The maturity dates of the derivative financial instruments are as follows: Last maturity dates
Currencies and interest rates January 2024 Bunker oil December 2017 Nickel December 2019 Others December 2027
c) Hedge in foreign operations Implementation of net investment hedge As at January 1, 2017, Vale S.A., which the functional currency is Reais, designated its debts in US$ and Euro, as an instrument in a hedge of its investment in foreign operations (Vale International S.A. and Vale International Holding GmbH; hedging objects) to mitigate part of the foreign exchange risk on financial statements. At December 31, 2017 the carrying value of the designated debts are US$5,303 and EUR750. The foreign exchange loss of US$144 (US$95, net of taxes), was recognized in the “Cumulative translation adjustments” in stockholders’ equity for the year ended December 31, 2017. This hedge was highly effective throughout the year ended on December 31, 2017.
Accounting policy
The Company uses financial instruments to hedge its exposure to certain market risks arising from operational, financing and investing activities. Derivatives are included within financial assets or liabilities at fair value through profit or loss unless they are designated as effective hedging instruments.
At the beginning of the hedge operations, the Company documents the type of hedge, the relationship between the hedging instrument and hedged items, its risk management objective and strategy for undertaking hedge operations. The Company also documents, both at hedge inception and on an ongoing basis that the hedge is expected to continue to be highly effective. The Company adopts the hedge accounting procedure and designates certain derivatives as either:
Cash flow hedge - The effective portion of changes in the fair value of derivatives that are designated and qualify as cash flow hedges is recognized in equity within "Cumulative translation adjustments". The gain or loss relating to the ineffective portion is recognized immediately in the income statement. When a hedging instrument expires or is sold, or when a hedge no longer meets the criteria for hedge accounting, any cumulative gain or loss existing in equity at that time remains in equity and is recognized in profit or loss when the transaction is recognized in the income statement.
Net investment hedge - Hedges of net investments in foreign operations are accounted for similarly to cash flow hedges. Any gain or loss on the hedging instrument relating to the effective portion of the hedge is recognized in equity within "Cumulative translation adjustments". The gain or loss relating to the ineffective portion is recognized immediately in the income statement. Gains and losses accumulated in equity are included in the statement of income when the foreign operation is partially or fully disposed of or sold.
Derivatives at fair value through profit or loss - Certain derivative instruments do not qualify for hedge accounting. Changes in the fair value of any of these derivative instruments are recognized immediately in the income statement. The Company has performed an assessment of the IFRS 9 - Financial instruments and the expected impacts are detailed in note 2e.

48
Additional information about derivatives financial instruments In millions of United States dollars, except as otherwise stated
The risk of the derivatives portfolio is measured using the delta-Normal parametric approach, and considers that the future distribution of the risk factors and its correlations tends to present the same statistic properties verified in the historical data. The value at risk estimate considers a 95% confidence level for a one-business day time horizon. There was no cash amount deposited as margin call regarding derivative positions on December 31, 2017. The following tables detail the derivatives positions for Vale and its controlled companies as of December 31, 2017, with the following information: notional amount, fair value including credit risk, gains or losses in the period, value at risk and the fair value breakdown by year of maturity. a) Foreign exchange and interest rates derivative positions (i) Protection programs for the R$ denominated debt instruments In order to reduce cash flow volatility, swap transactions were implemented to convert into US$ the cash flows from certain debt instruments denominated in R$ with interest rates linked mainly to CDI, TJLP and IPCA. In those swaps, Vale pays fixed or floating rates in US$ and receives payments in R$ linked to the interest rates of the protected debt instruments. The swap transactions were negotiated over-the-counter and the protected items are the cash flows from debt instruments linked to R$. These programs transform into US$ the obligations linked to R$ to achieve a currency offset in the Company’s cash flows, by matching its receivables - mainly linked to US$ - with its payables.
Financial Settlement
Inflows (Outflows) Value at Risk
Flow December 31, 2017 December 31, 2016 Index Average rate December 31, 2017 December 31, 2016 December 31, 2017 December 31, 2017 2018 2019 2020+
CDI vs. US$ fixed rate swap (33) (121) 13 15 27 (24) (37)
Receivable R$ 3,540 R$ 6,289 CDI 101.33%
Payable US$ 1,104 US$ 2,105 Fix 3.20%
TJLP vs. US$ fixed rate swap (380) (622) (191) 37 (80) (245) (56)
Receivable R$ 2,982 R$ 4,360 TJLP + 1.25%
Payable US$ 1,323 US$ 2,030 Fix 1.55%
TJLP vs. US$ floating rate swap (54) (55) (2) 3 (4) (50) -
Receivable R$ 216 R$ 242 TJLP + 0.88%
Payable US$ 123 US$ 140 Libor + -1.23%
R$ fixed rate vs. US$ fixed rate swap 25 (13) (1) 27 18 13 (6)
Receivable R$ 1,158 R$ 1,031 Fix 8.02%
Payable US$ 385 US$ 343 Fix -0.28%
IPCA vs. US$ fixed rate swap (35) (51) (0) 9 7 (15.5) (27)
Receivable R$ 1,000 R$ 1,000 IPCA + 6.55%
Payable US$ 434 US$ 434 Fix 3.98%
IPCA vs. CDI swap 85 42 (20) 0.4 2 (0) 83
Receivable R$ 1,350 R$ 1,350 IPCA + 6.62%
Payable R$ 1,350 R$ 1,350 CDI 98.58%
Fair value by yearNotional Fair value

49
(ii) Protection program for EUR denominated debt instruments
In order to reduce the cash flow volatility, swap and forward transactions were implemented to convert into US$ the cash flows from certain debt instruments issued in Euros by Vale. In those swaps, Vale receives fixed rates in EUR and pays fixed rates in US$. In those forwards only the principal amount of the debt is converted from EUR to US$. The swap and forward transactions were negotiated over-the-counter and the protected items are the cash flows from debt instruments linked to EUR. The financial settlement inflows/outflows are offset by the protected items’ losses/gains due to EUR/US$ exchange rate.
b) Commodities derivative positions (i) Bunker Oil purchase cash flows protection program In order to reduce the impact of bunker oil price fluctuation on maritime freight hiring/supply and, consequently, reducing the company’s cash flow volatility, bunker oil derivatives were implemented, through zero cost-collars. The derivative transactions were negotiated over-the-counter and the protected item is part of the Vale’s costs linked to bunker oil prices. The financial settlement inflows/outflows are offset by the protected items’ losses/gains due to bunker oil prices changes. The contracts expired in 2017.
As at December 31, 2016, excludes US$24, of transactions in which the financial settlement occurs subsequently of the closing month. (ii) Protection programs for base metals raw materials and products
In the operational protection program for nickel sales at fixed prices, derivatives transactions were implemented to convert into floating prices the contracts with clients that required a fixed price, in order to keep nickel revenues exposed to nickel price fluctuations. Those operations are usually implemented through the purchase of nickel forwards. In the operational protection program for the purchase of raw materials and products, derivatives transactions were implemented, usually through the sale of nickel and copper forward or futures, in order to reduce the mismatch between the pricing period of purchases (concentrate, cathode, sinter, scrap and others) and the pricing period of the final product sales to the clients.
Financial Settlement
Inflows (Outflows) Value at Risk
Flow December 31, 2017 December 31, 2016 Index Average rate December 31, 2017 December 31, 2016 December 31, 2017 December 31, 2017 2018 2019 2020+
EUR fixed rate vs. US$ fixed rate swap 23 (52) (7) 6 (4) (4) 31
Receivable € 500 € 500 Fix 3.75%
Payable US$ 613 US$ 613 Fix 4.29%
Financial Settlement
Inflows (Outflows) Value at Risk
Flow December 31, 2017 December 31, 2016
Bought /
Sold
Average rate
(USD/EUR) December 31, 2017 December 31, 2016 December 31, 2017 December 31, 2017 2018
Forwards € 0 € 500 B 1.143 - (46) (32) - -
Fair value
by yearNotional Fair value
Fair value by yearNotional Fair value
Financial settlement
Inflows (Outflows) Value at Risk
Fair value
by year
Flow December 31, 2017 December 31, 2016
Bought /
Sold
Average strike
(US$/ton) December 31, 2017 December 31, 2016 December 31, 2017 December 31, 2017 2017
Bunker Oil protection
Call options - 2,856,000 B - - 130 3 - -
Put options - 2,856,000 S - - (14) - - -
Total - 116 3 - -
Notional (ton) Fair value

50
The derivative transactions are negotiated at London Metal Exchange or over-the-counter and the protected item is part of Vale’s revenues and costs linked to nickel and copper prices. The financial settlement inflows/outflows are offset by the protected items’ losses/gains due to nickel and copper prices changes.
c) Wheaton Precious Metals Corp. warrants The company owns warrants of Wheaton Precious Metals Corp. (WPM), a Canadian company with stocks negotiated in Toronto Stock Exchange and New York Stock Exchange. Such warrants configure American call options and were received as part of the payment regarding the sale of part of gold payable flows produced as a sub product from Salobo copper mine and some nickel mines in Sudbury.
d) Debentures convertible into shares of Valor da Logística Integrada (“VLI”) The company has debentures in which lenders have the option to convert the outstanding debt into a specified quantity of shares of VLI owned by the company.
e) Options related to Minerações Brasileiras Reunidas S.A. (“MBR”) shares
The Company entered into a stock sale and purchase agreement that has options related to MBR shares. Mainly, the Company has the right to buy back this non-controlling interest in the subsidiary. Moreover, under certain restrict and contingent conditions, which are beyond the buyer’s control, such as illegality due to changes in the law, the contract has a clause that gives the buyer the right to sell back its stake to the Company. It this case, the Company could settle through cash or shares.
Financial settlement
Inflows (Outflows) Value at Risk
Flow December 31, 2017 December 31, 2016
Bought /
Sold
Average strike
(US$/ton) December 31, 2017 December 31, 2016 December 31, 2017 December 31, 2017 2017 2018
Fixed price sales protection
Nickel forwards 9,621 11,615 B 10,253 24 (1) (2) 4 21 3
Raw material purchase protection
Nickel forwards 292 134 S 11,597 (0.3) 0.1 0.3 0.1 (0.3) -
Copper forwards 79 441 S 6,941 (0.0) (0.1) (0.3) 0.0 (0.0) -
Total (0.4) (0.0) 0.0 0.1 (0.4) -
Fair value by yearNotional (ton) Fair value
Financial settlement
Inflows (Outflows) Value at Risk
Fair value
by year
Flow December 31, 2017 December 31, 2016
Bought /
Sold
Average strike
(US$/share) December 31, 2017 December 31, 2016 December 31, 2017 December 31, 2017 2023
Call options 10,000,000 10,000,000 B 44 39 44 - 4 39
Notional (quantity) Fair value
Financial settlement
Inflows (Outflows) Value at Risk
Fair value
by year
Flow December 31, 2017 December 31, 2016
Bought /
Sold
Average strike
(R$/share) December 31, 2017 December 31, 2016 December 31, 2017 December 31, 2017 2027
Conversion options 140,239 140,239 S 8,530 (57) (72) - 3 (57)
Notional (quantity) Fair value
Financial settlement
Inflows (Outflows) Value at Risk
Fair value
by year
Flow December 31, 2017 December 31, 2016
Bought /
Sold
Average strike
(R$/share) December 31, 2017 December 31, 2016 December 31, 2017 December 31, 2017 2018+
Options 2,139 2,139 B/S 1.7 251 121 - 12 251
Notional (quantity, in millions) Fair value
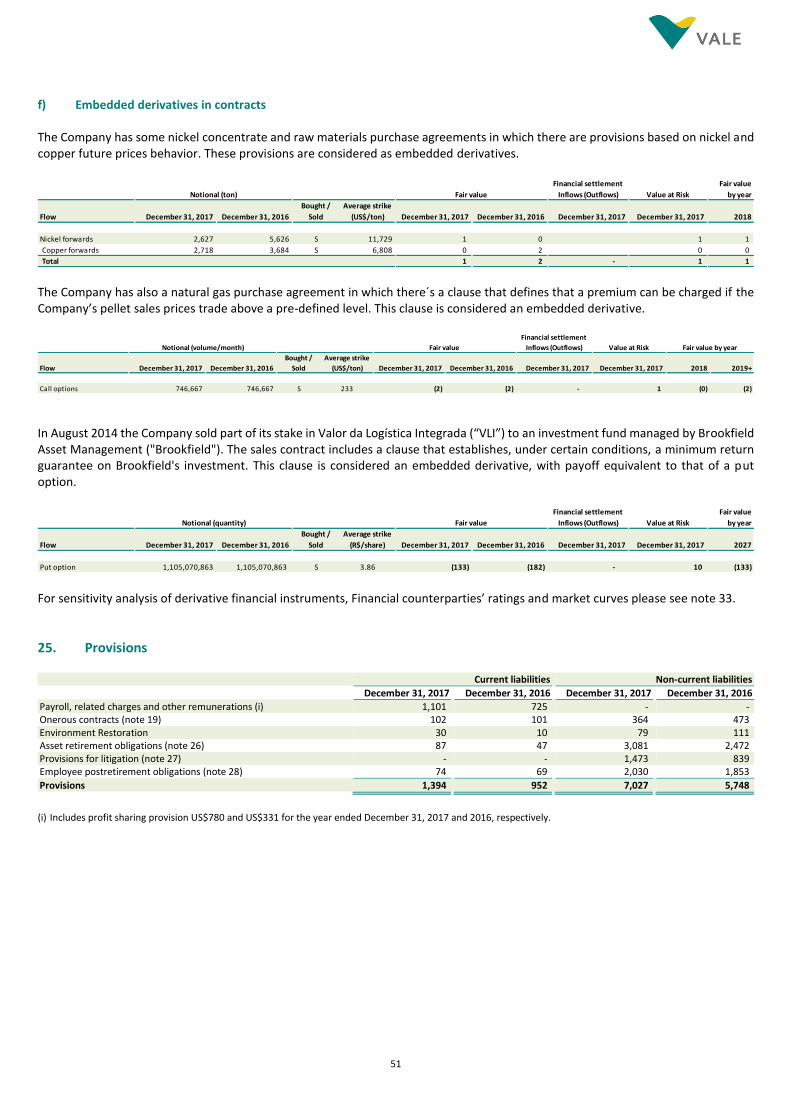
51
f) Embedded derivatives in contracts The Company has some nickel concentrate and raw materials purchase agreements in which there are provisions based on nickel and copper future prices behavior. These provisions are considered as embedded derivatives.
The Company has also a natural gas purchase agreement in which there´s a clause that defines that a premium can be charged if the Company’s pellet sales prices trade above a pre-defined level. This clause is considered an embedded derivative.
In August 2014 the Company sold part of its stake in Valor da Logística Integrada (“VLI”) to an investment fund managed by Brookfield Asset Management ("Brookfield"). The sales contract includes a clause that establishes, under certain conditions, a minimum return guarantee on Brookfield's investment. This clause is considered an embedded derivative, with payoff equivalent to that of a put option.
For sensitivity analysis of derivative financial instruments, Financial counterparties’ ratings and market curves please see note 33.
25. Provisions Current liabilities Non-current liabilities
December 31, 2017 December 31, 2016 December 31, 2017 December 31, 2016
Payroll, related charges and other remunerations (i) 1,101 725 - - Onerous contracts (note 19) 102 101 364 473 Environment Restoration 30 10 79 111 Asset retirement obligations (note 26) 87 47 3,081 2,472 Provisions for litigation (note 27) - - 1,473 839 Employee postretirement obligations (note 28) 74 69 2,030 1,853
Provisions 1,394 952 7,027 5,748
(i) Includes profit sharing provision US$780 and US$331 for the year ended December 31, 2017 and 2016, respectively.
Financial settlement
Inflows (Outflows) Value at Risk
Fair value
by year
Flow December 31, 2017 December 31, 2016
Bought /
Sold
Average strike
(US$/ton) December 31, 2017 December 31, 2016 December 31, 2017 December 31, 2017 2018
Nickel forwards 2,627 5,626 S 11,729 1 0 1 1
Copper forwards 2,718 3,684 S 6,808 0 2 0 0
Total 1 2 - 1 1
Notional (ton) Fair value
Financial settlement
Inflows (Outflows) Value at Risk
Flow December 31, 2017 December 31, 2016
Bought /
Sold
Average strike
(US$/ton) December 31, 2017 December 31, 2016 December 31, 2017 December 31, 2017 2018 2019+
Call options 746,667 746,667 S 233 (2) (2) - 1 (0) (2)
Fair value by yearNotional (volume/month) Fair value
Financial settlement
Inflows (Outflows) Value at Risk
Fair value
by year
Flow December 31, 2017 December 31, 2016
Bought /
Sold
Average strike
(R$/share) December 31, 2017 December 31, 2016 December 31, 2017 December 31, 2017 2027
Put option 1,105,070,863 1,105,070,863 S 3.86 (133) (182) - 10 (133)
Notional (quantity) Fair value

52
26. Asset retirement obligations Provision is made for expected costs for the closure of the mines and deactivation of the related mining assets. Changes in the provision for asset retirement obligations and long-term interest rates (per annum, used to discount these obligations to present value and to update the provisions) are as follows: December 31, 2017 December 31, 2016
Balance at beginning of the year 2,519 2,474
Interest expense 70 115 Settlements (60) (77) Revisions on cash flows estimates 620 230 Translation adjustment 96 134 Effect of discontinued operations Transfer to net assets held for sale (77) (357)
Balance at end of the year 3,168 2,519
Current 87 47 Non-current 3,081 2,472
3,168 2,519
Long-term interest rates (per annum) Brazil 5.34% 5.73% Canada 0.57% 0.55% Other regions 0.72% - 6.13% 1.07% - 8.02%
Accounting policy
When the provision is recognized, the corresponding cost is capitalized as part of property, plant and equipment and is depreciated over the useful life of the related mining asset, resulting in an expense recognized in the income statement. The long-term liability is discounted at presented value using a long-term risk free discount rate applicable to the liability and the unwinds are recorded in the income statement and is reduced by payments for mine closure and decommissioning of mining assets. The accrued amounts of these obligations are not deducted from the potential costs covered by insurance or indemnities.
Critical accounting estimates and judgments
Judgment is required to determine key assumptions used on the asset retirement obligation measurement such as, interest rate, cost of closure, useful life of the mining asset considering the current conditions of closure and the projected date of depletion of each mine. Any changes in these assumptions may significant impact the recorded provision. Therefore, the estimated costs for closure of the mining assets is deemed to be a critical accounting estimate. These estimates are annually reviewed.
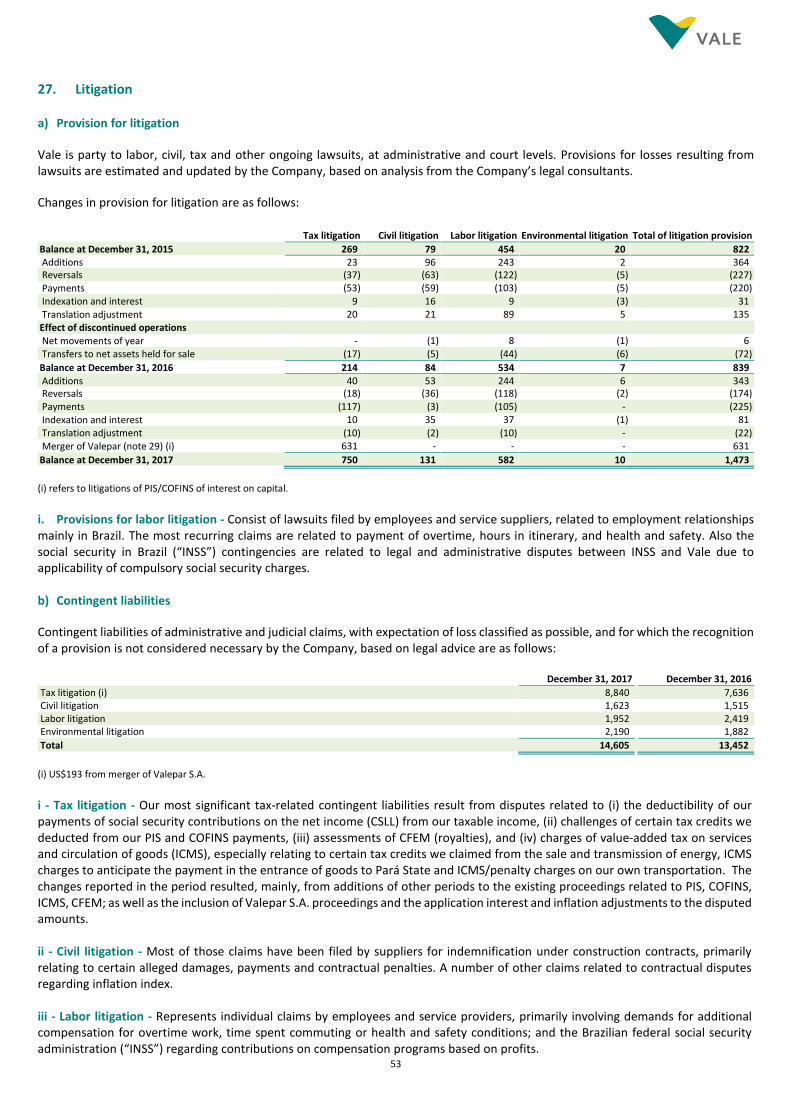
53
27. Litigation
a) Provision for litigation
Vale is party to labor, civil, tax and other ongoing lawsuits, at administrative and court levels. Provisions for losses resulting from lawsuits are estimated and updated by the Company, based on analysis from the Company’s legal consultants.
Changes in provision for litigation are as follows:
Tax litigation Civil litigation Labor litigation Environmental litigation Total of litigation provision
Balance at December 31, 2015 269 79 454 20 822 Additions 23 96 243 2 364 Reversals (37) (63) (122) (5) (227) Payments (53) (59) (103) (5) (220) Indexation and interest 9 16 9 (3) 31 Translation adjustment 20 21 89 5 135 Effect of discontinued operations Net movements of year - (1) 8 (1) 6 Transfers to net assets held for sale (17) (5) (44) (6) (72)
Balance at December 31, 2016 214 84 534 7 839 Additions 40 53 244 6 343 Reversals (18) (36) (118) (2) (174) Payments (117) (3) (105) - (225) Indexation and interest 10 35 37 (1) 81 Translation adjustment (10) (2) (10) - (22) Merger of Valepar (note 29) (i) 631 - - - 631
Balance at December 31, 2017 750 131 582 10 1,473
(i) refers to litigations of PIS/COFINS of interest on capital.
i. Provisions for labor litigation - Consist of lawsuits filed by employees and service suppliers, related to employment relationships mainly in Brazil. The most recurring claims are related to payment of overtime, hours in itinerary, and health and safety. Also the social security in Brazil (“INSS”) contingencies are related to legal and administrative disputes between INSS and Vale due to applicability of compulsory social security charges. b) Contingent liabilities
Contingent liabilities of administrative and judicial claims, with expectation of loss classified as possible, and for which the recognition of a provision is not considered necessary by the Company, based on legal advice are as follows: December 31, 2017 December 31, 2016
Tax litigation (i) 8,840 7,636 Civil litigation 1,623 1,515 Labor litigation 1,952 2,419 Environmental litigation 2,190 1,882
Total 14,605 13,452
(i) US$193 from merger of Valepar S.A. i - Tax litigation - Our most significant tax-related contingent liabilities result from disputes related to (i) the deductibility of our payments of social security contributions on the net income (CSLL) from our taxable income, (ii) challenges of certain tax credits we deducted from our PIS and COFINS payments, (iii) assessments of CFEM (royalties), and (iv) charges of value-added tax on services and circulation of goods (ICMS), especially relating to certain tax credits we claimed from the sale and transmission of energy, ICMS charges to anticipate the payment in the entrance of goods to Pará State and ICMS/penalty charges on our own transportation. The changes reported in the period resulted, mainly, from additions of other periods to the existing proceedings related to PIS, COFINS, ICMS, CFEM; as well as the inclusion of Valepar S.A. proceedings and the application interest and inflation adjustments to the disputed amounts. ii - Civil litigation - Most of those claims have been filed by suppliers for indemnification under construction contracts, primarily relating to certain alleged damages, payments and contractual penalties. A number of other claims related to contractual disputes regarding inflation index. iii - Labor litigation - Represents individual claims by employees and service providers, primarily involving demands for additional compensation for overtime work, time spent commuting or health and safety conditions; and the Brazilian federal social security administration (“INSS”) regarding contributions on compensation programs based on profits.

54
iv - Environmental litigation - The most significant claims concern alleged procedural deficiencies in licensing processes, non-compliance with existing environmental licenses or damage to the environment.
c) Judicial deposits In addition to the provisions and contingent liabilities, the Company is required by law to make judicial deposits to secure a potential adverse outcome of certain lawsuits. These court-ordered deposits are monetarily adjusted and reported as non-current assets until a judicial decision to draw the deposit occurs. December 31, 2017 December 31, 2016
Tax litigation (i) 1,201 193 Civil litigation 60 62 Labor litigation 712 691 Environmental litigation 13 16
Total 1,986 962
(i) Includes US$951 related to the merger of Valepar (note 29).
d) Contingencies related to Samarco accident (i) Public civil claim filed by the Federal Government and others The federal government, the two Brazilian states affected by the failure (Espirito Santo and Minas Gerais) and other governmental authorities have initiated a public civil lawsuit against Samarco and its shareholders, Vale S.A. and BHPB, with an estimated value indicated by the plaintiffs of US$6.1 billion (R$20.2 billion). The Framework Agreement signed in March 2016, was ratified by the Federal Regional Court (“TRF”) in May 2016. This ratification was suspended by the Superior Court of Justice (“STJ”) in June 2016 and resulted in the restoration of the public civil claim, and maintained other measures, such as: (a) the prohibition of the defendants from transferring or conveying any of their interest in its Brazilian iron ore concessions, without, however, limiting their production and commercial activities and; (b) the order of the deposit with the court of US$363 (R$1.2 billion) by January 2017, which was provisionally replaced by the guarantees provided for under the agreements with Federal Prosecution Office (“MPF”), as detailed in the item (ii) below. (ii) Public civil action filed by Federal Prosecution Office
On May 3, 2016, the Federal Prosecution Office (MPF) filed a public civil lawsuit against Samarco and its shareholders and presented several demands, including: (i) the adoption of measures for mitigating the social, economic and environmental impacts resulting from the dam failure and other emergency measures; (ii) the payment of compensation to the community; and (iii) payments for the collective moral damage. The action value indicated by the MPF is US$47 billion (R$155 billion). In January 2017 Samarco, Vale S.A. and BHPB entered into two preliminary agreements with the MPF. The first agreement (“First Agreement”) aims to outline the process and timeline for negotiations of a Final Agreement (“Final Agreement”), initially expected to occur by June 30, 2017 and extended by April 20, 2018. This First Agreement establishes a timeline and actions to set the ground for conciliation of two public civil lawsuits in the amounts of US$6.1 billion (R$20.2 billion) and US$47 billion (R$155 billion), mentioned above, which are actually suspended. In addition, the First Agreement provides for: (a) the appointment of experts to give support the Federal Prosecutors and paid for by the companies to conduct a diagnosis and monitor the progress of the programs under the Framework Agreement, and (b) holding at public hearings and the engagement of technical assistance to the affected people, in order to allow these communities to take part in the definition of the content of the Final Agreement. Samarco, Vale S.A. and BHPB has agreed to provide a guarantee for fulfillment of the obligations regarding the financing and payment of the socio-environmental and socio-economic remediation programs resulting from the Fundão dam failure, pursuant to the two public civil actions, until the signing of the Final Agreement, amounting to US$665 (R$2.2 billion), of which (i) US$30 (R$100 million) in financial investments; (ii) US$393 (R$1.3 billion) in insurance bonds; and (iii) US$242 (R$800 million) in assets of Samarco. If, by April 20, 2018, the negotiations have not been completed, the Federal Prosecutor’s Office may require that the Court re-institute the order for the deposit of US$363 (R$1.2 billion) in relation to the US$6.1 billion (R$20.2 billion) public civil action and US$2.2 billion (R$7.7 billion) related US$47 billion (R$155 billion), mentioned above, which are actually suspended.

55
On March 16, 2017, the 12th Judicial Federal Court of Belo Horizonte partially ratified the First Agreement, which decision includes: (i) ratification of the engagement of experts to perform a socio-environmental impact assessment and assessment of programs under the Framework Agreement and a period for the companies to engage an expert to perform the socio-economic impact assessment; (ii) the consolidation and suspension of related claims aiming to avoid contradictory or conflicting decisions and to establish a unified judicial procedure in order for the parties to be able to reach a final agreement; (iii) accepted the guarantees proposed by Samarco and its shareholders under the Preliminary Agreement on a temporary basis. In addition, the Second Agreement (“Second Agreement”) was signed on January 19, 2017, which establishes a timetable to make funds available to remediate the social, economic and environmental damages caused by the Fundão dam failure in the municipalities of Barra Longa, Rio Doce, Santa Cruz do Escalvado and Ponte Nova, amounting to US$60 (R$200 million). The 12th Judicial Federal Court of Belo Horizonte ratified this Second Agreement. Parties are still negotiating an agreement regarding the choice of the expert to perform the socio-economic impact assessment. In this regard, on November 16th, 2017, they signed an addendum to the First Agreement, in which the parties defined matters related to the socio-economic impact assessment, its institutional structure and the respective experts, which, in the period of 90 days from the signing of the addendum, shall present their technical and commercial proposals. Alongside, the parties, together with the plaintiffs of the US$6.1 billion (R$20.2 billion) public civil lawsuit, the State Prosecutors and the Public Defenders, are conducting the discussions regarding the Final Agreement. (iii) U.S. Securities class action suits Related to the Vale´s American Depositary Receipts Vale S.A. and certain of its officers were named as defendants in securities class action suits in the Federal Court in New York brought by holders of Vale’s American Depositary Receipts under U.S. federal securities laws. The lawsuits allege that Vale S.A. made false and misleading statements or did not make disclosures concerning the risks and dangers of the operations of Samarco's Fundão dam and the adequacy of related programs and procedures. The plaintiffs have not specified an amount of alleged damages or indemnities in these actions. On March 23, 2017 the judge issued a decision rejecting a significant portion of the claims against Vale S.A. and the individual defendants, and determining the prosecution of the action with respect to more limited claims. The portion of plaintiffs' case that remains is related to certain statements about procedures, policies and risk mitigation plans contained in Vale S.A.'s sustainability reports in 2013 and 2014, and certain statements regarding to the responsibility of Vale S.A. for the Fundão dam failure made in a conference call in November 2015. This lawsuit is currently ongoing with under discovery the gathering of documents to be provided to the plaintiffs. Vale S.A. continues to contest the outstanding points related to this lawsuit. Related to the Samarco bonds
In March 2017, holders of bonds issued by Samarco filed a class action suit in the Federal Court in New York against Samarco, Vale S.A. and BHPB under U.S. federal securities laws demanding for indemnification for alleged violation of U.S. federal securities laws. The plaintiffs allege that false and misleading statements were made or disclosures omitted concerning the risks and dangers of the operations of Samarco's Fundão dam and the adequacy of related programs and procedures. It is alleged that with the Fundão dam collapse, the securities have dramatically decreased, in order that the investors who have purchased such securities in a misleading way should be compensated, without, however, specifying an amount for the alleged damages or indemnities in this action.
Vale S.A. continues to contest this lawsuit.
(iv) Criminal lawsuit On October 20, 2016, the MPF brought a criminal lawsuit in the Brazilian Federal Justice Court against Vale S.A., BHPB, Samarco, VogBr Recursos Hídricos e Geotecnia Ltda. and 22 individuals for alleged crimes against the environment, urban planning and cultural heritage, flooding, landslide, as well as for alleged crimes against the victims of the Fundão dam failure. In November 2017 it was published a decision by means of the Federal Lower Court of Ponte Nova established the resume of the criminal lawsuit and determined the beginning of the Discovery phase.

56
(v) Other lawsuits In addition, Samarco and its shareholders were named as a defendant in several other lawsuits brought by individuals, corporations, governmental entities or public prosecutor seeking personal and property damages. Given the status of these lawsuits, it is not possible at this time to provide a range of possible outcomes or a reliable estimates of potential exposures for Vale S.A. Consequently, no contingent liability has been quantified and no provision was recognized for lawsuits related to Samarco´s dam failure. Accounting policy
A provision is recognized when is considered probable that an outflow of resources will be required to settle the obligation and can be reliably estimated. The liability is accounted against an expense in the income statement. This obligation is updated based on the developments of the judicial process or interest accretion and can be reversed if the expectation of loss is not considered probable due to changes in circumstances or when the obligation is settled.
Critical accounting estimates and judgments
By nature, litigations will be resolved when one or more future event occurs or fails to occur. Typically, the occurrence or not of such events is outside of the Company’s control. Legal uncertainties involve the application of significant estimates and judgments by management regarding the potential out comes of future events.
28. Employee benefits a) Employee postretirements obligations In Brazil, the management of the pension plans is responsibility of Fundação Vale do Rio Doce de Seguridade Social (“Valia”) a nonprofit entity with administrative and financial autonomy. The Brazilian plans are as follows: Benefit plan Vale Mais (“Vale Mais”) and benefit plan Valiaprev (“Valiaprev”) - Certain Company’s employees are participants of Vale Mais and Valiaprev plans with components of defined benefit (specific coverage for death, pensions and disability allowances) and components of defined contributions (for programmable benefits). The defined benefits plan is subject to actuarial evaluations. The defined contribution plan represents a fixed amount held on behalf of the participants. Both Vale Mais and Valiaprev were overfunded as at December 31, 2017 and 2016. Defined benefit plan (“Plano BD”) - The Plano BD has been closed to new entrants since the year 2000, when the Vale Mais plan was implemented. It is a plan that has defined benefit characteristics, covering almost exclusively retirees and their beneficiaries. It was overfunded as of December 31, 2017 and 2016 and the contributions made by the Company are not relevant. Abono complementação benefit plan - The Company sponsors a specific group of former employees entitled to receive additional benefits from Valia regular payments plus post-retirement benefit that covers medical, dental and pharmaceutical assistance. The contributions made by the Company finished in 2014. The abono complementação benefit was overfunded as at December 31, 2017 and 2016. Other benefits - The Company sponsors medical plans for employees that meet specific criteria and for employees who use the abono complementação benefit. Although those benefits are not specific retirement plans, actuarial calculations are used to calculate future commitments. As those benefits are related to health care plans they have the nature of underfunded benefits, and are presented as underfunded plans as at December 31, 2017 and 2016. The Foreign plans are managed in accordance with their region. They are divided between plans in Canada, United States of America, United Kingdom, Indonesia, New Caledonia, Japan and Taiwan. Pension plans in Canada are composed of a defined benefit and defined contribution component. Currently the defined benefit plans do not allow new entrants. The foreign defined benefit plans are underfunded as at December 31, 2017 and 2016. Employers’ disclosure about pensions and other post-retirement benefits on the status of the defined benefit elements of all plans is provided as follows.

57
i. Change in benefit obligation Overfunded pension plans Underfunded pension plans Other benefits
Benefit obligation as at December 31, 2015 2,474 3,689 1,223
Service costs 10 76 (16) Interest costs 362 175 66 Benefits paid (281) (259) (61) Participant contributions 1 - - Effect of changes in the actuarial assumptions 271 117 75 Transfer to held for sale (9) - (59) Translation adjustment 515 124 68 Others - 123 -
Benefit obligation as at December 31, 2016 3,343 4,045 1,296
Service costs 7 86 30 Interest costs 360 183 67 Benefits paid (326) (275) (65) Participant contributions - (12) - Effect of changes in the actuarial assumptions 64 167 11 Translation adjustment (51) 276 71
Benefit obligation as at December 31, 2017 3,397 4,470 1,410
ii. Evolution of assets fair value Overfunded pension plans Underfunded pension plans Other benefits
Fair value of plan assets as at December 31, 2015 3,435 3,094 -
Interest income 512 151 - Employer contributions 42 99 61 Participant contributions 1 - - Benefits paid (281) (259) (61) Return on plan assets (excluding interest income) 281 71 - Transfer to held for sale (13) - - Translation adjustment 717 105 - Others - 158 -
Fair value of plan assets as at December 31, 2016 4,694 3,419 -
Interest income 513 151 - Employer contributions 45 65 65 Participant contributions - (12) - Benefits paid (326) (275) (65) Return on plan assets (excluding interest income) (21) 174 - Translation adjustment (77) 254 -
Fair value of plan assets as at December 31, 2017 4,828 3,776 -
iii. Reconciliation of assets and liabilities recognized in the statement of financial position Plans in Brazil
December 31, 2017 December 31, 2016
Overfunded
pension plans Underfunded pension plans Other benefits
Overfunded pension plans
Underfunded pension plans Other benefits
Balance at beginning of the year 1,351 - - 961 - -
Interest income 152 - - 156 - - Changes on asset ceiling and onerous liability (45) - - 35 - - Translation adjustment (27) - - 201 - - Transfer to held for sale - - - (2) - -
Balance at end of the year 1,431 - - 1,351 - -
Amount recognized in the statement of financial position Present value of actuarial liabilities (3,397) (401) (258) (3,343) (386) (227) Fair value of assets 4,828 239 - 4,694 257 - Effect of the asset ceiling (1,431) - - (1,351) - -
Liabilities - (162) (258) - (129) (227)
Current liabilities - - (22) - - (18) Non-current liabilities - (162) (236) - (129) (209)
Liabilities - (162) (258) - (129) (227)

58
Foreign plan
December 31, 2017 December 31, 2016
Overfunded
pension plans Underfunded pension plans Other benefits
Overfunded pension plans
Underfunded pension plans Other benefits
Amount recognized in the statement of financial position Present value of actuarial liabilities - (4,069) (1,152) - (3,659) (1,069) Fair value of assets - 3,537 - - 3,162 -
Liabilities - (532) (1,152) - (497) (1,069)
Current liabilities - (16) (36) - (16) (35) Non-current liabilities - (516) (1,116) - (481) (1,034)
Liabilities - (532) (1,152) - (497) (1,069)
Total
December 31, 2017 December 31, 2016
Overfunded
pension plans Underfunded pension plans Other benefits
Overfunded pension plans
Underfunded pension plans Other benefits
Balance at beginning of the year 1,351 - - 961 - -
Interest income 152 - - 156 - - Changes on asset ceiling and onerous liability (45) - - 35 - - Translation adjustment (27) - - 201 - - Transfer to held for sale - - - (2) - -
Balance at end of the year 1,431 - - 1,351 - -
Amount recognized in the statement of financial position Present value of actuarial liabilities (3,397) (4,470) (1,410) (3,343) (4,045) (1,296) Fair value of assets 4,828 3,776 - 4,694 3,419 - Effect of the asset ceiling (1,431) - - (1,351) - -
Liabilities - (694) (1,410) - (626) (1,296)
Current liabilities - (16) (58) - (16) (53) Non-current liabilities - (678) (1,352) - (610) (1,243)
Liabilities - (694) (1,410) - (626) (1,296)
iv. Costs recognized in the income statement Year ended December 31
2017 2016 2015
Overfunded pension
plans
Underfunded pension
plans Other
benefits
Overfunded pension
plans
Underfunded pension
plans Other benefits
Overfunded pension
plans
Underfunded pension
plans Other
benefits
Service cost 7 86 30 10 76 (16) 20 94 28 Interest on expense on liabilities 360 183 67 362 175 66 359 178 66 Interest income on plan assets (513) (151) - (512) (151) - (491) (151) - Interest expense on effect of (asset ceiling)/ onerous liability 152 - - 156 - - 132 - -
Total of cost, net 6 118 97 16 100 50 20 121 94
v. Costs recognized in the statement of comprehensive income
Year ended December 31
2017 2016 2015
Overfunded pension
plans
Underfunded pension
plans Other
benefits
Overfunded pension
plans
Underfunded pension
plans Other
benefits
Overfunded pension
plans
Underfunded pension
plans Other
benefits
Balance at beginning of the year (153) (496) (160) (113) (495) (95) (143) (570) (132)
Effect of changes actuarial assumptions (65) (167) (27) (271) (117) (75) 184 70 31 Return on plan assets (excluding interest income) - 167 - 281 71 - (284) (8) - Change of asset ceiling / costly liabilities (excluding interest income) 47 - - (36) - - 70 - - Others (3) - (14) - 35 - - 2 1
(21) - (41) (26) (11) (75) (30) 64 32 Deferred income tax 7 (3) 12 9 16 17 10 2 (9)
Others comprehensive income (14) (3) (29) (17) 5 (58) (20) 66 23 Translation adjustments 4 4 1 (23) (6) (7) 49 10 14 Transfers/ disposal - (1) (1) - - - 1 (1) -
Accumulated other comprehensive income (163) (496) (189) (153) (496) (160) (113) (495) (95)

59
vi. Risks related to plans The Administrators of the plans have committed to strategic planning to strengthen internal controls and risk management. This commitment is archived by conducting audits including of internal controls, which aim to mitigate operational market and credit risks. Risks are presented as follow:
Legal - lawsuits: issuing periodic reports to internal audit and directors contemplating the analysis of lawyers about the possibility of loss (remote, probable or possible), aiming to support the administrative decision regarding provisions. Analysis and ongoing monitoring of developments in the legal scenario and its dissemination within the institution in order to subsidize the administrative plans, considering the impact of regulatory changes.
Actuarial - the annual actuarial valuation of the benefit plans comprises the assessment of costs, revenues and adequacy of plan funding. It also considers the monitoring of biometric, economic and financial assumptions (asset volatility, changes in interest rates, inflation, life expectancy, salaries and other).
Market - profitability projections are performed for the various plans and profiles of investments for 10 years in the management study of assets and liabilities. These projections include the risks of investments in various market segments. Furthermore, the risks for short-term market of the plans are monitored monthly through metrics of VaR (Value at Risk) and stress testing. For exclusive investment funds of Valia, the market risk is measured daily by the custodian asset bank.
Credit - assessment of the credit quality of issuers by hiring expert consultants to evaluate financial institutions and internal assessment of payment ability of non-financial companies. For assets of non-financial companies, the assessment is conducted a monitoring of the company until the maturity of the security. vii. Actuarial and economic assumptions and sensitivity analysis All calculations involve future actuarial projections about some parameters, such as: salaries, interest, inflation, the trend of social security in Brazil (“INSS”) benefits, mortality and disability. The economic and actuarial assumptions adopted have been formulated considering the long-term period for maturity and should therefore be examined accordingly. In the short term they may not necessarily be realized. In the evaluations were adopted the following assumptions: Brazil
December 31, 2017 December 31, 2016
Overfunded
pension plans Underfunded pension plans Other benefits
Overfunded pension plans
Underfunded pension plans Other benefits
Discount rate to determine benefit obligation 9.74% - 9.85% 9.84% 9.74% - 9.91% 10.98% - 11.14% 10.98% 10.98% - 11.09% Nominal average rate to determine expense/ income 9.74% - 9.85% 9.84% N/A 10.98% - 11.14% 10.98% N/A Nominal average rate of salary increase 4.25% - 6.34% 4.25% - 6.34% N/A 4.85% - 5.95% 6.95% N/A Nominal average rate of benefit increase 4.85% 4.85% N/A 6.00% 6.00% N/A Immediate health care cost trend rate N/A N/A 7.38% N/A N/A 8.00% Ultimate health care cost trend rate N/A N/A 7.38% N/A N/A 8.00% Nominal average rate of price inflation 4.25% 4.25% 4.25% 4.85% 4.85% 4.85%
Foreign
December 31, 2017 December 31, 2016
Underfunded pension plans Other benefits
Underfunded pension plans Other benefits
Discount rate to determine benefit obligation 3.26% 3.44% 3.84% 3.90% Nominal average rate to determine expense/ income 3.84% N/A 4.01% N/A Nominal average rate of salary increase 3.27% N/A 4.05% N/A Nominal average rate of benefit increase N/A 3.00% N/A 3.00% Immediate health care cost trend rate N/A 5.99% N/A 6.30% Ultimate health care cost trend rate N/A 4.56% N/A 4.50% Nominal average rate of price inflation 2.10% 2.10% 2.00% 2.00%
For the sensitivity analysis, the Company considers the effect of 1% in nominal discount rate to determine the actuarial liability. The effects of this change in actuarial liabilities in premise and adopted the average duration of the plan are as follows:

60
December 31, 2017
Overfunded pension plans Underfunded pension plans Other benefits
Nominal discount rate - 1% increase Actuarial liability balance 3,126 3,943 1,232 Assumptions made 10.75% 4.85% 5.61%
Nominal discount rate - 1% reduction Actuarial liability balance 3,715 5,073 1,620 Assumptions made 8.75% 2.85% 3.61%
viii. Assets of pension plans Brazilian plan assets as at December 31, 2017 and 2016 includes respectively (i) investments in a portfolio of Vale’s stock and other instruments in the amount of US$37 and US$26 and (ii) Brazilian Federal Government securities in the amount of US$4,617 and US$4,374. Foreign plan assets as at December 31, 2017 and 2016 includes Canadian Government securities in the amount of US$864 and US$735, respectively. ix. Overfunded pension plans Assets by category are as follows: December 31, 2017 December 31, 2016
Level 1 Level 2 Level 3 Total Level 1 Level 2 Level 3 Total
Debt securities - Corporate - 72 - 72 - 117 - 117 Debt securities - Government 2,757 - - 2,757 2,612 - - 2,612 Investments funds - Fixed Income 2,515 - - 2,515 2,411 - - 2,411 Investments funds - Equity 531 - - 531 168 - - 168 International investments 24 - - 24 12 - - 12 Structured investments - Private Equity funds - - 196 196 217 - 140 357 Structured investments - Real estate funds - - 15 15 - - 10 10 Real estate - - 365 365 - - 370 370 Loans to participants - - 224 224 - - 260 260
Total 5,827 72 800 6,699 5,420 117 780 6,317
Funds not related to risk plans (1,871) (1,623)
Fair value of plan assets at end of year 4,828 4,694
Measurement of overfunded plan assets at fair value with no observable market variables (level 3) are as follows: Private equity funds Real estate funds Real estate Loans to participants Total
Balance as at December 31, 2015 136 6 319 249 710
Return on plan assets (19) - 3 33 17 Assets purchases 30 3 2 55 90 Assets sold during the year (23) - (17) (121) (161) Translation adjustment 26 1 63 46 136 Transfer to held for sale (10) - - (2) (12)
Balance as at December 31, 2016 140 10 370 260 780
Return on plan assets 37 (2) 4 29 68 Assets purchases 31 8 13 75 127 Assets sold during the year (8) - (17) (137) (162) Translation adjustment (4) (1) (5) (3) (13) Transfer to held for sale - - - - -
Balance as at December 31, 2017 196 15 365 224 800

61
x. Underfunded pension plans Assets by category are as follows: December 31, 2017 December 31, 2016
Level 1 Level 2 Level 3 Total Level 1 Level 2 Level 3 Total
Cash and cash equivalents 4 28 - 32 - 24 - 24 Equity securities 1,364 3 - 1,367 1,240 - - 1,240 Debt securities - Corporate - 338 - 338 - 10 - 10 Debt securities - Government 141 801 - 942 83 736 - 819 Investments funds - Fixed Income 159 - - 159 142 307 - 449 Investments funds - Equity 8 392 - 400 92 368 - 460 International investments - - - - - 27 - 27 Structured investments - Private Equity funds 97 - 197 294 - - 187 187 Real estate - - 44 44 - - 24 24 Loans to participants - - 5 5 - - 6 6 Others - - 195 195 - - 173 173
Total 1,773 1,562 441 3,776 1,557 1,472 390 3,419
Measurement of underfunded plan assets at fair value with no observable market variables (level 3) are as follows: Private equity funds Real estate Loans to participants Others Total
Balance as at December 31, 2015 98 20 5 159 282
Return on plan assets 15 - - 9 24 Assets purchases 176 - - - 176 Assets sold during the year (110) - - - (110) Translation adjustment 8 4 1 5 18
Balance as at December 31, 2016 187 24 6 173 390
Return on plan assets 8 1 - 10 19 Assets purchases 13 17 - - 30 Assets sold during the year (18) (1) - - (19) Translation adjustment 7 3 (1) 12 21
Balance as at December 31, 2017 197 44 5 195 441
xi. Disbursement of future cash flow Vale expects to disburse US$140 in 2018 in relation to pension plans and other benefits. xii. Expected benefit payments The expected benefit payments, which reflect future services, are as follows: December 31, 2017
Overfunded pension plans Underfunded pension plans Other benefits
2018 97 251 67 2019 102 252 68 2020 108 252 70 2021 82 253 72 2022 117 256 74 2023 and thereafter 641 1,311 397
b) Profit sharing program (“PLR”) The Company recorded as cost of goods sold and services rendered and other operating expenses related to the profit sharing program US$780, US$331 and US$42 for the years ended on December 31, 2017, 2016 and 2015, respectively.

62
c) Long-term compensation plan For the long-term awarding of eligible executives, the Company compensation plans includes Matching Program and Performance Share Unit Program - PSU, with three to four years-vesting cycles, respectively, with the aim of encouraging employee’s retention and stimulating their performance. For the Matching program, the participants can acquire Vale’s common shares in the market without any benefits being provided by Vale. If the shares acquired are held for a period of three years and the participants keep it employment relationship with Vale, the participant is entitled to receive from Vale an award in shares, equivalent to the number of shares originally acquired by the executive. It should be noted that, although a specific custodian of the shares is defined by Vale, the share initially purchased by the executives have no restriction and can be sold at any time. However, if it’s done before the end of the three-year-vesting period, they lose the entitlement of receiving the related award paid by Vale. For PSU program, the eligible executives have the opportunity to receive during a four year-vesting cycle, an award equivalent to the market value of a determined number of common shares and conditioned to Vale’s performance factor measured as an indicator of total return to the shareholders (TSR). This award is paid in cash and can occur in cumulative installments of 20% (at the end of 2nd year), 30% (at the end of 3rd year) and 50% (at the end of 4th year), conditioned to the performance factor of each year. Liabilities of the plans are measured at fair value at every reporting period, based on market rates. Compensation costs incurred are recognized by the defined vesting period of three or four years. For the years ended December 31, 2017, 2016 and 2015 the Company recognized in the income statement the amounts of US$65, US$37 and US$29, respectively, related to long-term compensation plan. Accounting policy
Employee benefits i. Current benefits – wages, vacations and related taxes Payments of benefits such as wages or accrued vacation, as well the related social security taxes over those benefits are recognized monthly in income, on an accruals basis.
ii. Current benefits – profit sharing program
The Company has the Annual Incentive Program (AIP) based on Team and business unit’s contribution and Company-wide performance through operational cash generation. The Company makes an accrual based on evaluation periodic of goals achieved and Company result, using the accrual basis and recognition of present obligation arising from past events in the estimated outflow of resources in the future. The accrual is recorded as cost of goods sold and services rendered or operating expenses in accordance with the activity of each employee.
iii. Non-current benefits – long-term incentive programs
The Company has established a procedure for awarding certain eligible executives (Matching and Virtual Shares Programs) with the goal of encouraging employee retention and optimum performance. Plan liabilities are measured at each reporting date, at their fair values, based on market prices. Obligations are measured at each reporting date, at fair values based on market prices. The compensation costs incurred are recognized in income during the vesting period as defined.
iv. Non-current benefits – pension costs and other post-retirement benefits
The Company has several retirement plans for its employees.
For defined contribution plans, the Company's obligations are limited to a monthly contribution linked to a pre-defined percentage of the remuneration of employees enrolled in to these plans.

63
For defined benefit plans, actuarial calculations are periodically obtained for liabilities determined in accordance with the Projected Unit Credit Method in order to estimate the Company’s obligation. The liability recognized in the statement of financial position represents the present value of the defined benefit obligation as at that date, less the fair value of plan assets. The Company recognized in the income statement the costs of services, the interest expense of the obligations and the interest income of the plan assets. The remeasurement of gains and losses, return on plan assets (excluding the amount of interest on return of assets, which is recognized in income for the year) and changes in the effect of the ceiling of the active and onerous liabilities are recognized in comprehensive income for the year.
For overfunded plans, the Company does not recognize any assets or benefits in the statement of financial position or income statement until such time as the use of the surplus is clearly defined. For underfunded plans, the Company recognizes actuarial liabilities and results arising from the actuarial valuation.
Critical accounting estimates and judgments
Post-retirement benefits for employees - The amount recognized and disclosed depend on a number of factors that are determined based on actuarial calculations using various assumptions in order to determine costs and liabilities. One of these assumptions is selection and use of the discount rate. Any changes to these assumptions will affect the amount recognized.
At the end of each year the Company and external actuaries review the assumptions that will be used for the following year. These assumptions are used in determining the fair values of assets and liabilities, costs and expenses and the future values of estimated cash outflows, which are recorded in the plan obligations.
29. Stockholders’ equity a) Conversion of preferred shares and merger of Valepar S.A. At the General Extraordinary Stockholders’ Meeting, held on June 27, 2017, approved the voluntary conversion of Vale class “A” preferred share into common shares (“ON”), based on the conversion rate of 0.9342 common shares for each Vale class “A” preferred share.
On August 11, 2017, the voluntary conversion period expired and an aggregate of 1,660,581,830 preferred shares (excluding treasury shares), corresponding to 84.4% of the total outstanding preferred shares, were converted into common shares.
At the Extraordinary Stockholders’ Meeting of Valepar S.A, held on August 14, 2017, stockholders approved the merger of Valepar with and into Vale. Thereafter, Valepar ceases to exist and, as consequence, its stockholders hold direct interests in Vale, through the 1.2065 Vale common shares received for each Valepar share held by them. As a result, Vale issued 173,543,667 new common shares to Valepar’s stockholders, all registered and without par value.
On August 14, 2017, the merger was accounted in Vale's stockholders' equity as capital reserve, based on the accounting appraisal report of Valepar's net assets, amounting US$1,158. The impacts arising from the merger in the Company's assets and liabilities are as follows:
August 14, 2017
Current assets 24 Judicial deposits (note 27(c)) 951 Intangible (note 17) 964
Current liabilities 20 Provisions for litigation (note 27(a)) 631 Taxes payable (note 8) 130
Net assets 1,158

64
At the Extraordinary Stockholders' Meeting and at the Special Stockholders’ Meeting, held on October 18, 2017, preferred stockholders approved the conversion of all Class "A" preferred shares into common shares of the Company, in the proportion of 0.9342 common share for each class "A" preferred share. During the period from October 20, 2017 until November 21, 2017, inclusive, the stockholders holding Vale's Class "A" preferred shares dissenting with regard to the resolution of the Special Meeting, had the right to withdraw from the Company, receiving R$24.26 per share which is the equivalent of Vale stockholders’ equity per share at December 31, 2016. At the end of this period, 10,397 common shares were converted into treasury shares (corresponding to 11,130 preferred shares). At the Extraordinary Stockholders' Meeting held on December 21, 2017 approved the migration of the Company to the special listing segment of B3 S.A. (“Novo Mercado”), following the conversion of the class “A” preferred shares into common shares.
The stockholders’ equity corresponds to 5,284,474,770 common shares and 12 preferred shares special class (“PNE” or “Golden shares”), and there were no changes in the amount of share capital.
Share position before
conversion Conversion of the
preferred shares Issue of new shares Share position after
conversion
Shares outstanding ON 3,185,653,000 1,838,235,414 173,543,667 5,197,432,081 PNA/PNE 1,967,721,926 (1,967,721,914) - 12
5,153,374,926 (129,486,500) 173,543,667 5,197,432,093 Shares in treasury ON 31,535,402 55,507,287 - 87,042,689 PNA 59,405,792 (59,405,792) - -
Total issued shares 5,244,316,120 (133,385,005) 173,543,667 5,284,474,782
The basic and diluted earnings per share were recalculated considering the changes in the number of shares, as described above. The comparative information for the years ended December 31, 2016 and 2015 were restated, as presented in note 9.
b) Share capital As at December 31, 2017, the share capital was US$61,614 corresponding to 5,284,474,782 shares issued and fully paid without par value.
December 31, 2017 December 31, 2016
Stockholders ON PNE Total ON PNA Total
Litel Participações S.A. and Litela Participações S.A. 1,108,483,410 - 1,108,483,410 - - - BNDES Participações S.A. 401,457,757 - 401,457,757 206,378,882 66,185,272 272,564,154 Bradespar S.A. 332,965,266 - 332,965,266 - - - Mitsui & Co., Ltd 286,347,055 - 286,347,055 - - - Valepar S.A. - - - 1,716,435,045 20,340,000 1,736,775,045 Brazilian Government (Golden Share) - 12 12 - 12 12 Foreign investors - ADRs 1,292,115,112 - 1,292,115,112 786,067,634 610,880,671 1,396,948,305 Foreign institutional investors in local market 1,129,164,954 - 1,129,164,954 262,868,264 825,753,408 1,088,621,672 FMP - FGTS 62,061,672 - 62,061,672 70,662,746 - 70,662,746 PIBB - Fund 2,632,618 - 2,632,618 741,730 1,171,101 1,912,831 Institutional investors 277,003,730 - 277,003,730 104,510,549 133,496,260 238,006,809 Retail investors in Brazil 305,200,507 - 305,200,507 37,988,150 309,895,202 347,883,352
Shares outstanding 5,197,432,081 12 5,197,432,093 3,185,653,000 1,967,721,926 5,153,374,926 Shares in treasury 87,042,689 - 87,042,689 31,535,402 59,405,792 90,941,194
Total issued shares 5,284,474,770 12 5,284,474,782 3,217,188,402 2,027,127,718 5,244,316,120
Share capital per class of shares (in millions) 61,614 - 61,614 38,525 23,089 61,614
Total authorized shares 7,000,000,000 - 7,000,000,000 3,600,000,000 7,200,000,000 10,800,000,000
The Board of Directors may, regardless of changes to by-laws, issue new common shares (up to the total authorized shares), including the capitalization of profits and reserves to the extent authorized. The Company repurchases its shares to hold in treasury for future sale or cancellation. These shares are recorded in a specific account as a reduction of stockholders´ equity at their acquisition value and carried at cost. These programs are approved by the Board of Directors with a determined terms and numbers of shares. Currently, the Company does not have any share repurchase program. Incremental costs directly attributable to the issue of new shares or options are recognized in stockholders’ equity as a deduction from the amount raised, net of taxes.

65
c) Remuneration to the Company’s stockholders
The Company's by-laws determine the minimum remuneration to stockholders of 25% of net income, after appropriations to legal reserve and tax incentive reserve, as follows: 2017
Net income of the year 5,507 Appropriation to legal reserve (275) Appropriation to tax incentive reserve (216)
Net income after appropriations to legal reserve and tax incentive reserve 5,016 Minimum mandatory remuneration (i) 1,475 Appropriation to investments reserve 3,541 (i) The minimum mandatory remuneration was based on interest on capital and will be paid in 2018, in the amount of US$0.28378015600 per share. Due to the Brazilian legislation, the Company must retain and collect the amount of withholding tax (15%) and cannot be considered when charging the interest on capital to the mandatory dividend.
On December 14, 2017, the Board of Directors approved the payment in advance of the stockholders’ remuneration in the gross amount of US$682 (R$2,183 million) based on the interest on capital, as an anticipation relating to 2017. The Board of Directors approved on February 26, 2018 (subsequent event), the complementary payment to the stockholders’ remuneration in the gross amount of US$793 (R$2,538 million) based on the interest on capital. Together, these resolutions comprise the minimum mandatory remuneration for the year ended December 31, 2017 that will be paid in March 2018. The remuneration paid to stockholders based on the on interest on capital during 2017 and 2016 amounted US$1,456 (US$0.282400343 per share) and US$250 (US$0.048511898 per share), respectively. All remuneration was based on interest on capital for those years.
d) Profit reserves The amount of profit reserves are distributed as follows:
Legal reserve
Tax incentive reserve
Investments
reserve Additional
remuneration reserve Total of profit
reserves
Balance as at December 31, 2015 985 - - - 985
Allocation of Income 204 377 1,808 634 3,023 Translation adjustment 195 - - - 195
Balance as at December 31, 2016 1,384 377 1,808 634 4,203
Allocation of Income 275 216 3,541 - 4,032 Dividends and interest on capital of Vale's stockholders - - - (658) (658) Translation adjustment (29) (13) (140) 24 (158)
Balance as at December 31, 2017 1,630 580 5,209 - 7,419
Legal reserve - Is a legal requirement for Brazilian public companies to retain 5% of the annual net income up to 20% of the capital. The reserve can only be used to compensate losses or to increase capital. Tax incentive reserve - Results from the option to designate a portion of the income tax for investments in projects approved by the Brazilian Government as well as tax incentives. Investment reserve - Aims to ensure the maintenance and development of the main activities that comprise the Company’s operations and to retain budgeted capital for investments. Based on the Company’s by-laws, this reserve is capped to 50% of the annual distributable net income, up to the amount of the share capital. The remaining balance over than 50% of the annual distributable net income is retained based on the capital investments budget submitted for approval in the Stockholder’s Meeting, pursuant to article 196 of the Law 6,404. Additional remuneration reserve - Arises from the remuneration proposed by Management that exceeds the mandatory minimum remuneration of 25% of the adjusted net income. On April 20, 2017, Stockholders approved the payment of the additional remuneration in relation to the year ended December 31, 2016.

66
e) Unrealized fair value gain (losses)
Retirement benefit obligations Cash flow hedge
Available-for-sale financial instruments Conversion shares Total gain (losses)
Balance as at December 31, 2015 (703) (6) (1) (282) (992)
Other comprehensive income (70) 7 1 - (62) Translation adjustment (36) (1) - (56) (93)
Balance as at December 31, 2016 (809) - - (338) (1,147)
Other comprehensive income (46) - - - (46) Translation adjustment 10 - - - 10
Balance as at December 31, 2017 (845) - - (338) (1,183)
f) Shareholders Agreement On the date of the merger of Valepar into Vale, August 14, 2017, the former Controlling Shareholders of Valepar executed a new shareholders’ agreement (“Vale Agreement”) that binds only 20% of the totality of Vale’s common shares issued by Vale, and will be in force until November 9, 2020, with no provision for renewal. For 6 months from the date of entry into force of the Vale Agreement, the Shareholders will be obligated not to transfer, by any means, either directly or indirectly, Vale shares they receive as a result of the implementation of the Proposal (“Lock-Up”), except for (i) the transfer of Vale’s shares by the Shareholders to their affiliates and their current shareholders, provided that such transferred shares shall remain subject to the Lock-Up, and (ii) the transfer of shares held by the Shareholders prior to the merger of Valepar. Accounting policy
Stockholder’s remuneration - The stockholder’s remuneration is paid on dividends and interest on capital. This remuneration is recognized as a liability in the financial statements of the Company based on bylaws. Any amount above the minimum mandatory remuneration approved by the by-laws shall only be recognized in current liabilities on the date that is approved by stockholders. The Company is permitted to distribute interest attributable to stockholders’ equity. The calculation is based on the stockholders’ equity amounts as stated in the statutory accounting records and the interest rate applied may not exceed the Brazilian Government Long-term Interest Rate (“TJLP”) determined by the Central Bank of Brazil. Also, such interest may not exceed 50% of the net income for the year or 50% of retained earnings plus profit reserves as determined by Brazilian corporate law. The benefit to the Company, as opposed to making a dividend payment, is a reduction in the income tax burden because this interest charge is tax deductible in Brazil. Income tax of 15% is withheld on behalf of the stockholders relative to the interest distribution. Under Brazilian law, interest attributed to stockholders’ equity is considered as part of the annual minimum mandatory dividend. This notional interest distribution is treated for accounting purposes as a deduction from stockholders' equity in a manner similar to a dividend and the tax deductibility recorded in the income statement.
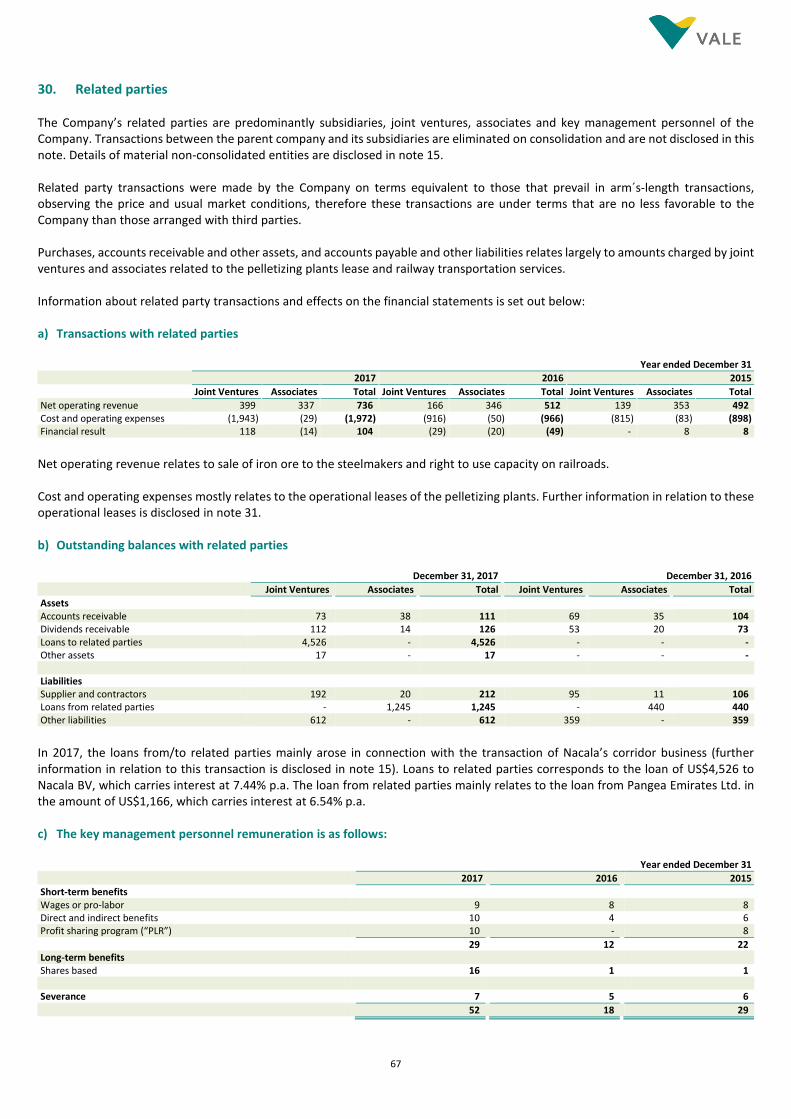
67
30. Related parties The Company’s related parties are predominantly subsidiaries, joint ventures, associates and key management personnel of the Company. Transactions between the parent company and its subsidiaries are eliminated on consolidation and are not disclosed in this note. Details of material non-consolidated entities are disclosed in note 15. Related party transactions were made by the Company on terms equivalent to those that prevail in arm´s-length transactions, observing the price and usual market conditions, therefore these transactions are under terms that are no less favorable to the Company than those arranged with third parties. Purchases, accounts receivable and other assets, and accounts payable and other liabilities relates largely to amounts charged by joint ventures and associates related to the pelletizing plants lease and railway transportation services. Information about related party transactions and effects on the financial statements is set out below: a) Transactions with related parties Year ended December 31
2017 2016 2015
Joint Ventures Associates Total Joint Ventures Associates Total Joint Ventures Associates Total
Net operating revenue 399 337 736 166 346 512 139 353 492 Cost and operating expenses (1,943) (29) (1,972) (916) (50) (966) (815) (83) (898) Financial result 118 (14) 104 (29) (20) (49) - 8 8
Net operating revenue relates to sale of iron ore to the steelmakers and right to use capacity on railroads. Cost and operating expenses mostly relates to the operational leases of the pelletizing plants. Further information in relation to these operational leases is disclosed in note 31. b) Outstanding balances with related parties December 31, 2017 December 31, 2016
Joint Ventures Associates Total Joint Ventures Associates Total
Assets Accounts receivable 73 38 111 69 35 104 Dividends receivable 112 14 126 53 20 73 Loans to related parties 4,526 - 4,526 - - - Other assets 17 - 17 - - -
Liabilities Supplier and contractors 192 20 212 95 11 106 Loans from related parties - 1,245 1,245 - 440 440 Other liabilities 612 - 612 359 - 359
In 2017, the loans from/to related parties mainly arose in connection with the transaction of Nacala’s corridor business (further information in relation to this transaction is disclosed in note 15). Loans to related parties corresponds to the loan of US$4,526 to Nacala BV, which carries interest at 7.44% p.a. The loan from related parties mainly relates to the loan from Pangea Emirates Ltd. in the amount of US$1,166, which carries interest at 6.54% p.a. c) The key management personnel remuneration is as follows: Year ended December 31
2017 2016 2015
Short‐term benefits Wages or pro‐labor 9 8 8 Direct and indirect benefits 10 4 6 Profit sharing program (“PLR”) 10 - 8
29 12 22 Long‐term benefits Shares based 16 1 1
Severance 7 5 6
52 18 29
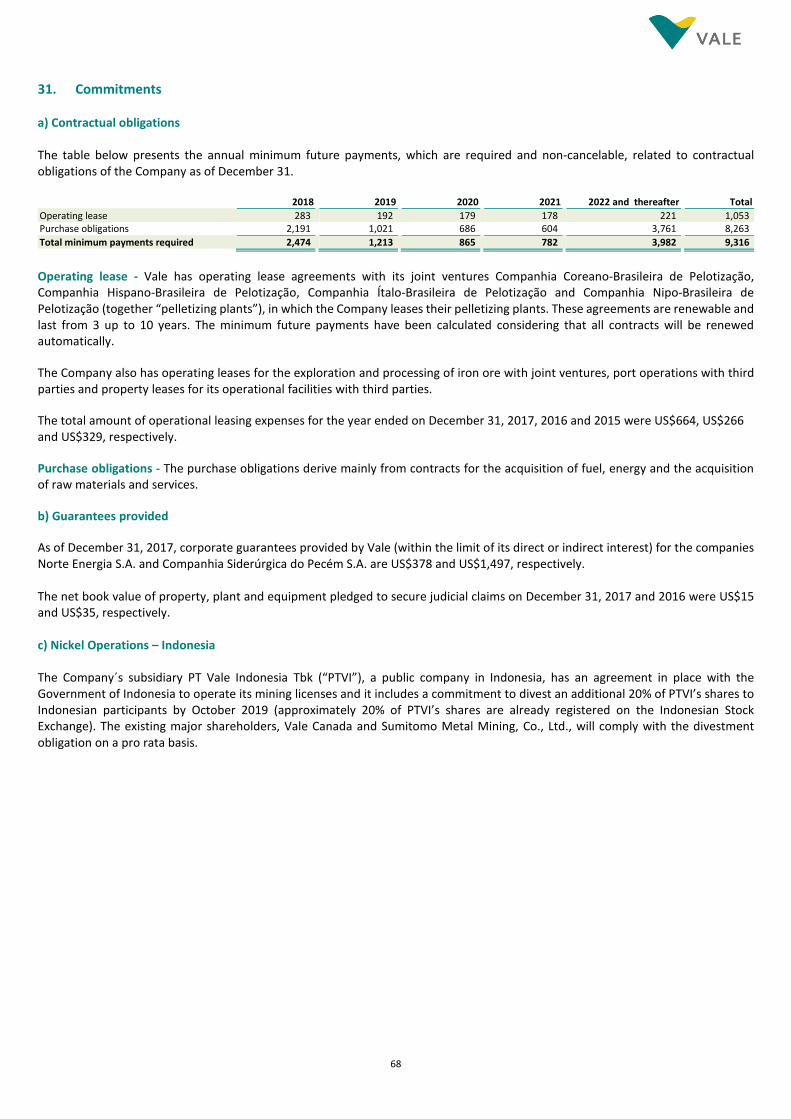
68
31. Commitments
a) Contractual obligations The table below presents the annual minimum future payments, which are required and non-cancelable, related to contractual obligations of the Company as of December 31. 2018 2019 2020 2021 2022 and thereafter Total
Operating lease 283 192 179 178 221 1,053 Purchase obligations 2,191 1,021 686 604 3,761 8,263
Total minimum payments required 2,474 1,213 865 782 3,982 9,316
Operating lease - Vale has operating lease agreements with its joint ventures Companhia Coreano-Brasileira de Pelotização, Companhia Hispano-Brasileira de Pelotização, Companhia Ítalo-Brasileira de Pelotização and Companhia Nipo-Brasileira de Pelotização (together “pelletizing plants”), in which the Company leases their pelletizing plants. These agreements are renewable and last from 3 up to 10 years. The minimum future payments have been calculated considering that all contracts will be renewed automatically.
The Company also has operating leases for the exploration and processing of iron ore with joint ventures, port operations with third parties and property leases for its operational facilities with third parties.
The total amount of operational leasing expenses for the year ended on December 31, 2017, 2016 and 2015 were US$664, US$266 and US$329, respectively.
Purchase obligations - The purchase obligations derive mainly from contracts for the acquisition of fuel, energy and the acquisition of raw materials and services.
b) Guarantees provided
As of December 31, 2017, corporate guarantees provided by Vale (within the limit of its direct or indirect interest) for the companies Norte Energia S.A. and Companhia Siderúrgica do Pecém S.A. are US$378 and US$1,497, respectively. The net book value of property, plant and equipment pledged to secure judicial claims on December 31, 2017 and 2016 were US$15 and US$35, respectively. c) Nickel Operations – Indonesia The Company´s subsidiary PT Vale Indonesia Tbk (“PTVI”), a public company in Indonesia, has an agreement in place with the Government of Indonesia to operate its mining licenses and it includes a commitment to divest an additional 20% of PTVI’s shares to Indonesian participants by October 2019 (approximately 20% of PTVI’s shares are already registered on the Indonesian Stock Exchange). The existing major shareholders, Vale Canada and Sumitomo Metal Mining, Co., Ltd., will comply with the divestment obligation on a pro rata basis.

69
32. Risk management Vale considers that an effective risk management is key to support the achievement of the company objectives and to ensure the financial strength and flexibility of the company and the business continuity. Therefore, Vale has developed its risk management strategy in order to provide an integrated approach of the risks the company is exposed to, considering not only the risks generated by variables traded in financial markets (market risk) and those arising from liquidity risk, but also the risk from counterparties obligations (credit risk) and those relating to inadequate or failed internal processes, people, systems or external events (operational risk), among others. a) Risk management policy The Board of Directors established a corporate risk management policy defining principles and guidelines applicable to this process in the company and the corresponding governance structure. This policy determines that corporate risks should be measured and monitored, regularly, in an integrated manner, in order to ensure that the company overall risk level remains aligned with its strategic guidelines. The Executive Risk Management Committee, created by the Board of Directors, is responsible for supporting the Executive Board in the risk management decisions, issuing opinions and recommendations. It is also responsible for the supervision and revision of the principles and instruments of corporate risk management. The Executive Board is responsible for the approval of the policy deployment into norms, rules and responsibilities and for reporting to the Board of Directors about such procedures. The risk management norms and instructions complement the corporate risk management policy and define practices, processes, controls, roles and responsibilities. The Company may, when necessary, allocate specific risk limits to management activities, including but not limited to, market risk limit, corporate and sovereign credit limit, in accordance with the acceptable corporate risk limit. b) Liquidity risk management The liquidity risk arises from the possibility that Vale might not perform its obligations on due dates, as well as face difficulties to meet its cash requirements due to market liquidity constraints. See note 20 "Loans, borrowing, cash and cash equivalents and financial investments" for details on the Company's liquidity risk. c) Credit risk management Vale’s exposure to credit risk arises from trade receivables, derivative transactions, guarantees, down payment for suppliers and cash investments. Our credit risk management process provides a framework for assessing and managing counterparties’ credit risk and for maintaining our risk at an acceptable level. (i) Commercial credit risk management See note 10 "Accounts receivables" for details on commercial credit risk. (ii) Treasury credit risk management To manage the credit exposure arising from cash investments and derivative instruments, credit limits are approved to each counterparty with whom we have credit exposure. Furthermore, we control the portfolio diversification and monitor different indicators of solvency and liquidity of the different counterparties that were approved for trading.

70
d) Market risk management Vale is exposed to the behavior of several market risk factors that can impact its cash flow. The assessment of this potential impact arising from the volatility of risk factors and their correlations is performed periodically to support the decision making process regarding the risk management strategy, that may incorporate financial instruments, including derivatives. The portfolio of these financial instruments is monitored on a monthly basis, enabling financial results surveillance and its impact on cash flow. Considering the nature of Vale’s business and operations, the main market risk factors which the Company is exposed to are: • Foreign exchange and interest rates; • Product prices and input costs. e) Foreign exchange and interest rate risk The company’s cash flow is subjected to volatility of several currencies, as its product are predominantly priced in US dollar, while most of the costs, disbursements and investments are denominated in other currencies, mainly Brazilian real and Canadian dollar. In order to reduce the potential impact that arises from this currency mismatch, derivatives instruments may be used as a risk mitigation strategy. Vale implements hedge transactions to protect its cash flow against the market risks that arises from its debt obligations – mainly currency volatility. The hedges cover most of the debts in Brazilian reais and euros. We use swap and forward transactions to convert debt linked to Brazilian real and Euros into US dollar, with volumes, flows and settlement dates similar to those of the debt instruments - or sometimes lower, subject to market liquidity conditions. Hedging instruments with shorter settlement dates are renegotiated through time so that their final maturity matches - or becomes closer - to the debts` final maturity. At each settlement date, the results of the swap and forward transactions partially offset the impact of the foreign exchange rate in Vale’s obligations, contributing to stabilize the cash disbursements in US dollar. Vale has also exposure to interest rates risks over loans and financings. The US Dollar floating rate debt in the portfolio consists mainly of loans including export pre-payments, commercial banks and multilateral organizations loans. In general, such debt instruments are indexed to the LIBOR (London Interbank Offer Rate) in US dollar. We take advantage of the potential correlation between commodity prices and U.S. dollar floating interest rates as a partial natural hedge for our cash flow. f) Risk of product and input prices Vale is also exposed to market risks including commodities price and input price volatilities. In accordance with risk management policy, risk mitigation strategies involving commodities can be used to adjust the cash flow risk profile and reduce Vale’s cash flow volatility. For this kind of risk mitigation strategy, Vale uses predominantly forwards, futures or zero-cost collars. g) Operational risk management The operational risk management is the structured approach that Vale uses to manage uncertainty related to possible inadequate or failure in internal processes, people, systems and external events, in accordance with the principles and guidelines of ISO 31000. The main operational risks are periodically monitored, ensuring the effectiveness of preventive and mitigating key controls in place and the execution of the risk treatment strategy (implementation of new or improved controls, changes in the risk environment, risk sharing by contracting insurance, provisioning of resources, etc.). Therefore, the Company seeks to have a clear view of its major risks, the best cost-benefit mitigation plans and the effectiveness of the controls in place, monitoring the potential impact of operational risk and allocating capital efficiently. h) Capital management The Company's policy aims at establishing a capital structure that will ensure the continuity of your business in the long term. Within this perspective, the Company has been able to deliver value to stockholders through dividend payments and capital gain, and at the same time maintain a debt profile suitable for its activities, with an amortization well distributed over the years, thus avoiding a concentration in one specific period.

71
i) Insurance Vale contracts several types of insurance policies, such as operational risk policy, engineering risks insurance (projects), civil responsibility, life insurance policy for their employees, among others. The coverage of these policies is similar to the ones used in general by the mining industry and is issued in line with the objectives defined by the Company, with the corporate risk management policy and the limitation imposed by the insurance and reinsurance global market. In general, the company's assets directly related with its operations are included in the coverage of insurance policies. Insurance management is performed with the support of existing insurance committees in the various operational areas of the Company. Among the management instruments, Vale uses captive reinsurance to balance the price on reinsurance contracts with the market, as well as, enable direct access to key international markets of insurance and reinsurance.
33. Additional information about derivatives financial instruments a) Sensitivity analysis of derivative financial instruments The following tables present the potential value of the instruments given hypothetical stress scenarios for the main market risk factors that impact the derivatives positions. The scenarios were defined as follows: Probable: the probable scenario was based on the estimated risk variables that were used on pricing the derivative instruments as at December 31, 2017 Scenario I: fair value estimated considering a 25% deterioration in the associated risk variables Scenario II: fair value estimated considering a 50% deterioration in the associated risk variables The curves used on the pricing of derivatives instruments were developed based on data from B3 S.A., Central Bank of Brazil, London Metals Exchange and Bloomberg.

72
b) Financial counterparties’ ratings The transactions of derivative instruments, cash and cash equivalents as well as investments are held with financial institutions whose exposure limits are periodically reviewed and approved by the delegated authority. The financial institutions credit risk is performed through a methodology that considers, among other information, ratings provided by international rating agencies. The table below presents the ratings in foreign currency published by agencies Moody’s and S&P regarding the main financial institutions that we had outstanding positions as of December 31, 2017.

73
c) Market curves (i) Products
(ii) Foreign exchange and interest rates
Maturity Price (US$/ton) Maturity Price (US$/ton) Maturity Price (US$/ton)SPOT 12,260 JUN18 12,833 DEC18 12,960
JAN18 12,725 JUL18 12,857 DEC19 13,167
FEB18 12,745 AUG18 12,878 DEC20 13,354
MAR18 12,767 SEP18 12,896 DEC21 13,454
APR18 12,789 OCT18 12,920
MAY18 12,812 NOV18 12,940
Maturity Price (US$/lb) Maturity Price (US$/lb) Maturity Price (US$/lb)SPOT 3.30 JUN18 3.30 DEC18 3.32
JAN18 3.28 JUL18 3.31 DEC19 3.33
FEB18 3.28 AUG18 3.31 DEC20 3.33
MAR18 3.29 SEP18 3.31 DEC21 3.33
APR18 3.29 OCT18 3.31
MAY18 3.30 NOV18 3.31
Maturity Price (US$/ton) Maturity Price (US$/ton) Maturity Price (US$/ton)SPOT 375 JUN18 374 DEC18 364
JAN18 376 JUL18 372 DEC19 303
FEB18 376 AUG18 371 DEC20 277
MAR18 376 SEP18 369 DEC21 255
APR18 375 OCT18 368
MAY18 375 NOV18 366
Nickel
Copper
Bunker Oil
Maturity Rate (% p.a.) Maturity Rate (% p.a.) Maturity Rate (% p.a.)01/02/18 2.86 11/01/18 2.77 01/04/21 3.19
02/01/18 4.04 12/03/18 2.71 04/01/21 3.22
03/01/18 3.27 01/02/19 2.82 07/01/21 3.26
04/02/18 2.96 04/01/19 2.85 10/01/21 3.31
05/02/18 2.84 07/01/19 2.91 01/03/22 3.42
06/01/18 2.78 10/01/19 2.94 04/01/22 3.43
07/02/18 2.73 01/02/20 3.02 07/01/22 3.44
08/01/18 2.72 04/01/20 3.03 10/03/22 3.48
09/03/18 2.69 07/01/20 3.06 01/02/23 3.60
10/01/18 2.71 10/01/20 3.13 07/03/23 3.65
Maturity Rate (% p.a.) Maturity Rate (% p.a.) Maturity Rate (% p.a.)1M 1.57 6M 1.83 11M 1.90
2M 1.62 7M 1.85 12M 1.90
3M 1.70 8M 1.87 2Y 2.11
4M 1.77 9M 1.88 3Y 2.23
5M 1.81 10M 1.89 4Y 2.29
Maturity Rate (% p.a.) Maturity Rate (% p.a.) Maturity Rate (% p.a.)01/02/18 7.00 11/01/18 7.00 01/04/21 7.00
02/01/18 7.00 12/03/18 7.00 04/01/21 7.00
03/01/18 7.00 01/02/19 7.00 07/01/21 7.00
04/02/18 7.00 04/01/19 7.00 10/01/21 7.00
05/02/18 7.00 07/01/19 7.00 01/03/22 7.00
06/01/18 7.00 10/01/19 7.00 04/01/22 7.00
07/02/18 7.00 01/02/20 7.00 07/01/22 7.00
08/01/18 7.00 04/01/20 7.00 10/03/22 7.00
09/03/18 7.00 07/01/20 7.00 01/02/23 7.00
10/01/18 7.00 10/01/20 7.00 07/03/23 7.00
US$-Brazil Interest Rate
US$ Interest Rate
TJLP

74
Maturity Rate (% p.a.) Maturity Rate (% p.a.) Maturity Rate (% p.a.)01/02/18 6.89 11/01/18 6.74 01/04/21 9.06
02/01/18 6.90 12/03/18 6.80 04/01/21 9.24
03/01/18 6.82 01/02/19 6.87 07/01/21 9.40
04/02/18 6.76 04/01/19 7.11 10/01/21 9.55
05/02/18 6.73 07/01/19 7.41 01/03/22 9.66
06/01/18 6.71 10/01/19 7.78 04/01/22 9.75
07/02/18 6.66 01/02/20 8.07 07/01/22 9.84
08/01/18 6.67 04/01/20 8.38 10/03/22 9.92
09/03/18 6.70 07/01/20 8.63 01/02/23 9.99
10/01/18 6.72 10/01/20 8.88 07/03/23 10.12
Maturity Rate (% p.a.) Maturity Rate (% p.a.) Maturity Rate (% p.a.)01/02/18 4.27 11/01/18 4.12 01/04/21 4.72
02/01/18 4.27 12/03/18 4.18 04/01/21 4.75
03/01/18 4.20 01/02/19 4.24 07/01/21 4.78
04/02/18 4.14 04/01/19 4.33 10/01/21 4.81
05/02/18 4.11 07/01/19 4.52 01/03/22 4.82
06/01/18 4.09 10/01/19 4.57 04/01/22 4.82
07/02/18 4.04 01/02/20 4.62 07/01/22 4.84
08/01/18 4.05 04/01/20 4.66 10/03/22 4.85
09/03/18 4.08 07/01/20 4.69 01/02/23 4.87
10/01/18 4.10 10/01/20 4.72 07/03/23 4.91
Maturity Rate (% p.a.) Maturity Rate (% p.a.) Maturity Rate (% p.a.)1M -0.41 6M -0.30 11M -0.26
2M -0.39 7M -0.29 12M -0.26
3M -0.38 8M -0.28 2Y -0.15
4M -0.34 9M -0.27 3Y 0.01
5M -0.32 10M -0.27 4Y 0.15
Maturity Rate (% p.a.) Maturity Rate (% p.a.) Maturity Rate (% p.a.)1M 1.45 6M 1.73 11M 0.99
2M 1.48 7M 1.49 12M 0.91
3M 1.55 8M 1.31 2Y 2.09
4M 1.64 9M 1.19 3Y 2.22
5M 1.70 10M 1.07 4Y 2.30
CAD/US$ 0.7961 US$/BRL 3.3080 EUR/US$ 1.1953
BRL Interest Rate
Currencies - Ending rates
Implicit Inflation (IPCA)
EUR Interest Rate
CAD Interest Rate