financial statements - jaguar land rover - annual report...
TRANSCRIPT

72 JAGUAR LAND ROVER AUTOMOTIVE PLC Annual Report 2015–16
FINANCIAL STATEMENTSIN THIS SECTIONIndependent Auditor’s report 74Consolidated financial statements 75Notes to the consolidated financial statements 79Parent Company financial statements 126Notes to the parent Company financial statements 129

Overview IFC–19
Strategic report 20–59
Governance 60–71
Financial statements 72–IBC 73
74 JAGUAR LAND ROVER AUTOMOTIVE PLC Annual Report 2015–16
We have audited the financial statements of Jaguar Land Rover Automotive plc for the year ended 31 March 2016 which comprise of the Consolidated Income Statement, the Consolidated Statement of Comprehensive Income, the Consolidated and Parent Company Balance Sheets, the Consolidated and Parent Company Cash Flow Statements, the Consolidated and Parent Company Statements of Changes in Equity and the related notes 1 to 56. The financial reporting framework that has been applied in their preparation is applicable law and International Financial Reporting Standards (IFRSs) as adopted by the European Union and, as regards the parent Company financial statements, as applied in accordance with the provisions of the Companies Act 2006.
This report is made solely to the Company’s members, as a body, in accordance with Chapter 3 of Part 16 of the Companies Act 2006. Our audit work has been undertaken so that we might state to the Company’s members those matters we are required to state to them in an auditor’s report and for no other purpose. To the fullest extent permitted by law, we do not accept or assume responsibility to anyone other than the Company and the Company’s members as a body, for our audit work, for this report, or for the opinions we have formed.
RESPECTIVE RESPONSIBILITIES OF DIRECTORS AND AUDITORAs explained more fully in the Directors’ Responsibilities Statement, the directors are responsible for the preparation of the financial statements and for being satisfied that they give a true and fair view. Our responsibility is to audit and express an opinion on the financial statements in accordance with applicable law and International Standards on Auditing (UK and Ireland). Those standards require us to comply with the Auditing Practices Board’s Ethical Standards for Auditors.
SCOPE OF THE AUDIT OF THE FINANCIAL STATEMENTSAn audit involves obtaining evidence about the amounts and disclosures in the financial statements sufficient to give reasonable assurance that the financial statements are free from material misstatement, whether caused by fraud or error. This includes an assessment of: whether the accounting policies are appropriate to the Group’s and the parent Company’s circumstances and have been consistently applied and adequately disclosed; the reasonableness of significant accounting estimates made by the directors; and the overall presentation of the financial statements. In addition, we read all the financial and non-financial information in the Annual Report to identify material inconsistencies with the audited financial statements and to identify any information that is apparently materially incorrect based on, or materially inconsistent with, the knowledge acquired by us in the course of performing the audit. If we become aware of any apparent material misstatements or inconsistencies we consider the implications for our report.
OPINION ON FINANCIAL STATEMENTSIn our opinion:
• The financial statements give a true and fair view of the state of the Group’s and of the parent Company’s affairs as at 31 March 2016 and of the Group’s profit for the year then ended;
• The consolidated financial statements have been properly prepared in accordance with IFRSs as adopted by the European Union;
• The parent Company financial statements have been properly prepared in accordance with IFRSs as adopted by the European Union and as applied in accordance with the provisions of the Companies Act 2006; and
• The financial statements have been prepared in accordance with the requirements of the Companies Act 2006.
SEPARATE OPINION IN RELATION TO IFRSS AS ISSUED BY THE IASBAs explained in note 2 to the consolidated financial statements, the Group in addition to applying IFRSs as adopted by the European Union, has also applied IFRSs as issued by the International Accounting Standards Board (IASB).
In our opinion the consolidated financial statements comply with IFRSs as issued by the IASB.
OPINION ON OTHER MATTER PRESCRIBED BY THE COMPANIES ACT 2006In our opinion the information given in the Strategic report and the Governance report for the financial year for which the financial statements are prepared is consistent with the financial statements.
MATTERS ON WHICH WE ARE REQUIRED TO REPORT BY EXCEPTIONWe have nothing to report in respect of the following matters where the Companies Act 2006 requires us to report to you if, in our opinion:
• Adequate accounting records have not been kept by the parent Company, or returns adequate for our audit have not been received from branches not visited by us; or
• The parent Company financial statements are not in agreement with the accounting records and returns; or
• Certain disclosures of directors’ remuneration specified by law are not made; or
• We have not received all the information and explanations we require for our audit.
Richard Knights (Senior statutory auditor) for and on behalf of Deloitte LLPChartered Accountants and Statutory Auditor Birmingham, UK
18 July 2016
INDEPENDENT AUDITOR’S REPORT TO THE MEMBERS OF JAGUAR LAND ROVER AUTOMOTIVE PLC

Overview IFC–19
Strategic report 20–59
Governance 60–71
Financial statements 72–IBC 75
Note2016
£m2015
£m2014
£m
Revenue 4 22,208 21,866 19,386Material cost of sales excluding exceptional item (13,146) (13,185) (11,904)Exceptional item 3 (157) – –Material and other cost of sales 5 (13,303) (13,185) (11,904)Employee cost 6 (2,321) (1,977) (1,654)Other expenses 9 (4,674) (4,109) (3,717)Development costs capitalised 10 1,242 1,158 1,030Other income 128 143 153Depreciation and amortisation (1,418) (1,051) (875)Foreign exchange (loss)/gain (317) (138) 236Finance income 11 38 48 38Finance expense (net) 11 (90) (135) (185)Share of profit/(loss) of equity accounted investments 14 64 (6) (7)Profit before tax 12 1,557 2,614 2,501Income tax excluding tax on exceptional item (293) (576) (622)Tax on exceptional item 3 48 – –Income tax expense 13 (245) (576) (622)Profit for the year 1,312 2,038 1,879
Note2016
£m2015
£m2014
£m
Profit for the year 1,312 2,038 1,879Items that will not be reclassified subsequently to profit or loss:Remeasurement of defined benefit obligation 31 489 (355) (135)Income tax related to items that will not be reclassified 13, 19 (113) 71 (4) 376 (284) (139)Items that may be reclassified subsequently to profit or loss:(Loss)/gain on effective cash flow hedges 34 (169) (1,768) 1,041Cash flow hedges reclassified to ‘Foreign exchange (loss)/gain’ in profit or loss 34 224 (44) (112)Currency translation differences (1) 21 –Income tax related to items that may be reclassified 13, 19 (18) 363 (194) 36 (1,428) 735Other comprehensive income/(expense) net of tax 412 (1,712) 596Total comprehensive income attributable to shareholders 1,724 326 2,475
CONSOLIDATED STATEMENT OF COMPREHENSIVE INCOMEFOR THE YEAR ENDED 31 MARCH
CONSOLIDATED INCOME STATEMENTFOR THE YEAR ENDED 31 MARCH

76 JAGUAR LAND ROVER AUTOMOTIVE PLC Annual Report 2015–16
Note2016
£m2015
£m2014
£m
Non-current assetsInvestments 14 339 280 145Other financial assets 15 185 49 473Property, plant and equipment 16 5,175 4,474 3,184Intangible assets 17 5,497 4,952 4,240Other non-current assets 18 45 26 33Deferred tax assets 19 354 372 284Total non-current assets 11,595 10,153 8,359Current assetsCash and cash equivalents 20 3,399 3,208 2,260Short-term deposits 1,252 1,055 1,199Trade receivables 1,078 1,112 831Other financial assets 15 137 214 392Inventories 22 2,685 2,416 2,174Other current assets 18 411 396 355Current tax assets 10 9 19Total current assets 8,972 8,410 7,230Total assets 20,567 18,563 15,589Current liabilitiesAccounts payable 23 5,758 5,450 4,787Short-term borrowings 24 116 156 167Other financial liabilities 25 962 923 277Provisions 26 555 485 395Other current liabilities 27 427 374 395Current tax liabilities 57 69 113Total current liabilities 7,875 7,457 6,134Non-current liabilitiesLong-term borrowings 24 2,373 2,381 1,843Other financial liabilities 25 817 842 69Provisions 26 733 639 582Retirement benefit obligation 31 567 887 674Other non-current liabilities 27 204 118 77Deferred tax liabilities 19 384 199 346Total non-current liabilities 5,078 5,066 3,591Total liabilities 12,953 12,523 9,725Equity attributable to shareholdersOrdinary shares 28 1,501 1,501 1,501Capital redemption reserve 28 167 167 167Reserves 29 5,946 4,372 4,196Equity attributable to shareholders 7,614 6,040 5,864Total liabilities and equity 20,567 18,563 15,589
These consolidated financial statements were approved by the Board of Directors and authorised for issue on 18 July 2016. They were signed on its behalf by:
Dr. Ralf SpethChief Executive OfficerCompany registered number: 06477691
CONSOLIDATED BALANCE SHEETFOR THE YEAR ENDED 31 MARCH

Overview IFC–19
Strategic report 20–59
Governance 60–71
Financial statements 72–IBC 77
Ordinary share capital
£m
Capital redemption
reserve £m
Other reserves
£m
Total equity
£m
Balance at 1 April 2015 1,501 167 4,372 6,040Profit for the year – – 1,312 1,312Other comprehensive income for the year – – 412 412Total comprehensive income – – 1,724 1,724Dividend paid – – (150) (150)Balance at 31 March 2016 1,501 167 5,946 7,614
Balance at 1 April 2014 1,501 167 4,196 5,864Profit for the year – – 2,038 2,038Other comprehensive expense for the year – – (1,712) (1,712)Total comprehensive income – – 326 326Dividend paid – – (150) (150)Balance at 31 March 2015 1,501 167 4,372 6,040
Balance at 1 April 2013 1,501 167 1,871 3,539Profit for the year – – 1,879 1,879Other comprehensive income for the year – – 596 596Total comprehensive income – – 2,475 2,475Dividend paid – – (150) (150)Balance at 31 March 2014 1,501 167 4,196 5,864
CONSOLIDATED STATEMENT OF CHANGES IN EQUITY

78 JAGUAR LAND ROVER AUTOMOTIVE PLC Annual Report 2015–16
Note2016
£m2015
£m2014
£m
Cash flows from operating activitiesCash generated from operations 38 3,726 4,016 3,824Income tax paid (166) (389) (402)Net cash generated from operating activities 3,560 3,627 3,422Cash flows (used in)/from investing activitiesInvestment in equity accounted investments – (124) (92)Investment in other restricted deposits (30) (12) (13)Redemption of other restricted deposits 27 19 146Movements in other restricted deposits (3) 7 133Investment in short-term deposits (4,147) (2,807) (2,729)Redemption of short-term deposits 3,961 3,002 2,265Movements in short-term deposits (186) 195 (464)Purchases of property, plant and equipment 38 (1,422) (1,564) (1,201)Proceeds from sale of property, plant and equipment – 3 4Cash paid for intangible assets 38 (1,384) (1,206) (1,155)Finance income received 40 48 39Acquisition of subsidiary 36 (11) – –Net cash used in investing activities (2,966) (2,641) (2,736)Cash flows (used in)/from financing activitiesFinance expenses and fees paid (142) (230) (269)Proceeds from issuance of short-term borrowings 551 592 526Repayment of short-term borrowings (599) (623) (683)Proceeds from issuance of long-term borrowings – 1,032 829Repayment of long-term borrowings (58) (653) (746)Payments of lease obligations (5) (6) (5)Dividends paid (150) (150) (150)Net cash used in financing activities (403) (38) (498)Net increase in cash and cash equivalents* 191 948 188Cash and cash equivalents at beginning of year 20 3,208 2,260 2,072Cash and cash equivalents at end of year 20 3,399 3,208 2,260
* Included in ‘Net increase in cash and cash equivalents’ is an increase of £4 million (2015: increase of £52 million, 2014: decrease of £111 million) arising from the impact of foreign exchange rate changes on cash and cash equivalents.
CONSOLIDATED CASH FLOW STATEMENTFOR THE YEAR ENDED 31 MARCH

Overview IFC–19
Strategic report 20–59
Governance 60–71
Financial statements 72–IBC 79
1 BACKGROUND AND OPERATIONSJaguar Land Rover Automotive PLC (‘the Company’) and its subsidiaries, (collectively referred to as ‘the Group’ or ‘JLR’), designs, manufactures and sells a wide range of automotive vehicles. The Company is a public limited company incorporated and domiciled in the UK. The address of its registered office is Abbey Road, Whitley, Coventry, CV3 4LF, United Kingdom.
The Company is a subsidiary of Tata Motors Limited, India and acts as an intermediate holding company for the Jaguar Land Rover business. The principal activity during the year was the design, development, manufacture and marketing of high-performance luxury saloons, specialist sports cars and four-wheel-drive off-road vehicles.
These consolidated financial statements have been prepared in Pound Sterling (‘GBP’) and rounded to the nearest million GBP (£ million) unless otherwise stated. Results for the year ended and as at 31 March 2014 have been disclosed solely for the information of the users.
2 ACCOUNTING POLICIESSTATEMENT OF COMPLIANCEThese consolidated and parent Company financial statements have been prepared in accordance with International Financial Reporting Standards (referred to as ‘IFRS’) and IFRS Interpretation Committee (‘IFRS IC’) interpretations as adopted by the European Union (‘EU’) and the requirements of the United Kingdom Companies Act 2006 applicable to companies reporting under IFRS. In addition, these consolidated financial statements also comply with IFRS as adopted by the International Accounting Standards Board (‘IASB’) as no differences exist between IFRS as adopted by the EU applied by the Group and IFRS issued by the IASB.
The Company has taken advantage of section 408 of the Companies Act 2006 and, therefore, the separate financial statements of the Company do not include the income statement or the statement of comprehensive income of the Company on a stand-alone basis.
BASIS OF PREPARATION The consolidated financial statements have been prepared on a historical cost basis except for certain financial instruments which are measured at fair value. Historical cost is generally based on the fair value of the consideration given in exchange for the assets. The principal accounting policies adopted are set out below.
GOING CONCERN The directors have considered the financial position of the Group at 31 March 2016 (net assets of £7,614 million (2015: £6,040 million, 2014: £5,864 million)) and the projected cash flows and financial performance of the Group for at least 12 months from the date of approval of these financial statements as well as planned cost and cash improvement actions, and believe that the plan for sustained profitability remains on course.
The directors have taken actions to ensure that appropriate long-term cash resources are in place at the date of signing the accounts to fund Group operations. The directors have reviewed the financial covenants linked to the borrowings in place and believe these will not be breached at any point and that all debt repayments will be met.
Therefore, the directors consider, after making appropriate enquiries and taking into consideration the risks and uncertainties facing the Group, that the Group has adequate resources to continue in operation as a going concern for the foreseeable future and is able to meet its financial covenants linked to the borrowings in place. Accordingly the directors continue to adopt the going concern basis in preparing these consolidated financial statements.
BASIS OF CONSOLIDATIONSUBSIDIARIESThe consolidated financial statements include Jaguar Land Rover Automotive plc and its subsidiaries. Subsidiaries are entities controlled by the Company. Control exists when the Company has power over the investee, is exposed or has rights to variable return from its involvement with the investee and has the ability to use its power to affect its returns. In assessing control, potential voting rights that currently are exercisable are taken into account. All subsidiaries of the Group given in note 42 to the parent Company financial statements are included in the consolidated financial statements.
Intercompany transactions and balances including unrealised profits are eliminated in full on consolidation.
ASSOCIATES AND JOINT VENTURES (EQUITY ACCOUNTED INVESTMENTS)Associates are those entities in which the Group has significant influence, but not control or joint control. Significant influence is the power to participate in the financial and operating policy decisions of the investee and is presumed to exist when the Group holds between 20 and 50 per cent of the voting power of another entity. Joint ventures are those entities over whose activities the Group has joint control, established by contractual agreement and requiring unanimous consent for decisions about the relevant activities of the entity, being those activities that significantly affect the entity’s returns.
NOTES TO THE CONSOLIDATED FINANCIAL STATEMENTS

80 JAGUAR LAND ROVER AUTOMOTIVE PLC Annual Report 2015–16
2 ACCOUNTING POLICIES (CONTINUED)Associates and joint ventures are accounted for using the equity method and are recognised initially at cost. The Group’s investments include goodwill identified on acquisition, net of any accumulated impairment losses. The consolidated financial statements include the Group’s share of the income and expenses, other comprehensive income and equity movements of equity accounted investments, from the date that significant influence or joint control commences until the date that significant influence or joint control ceases. When the Group’s share of losses exceeds its interest in an equity accounted investment, the carrying amount of that interest (including any long-term investments) is reduced to nil and the recognition of further losses is discontinued except to the extent that the Group has an obligation or has made payments on behalf of the investee.
When the Group transacts with an associate or joint venture of the Group, profits and losses are eliminated to the extent of the Group’s interest in its associate or joint venture.
USE OF ESTIMATES AND JUDGEMENTSThe preparation of financial statements in conformity with IFRS requires the use of certain critical accounting estimates. It also requires management to exercise its judgement in the process of applying the Group’s accounting policies. The areas involving a higher degree of judgement or complexity, or areas where assumptions and estimates are significant to the consolidated financial statements are as follows:
(i) Note 16 – Property, plant and equipment – the Group applies judgement in determining the estimate useful life of assets.
(ii) Note 17 – Intangible assets – management applies significant judgement in establishing the applicable criteria for capitalisation of appropriate product development costs and impairment of indefinite life intangible assets. The key judgements in the impairment assessment include the determination of cash-generating units, value of cash flows and appropriateness of discount rates.
(iii) Note 19 – Deferred tax – management applies judgement in establishing the timing of the recognition of deferred tax assets relating to historic losses, assessing the recoverability of those assets and estimating taxes ultimately payable on remittance of overseas earnings.
(iv) Note 26 – Provision for product warranty – it is necessary for the Group to assess the provision for anticipated lifetime warranty and campaign costs. The valuation of warranty and campaign provisions requires a significant amount of judgement and the requirement to form appropriate assumptions around expected future costs.
(v) Note 31 – Retirement benefit obligation – it is necessary for actuarial assumptions to be made, including discount and mortality rates and the long-term rate of return upon scheme assets. The Group engages a qualified actuary to assist with determining the assumptions to be made when evaluating these liabilities.
(vi) Note 34 – Financial instruments – the Group enters into complex financial instruments and therefore appropriate accounting for these requires judgement around the valuations.
REVENUE RECOGNITIONRevenue comprises the amounts invoiced to customers outside the Group and is measured at fair value of the consideration received or receivable, net of discounts, sales incentives, customer bonuses and rebates granted, which can be identified at the point of sale. Revenue is presented net of excise duty where applicable and other indirect taxes.
Revenue is recognised when the significant risks and rewards of ownership have been transferred to the customer and the amount of revenue can be reliable measured with it being probable that future economic benefits will flow to the Group. The transfer of the significant risks and rewards is defined in the underlying agreements with the customer.
No sale is recognised where, following disposal of significant risks and rewards, the Group retains a significant financial interest. The Group’s interest in these items is retained in inventory, with a creditor being recognised for the contracted buy-back price. Income under such agreements, measured as the difference between the initial sale price and the buyback price, is recognised on a straight-line basis over the term of the agreement. The corresponding costs are recognised over the term of the agreement based on the difference between the item’s cost, including estimated costs of resale, and the expected net realisable value.
If a sale includes an agreement for subsequent servicing or maintenance, the fair value of that service is deferred and recognised as income over the relevant service period in proportion with the expected cost pattern of the agreement.
NOTES TO THE CONSOLIDATED FINANCIAL STATEMENTS CONTINUED

Overview IFC–19
Strategic report 20–59
Governance 60–71
Financial statements 72–IBC 81
2 ACCOUNTING POLICIES (CONTINUED)COST RECOGNITION Costs and expenses are recognised when incurred and are classified according to their nature.
Expenditures are capitalised where appropriate in accordance with the policy for internally generated intangible assets and represent employee costs, stores and other manufacturing supplies, and other expenses incurred for product development undertaken by the Group.
GOVERNMENT GRANTS AND INCENTIVESGovernment grants are recognised when there is reasonable assurance that the Group will comply with the relevant conditions and the grant will be received.
Government grants are recognised in the consolidated income statement on a systematic basis when the Group recognises, as expenses, the related costs that the grants are intended to compensate.
Government grants related to assets are deducted from the cost of the asset and amortised over the useful life of the asset. Government grants related to income are presented as an offset against the related expenditure and Government grants which are awarded as incentives with no ongoing performance obligations to the Group are recognised as other income in the period the grant is received.
Sales tax incentives received from governments are recognised in the consolidated income statement at the reduced tax rate and revenue is reported net of these sales tax incentives.
FOREIGN CURRENCYThe Company has a functional currency of GBP. The presentation currency of the consolidated financial statements is GBP.
The functional currency of the UK and non-UK selling operations is GBP being the primary economic environment that influences these operations. This is on the basis that management control is in the UK and that GBP is the currency that primarily determines sales prices and is the main currency for the retention of operating income. The functional currency of the Chery Jaguar Land Rover Automotive Co. Ltd., the Group’s principal joint venture, is Chinese Yuan (‘CNY’). The functional currency of Jaguar Land Rover Slovakia s.r.o is Euro.
Transactions in foreign currencies are recorded at the exchange rate prevailing on the date of transaction. Foreign currency denominated monetary assets and liabilities are remeasured into the functional currency at the exchange rate prevailing on the balance sheet date. Exchange differences are recognised in the consolidated income statement as ‘Foreign exchange (loss)/gain’.
For the purposes of presenting consolidated financial statements, the assets and liabilities of the Group’s foreign operations (non-GBP functional currency) are translated at exchange rates prevailing on the balance sheet date. Income and expense items are translated at the average exchange rates for the period. Exchange differences arising, if any, are recognised in other comprehensive income and accumulated in equity.
INCOME TAXES Income tax expense comprises current and deferred taxes. Income tax expense is recognised in the consolidated income statement, except when related to items that are recognised outside of profit or loss (whether in other comprehensive income or directly in equity, whereby tax is also recognised outside of profit or loss), or where related to the initial accounting for a business combination. In the case of a business combination the tax effect is included in the accounting for the business combination.
Current income taxes are determined based on respective taxable income of each taxable entity and tax rules applicable for respective tax jurisdictions.
Deferred tax assets and liabilities are recognised for the future tax consequences of temporary differences between the carrying values of assets and liabilities and their respective tax bases, and unutilised business loss and depreciation carry-forwards and tax credits. Such deferred tax assets and liabilities are computed separately for each taxable entity and for each taxable jurisdiction. Deferred tax assets are recognised to the extent that it is probable that future taxable income will be available against which the deductible temporary differences, unused tax losses, depreciation carry-forwards and unused tax credits could be utilised.
Deferred tax assets and liabilities are measured based on the tax rates that are expected to apply in the year when the asset is realised or the liability is settled, based on tax rates and tax laws that have been enacted or substantively enacted by the balance sheet date.
Deferred tax assets and liabilities are offset when there is a legally enforceable right to set off current tax assets against current tax liabilities and when they relate to income taxes levied by the same taxation authority and the Group intends to settle its current tax assets and liabilities on a net basis.
EXCEPTIONAL ITEMSExceptional items by virtue of their nature, size or frequency are disclosed separately on the face of the consolidated income statement where this enhances understanding of the Group’s performance.

82 JAGUAR LAND ROVER AUTOMOTIVE PLC Annual Report 2015–16
2 ACCOUNTING POLICIES (CONTINUED)PROPERTY, PLANT AND EQUIPMENTProperty, plant and equipment is stated at cost of acquisition or construction less accumulated depreciation and accumulated impairment, if any.
Cost includes purchase price, non-recoverable taxes and duties, labour cost and direct overheads for self-constructed assets and other direct costs incurred up to the date the asset is ready for its intended use.
Interest cost incurred for constructed assets is capitalised up to the date the asset is ready for its intended use, based on borrowings incurred specifically for financing the asset or the weighted average rate of all other borrowings, if no specific borrowings have been incurred for the asset.
Depreciation is provided on a straight-line basis over the estimated useful lives of the assets. Estimated useful lives of the assets are as follows:
Class of property, plant and equipment Estimated useful life (years)
Buildings 20 to 40Plant and equipment 3 to 30Computers 3 to 6Vehicles 3 to 10Furniture and fixtures 3 to 20
Assets held under finance leases are depreciated over their expected useful lives on the same basis as owned assets or, where shorter, the term of the relevant lease. Freehold land is measured at cost and is not depreciated. Heritage assets are not depreciated as they are considered to have a residual value in excess of cost. Residual values are re-assessed on an annual basis.
Depreciation is not recorded on assets under construction until construction and installation is complete and the asset is ready for its intended use. Assets under construction include capital prepayments.
INTANGIBLE ASSETS ACQUIRED INTANGIBLE ASSETSIntangible assets purchased, including those acquired in business combinations, are measured at acquisition cost which is the fair value on the date of acquisition, where applicable, less accumulated amortisation and accumulated impairment, if any. Intangible assets with indefinite lives are reviewed annually to determine whether an indefinite-life assessment continues to be supportable. If not, the change in the useful-life assessment from indefinite to finite is made on a prospective basis.
For intangible assets with definite lives, amortisation is provided on a straight-line basis over the estimated useful lives of the acquired intangible assets as per the estimated amortisation periods below:
Class of intangible asset Estimated amortisation period (years)
Patents and technological know-how 2 to 12Customer-related – dealer network 20Software 2 to 8Intellectual property rights and other intangibles Indefinite life
The amortisation for intangible assets with finite useful lives is reviewed at least at each year-end. Changes in expected useful lives are treated as changes in accounting estimates.
Capital-work-in-progress includes capital advances.
Customer-related intangibles acquired in a business combination consist of dealer networks.
Intellectual property rights and other intangibles consist of brand names, which are considered to have indefinite lives due to the longevity of the brands.
NOTES TO THE CONSOLIDATED FINANCIAL STATEMENTS CONTINUED

Overview IFC–19
Strategic report 20–59
Governance 60–71
Financial statements 72–IBC 83
2 ACCOUNTING POLICIES (CONTINUED)INTERNALLY GENERATED INTANGIBLE ASSETS Research costs are charged to the consolidated income statement in the year in which they are incurred.
Product development costs incurred on new vehicle platforms, engines, transmission and new products are recognised as intangible assets, when feasibility has been established, the Group has committed technical, financial and other resources to complete the development and it is probable that the asset will generate future economic benefits.
The costs capitalised include the cost of materials, direct labour and directly attributable overhead expenditure incurred up to the date the asset is available for use.
Interest cost incurred is capitalised up to the date the asset is ready for its intended use, based on borrowings incurred specifically for financing the asset or the weighted average rate of all other borrowings if no specific borrowings have been incurred for the asset.
Product development cost is amortised over a period of between two and ten years.
Capitalised development expenditure is measured at cost less accumulated amortisation and accumulated impairment loss.
Amortisation is not recorded on product development in progress until development is complete.
IMPAIRMENT PROPERTY, PLANT AND EQUIPMENT AND OTHER INTANGIBLE ASSETSAt each balance sheet date, the Group assesses whether there is any indication that any property, plant and equipment and intangible assets may be impaired. If any such impairment indicator exists the recoverable amount of an asset is estimated to determine the extent of impairment, if any. Where it is not possible to estimate the recoverable amount of an individual asset, the Group estimates the recoverable amount of the cash-generating unit to which the asset belongs.
Intangible assets with indefinite useful lives and intangible assets not yet available for use are tested for impairment annually, or earlier, if there is an indication that the asset may be impaired.
The estimated recoverable amount is the higher of fair value less costs of disposal and value in use. In assessing value in use, the estimated future cash flows are discounted to their present value using a pre-tax discount rate that reflects current market assessments of the time value of money and the risks specific to the asset for which the estimates of future cash flows have not been adjusted.
If the recoverable amount of an asset (or cash-generating unit) is estimated to be less than its carrying amount, the carrying amount of the asset (or cash-generating unit) is reduced to its recoverable amount. An impairment loss is recognised immediately in the consolidated income statement.
An annual impairment review for heritage assets is performed and any impairment in the carrying value is recognised immediately in the consolidated income statement.
EQUITY ACCOUNTED INVESTMENTS: JOINT VENTURES AND ASSOCIATESThe requirements of IAS 39 Financial Instruments: Recognition and Measurement are applied to determine whether it is necessary to recognise any impairment loss with respect to the Group’s investment in an associate or joint venture. When necessary, the entire carrying amount of the investment (including goodwill) is tested for impairment in accordance with IAS 36 Impairment of Assets as a single asset by comparing its recoverable amount (the higher of value in use and fair value less costs of disposal) with its carrying amount. Any impairment loss recognised forms part of the carrying amount of the investment. Any reversal of that impairment loss is recognised in accordance with IAS 36 to the extent that the recoverable amount of the investment subsequently increases.
CASH AND CASH EQUIVALENTSCash and cash equivalents comprise cash on hand, demand deposits and highly liquid investments with an original maturity of up to three months that are readily convertible into known amounts of cash and which are subject to insignificant risk of changes in value.
INVENTORIESInventories are valued at the lower of cost and net realisable value. Cost of raw materials and consumables are ascertained on a first-in, first-out basis. Costs, including fixed and variable production overheads, are allocated to work-in-progress and finished goods determined on a full absorption cost basis. Net realisable value is the estimated selling price in the ordinary course of business less estimated cost of completion and selling expenses.
Inventories include vehicles sold subject to repurchase arrangements. These vehicles are carried at cost to the Group and are amortised in changes in stocks and work-in-progress to their residual values (i.e. estimated second-hand sale value) over the term of the arrangement.

84 JAGUAR LAND ROVER AUTOMOTIVE PLC Annual Report 2015–16
2 ACCOUNTING POLICIES (CONTINUED)PROVISIONS A provision is recognised if, as a result of a past event, the Group has a present legal or constructive obligation that can be estimated reliably, and it is probable that an outflow of economic benefits will be required to settle the obligation. Provisions are held for product warranties, legal and product liabilities, residual risks and environmental risks as detailed in note 26 to the consolidated financial statements.
LONG-TERM INCENTIVE PLAN (‘LTIP’)The Group operates a LTIP arrangement for certain employees. The scheme provides a cash payment to the employee based on a specific number of phantom shares at grant date and the share price of Tata Motors Limited at the vesting date, subject to profitability and employment conditions. These are accounted for as cash-settled arrangements, whereby a liability is recognised at fair value at the date of grant, using a Black-Scholes model. At each balance sheet date until the liability is settled, the fair value of the liability is remeasured, with any changes in fair value recognised in the consolidated income statement.
LEASESAt the inception of a lease, the lease arrangement is classified as either a finance lease or an operating lease, based on the terms and substance of the lease arrangement.
ASSETS TAKEN ON FINANCE LEASEA finance lease is recognised as an asset and a liability at the commencement of the lease, at the lower of the fair value of the asset and the present value of the minimum lease payments. Initial direct costs, if any, are also capitalised and, subsequent to initial recognition, the asset is accounted for in accordance with the accounting policy applicable to that asset. Minimum lease payments made under finance leases are apportioned between the finance expense and the reduction of the outstanding liability. The finance expense is allocated to each year during the lease term so as to produce a constant periodic rate of interest on the remaining balance of the liability.
ASSETS TAKEN ON OPERATING LEASELeases other than finance leases are operating leases, and the leased assets are not recognised on the Group’s balance sheet. Payments made under operating leases are recognised in the consolidated income statement on a straight-line basis over the term of the lease in ‘Other expenses’.
EMPLOYEE BENEFITSPENSION PLANSThe Group operates several defined benefit pension plans, which were previously contracted out of the second state pension scheme until 5 April 2016. The assets of the plans are held in separate trustee administered funds. The plans provide for monthly pension after retirement based on salary and service as set out in the rules of each plan.
Contributions to the plans by the Group take into consideration the results of actuarial valuations. The plans with a surplus position at the balance sheet date have been limited to the maximum economic benefit available from unconditional rights to refund from the scheme or reduction in future contributions. Where the subsidiary group is considered to have a contractual obligation to fund the pension plan above the accounting value of the liabilities, an onerous obligation is recognised.
The UK defined benefit schemes were closed to new joiners in April 2010.
For defined benefit retirement benefit schemes, the cost of providing benefits is determined using the projected unit credit method, with actuarial valuations being carried out at the end of each reporting period.
Remeasurement comprising actuarial gains and losses, the effect of the asset ceiling and the return on scheme assets (excluding interest) are recognised immediately in the balance sheet with a charge or credit to the consolidated statement of comprehensive income in the period in which they occur. Remeasurement recorded in the statement of comprehensive income is not recycled.
Past service cost, including curtailment gains and losses, is generally recognised in profit or loss in the period of scheme amendment. Net interest is calculated by applying the discount rate at the beginning of the period to the net defined benefit liability.
NOTES TO THE CONSOLIDATED FINANCIAL STATEMENTS CONTINUED

Overview IFC–19
Strategic report 20–59
Governance 60–71
Financial statements 72–IBC 85
2 ACCOUNTING POLICIES (CONTINUED)Defined benefit costs are split into three categories:
• Current service cost, past service cost and gains and losses on curtailments and settlements;
• Net interest cost; and
• Remeasurement.
The Group presents these defined benefit costs within ‘Employee costs’ in the consolidated income statement (see note 6).
A separate defined contribution plan is available to new employees of Jaguar Land Rover. Costs in respect of this plan are charged to the consolidated income statement as incurred.
POST-RETIREMENT MEDICARE SCHEMEUnder this unfunded scheme, employees of some subsidiaries receive medical benefits subject to certain limits of amount, periods after retirement and types of benefits, depending on their grade and location at the time of retirement. Employees separated from the Group as part of an Early Separation Scheme, on medical grounds or due to permanent disablement are also covered under the scheme. The applicable subsidiaries account for the liability for the post-retirement medical scheme based on an annual actuarial valuation.
ACTUARIAL GAINS AND LOSSESActuarial gains and losses relating to retirement benefit plans are recognised in other comprehensive income in the year in which they arise. Actuarial gains and losses relating to long-term employee benefits are recognised in the consolidated income statement in the year in which they arise.
MEASUREMENT DATEThe measurement date of all retirement plans is 31 March.
FINANCIAL INSTRUMENTSCLASSIFICATION, INITIAL RECOGNITION AND MEASUREMENTA financial instrument is any contract that gives rise to a financial asset of one entity and a financial liability or equity instrument of another entity. Financial assets are classified into categories: financial assets at fair value through profit or loss (which can either be held for trading or designated as fair value options), held-to-maturity investments, loans and receivables and available-for-sale financial assets. Financial liabilities are classified into financial liabilities at fair value through profit or loss and other financial liabilities. No financial instruments have been designated as fair value through profit or loss using the fair value option or have been classified as held-to-maturity.
Financial instruments are recognised on the balance sheet when the Group becomes a party to the contractual provisions of the instrument.
Initially, a financial instrument is recognised at its fair value. Transaction costs directly attributable to the acquisition or issue of financial instruments are recognised in determining the carrying amount, if it is not classified as at fair value through profit or loss. Subsequently, financial instruments are measured according to the category in which they are classified.
Financial assets and financial liabilities at fair value through profit or loss – held for trading: Derivatives, including embedded derivatives separated from the host contract, are classified into this category. Financial assets and liabilities are measured at fair value with changes in fair value recognised in the consolidated income statement with the exception of those derivatives which are designated as cash flow hedging instruments and for which hedge accounting is applied.
Loans and receivables: Loans and receivables are non-derivative financial assets with fixed or determinable payments that are not quoted in an active market and which are not classified as financial assets at fair value through profit or loss or financial assets available-for-sale. Subsequently, these are measured at amortised cost using the effective interest method less any impairment losses. These include cash and cash equivalents, trade receivables, finance receivables and other financial assets.
Available-for-sale financial assets: Available-for-sale financial assets are those non-derivative financial assets that are either designated as such upon initial recognition or are not classified in any of the other financial assets categories. Subsequently, these are measured at fair value and changes therein are recognised in other comprehensive income, net of applicable deferred income taxes, and accumulated in the investments revaluation reserve with the exception of impairment losses, interest calculated using the effective interest method and foreign exchange gains and losses on monetary assets, which are recognised directly in profit or loss. The Group does not hold any available-for-sale financial assets.
Investments in equity instruments that do not have a quoted market price in an active market and whose fair value cannot be reliably measured, are measured at cost.
Embedded derivatives relating to prepayment options on Senior Notes are not considered as closely related and are separately accounted unless the exercise price of these options is approximately equal on each exercise date to the amortised cost of the Senior Notes.
EQUITY INSTRUMENTSAn equity instrument is any contract that evidences residual interests in the assets of the Group after deducting all of its liabilities. Equity instruments issued by the Group are recorded at the proceeds received, net of direct issue costs.

86 JAGUAR LAND ROVER AUTOMOTIVE PLC Annual Report 2015–16
2 ACCOUNTING POLICIES (CONTINUED)OTHER FINANCIAL LIABILITIES These are measured at amortised cost using the effective interest method.
DETERMINATION OF FAIR VALUEFair value is the price that would be received to sell an asset or paid to transfer a liability in an orderly transaction between market participants at the measurement date, regardless of whether that price is directly observable or estimated using another valuation technique. In estimating the fair value of an asset or liability, the Group takes into account the characteristics of the asset or liability if market participants would take those characteristics into account when pricing the asset or liability at the measurement date. Subsequent to initial recognition, the Group determines the fair value of financial instruments that are quoted in active markets using the quoted bid prices (financial assets held) or quoted ask prices (financial liabilities held) and using valuation techniques for other instruments. Valuation techniques include discounted cash flow method and other valuation models.
DERECOGNITION OF FINANCIAL ASSETS AND FINANCIAL LIABILITIESThe Group derecognises a financial asset only when the contractual rights to the cash flows from the asset expires or it transfers the financial asset and substantially all the risks and rewards of ownership of the asset to another entity. If the Group neither transfers nor retains substantially all the risks and rewards of ownership and continues to control the transferred asset, the Group recognises its retained interest in the asset and an associated liability for amounts it may have to pay. If the Group retains substantially all the risks and rewards of ownership of a transferred financial asset, the Group continues to recognise the financial asset and also recognises a collateralised borrowing for the proceeds received.
Financial liabilities are derecognised when they are extinguished, that is when the obligation is discharged, cancelled or has expired.
When a financial instrument is derecognised, the cumulative gain or loss in equity (if any) is transferred to the consolidated income statement.
IMPAIRMENT OF FINANCIAL ASSETSThe Group assesses at each balance sheet date whether there is objective evidence that a financial asset, other than those at fair value through profit or loss, or a group of financial assets is impaired. A financial asset is considered to be impaired if objective evidence indicates that one or more events have had a negative effect on the estimated future cash flows of that asset.
Loans and receivables: Objective evidence of impairment includes default in payments with respect to amounts receivable from customers, significant financial difficulty of the customer or bankruptcy. Impairment loss in respect of loans and receivables is calculated as the difference between their carrying amount and the present value of the estimated future cash flows discounted at the original effective interest rate. Such impairment loss is recognised in the consolidated income statement. If the amount of an impairment loss decreases in a subsequent year, and the decrease can be related objectively to an event occurring after the impairment was recognised, the previously recognised impairment loss is reversed. The reversal is recognised in the consolidated income statement.
Equity investments: A significant or prolonged decline in the fair value of the security below its cost is also evidence that the assets are impaired. If any such evidence exists the cumulative loss, measured as the difference between the acquisition cost and the current fair value, less any impairment loss on that financial asset previously recognised in profit or loss is removed from equity and recognised in profit and loss. Impairment losses recognised in the consolidated income statement on equity instruments are not reversed through the consolidated income statement.
HEDGE ACCOUNTINGThe Group uses foreign currency forward contracts and options to hedge its risks associated with foreign currency fluctuations relating to highly probable forecast transactions. The Group designates these forward contracts and options in a cash flow hedging relationships by applying hedge accounting principles under IAS 39.
These forward contracts and options are stated at fair value on the consolidated balance sheet at each reporting date. Changes in the fair value of these forward contracts and options that are designated and effective as hedges of future cash flows are recognised in other comprehensive income (net of tax), and any ineffective portion is recognised immediately in the consolidated income statement. Amounts accumulated in other comprehensive income are reclassified to the consolidated income statement in the periods in which the forecasted transactions affect profit or loss.
For options, the time value is not a designated component of the hedge, and therefore all changes in fair value related to the time value of the instrument are recognised immediately in the consolidated income statement.
Hedge accounting is discontinued when the hedging instrument expires or is sold, terminated, exercised, or no longer qualifies for hedge accounting. For forecast transactions, any cumulative gain or loss on the hedging instrument recognised in other comprehensive income is retained there until the forecast transaction affects profit or loss.
If the forecast transaction is no longer expected to occur, the net cumulative gain or loss recognised in other comprehensive income is immediately transferred to the consolidated income statement.
NOTES TO THE CONSOLIDATED FINANCIAL STATEMENTS CONTINUED

Overview IFC–19
Strategic report 20–59
Governance 60–71
Financial statements 72–IBC 87
2 ACCOUNTING POLICIES (CONTINUED)NEW ACCOUNTING PRONOUNCEMENTSIN THE CURRENT YEAR, THE GROUP ADOPTED THE FOLLOWING STANDARDS, REVISIONS AND AMENDMENTS TO STANDARDS AND INTERPRETATIONS: IAS 19 Employee Benefits was amended in November 2013 to clarify the requirements that relate to how contributions from employees or third parties that are linked to service should be attributed to periods of service. In addition, it permits a practical expedient if the amount of the contributions is independent of the number of years of service, in that contributions, can, but are not required, to be recognised as a reduction in the service cost in the period in which the related service is rendered. The amendment did not have a material impact on the consolidated financial statements.
THE FOLLOWING PRONOUNCEMENTS, ISSUED BY THE IASB AND ENDORSED BY THE EU, ARE NOT YET EFFECTIVE AND HAVE NOT YET BEEN ADOPTED BY THE GROUP. THE GROUP IS EVALUATING THE IMPACT OF THESE PRONOUNCEMENTS ON THE CONSOLIDATED FINANCIAL STATEMENTS:IAS 16 Property, Plant and Equipment has been amended to prohibit entities from using a revenue based depreciation method for items of property, plant and equipment. IAS 38 introduces a rebuttable presumption that revenue is not an appropriate basis for amortising intangible assets. The amendment is effective for annual periods beginning on or after 1 January 2016, with early adoption permitted. These amendments do not have any impact on the consolidated financial statements.
IFRS 11 Joint Arrangements addresses how a joint operator should account for the interest in a joint operation in which the activity of the joint operation constitutes a business. The amendment is effective for annual periods beginning on or after 1 January 2016, with early adoption permitted. The amendment does not have any impact on the consolidated financial statements.
IAS 16 Property, Plant and Equipment has been amended to include ‘bearer plants’ whilst the produce growing on bearer plants remains within the scope of IAS 41. The amendment is effective for annual periods beginning on or after 1 January 2016, with early adoption permitted. The amendment does not have any impact on the consolidated financial statements.
IAS 1 Presentation of Financial Statements has been amended to support preparers in exercising their judgement in presenting their financial reports. This includes clarification that all information should have materiality considerations applied and additional examples on expected presentation of the financial statements. The amendment does not have any impact on the consolidated financial statements based upon the current disclosures given.
IAS 27 Separate Financial Statements has been amended to permit investments in subsidiaries, joint ventures and associates to be optionally accounted for using the equity method in separate financial statements. The amendment is effective for annual periods beginning on or after 1 January 2016 with early adoption permitted. This amendment does not have any impact on the consolidated financial statements.
In addition, as part of the IASB’s Annual Improvements, a number of minor amendments have been made to standards in the 2012–2014 cycles. These amendments are effective for annual periods beginning on or after 1 July 2016, with early application permitted. These amendments do not have a material impact on the consolidated financial statements.
THE FOLLOWING PRONOUNCEMENTS, ISSUED BY THE IASB, HAVE NOT YET BEEN ENDORSED BY THE EU, ARE NOT YET EFFECTIVE AND HAVE NOT YET BEEN ADOPTED BY THE GROUP. THE GROUP IS EVALUATING THE IMPACT OF THESE PRONOUNCEMENTS ON THE CONSOLIDATED FINANCIAL STATEMENTS:IFRS 10 and IAS 28 have been amended to clarify the treatment of the transfer of assets or sale of equity from an investor to its associate or joint venture. The mandatory effective date for these amendments has been deferred indefinitely by the IASB. These amendments are not expected to have a material impact on the consolidated financial statements.
IFRS 14 permits an entity which is a first-time adopter of International Financial Reporting Standards to continue to account, with some limited changes, for ‘regulatory deferral account balances’ in accordance with its previous GAAP, both on initial adoption of IFRS and in subsequent financial statements. This standard is effective for annual periods beginning on or after January 2016 subject to EU endorsement. The amendment does not have any impact the consolidated financial statements.
IFRS 15 Revenue from Contracts with Customers deals with revenue recognition and establishes principles for reporting useful information to users of financial statements about the nature, amount, timing and uncertainty of revenue and cash flows arising from an entity’s contracts with customers. Revenue is recognised when a customer obtains control of a good or service and thus has the ability to direct the use and obtain the benefits from the good or service. The standard replaces IAS 18 Revenue and IAS 11 Construction Contracts and related interpretations. The standard is effective for annual periods beginning on or after 1 January 2018 and earlier application is permitted subject to EU endorsement. The Group is assessing the impact of IFRS 15 and expects it to have a significant impact on the consolidated financial statements.
88 JAGUAR LAND ROVER AUTOMOTIVE PLC Annual Report 2015–16
2 ACCOUNTING POLICIES (CONTINUED)IFRS 9 Financial Instruments addresses the classification, measurement and recognition of financial assets and financial liabilities. The complete version of IFRS 9 was issued in July 2014. It replaces the guidance in IAS 39 that relates to the classification and measurement of financial instruments. IFRS 9 retains but simplifies the mixed measurement model and establishes three primary measurement categories for financial assets: amortised cost, fair value through other comprehensive income and fair value through profit or loss. The basis of classification depends on the entity’s business model and contractual cash flow characteristics of the financial asset. Investments in equity instruments are required to be measured at fair value through profit or loss with the irrevocable option at inception to present changes in fair value in other comprehensive income. There is now a new expected credit losses model that replaces the incurred loss model used in IAS 39. For financial liabilities there were no changes to classification and measurement except for the recognition of changes in own credit risk in other comprehensive income, for liabilities designated at fair value through profit or loss. IFRS 9 relaxes the requirements for hedge effectiveness by replacing the bright line hedge effectiveness tests. It requires an economic relationship between the hedged item and the hedging instrument and for the ‘hedged ratio’ to be the same as the one management actually use for the risk management process. Contemporaneous documentation is still required but is different to that currently prepared under IAS 39. The standard is effective for annual periods beginning on or after 1 January 2018 and earlier application is permitted subject to EU endorsement. The Group is assessing the impact of IFRS 9 and expects it to have a significant impact on the consolidated financial statements.
The amendments to IFRS 10 Consolidated Financial Statements, IFRS 12 Disclosure of Interests in Other Entities and IAS 28 Investments in Associates and Joint Ventures (2011) relate to investment entities. The amendment is effective for annual periods beginning on or after 1 January 2016 and earlier application is permitted subject to EU endorsement. JLR, its subsidiaries and its parent do not meet the definition of an ‘investment entity’ and therefore the amendment is not applicable.
IFRS 16 specifies how an IFRS reporter will recognise, measure, present and disclose leases. The standard provides a single lessee accounting model, requiring lessees to recognise assets and liabilities for all leases unless the lease term is 12 months or less or the underlying asset has a low value. Lessors continue to classify leases as operating or finance, with IFRS 16’s approach to lessor accounting substantially unchanged from its predecessor, IAS 17. The standard is effective for annual periods beginning on or after 1 January 2019 and earlier application is permitted subject to EU endorsement and the adoption of IFRS 15. The Group is assessing the impact of IFRS 16 and expects it to have a significant impact on the consolidated financial statements.
IAS 12 Income taxes has been amended to clarify the treatment of deferred tax on debt held at fair value and clarify details on recognition of deferred tax assets. The amendment is effective for annual periods beginning on or after 1 January 2017, with early adoption permitted. These amendments do not have any impact on the consolidated financial statements.
IAS 7 has been amended to require additional disclosure to help users evaluate changes in borrowings. The amendment is effective for annual periods beginning on or after 1 January 2017 and earlier application is permitted subject to EU endorsement. The Group expects to include a net debt reconciliation within its disclosures following the adoption of this standard.
3 EXCEPTIONAL ITEMThe exceptional item of £157 million for the year ended 31 March 2016 relates to the full financial year impact of the explosion at the port of Tianjin (China) in August 2015. A provision of £245 million against the carrying value of inventory (finished goods) was recorded in the second quarter ended 30 September 2015, based on the Group’s assessment of the physical condition of the vehicles involved. Subsequent to that, insurance proceeds of £55 million have been received, together with the conclusion of further assessments of the condition of the remaining vehicles, which had led to a reversal of £33 million of the initial provision.
The process for finalising ongoing insurance claims may take some months to conclude, so further insurance and other potential recoveries will only be recognised in future periods when received or confirmed as receivable.
Due to the size of the provision recorded, the charge together with the associated tax impact has been disclosed as an exceptional item. Any future recoveries will similarly be recognised as a reversal of that charge through exceptional items.
NOTES TO THE CONSOLIDATED FINANCIAL STATEMENTS CONTINUED

Overview IFC–19
Strategic report 20–59
Governance 60–71
Financial statements 72–IBC 89
4 REVENUE
Year ended 31 March2016
£m2015
£m2014
£m
Sale of goods 22,208 21,866 19,386Total revenues 22,208 21,866 19,386
5 MATERIAL AND OTHER COST OF SALES
Year ended 31 March2016
£m2015
£m2014
£m
Changes in inventories of finished goods and work-in-progress (257) (236) (356)Purchase of products for sale 876 864 715Raw materials and consumables 12,684 12,557 11,545Total material and other cost of sales 13,303 13,185 11,904
6 EMPLOYEE NUMBERS AND COSTS
Year ended 31 March2016
£m2015
£m2014
£m
Wages and salaries 1,738 1,500 1,230Social security costs and benefits 274 240 192Pension costs 309 237 232Total employee costs 2,321 1,977 1,654
Average employee numbers year ended 31 March 2016 Non-agency Agency Total
Manufacturing 17,235 3,140 20,375Research and development 6,060 3,115 9,175Other 6,494 961 7,455Total employee numbers 29,789 7,216 37,005
Average employee numbers year ended 31 March 2015 Non-agency Agency Total
Manufacturing 14,504 3,688 18,192Research and development 5,185 2,716 7,901Other 5,213 821 6,034Total employee numbers 24,902 7,225 32,127
Average employee numbers year ended 31 March 2014 Non-agency Agency Total
Manufacturing 13,890 1,670 15,560Research and development 4,307 1,916 6,223Other 4,914 1,256 6,170Total employee numbers 23,111 4,842 27,953
7 DIRECTORS’ EMOLUMENTS
Year ended 31 March2016
£2015
£2014
£
Directors’ emoluments 4,597,415 4,401,059 3,059,210
The aggregate of emoluments and amounts receivable under the long-term incentive plan (‘LTIP’) of the highest paid director was £3,709,433 (2015: £2,824,297, 2014: £2,433,578). In addition, for the highest paid director, pension benefits of £786,351 (2015: £1,475,732, 2014: £524,000) have accrued in the year. During the year, the highest paid director received £197,782 of LTIP awards (2015: no LTIP awards, 2014: no LTIP awards).
No directors received any LTIP cash payments during the years ended 31 March 2016, 2015 and 2014.

90 JAGUAR LAND ROVER AUTOMOTIVE PLC Annual Report 2015–16
8 LONG-TERM INCENTIVE PLAN (‘LTIP’)The Group operates a LTIP arrangement for certain employees. The scheme provides a cash payment to the employee based on a specific number of phantom shares at grant date and the share price of Tata Motors Limited at the vesting date. The cash payment is dependent upon continued employment for the duration of the three year vesting period. The cash payment has no exercise price and therefore the weighted average exercise price in all cases is £nil.
Year ended 31 March 2016 2015 2014
Outstanding at the beginning of the year 5,637,242 5,353,559 4,217,801Granted during the year 2,317,710 2,315,618 1,956,741Vested in the year (1,690,151) (1,654,917) (778,599)Forfeited in the year (231,944) (377,018) (42,384)Outstanding at the end of the year 6,032,857 5,637,242 5,353,559
The weighted average share price of the 1,690,151 phantom stock awards vested in the year was £5.84 (2015: £5.89, 2014: £4.45).
The weighted average remaining contractual life of the outstanding awards is 1.4 years (2015: 1.3 years, 2014: 1.3 years).
The amount charged in the year in relation to the long-term incentive plan was £3 million (2015: £16 million, 2014: £11 million).
The fair value of the balance sheet liability in respect of phantom stock awards outstanding at the year-end was £16 million (2015: £23 million, 2014: £17 million).
The fair value of the awards was calculated using a Black-Scholes model at the grant date. The fair value is updated at each reporting date as the awards are accounted for as cash-settled under IFRS 2 Share-based Payment. The inputs into the model are based on the Tata Motors Limited historic data and the risk-free rate is calculated on government bond rates. The inputs used are:
As at 31 March 2016 2015 2014
Risk-free rate (%) 0.51 0.49 0.91Dividend yield (%) 0.00 0.39 0.49Weighted average fair value per phantom share £4.12 £6.14 £4.95
9 OTHER EXPENSES
Year ended 31 March2016
£m2015
£m2014
£m
Stores, spare parts and tools 150 123 114Freight cost 858 673 610Works, operations and other costs 2,065 1,808 1,538Repairs 42 37 17Power and fuel 61 57 62Rent, rates and other taxes 50 57 41Insurance 26 20 19Write-down of intangible assets 28 – –Warranty 583 543 541Publicity 811 791 775Total other expenses 4,674 4,109 3,717
Included within warranty expenses for the year ended 31 March 2016 is a charge of £67 million (2015, 2014: £nil) for a passenger airbag campaign (see note 41).
NOTES TO THE CONSOLIDATED FINANCIAL STATEMENTS CONTINUED

Overview IFC–19
Strategic report 20–59
Governance 60–71
Financial statements 72–IBC 91
10 RESEARCH AND DEVELOPMENT
Year ended 31 March2016
£m2015
£m2014
£m
Total research and development costs incurred 1,560 1,411 1,266Research and development expensed (318) (253) (236)Development costs capitalised 1,242 1,158 1,030Interest capitalised 73 114 102Research and development expenditure credit (88) (69) (45)Total internally developed intangible additions 1,227 1,203 1,087
During the year ended 31 March 2014 legislation was enacted to allow UK companies to elect for the Research and Development Expenditure Credit (RDEC) on qualifying expenditure incurred since 1 April 2013, instead of the previous super-deduction rules. In the year ended 31 March 2016, as a result of this election, £66 million (2015: £66 million, 2014: £45 million) of the RDEC, the proportion relating to capitalised product development expenditure, has been offset against the cost of the respective assets. The remaining £38 million (2015: £30 million, 2014: £18 million) of the RDEC has been recognised as other income.
11 FINANCE INCOME AND EXPENSE
Year ended 31 March2016
£m2015
£m2014
£m
Finance income 38 48 38Total finance income 38 48 38Total interest expense on financial liabilities measured at amortised cost (143) (234) (257)Unwind of discount on provisions (21) (17) 6Interest capitalised 74 116 113Total interest expense (90) (135) (138)Embedded derivative value – – (47)Total finance expense (net) (90) (135) (185)
The capitalisation rate used to calculate borrowing costs eligible for capitalisation was 4.6 per cent (2015: 5.8 per cent, 2014: 7.2 per cent).
During the year ended 31 March 2016, the Group repaid one tranche of debt (see note 24) and as a result a redemption premium of £2 million was incurred.
During the year ended 31 March 2015, the Group repaid two tranches of debt (see note 24) and as a result a redemption premium of £77 million was incurred.
During the year ended 31 March 2014, the Group repaid two tranches of debt (see note 24) and as a result a redemption premium of £56 million was incurred and the fair value of the embedded derivatives was expensed in full.

92 JAGUAR LAND ROVER AUTOMOTIVE PLC Annual Report 2015–16
12 PROFIT BEFORE TAXExpense/(income) included in profit before tax for the year are the following:
Year ended 31 March2016
£m2015
£m2014
£m
Foreign exchange loss/(gain) on loans 54 178 (87)Foreign exchange (gain)/loss on derivatives (86) 166 (57)Unrealised loss on commodities 59 30 7 Depreciation of property, plant and equipment 634 461 386 Amortisation of intangible assets (excluding internally generated development costs) 88 64 44 Amortisation of internally generated development costs 696 526 445 Operating lease rentals in respect of plant, property and equipment 57 48 42 Loss on disposal of property, plant, equipment and software 13 7 4 Auditor remuneration (see below) 5 4 4
During the year ended 31 March 2016, £101 million (2015: £132 million, 2014: £91 million) was received by a foreign subsidiary as an indirect tax incentive that requires the subsidiary to meet certain criteria relating to vehicle efficiency and investment in engineering and research and development. The incentive is provided as a partial offset to the higher sales taxes payable following implementation of new legislation in the year ended 31 March 2014. During the year ended 31 March 2016, £101 million (2015: £132 million, 2014: £88 million) has been recognised in revenue and £nil (2015: £nil, 2014: £3 million) has been deferred to offset against capital expenditure, when incurred.
During the year ended 31 March 2016, £62 million (2015: £54 million, 2014: £71 million) was received by a foreign subsidiary as an incentive for continuing trading in that country for the foreseeable future. As the receipt has no ongoing financial or operating conditions attached, the amount has been recognised as ‘Other Income’.
The following table sets out the auditor remuneration for the year (rounded to the nearest £0.1 million):
Year ended 31 March2016
£m2015
£m2014
£m
Fees payable to the Company's auditor and its associates for the audit of the parent Company and consolidated financial statements 0.1 0.1 0.1 Fees payable to the Company's auditor and its associates for other services:– audit of the Company's subsidiaries 3.5 3.3 2.9 Total audit fees 3.6 3.4 3.0Audit related assurance services 1.8 0.3 0.3 Other assurance services 0.1 0.7 0.5 Total non-audit fees 1.9 1.0 0.8 Total audit and related fees 5.5 4.4 3.8
Fees payable to Deloitte LLP and their associates for non-audit services to the Group are not required to be disclosed separately as these fees are disclosed on a consolidated basis.
NOTES TO THE CONSOLIDATED FINANCIAL STATEMENTS CONTINUED

Overview IFC–19
Strategic report 20–59
Governance 60–71
Financial statements 72–IBC 93
13 TAXATIONRECOGNISED IN THE CONSOLIDATED INCOME STATEMENT
Year ended 31 March2016
£m2015
£m2014
£m
Current tax expenseCurrent year 180 350 348Adjustments for prior years (7) 15 9Current tax expense 173 365 357Deferred tax expense/(credit)Origination and reversal of temporary differences 163 294 330Adjustments for prior years (29) (83) (11)Rate changes (62) – (54)Deferred tax expense 72 211 265Total income tax expense 245 576 622
Prior year adjustments relate to differences between prior year estimates of tax position and current revised estimates or submitted tax computations.
RECOGNISED IN THE CONSOLIDATED STATEMENT OF COMPREHENSIVE INCOME
Year ended 31 March2016
£m2015
£m2014
£m
Deferred tax expense/(credit) on actuarial gains on retirement benefits 97 (71) (31)Deferred tax expense/(credit) on change in fair value of cash flow hedges 11 (363) 214Deferred tax expense on rate changes 23 – 15 131 (434) 198Total tax expense 376 142 820

94 JAGUAR LAND ROVER AUTOMOTIVE PLC Annual Report 2015–16
13 TAXATION (CONTINUED)RECONCILIATION OF EFFECTIVE TAX RATE
Year ended 31 March2016
£m2015
£m2014
£m
Profit for the year 1,312 2,038 1,879Total income tax expense 245 576 622Profit before tax 1,557 2,614 2,501Income tax expense using the tax rates applicable to individual entities of 20.9% (2015: 22.7%, 2014: 23.6%) 325 593 590Impact of UK Patent Box claims (29) – –Non-deductible expenses 35 28 15Unrecognised tax assets 12 – –Differences between current and deferred tax rates applicable – (18) –Changes in tax rates (62) – (54)Overseas unremitted earnings 13 40 71Share of (profit)/loss of equity accounted investments (13) 1 2Over provided in prior years (36) (68) (2)Total income tax expense 245 576 622
Included within ‘Over provided in prior years’ for the year ended 31 March 2016 is £45 million relating to enhanced deductions under the UK Patent Box regime in respect of Fiscal 2014 and 2015.
Included within the line ‘Over provided in prior years’ for March 2015 is a reversal of £62 million relating to withholding tax released as a result of changes in tax rates and laws expected to apply to the future repatriation of intercompany dividends.
The UK Finance Act 2015 was enacted during the year ended 31 March 2016 which included provisions for a reduction in the UK corporation tax rate from 20 per cent to 19 per cent with effect from 1 April 2017 and to 18 per cent with effect from 1 April 2020. Accordingly, UK deferred tax has been provided at a blended rate of 18.1 per cent (2015: 20 per cent, 2014: 20 per cent) in recognising the applicable tax rate at the point when the timing difference is expected to reverse.
A further change to the UK corporation tax rate was announced in the Chancellor’s Budget during the year ended 31 March 2016. The announcement included a reduction in the UK corporation tax rate to 17 per cent from 1 April 2020. As the change to 17 per cent had not been substantively enacted at the balance sheet date, its effects are not included in these financial statements.
NOTES TO THE CONSOLIDATED FINANCIAL STATEMENTS CONTINUED

Overview IFC–19
Strategic report 20–59
Governance 60–71
Financial statements 72–IBC 95
14 INVESTMENTS Investments consist of the following:
As at 31 March2016
£m2015
£m2014
£m
Equity accounted investments 339 280 145
The Group has the following investments at 31 March 2016:
Name of investmentProportion of voting rights
Principal place of business and country of incorporation Principal activity
Equity accounted investmentsChery Jaguar Land Rover Automotive Co. Ltd. 50.0% China Manufacture and assembly of vehiclesSpark44 (JV) Limited 50.0% England & Wales Provision of advertising servicesJaguar Cars Finance Limited 49.9% England & Wales Non-tradingTrading investmentsJaguar Land Rover Schweiz AG 10.0% Switzerland Sale of automotive vehicles and parts
Except for Spark44 (JV) Limited, the proportion of voting rights disclosed in the table above is the same as the interest in the ordinary share capital.
Chery Jaguar Land Rover Automotive Co. Ltd. is a limited liability company, whose legal form confirms separation between the parties to the joint arrangement. There is no contractual arrangement or any other facts or circumstances that indicate that the parties to the joint control of the arrangement have rights to the assets or obligations for the liabilities relating to the arrangement. Accordingly, Chery Jaguar Land Rover Automotive Co. Ltd. is classified as a joint venture.
During the year ended 31 March 2013, the Group invested a 50 percent stake in Chery Jaguar Land Rover Auto Sales Co. Ltd. (change of name from Suzhou Chery Jaguar Land Rover Trading Co. Ltd.) for £1 million and a 50 per cent stake in Chery Jaguar Land Rover Automotive Co. Ltd. for £70 million. During the year ended 31 March 2014, Chery Jaguar Land Rover Auto Sales Co. Ltd., previously a direct joint venture of the Group, was acquired in full by Chery Jaguar Land Rover Automotive Co. Ltd. Therefore, the results shown of Chery Jaguar Land Rover Automotive Co. Ltd. are the consolidated results for that entity, which includes the results of Chery Jaguar Land Rover Auto Sales Co. Ltd.
During the year ended 31 March 2015, the Group increased its investment in Chery Jaguar Land Rover Automotive Co. Ltd. by £124 million (2014: £92 million). No further increases to the investment were made during the year ended 31 March 2016.
The following table sets out the summarised financial information of the Group’s individually material joint venture, Chery Jaguar Land Rover Automotive Co. Ltd.:
As at 31 March2016
£m2015
£m2014
£m
Current assets 698 520 170Current liabilities (614) (347) (67)Non-current assets 814 585 236Non-current liabilities (216) (193) (65)Equity attributable to shareholders 682 565 274Revenue 1,106 158 –Profit/(loss) for the year 124 (13) (16)Total comprehensive income/(expense) 124 (13) (16)

96 JAGUAR LAND ROVER AUTOMOTIVE PLC Annual Report 2015–16
14 INVESTMENTS (CONTINUED)Included within the summarised financial information above are the following amounts:
As at 31 March2016
£m2015
£m2014
£m
Cash and cash equivalents 450 295 122Other current assets 248 225 48Current financial liabilities (excluding trade and other payables and provisions) (35) (56) –Non-current financial liabilities (excluding trade and other payables and provisions) (216) (193) (65)Depreciation and amortisation (58) (16) (1)Interest income 8 8 2Interest expense (10) (3) (1)Income tax (expense)/credit (44) 6 13
Spark44 (JV) Limited’s total ordinary share capital is divided into A and B ordinary shares with each class having 50 per cent voting rights and interest in returns (of which the Group holds 100 per cent of the B shares).As a number of the A ordinary shares are held in trust, the Group has an interest in 58 per cent of the allotted ordinary share capital, but only 50 per cent of the voting rights and interest in returns. Therefore, Spark44 (JV) Limited is considered a joint venture.
The Group has no additional rights or influence over Jaguar Cars Finance Limited other than the voting rights attached to the ordinary share capital.
The following table sets out the summarised financial information in aggregate for the share of investments in equity accounted investments that are not individually material:
As at 31 March2016
£m2015
£m2014
£m
Group's share of profit for the year 2 1 1Group's share of other comprehensive income – – –Group's share of total comprehensive income 2 1 1Carrying amount of the Group's interest 5 3 2
The following reconciles the carrying amount of the Group’s interests in equity accounted investments:
As at 31 March2016
£m2015
£m2014
£m
Net assets of material joint venture 682 565 274Share of net assets of: Material joint venture 341 282 137 Individually immaterial joint ventures 5 3 2Foreign exchange differences – – 6Other (7) (5) –Carrying amount of the Group's interests in equity accounted investments 339 280 145
As at 31 March 2016, an adjustment of £7 million (2015: £5 million, 2014: £nil) has been made to derecognise profit that has not yet been realised on goods sold by the Group to Chery Jaguar Land Rover Automotive Co. Ltd.
The following reconciles the Group’s share of total comprehensive income of equity accounted investments:
As at 31 March2016
£m2015
£m2014
£m
Profit/(loss) of material joint venture 124 (13) (16)Share of profit/(loss) of: Material joint venture 62 (7) (8) Individually immaterial joint ventures 2 1 1Share of profit/(loss) of equity accounted investments 64 (6) (7)Currency translation differences (3) 21 –Share of total comprehensive income/(expense) of equity accounted investments 61 15 (7)
NOTES TO THE CONSOLIDATED FINANCIAL STATEMENTS CONTINUED

Overview IFC–19
Strategic report 20–59
Governance 60–71
Financial statements 72–IBC 97
14 INVESTMENTS (CONTINUED)The Group’s share of capital commitments of its joint ventures at 31 March 2016 is £102 million (2015: £19 million, 2014: £116 million), purchase commitments of its joint ventures at 31 March 2016 is £36 million (2015, 2014: £nil) and commitments relating to the Group’s interests in its joint ventures are disclosed in note 32. There are no contingent liabilities relating to the Group’s interests in its joint ventures.
The information above reflects the amounts presented in the financial statements of the equity accounted investments adjusted for differences in accounting policies between the Group and its equity accounted investments. All joint ventures are accounted for using the equity method and are private companies and there are no quoted market prices available for their shares.
The Group has no additional rights or influence over Jaguar Land Rover Schweiz AG other than the voting rights attached to the ordinary share capital. During the year ended 31 March 2016 a dividend of £0.5 million (2015, 2014: £nil) was received from Jaguar Land Rover Schweiz AG. No dividend was received in the year ended 31 March 2016 (2015, 2014: no dividend) from any other trading investments or equity accounted investments. Trading investments are held at cost of £0.3 million (2015: £0.3 million, 2014: £0.3 million).
15 OTHER FINANCIAL ASSETS
As at 31 March2016
£m2015
£m2014
£m
Non-currentRestricted cash held as security 21 18 25Derivative financial instruments 154 22 436Other 10 9 12Total non-current other financial assets 185 49 473CurrentAdvances and other receivables recoverable in cash 8 19 22Derivative financial instruments 73 176 361Accrued income 12 5 –Other 44 14 9Total current other financial assets 137 214 392
As at 31 March 2016, £nil (2015: £16 million, 2014: £23 million) of the non-current restricted cash is held as security in relation to vehicles ultimately sold on lease, pledged until the leases reach their respective conclusion.
As at 31 March 2016, £19 million (2015: £nil, 2014: £nil) of the non-current restricted cash is held as a financial deposit in relation to ongoing legal cases.

98 JAGUAR LAND ROVER AUTOMOTIVE PLC Annual Report 2015–16
16 PROPERTY, PLANT AND EQUIPMENTLand and buildings
£m
Plant and equipment
£mVehicles
£mComputers
£m
Fixtures & fittings
£m
Leased assets
£m
Heritage vehicles
£m
Under construction
£mTotal
£m
CostBalance at 1 April 2013 382 2,499 4 14 30 43 – 316 3,288Additions 3 422 1 3 19 – – 786 1,234Transfers 152 245 – – – – – (397) –Disposals (3) (17) (1) – (1) – – – (22)Reclassification from intangible assets – – – 8 – – – – 8Balance at 31 March 2014 534 3,149 4 25 48 43 – 705 4,508Additions 3 579 2 21 18 – 52 1,082 1,757Transfers 277 733 – – – – – (1,010) –Disposals (10) (50) – (2) (1) – – – (63)Balance at 31 March 2015 804 4,411 6 44 65 43 52 777 6,202Additions 40 589 1 33 22 3 – 659 1,347Transfers 218 707 – – – – – (925) –Disposals (2) (46) – (1) (3) – – – (52)Balance at 31 March 2016 1,060 5,661 7 76 84 46 52 511 7,497DepreciationBalance at 1 April 2013 56 859 1 4 13 20 – – 953Depreciation charge for the period 16 359 1 2 3 5 – – 386Disposals (2) (12) (1) – (1) – – – (16)Reclassification from intangible assets – – – 1 – – – – 1Balance at 31 March 2014 70 1,206 1 7 15 25 – – 1,324Depreciation charge for the period 20 422 – 5 9 5 – – 461Disposals (10) (46) – – (1) – – – (57)Balance at 31 March 2015 80 1,582 1 12 23 30 – – 1,728Depreciation charge for the period 31 580 1 7 10 5 – – 634Disposals (1) (36) – – (3) – – – (40)Balance at 31 March 2016 110 2,126 2 19 30 35 – – 2,322Net book valueAt 31 March 2014 464 1,943 3 18 33 18 – 705 3,184At 31 March 2015 724 2,829 5 32 42 13 52 777 4,474At 31 March 2016 950 3,535 5 57 54 11 52 511 5,175
NOTES TO THE CONSOLIDATED FINANCIAL STATEMENTS CONTINUED

Overview IFC–19
Strategic report 20–59
Governance 60–71
Financial statements 72–IBC 99
17 INTANGIBLE ASSETS
Software £m
Patents and technological
know-how £m
Customer- related
£m
Intellectual property rights
and other intangibles
£m
Product development in
progress £m
Capitalised product
development £m
Total £m
CostBalance at 1 April 2013 247 147 89 618 1,263 1,978 4,342Other additions – externally purchased 127 – – – – – 127Other additions – internally developed – – – – 1,087 – 1,087Capitalised product development – internally developed – – – – (583) 583 –Disposals (3) – – – – (146) (149)Reclassification to tangible assets (8) – – – – – (8)Balance at 31 March 2014 363 147 89 618 1,767 2,415 5,399Other additions – externally purchased 103 – – 1 – – 104Other additions – internally developed – – – – 1,203 – 1,203Capitalised product development – internally developed – – – – (1,388) 1,388 –Disposals (8) – (28) – – (159) (195)Balance at 31 March 2015 458 147 61 619 1,582 3,644 6,511Other additions – externally purchased 131 – – – – – 131Other additions – internally developed – – – – 1,227 – 1,227Capitalised product development – internally developed – – – – (1,242) 1,242 –Disposals (10) – – – – (361) (371)Asset write-downs – – – – (28) – (28)Balance at 31 March 2016 579 147 61 619 1,539 4,525 7,470Amortisation and impairmentBalance at 1 April 2013 73 70 43 – – 634 820Amortisation for the year 26 15 3 – – 445 489Disposals (3) – – – – (146) (149)Reclassification to tangible assets (1) – – – – – (1)Balance at 31 March 2014 95 85 46 – – 933 1,159Amortisation for the year 47 14 3 – – 526 590Disposals (3) – (28) – – (159) (190)Balance at 31 March 2015 139 99 21 – – 1,300 1,559Amortisation for the year 71 14 3 – – 696 784Disposals (9) – – – – (361) (370)Balance at 31 March 2016 201 113 24 – – 1,635 1,973Net book valueAt 31 March 2014 268 62 43 618 1,767 1,482 4,240At 31 March 2015 319 48 40 619 1,582 2,344 4,952At 31 March 2016 378 34 37 619 1,539 2,890 5,497
Following a review of all product development in progress, £28 million of costs were identified as written down and these have been recognised as an expense within ‘Other expenses’ in the year ended 31 March 2016 (2015, 2014: £nil).

100 JAGUAR LAND ROVER AUTOMOTIVE PLC Annual Report 2015–16
17 INTANGIBLE ASSETS (CONTINUED)IMPAIRMENT TESTINGThe directors are of the view that the operations of the Group represent a single cash-generating unit. The intellectual property rights are deemed to have an indefinite useful life on the basis of the expected longevity of the brand names.
For the periods presented, the recoverable amount of the cash-generating unit has been calculated with reference to its value in use. The key assumptions of this calculation are shown below:
As at 31 March 2016 2015 2014
Period on which management approved forecasts are based 5 years 5 years 5 yearsGrowth rate applied beyond approved forecast period 2.1% 2.2% 0%Pre-tax discount rate 11.2% 11.2% 10.9%
The growth rates used in the value in use calculation reflect those inherent within the Board’s latest business plan which is primarily a function of the Group’s cycle plan assumptions, past performance and management’s expectation of future market developments, through to 2021/22. The cash flows are then extrapolated into perpetuity assuming a growth rate of 2.1 per cent (2015: 2.2 per cent, 2014: nil per cent).
No reasonably possible change in any of the key assumptions would cause the recoverable amount to be less than the carrying value of the assets of the cash-generating unit.
18 OTHER ASSETS
As at 31 March2016
£m2015
£m2014
£m
CurrentRecoverable VAT 218 221 237Prepaid expenses 111 106 70Other 82 69 48Total current other assets 411 396 355Non-currentPrepaid expenses 42 23 31Other 3 3 2Total non-current other assets 45 26 33
NOTES TO THE CONSOLIDATED FINANCIAL STATEMENTS CONTINUED

Overview IFC–19
Strategic report 20–59
Governance 60–71
Financial statements 72–IBC 101
19 DEFERRED TAX ASSETS AND LIABILITIESSignificant components of deferred tax asset and liability for the year ended 31 March 2016 are as follows:
Opening balance
£m
Recognised in profit or loss
£m
Recognised in other
comprehensive income
£m
Foreign exchange
£m
Closing balance
£m
Deferred tax assetsProperty, plant & equipment 8 13 – – 21Provisions, allowances for doubtful receivables 227 (3) – – 224Derivative financial instruments 261 (3) (18) – 240Retirement benefits 187 36 (113) – 110Unrealised profit in inventory 146 (19) – – 127Tax loss 220 (45) – – 175Other 35 15 – – 50Total deferred tax asset 1,084 (6) (131) – 947Deferred tax liabilitiesProperty, plant & equipment – – – – –Intangible assets 852 94 – – 946Derivative financial instruments – – – – –Overseas unremitted earnings 59 (28)* – – 31Total deferred tax liability 911 66 – – 977Presented as deferred tax asset** 372 354Presented as deferred tax liability** (199) (384)
* Included within £28 million is a reversal of £39 million relating to withholding tax incurred on intercompany dividends paid in the year.
** For balance sheet presentation purposes, deferred tax assets and deferred tax liabilities are offset to the extent they relate to the same taxation authority and are expected to be settled on a net basis.
At 31 March 2016 the Group had unused tax losses and other temporary differences amounting to £76 million (2015: £nil, 2014: £nil) for which no deferred tax asset has been recognised based upon the forecast profitability of the companies in which the deferred tax assets arise. As at 31 March 2016 £6 million (2015: £nil, 2014: £nil) of those tax losses expire after eight years and the remaining balance is not expected to expire.
At 31 March 2016 the Group had temporary differences relating to undistributed profits of equity accounted investees amounting to £37 million (2015: £nil, 2014: £nil) for which no deferred tax liability has been recognised as it is not expected to reverse in the foreseeable future.
All deferred tax assets and deferred tax liabilities at 31 March 2016, 31 March 2015 and 31 March 2014 are presented as non-current.

102 JAGUAR LAND ROVER AUTOMOTIVE PLC Annual Report 2015–16
19 DEFERRED TAX ASSETS AND LIABILITIES (CONTINUED)Significant components of deferred tax asset and liability for the year ended 31 March 2015 are as follows:
Opening balance
£m
Recognised in profit or loss
£m
Recognised in other
comprehensive income
£m
Foreign exchange
£m
Closing balance
£m
Deferred tax assetsProperty, plant & equipment 74 (66) – – 8Provisions, allowances for doubtful receivables 190 25 – 12 227Derivative financial instruments – 31 230 – 261Retirement benefits 135 (19) 71 – 187Unrealised profit in inventory 138 8 – – 146Tax loss 375 (155) – – 220Other 15 20 – – 35Total deferred tax asset 927 (156) 301 12 1,084Deferred tax liabilitiesProperty, plant & equipment 2 (2) – – –Intangible assets 713 139 – – 852Derivative financial instruments 133 – (133) – –Overseas unremitted earnings 141 (82)* – – 59Total deferred tax liability 989 55 (133) – 911Presented as deferred tax asset** 284 372Presented as deferred tax liability** (346) (199)
* Included within £82 million is a reversal of £59 million relating to withholding tax incurred on intercompany dividends paid in the year, and £62 million relating to withholding tax released as a result of changes in tax rates and laws expected to apply to future repatriation of intercompany dividends.
** For balance sheet presentation purposes, deferred tax assets and deferred tax liabilities are offset to the extent they relate to the same taxation authority and are expected to be settled on a net basis.
NOTES TO THE CONSOLIDATED FINANCIAL STATEMENTS CONTINUED

Overview IFC–19
Strategic report 20–59
Governance 60–71
Financial statements 72–IBC 103
19 DEFERRED TAX ASSETS AND LIABILITIES (CONTINUED)Significant components of deferred tax asset and liability for the year ended 31 March 2014 are as follows:
Opening balance
£m
Recognised in profit or loss
£m
Recognised in other
comprehensive income
£m
Foreign exchange
£m
Closing balance
£m
Deferred tax assetsProperty, plant & equipment 145 (71) – – 74Provisions, allowances for doubtful receivables 182 29 – (21) 190Derivative financial instruments 61 – (61) – –Retirement benefits 164 (25) (4) – 135Unrealised profit in inventory 76 62 – – 138Tax loss 556 (181) – – 375Other 2 13 – – 15Total deferred tax asset 1,186 (173) (65) (21) 927Deferred tax liabilitiesProperty, plant & equipment 2 – – – 2Intangible assets 676 37 – – 713Derivative financial instruments – – 133 – 133Overseas unremitted earnings 86 55* – – 141Total deferred tax liability 764 92 133 – 989Presented as deferred tax asset** 508 284Presented as deferred tax liability** (86) (346)
* Included within £55 million is a reversal of £5 million relating to withholding tax incurred on intercompany dividends paid in the year.
** For balance sheet presentation purposes, deferred tax assets and deferred tax liabilities are offset to the extent they relate to the same taxation authority and are expected to be settled on a net basis.
20 CASH AND CASH EQUIVALENTSCash and cash equivalents consist of the following:
As at 31 March2016
£m2015
£m2014
£m
Cash and cash equivalents 3,399 3,208 2,260
Included within the cash and cash equivalents balance of £3,399 million (2015: £3,208 million, 2014: £2,260 million) are amounts of £12 million (2015: £nil, 2014: £nil) which are not considered to be available for use by the Group at the balance sheet date. £7 million (2015: £nil, 2014: £nil) relates to amounts held by solicitors to settle a capital commitment and £5 million (2015: £nil, 2014: £nil) relates to amounts that are required by local legislation to be held for use on specific marketing activities.
21 ALLOWANCES FOR TRADE AND OTHER RECEIVABLESChanges in the allowances for trade and other receivables are as follows:
Year ended 31 March2016
£m2015
£m2014
£m
At beginning of year 11 8 10Change in allowance during the year 49 3 (1)Written off – – (1)At end of year 60 11 8

104 JAGUAR LAND ROVER AUTOMOTIVE PLC Annual Report 2015–16
22 INVENTORIES
As at 31 March2016
£m2015
£m2014
£m
Raw materials and consumables 92 80 75Work-in-progress 379 298 211Finished goods 2,214 2,038 1,888Total inventories 2,685 2,416 2,174
Inventories of finished goods include £250 million (2015: £187 million, 2014: £174 million), relating to vehicles sold to rental car companies, fleet customers and others with guaranteed repurchase arrangements.
Cost of inventories (including cost of purchased products) recognised as an expense during the year amounted to £15,437 million (2015: £15,041 million, 2014: £13,421 million).
During the year, the Group recorded an inventory write-down expense of £230 million (2015: £40 million, 2014: £24 million). The write-down is included in material and other cost of sales. No previous write-downs have been reversed in any period.
23 ACCOUNTS PAYABLE
As at 31 March2016
£m2015
£m2014
£m
Trade payables 3,899 3,483 3,154Liabilities to employees 153 185 148Liabilities for expenses 1,357 1,298 1,244Capital creditors 349 484 241Total accounts payable 5,758 5,450 4,787
24 INTEREST BEARING LOANS AND BORROWINGS
As at 31 March2016
£m2015
£m2014
£m
Short-term borrowingsBank loans 116 156 167Short-term borrowings 116 156 167Long-term borrowingsEURO MTF listed debt 2,373 2,381 1,843Long-term borrowings 2,373 2,381 1,843Finance lease obligations (see note 35) 11 13 18Total debt 2,500 2,550 2,028
EURO MTF LISTED DEBTThe bonds are listed on the EURO MTF market, which is a listed market regulated by the Luxembourg Stock Exchange.
Details of the tranches of the bonds outstanding at 31 March 2016 are as follows:
• $84 million Senior Notes due 2021 at a coupon of 8.125 per cent per annum – issued May 2011;
• $500 million Senior Notes due 2023 at a coupon of 5.625 per cent per annum – issued January 2013;
• $700 million Senior Notes due 2018 at a coupon of 4.125 per cent per annum – issued December 2013;
• £400 million Senior Notes due 2022 at a coupon of 5.000 per cent per annum – issued January 2014;
• $500 million Senior Notes due 2019 at a coupon of 4.250 per cent per annum – issued October 2014;
• £400 million Senior Notes due 2023 at a coupon of 3.875 per cent per annum – issued February 2015;
• $500 million Senior Notes due 2020 at a coupon of 3.500 per cent per annum – issued March 2015.
In May 2016, the Group repaid early the remaining $84 million Senior Notes due 2021 for a redemption premium of £2 million.
NOTES TO THE CONSOLIDATED FINANCIAL STATEMENTS CONTINUED

Overview IFC–19
Strategic report 20–59
Governance 60–71
Financial statements 72–IBC 105
24 INTEREST BEARING LOANS AND BORROWINGS (CONTINUED)Details of the tranches of the bonds repaid in the year ended 31 March 2016 are as follows:
• £58 million Senior Notes due 2020 at a coupon of 8.250 per cent per annum – issued March 2012.
Details of the tranches of the bonds repaid in the year ended 31 March 2015 are as follows:
• $326 million Senior Notes due 2021 at a coupon of 8.125 per cent per annum – issued May 2011;
• £442 million Senior Notes due 2020 at a coupon of 8.250 per cent per annum – issued March 2012.
Details of the tranches of the bonds repaid in the year ended 31 March 2014 are as follows:
• £500 million Senior Notes due 2018 at a coupon of 8.125 per cent per annum – issued May 2011;
• $410 million Senior Notes due 2018 at a coupon of 7.75 per cent per annum – issued May 2011.
The contractual cash flows of interest bearing debt and borrowings (excluding finance leases) as of March 2016 are set out below, including estimated interest payments and assumes the debt will be repaid at the maturity date.
As at 31 March2016
£m2015
£m2014
£m
Due in 1 year or less 233 279 2962nd and 3rd years 717 240 2544th and 5th years 857 1,403 666More than 5 years 1,292 1,336 1,666Total contractual cash flows 3,099 3,258 2,882
UNDRAWN FACILITIESAs at 31 March 2016, the Group has a fully undrawn revolving credit facility of £1,870 million. This facility is available in full until 2020. As at 31 March 2015 and 2014 the Group had a fully undrawn revolving credit facility of £1,485 million and £1,290 million respectively in a facility split into three and five year tranches available until 2016 and 2018.
25 OTHER FINANCIAL LIABILITIES
As at 31 March2016
£m2015
£m2014
£m
CurrentFinance lease obligations 5 4 5Interest accrued 25 25 24Derivative financial instruments 666 697 65Liability for vehicles sold under a repurchase arrangement 266 197 183Total current other financial liabilities 962 923 277Non-currentFinance lease obligations 6 9 13Derivative financial instruments 809 832 55Other payables 2 1 1Total non-current other financial liabilities 817 842 69

106 JAGUAR LAND ROVER AUTOMOTIVE PLC Annual Report 2015–16
26 PROVISIONS
As at 31 March2016
£m2015
£m2014
£m
CurrentProduct warranty 441 426 343Legal and product liability 99 50 49Provisions for residual risk 6 4 2Provision for environmental liability 8 5 –Other employee benefits obligations 1 – 1Total current provisions 555 485 395Non-currentProduct warranty 688 585 538Provision for residual risk 13 16 13Provision for environmental liability 23 26 21Other employee benefits obligations 9 12 10Total non-current provisions 733 639 582
Year ended 31 March 2016 Product warranty Legal and
product liability Residual risk Environmental
liability Total
Opening balance 1,011 50 20 31 1,112Provisions made during the year 578 67 4 1 650Provisions used during the year (480) (17) (6) (1) (504)Impact of discounting 21 – – – 21Foreign currency translation (1) (1) 1 – (1)Closing balance 1,129 99 19 31 1,278
PRODUCT WARRANTY PROVISIONThe Group offers warranty cover in respect of manufacturing defects, which become apparent up to five years after purchase, dependent on the market in which the purchase occurred. The estimated liability for product warranties is recorded when products are sold. These estimates are established using historical information on the nature, frequency and average cost of warranty claims and management estimates regarding possible future incidences based on actions on product failures. The discount on the warranty provision is calculated using a risk-free discount rate as the risks specific to the liability, such as inflation, are included in the base calculation. The timing of outflows will vary as and when a warranty claim will arise, being typically up to five years.
LEGAL AND PRODUCT LIABILITY PROVISIONA legal and product liability provision is maintained in respect of compliance with regulations and known litigations which impact the Group. The provision primarily relates to motor accident claims, consumer complaints, dealer terminations, employment cases, personal injury claims and compliance with regulations.
RESIDUAL RISK PROVISIONIn certain markets, the Group is responsible for the residual risk arising on vehicles sold by dealers on leasing arrangements. The provision is based on the latest available market expectations of future residual value trends. The timing of the outflows will be at the end of the lease arrangements – being typically up to three years.
ENVIRONMENTAL RISK PROVISIONThis provision relates to various environmental remediation costs such as asbestos removal and land clean up. The timing of when these costs will be incurred is not known with certainty.
NOTES TO THE CONSOLIDATED FINANCIAL STATEMENTS CONTINUED

Overview IFC–19
Strategic report 20–59
Governance 60–71
Financial statements 72–IBC 107
27 OTHER LIABILITIES
As at 31 March2016
£m2015
£m2014
£m
CurrentLiabilities for advances received 139 183 253Deferred revenue 93 54 19VAT 131 88 85Others 64 49 38Total current other liabilities 427 374 395Non-currentDeferred revenue 170 96 63Others 34 22 14Total non-current other liabilities 204 118 77
28 CAPITAL AND RESERVES
As at 31 March2016
£m2015
£m2014
£m
Authorised, called up and fully paid1,500,642,163 ordinary shares of £1 each 1,501 1,501 1,501Total capital 1,501 1,501 1,501
The holders of ordinary shares are entitled to receive dividends as declared from time to time and are entitled to one vote per share at meetings of the Company.
The capital redemption reserve of £167 million (2015, 2014: £167 million) was created in March 2011 on the cancellation of share capital.
29 OTHER RESERVESThe movement of other reserves is as follows:
Translation reserve
£m
Hedging reserve
£m
Retained earnings
£m
Total other reserves
£m
Balance at 1 April 2015 (362) (910) 5,644 4,372Profit for the year – – 1,312 1,312Remeasurement of defined benefit obligation – – 489 489Loss on effective cash flow hedges – (169) – (169)Currency translation differences (1) – – (1)Income tax related to items recognised in other comprehensive income – 27 (113) (86)Cash flow hedges reclassified to foreign exchange in profit or loss – 224 – 224Income tax related to items reclassified to profit or loss – (45) – (45)Dividend paid – – (150) (150)Balance at 31 March 2016 (363) (873) 7,182 5,946

108 JAGUAR LAND ROVER AUTOMOTIVE PLC Annual Report 2015–16
29 OTHER RESERVES (CONTINUED)Translation
reserve £m
Hedging reserve
£m
Retained earnings
£m
Total other reserves
£m
Balance at 1 April 2014 (383) 539 4,040 4,196Profit for the year – – 2,038 2,038Remeasurement of defined benefit obligation – – (355) (355)Loss on effective cash flow hedges – (1,768) – (1,768)Currency translation differences 21 – – 21Income tax related to items recognised in other comprehensive income – 354 71 425Cash flow hedges reclassified to foreign exchange in profit or loss – (44) – (44)Income tax related to items reclassified to profit or loss – 9 – 9Dividend paid – – (150) (150)Balance at 31 March 2015 (362) (910) 5,644 4,372Balance at 1 April 2013 (383) (196) 2,450 1,871Profit for the year – – 1,879 1,879Remeasurement of defined benefit obligation – – (135) (135)Gain on effective cash flow hedges – 1,041 – 1,041Income tax related to items recognised in other comprehensive income – (220) (4) (224)Cash flow hedges reclassified to foreign exchange in profit or loss – (112) – (112)Income tax related to items reclassified to profit or loss – 26 – 26Dividend paid – – (150) (150)Balance at 31 March 2014 (383) 539 4,040 4,196
30 DIVIDENDS
Year ended 31 March2016
£m2015
£m2014
£m
Dividend proposed for the previous year paid during the year of £0.10 (2015: £0.10, 2014: £0.10) per ordinary share 150 150 150 Amounts recognised as distributions to equity holders during the year 150 150 150 Proposed dividend for the year of £0.10 (2015: £0.10, 2014: £0.10) per ordinary share 150 150 150
In May 2016, the Company proposed an ordinary dividend of £150 million to its immediate parent TML Holdings Pte. Ltd. (Singapore). This amount was paid in full in June 2016.
NOTES TO THE CONSOLIDATED FINANCIAL STATEMENTS CONTINUED

Overview IFC–19
Strategic report 20–59
Governance 60–71
Financial statements 72–IBC 109
31 EMPLOYEE BENEFITSThe Group operates defined benefit schemes for qualifying employees of certain of its subsidiaries. The UK defined benefit schemes are administered by a trustee that is legally separated from the Company. The trustee of the pension schemes is required by law to act in the interest of the fund and of all relevant stakeholders in the schemes, is responsible for the investment policy with regard to the assets of the schemes and all other governance matters. The board of the trustee must be composed of representatives of the Company and scheme participants in accordance with each scheme’s regulations.
Under the schemes, the employees are entitled to post-retirement benefits based on their length of service and salary.
Through its defined benefit pension schemes the Group is exposed to a number of risks, the most significant of which are detailed below:
ASSET VOLATILITYThe scheme liabilities are calculated using a discount rate set with reference to corporate bond yields; if scheme assets under perform these corporate bonds, this will create or increase a deficit. The defined benefit schemes hold a significant proportion of equity type assets, which are expected to outperform corporate bonds in the long term although introducing volatility and risk in the short term.
As the schemes mature, the Group intends to reduce the level of investment risk by investing more in assets that better match the liabilities.
However, the Group believes that due to the long-term nature of the scheme liabilities and the strength of the supporting group, a level of continuing equity type investments is an appropriate element of the Group’s long-term strategy to manage the schemes efficiently.
CHANGES IN BOND YIELDSA decrease in corporate bond yields will increase scheme liabilities, although this is expected to be partially offset by an increase in the value of the schemes’ bond holdings and interest rate hedging instruments.
INFLATION RISKSome of the Group pension obligations are linked to inflation, and higher inflation will lead to higher liabilities (although, in most cases, caps on the level of inflationary increases are in place to protect the scheme against extreme inflation). The schemes hold a significant proportion of assets in index linked gilts, together with other inflation hedging instruments and also assets which are more loosely correlated with inflation. However, an increase in inflation will also increase the deficit to some degree.
LIFE EXPECTANCYThe majority of the scheme’s obligations are to provide benefits for the life of the member, so increases in life expectancy will result in an increase in the scheme’s liabilities. This is particularly significant in the UK defined benefit schemes, where inflationary increases result in higher sensitivity to changes in life expectancy.
The following tables set out the disclosures pertaining to the retirement benefit amounts recognised in the financial statements:
CHANGE IN PRESENT VALUE OF DEFINED BENEFIT OBLIGATION
Year ended 31 March2016
£m2015
£m2014
£m
Defined benefit obligation at beginning of year 7,883 6,053 6,021Current service cost 224 168 176Interest expense 263 274 262Actuarial (gains)/losses arising from: Changes in demographic assumptions (36) (20) (39) Changes in financial assumptions (569) 1,454 (243) Experience adjustments 63 101 8Past service cost – 1 6Exchange differences on foreign schemes 3 – (2)Member contributions 2 2 1Benefits paid (165) (149) (137)Other adjustments – (1) –Defined benefit obligation at end of year 7,668 7,883 6,053

110 JAGUAR LAND ROVER AUTOMOTIVE PLC Annual Report 2015–16
31 EMPLOYEE BENEFITS (CONTINUED)CHANGE IN FAIR VALUE OF SCHEME ASSETS
Year ended 31 March2016
£m2015
£m2014
£m
Fair value of plan assets at beginning of year 6,997 5,382 5,365Interest income 233 246 237Remeasurement (loss)/gain on the return of plan assets, excluding amounts included in interest income (52) 1,178 (407)Administrative expenses (8) (8) (8)Exchange differences on foreign schemes 1 1 (2)Employer contributions 95 346 333Member contributions 2 2 1Benefits paid (165) (149) (137)Other adjustments – (1) –Fair value of scheme assets at end of year 7,103 6,997 5,382
The actual return on scheme assets for the year was £181 million (2015: return of £1,424 million, 2014: loss of £170 million).
Amounts recognised in the consolidated income statement consist of:
Year ended 31 March2016
£m2015
£m2014
£m
Current service cost 224 168 176Past service cost – 1 6Administrative expenses 8 8 8Net interest cost (including onerous obligations) 30 28 25Components of defined benefit cost recognised in the consolidated income statement 262 205 215
Amounts recognised in the consolidated statement of comprehensive income consists of:
Year ended 31 March2016
£m2015
£m2014
£m
Actuarial gains/(losses) arising from: Changes in demographic assumptions 36 20 39 Changes in financial assumptions 569 (1,454) 243 Experience adjustments (63) (101) (8)Remeasurement (loss)/gain on the return of scheme assets, excluding amounts included in interest income (52) 1,178 (407)Change in restriction of pension asset recognised (as per IFRIC 14) 1 2 (2)Change in onerous obligation, excluding amounts included in interest expense (2) – –Remeasurement gain/(loss) on defined benefit obligation 489 (355) (135)
Amounts recognised in the consolidated balance sheet consist of:
As at 31 March2016
£m2015
£m2014
£m
Present value of unfunded defined benefit obligations (1) (1) (1)Present value of funded defined benefit obligations (7,667) (7,882) (6,052)Fair value of scheme assets 7,103 6,997 5,382Restriction of pension asset recognised (as per IFRIC 14) and onerous obligations (2) (1) (3)Net retirement benefit obligation (567) (887) (674)Presented as non-current liability (567) (887) (674)
NOTES TO THE CONSOLIDATED FINANCIAL STATEMENTS CONTINUED

Overview IFC–19
Strategic report 20–59
Governance 60–71
Financial statements 72–IBC 111
31 EMPLOYEE BENEFITS (CONTINUED)The most recent actuarial valuations of scheme assets and the present value of the defined benefit liability for accounting purposes were carried out at 31 March 2016 by a qualified independent actuary. The present value of the defined benefit liability, and the related current service cost and past service cost, were measured using the projected unit credit method.
The principal assumptions used in accounting for the pension schemes are set out below:
Year ended 31 March2016
%2015
%2014
%
Discount rate 3.6 3.4 4.6Expected rate of increase in compensation level of covered employees 3.5 3.6 3.9Inflation increase 3.0 3.1 3.4
For the valuation at 31 March 2016, the mortality assumptions used are the SAPS base table, in particular S2NxA tables and the Light table for members of the Jaguar Executive Pension Plan. A scaling factor of 120 per cent for males and 110 per cent for females has been used for the Jaguar Pension Plan, 115 per cent for males and 105 per cent for females for the Land Rover Pension Scheme, and 95 per cent for males and 85 per cent for females for Jaguar Executive Pension Plan.
For the valuation at 31 March 2015 and 2014, the mortality assumptions used are the SAPS base table, in particular S1NxA tables and the Light table for members of the Jaguar Executive Pension Plan. A scaling factor of 115 per cent has been used for the Jaguar Pension Plan, 110 per cent for the Land Rover Pension Scheme, and 105 per cent for males and 90 per cent for females for Jaguar Executive Pension Plan.
There is an allowance for future improvements in line with the CMI (2014) projections (2015: CMI (2014) projections, 2014: CMI (2013) projections) and an allowance for long-term improvements of 1.25 per cent per annum.
The assumed life expectations on retirement at age 65 are:
As at 31 March2016 years
2015 years
2014 years
Retiring today:Males 21.5 21.4 20.0Females 24.4 23.9 24.5Retiring in 20 years:Males 23.2 23.1 23.8Females 26.2 25.8 26.4
The sensitivity analyses below are based on a change in an assumption while holding all other assumptions constant. In practice, this is unlikely to occur, and changes in some of the assumptions may be correlated. When calculating the sensitivity of the defined benefit obligation to significant actuarial assumptions the same method (present value of the defined benefit obligation calculated with the projected unit credit method at the end of the reporting period) has been applied as when calculating the pension liability recognised within the statement of financial position.
The methods and types of assumptions used in preparing the sensitivity analysis did not change compared to previous periods.
Assumption Change in assumption Impact on scheme liabilities Impact on service cost
Discount rateIncrease/decrease
by 0.25%Decrease/increase
by £419 millionDecrease/increase
by £13 million
Inflation rateIncrease/decrease
by 0.25%Increase/decrease
by £373 millionIncrease/decrease
by £13 million
MortalityIncrease/decrease
by 1 yearIncrease/decrease
by £207 millionIncrease/decrease
by £5 million
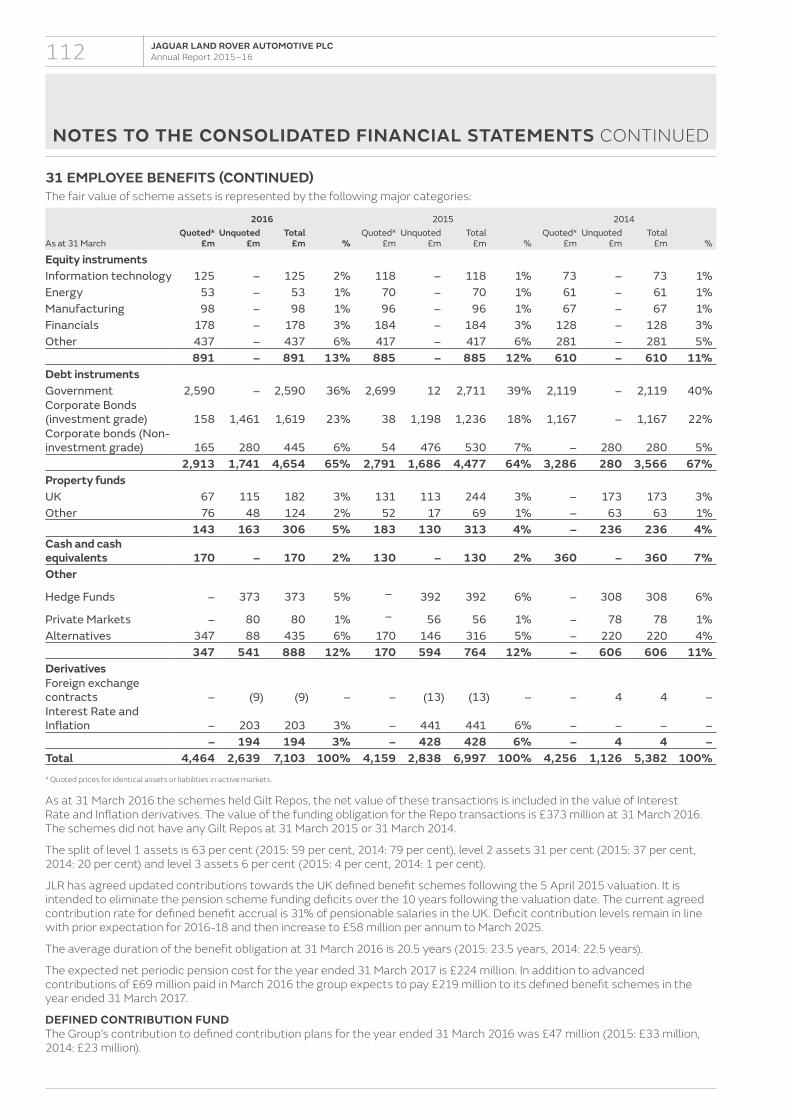
112 JAGUAR LAND ROVER AUTOMOTIVE PLC Annual Report 2015–16
31 EMPLOYEE BENEFITS (CONTINUED)The fair value of scheme assets is represented by the following major categories:
2016 2015 2014
As at 31 MarchQuoted*
£mUnquoted
£mTotal
£m %Quoted*
£mUnquoted
£mTotal
£m %Quoted*
£mUnquoted
£m Total
£m %
Equity instrumentsInformation technology 125 – 125 2% 118 – 118 1% 73 – 73 1%Energy 53 – 53 1% 70 – 70 1% 61 – 61 1%Manufacturing 98 – 98 1% 96 – 96 1% 67 – 67 1%Financials 178 – 178 3% 184 – 184 3% 128 – 128 3%Other 437 – 437 6% 417 – 417 6% 281 – 281 5% 891 – 891 13% 885 – 885 12% 610 – 610 11%Debt instrumentsGovernment 2,590 – 2,590 36% 2,699 12 2,711 39% 2,119 – 2,119 40%Corporate Bonds(investment grade) 158 1,461 1,619 23% 38 1,198 1,236 18% 1,167 – 1,167 22%Corporate bonds (Non- investment grade) 165 280 445 6% 54 476 530 7% – 280 280 5% 2,913 1,741 4,654 65% 2,791 1,686 4,477 64% 3,286 280 3,566 67%Property fundsUK 67 115 182 3% 131 113 244 3% – 173 173 3%Other 76 48 124 2% 52 17 69 1% – 63 63 1% 143 163 306 5% 183 130 313 4% – 236 236 4%Cash and cash equivalents 170 – 170 2% 130 – 130 2% 360 – 360 7%Other
Hedge Funds – 373 373 5% – 392 392 6% – 308 308 6%
Private Markets – 80 80 1% – 56 56 1% – 78 78 1%Alternatives 347 88 435 6% 170 146 316 5% – 220 220 4% 347 541 888 12% 170 594 764 12% – 606 606 11%DerivativesForeign exchange contracts – (9) (9) – – (13) (13) – – 4 4 –Interest Rate and Inflation – 203 203 3% – 441 441 6% – – – – – 194 194 3% – 428 428 6% – 4 4 –Total 4,464 2,639 7,103 100% 4,159 2,838 6,997 100% 4,256 1,126 5,382 100%
* Quoted prices for identical assets or liabilities in active markets.
As at 31 March 2016 the schemes held Gilt Repos, the net value of these transactions is included in the value of Interest Rate and Inflation derivatives. The value of the funding obligation for the Repo transactions is £373 million at 31 March 2016. The schemes did not have any Gilt Repos at 31 March 2015 or 31 March 2014.
The split of level 1 assets is 63 per cent (2015: 59 per cent, 2014: 79 per cent), level 2 assets 31 per cent (2015: 37 per cent, 2014: 20 per cent) and level 3 assets 6 per cent (2015: 4 per cent, 2014: 1 per cent).
JLR has agreed updated contributions towards the UK defined benefit schemes following the 5 April 2015 valuation. It is intended to eliminate the pension scheme funding deficits over the 10 years following the valuation date. The current agreed contribution rate for defined benefit accrual is 31% of pensionable salaries in the UK. Deficit contribution levels remain in line with prior expectation for 2016-18 and then increase to £58 million per annum to March 2025.
The average duration of the benefit obligation at 31 March 2016 is 20.5 years (2015: 23.5 years, 2014: 22.5 years).
The expected net periodic pension cost for the year ended 31 March 2017 is £224 million. In addition to advanced contributions of £69 million paid in March 2016 the group expects to pay £219 million to its defined benefit schemes in the year ended 31 March 2017.
DEFINED CONTRIBUTION FUNDThe Group’s contribution to defined contribution plans for the year ended 31 March 2016 was £47 million (2015: £33 million, 2014: £23 million).
NOTES TO THE CONSOLIDATED FINANCIAL STATEMENTS CONTINUED

Overview IFC–19
Strategic report 20–59
Governance 60–71
Financial statements 72–IBC 113
32 COMMITMENTS AND CONTINGENCIESIn the normal course of business, the Group faces claims and assertions by various parties. The Group assesses such claims and assertions and monitors the legal environment on an ongoing basis, with the assistance of external legal counsel wherever necessary. The Group records a liability for any claims where a potential loss is probable and capable of being estimated and discloses such matters in its financial statements, if material. For potential losses that are considered possible, but not probable, the Group provides disclosure in the financial statements but does not record a liability in its accounts unless the loss becomes probable. Such potential losses may be of an uncertain timing and/or amount.
The following is a description of claims and contingencies where a potential loss is possible, but not probable. Management believes that none of the contingencies described below, either individually or in aggregate, would have a material adverse effect on the Group’s financial condition, results of operations or cash flows.
LITIGATION AND PRODUCT RELATED MATTERSThe Group is involved in legal proceedings, both as plaintiff and as defendant. There are claims and potential claims as at 31 March 2016 of £6 million (2015: £11 million, 2014: £27 million) against the Group which management has not recognised as they are not considered probable. These claims and potential claims pertain to motor accident claims, consumer complaints, employment and dealership arrangements, replacement of parts of vehicles and/or compensation for deficiency in the services by the Group or its dealers.
As disclosed in note 41 (Subsequent events), the Group has provided for the estimated costs of repair following the passenger safety airbag issue in the United States. The Group recognises that there is a potential risk of further recalls in other countries in the future, however, the Group are unable at this point in time to reliably estimate the amount and timings of any potential future costs associated with this warranty issue.
OTHER TAXES AND DUESDuring the year ended 31 March 2015 the Group’s Brazilian subsidiary has received a demand for 167 million Brazilian Real (£32 million at 31 March 2016 exchange rates) in relation to additional indirect taxes (PIS and COFINS) claimed as being due on local vehicle and parts sales made in 2010. The matter is currently being contested before the Brazilian appellate authorities. Professional legal opinions obtained in Brazil fully support that the basis of the tax authority’s assertion is incorrect and, as a result, the likelihood of any settlement ultimately having to be made is considered remote. Accordingly no provision has been recognised in the financial statements and the matter is disclosed here purely for the purposes of completeness.
The Group had no other significant tax matters in dispute as at 31 March 2016, 2015 or 2014 where a potential loss was considered possible.
COMMITMENTSThe Group has entered into various contracts with vendors and contractors for the acquisition of plant and machinery, equipment and various civil contracts of capital nature aggregating to £797 million (2015: £814 million, 2014: £940 million) and £12 million (2015: £nil, 2014: £nil) relating to the acquisition of intangible assets.
The Group has entered into various contracts with vendors and contractors which include obligations aggregating to £1,836 million (2015: £642 million, 2014: £717 million) to purchase minimum or fixed quantities of material and other procurement commitments.
Commitments and contingencies also includes other contingent liabilities of £28 million (2015: £2 million, 2014: £nil).
Inventory of £nil (2015: £nil, 2014: £nil) and trade receivables with a carrying amount of £116 million (2015: £156 million, 2014: £167 million) and property, plant and equipment with a carrying amount of £nil (2015: £nil, 2014: £nil) and restricted cash with a carrying amount of £nil (2015: £nil, 2014: £nil) are pledged as collateral/security against the borrowings and commitments.
There are guarantees provided in the ordinary course of business of £nil (2015: £nil, 2014: £nil).
Commitments related to leases are set out in note 35.
Stipulated within the joint venture agreement for Chery Jaguar Land Rover Automotive Co. Ltd. is a commitment for the Group to contribute a total of CNY 3,500 million of capital, of which CNY 2,875 million has been contributed as at 31 March 2016. The outstanding commitment of CNY 625 million translates to £67 million at 31 March 2016 exchange rate.

114 JAGUAR LAND ROVER AUTOMOTIVE PLC Annual Report 2015–16
33 CAPITAL MANAGEMENTThe Group’s objectives when managing capital are to ensure the going concern operation of its entities and to maintain an efficient capital structure to reduce the cost of capital, support the corporate strategy and to meet shareholder expectations.
The Group’s policy is to borrow primarily through capital market debt issues to meet anticipated funding requirements and maintain sufficient liquidity. The Group also maintains certain undrawn committed credit facilities to provide additional liquidity. These borrowings, together with cash generated from operations, are loaned internally or contributed as equity to certain subsidiaries as required. Surplus cash in subsidiaries is pooled (where practicable) and invested to satisfy security, liquidity and yield requirements.
The capital structure is governed according to Group policies approved by the Board and is monitored by various metrics such as interest cover, as per the debt covenants.
Funding requirements are reviewed periodically with any debt issuances and capital distributions approved by the Board.
The following table summarises the capital of the Group:
As at 31 March2016
£m2015
£m2014
£m
Short-term debt 121 160 172Long-term debt 2,379 2,390 1,856Total debt* 2,500 2,550 2,028Equity 7,614 6,040 5,864Total capital 10,114 8,590 7,892
* Total debt includes finance lease obligations of £11 million (2015: £13 million, 2014: £18 million).
34 FINANCIAL INSTRUMENTSThis section gives an overview of the significance of financial instruments for the Group and provides additional information on balance sheet items that contain financial instruments.
The details of significant accounting policies, including the criteria for recognition, the basis of measurement and the basis on which income and expenses are recognised, in respect of each class of financial asset, financial liability and equity instrument are disclosed in note 2 to the consolidated financial statements.
(A) FINANCIAL ASSETS AND LIABILITIESThe following table shows the carrying amounts and fair value of each category of financial assets and liabilities as at 31 March 2016:
FINANCIAL ASSETS
Loans and receivables
£m
Derivatives in cash flow
hedging relationship
£m
Fair value through profit
and loss£m
Total carrying value
£mTotal fair value
£m
Cash and cash equivalents 3,399 – – 3,399 3,399Short-term deposits 1,252 – – 1,252 1,252Trade receivables 1,078 – – 1,078 1,078Other financial assets – current 64 54 19 137 137Other financial assets – non-current 31 143 11 185 185Total financial assets 5,824 197 30 6,051 6,051
FINANCIAL LIABILITIES
Other financial liabilities
£m
Derivatives in cash flow
hedging relationship
£m
Fair value through profit
and loss£m
Total carrying value
£mTotal fair value
£m
Accounts payable 5,758 – – 5,758 5,758Short-term borrowings 116 – – 116 116Long-term borrowings 2,373 – – 2,373 2,398Other financial liabilities – current 296 563 103 962 962Other financial liabilities – non-current 8 752 57 817 817Total financial liabilities 8,551 1,315 160 10,026 10,051
NOTES TO THE CONSOLIDATED FINANCIAL STATEMENTS CONTINUED

Overview IFC–19
Strategic report 20–59
Governance 60–71
Financial statements 72–IBC 115
34 FINANCIAL INSTRUMENTS (CONTINUED)The following table shows the carrying amounts and fair value of each category of financial assets and liabilities as at 31 March 2015:
FINANCIAL ASSETS
Loans and receivables
£m
Derivatives in cash flow
hedging relationship
£m
Fair value through profit
and loss£m
Total carrying value
£mTotal fair value
£m
Cash and cash equivalents 3,208 – – 3,208 3,208Short-term deposits 1,055 – – 1,055 1,055Trade receivables 1,112 – – 1,112 1,112Other financial assets – current 38 175 1 214 214Other financial assets – non-current 27 20 2 49 49Total financial assets 5,440 195 3 5,638 5,638
FINANCIAL LIABILITIES
Other financial liabilities
£m
Derivatives in cash flow
hedging relationship
£m
Fair value through profit
and loss£m
Total carrying value
£mTotal fair value
£m
Accounts payable 5,450 – – 5,450 5,450Short-term borrowings 156 – – 156 156Long-term borrowings 2,381 – – 2,381 2,459Other financial liabilities – current 226 669 28 923 923Other financial liabilities – non-current 10 789 43 842 842Total financial liabilities 8,223 1,458 71 9,752 9,830
The following table shows the carrying amounts and fair value of each category of financial assets and liabilities as at 31 March 2014:
FINANCIAL ASSETS
Loans and receivables
£m
Derivatives in cash flow
hedging relationship
£m
Fair value through profit
and loss £m
Total carrying value
£mTotal fair value
£m
Cash and cash equivalents 2,260 – – 2,260 2,260Short-term deposits 1,199 – – 1,199 1,199Trade receivables 831 – – 831 831Other financial assets – current 31 349 12 392 392Other financial assets – non-current 37 415 21 473 473Total financial assets 4,358 764 33 5,155 5,155
FINANCIAL LIABILITIES
Other financial liabilities
£m
Derivatives in cash flow
hedging relationship
£m
Fair value through profit
and loss £m
Total carrying value
£mTotal fair value
£m
Accounts payable 4,787 – – 4,787 4,787Short-term borrowings 167 – – 167 167Long-term borrowings 1,843 – – 1,843 1,982Other financial liabilities – current 212 54 11 277 277Other financial liabilities – non-current 14 37 18 69 69Total financial liabilities 7,023 91 29 7,143 7,282

116 JAGUAR LAND ROVER AUTOMOTIVE PLC Annual Report 2015–16
34 FINANCIAL INSTRUMENTS (CONTINUED)OFFSETTINGCertain financial assets and financial liabilities are subject to offsetting where there is currently a legally enforceable right to set off recognised amounts and the Group intends to either settle on a net basis, or to realise the asset and settle the liability simultaneously.
Derivative financial assets and financial liabilities are subject to master netting arrangements whereby in the case of insolvency, derivative financial assets and financial liabilities can be settled on a net basis.
The following table discloses the amounts that have been offset in arriving at the balance sheet presentation and the amounts that are available for offset only under certain conditions as at 31 March 2016:
Gross amount recognised
£m
Gross amount of recognised set
off in the balance sheet
£m
Net amount presented in the
balance sheet £m
Gross amount not offset in the
balance sheet £m
Cash collateral (received)/
pledged £m
Net amount after offsetting
£m
Financial assetsDerivative financial assets 227 – 227 (227) – –Cash and cash equivalents 3,507 (108) 3,399 – – 3,399 3,734 (108) 3,626 (227) – 3,399Financial liabilitiesDerivative financial liabilities 1,475 – 1,475 (227) – 1,248Short-term borrowings 224 (108) 116 – – 116 1,699 (108) 1,591 (227) – 1,364
The following table discloses the amounts that have been offset in arriving at the balance sheet presentation and the amounts that are available for offset only under certain conditions as at 31 March 2015:
Gross amount recognised
£m
Gross amount of recognised set
off in the balance sheet*
£m
Net amount presented in the
balance sheet £m
Gross amount not offset in the
balance sheet £m
Cash collateral (received)/
pledged £m
Net amount after offsetting
£m
Financial assetsDerivative financial assets 198 – 198 (198) – –Cash and cash equivalents 3,301 (93) 3,208 – – 3,208 3,499 (93) 3,406 (198) – 3,208Financial liabilitiesDerivative financial liabilities 1,529 – 1,529 (198) – 1,331Short-term borrowings 249 (93) 156 – – 156 1,778 (93) 1,685 (198) – 1,487
* Comparatives have been represented. No impact upon net amount presented in the balance sheet.
The following table discloses the amounts that have been offset in arriving at the balance sheet presentation and the amounts that are available for offset only under certain conditions as at 31 March 2014:
Gross amount recognised
£m
Gross amount of recognised set
off in the balance sheet*
£m
Net amount presented in the
balance sheet £m
Gross amount not offset in the
balance sheet £m
Cash collateral (received)/
pledged £m
Net amount after offsetting
£m
Financial assetsDerivative financial assets 797 – 797 (120) – 677Cash and cash equivalents 2,282 (22) 2,260 – – 2,260 3,079 (22) 3,057 (120) – 2,937Financial liabilitiesDerivative financial liabilities 120 – 120 (120) – –Short-term borrowings 189 (22) 167 – – 167 309 (22) 287 (120) – 167
NOTES TO THE CONSOLIDATED FINANCIAL STATEMENTS CONTINUED

Overview IFC–19
Strategic report 20–59
Governance 60–71
Financial statements 72–IBC 117
34 FINANCIAL INSTRUMENTS (CONTINUED)FAIR VALUE HIERARCHYFinancial instruments held at fair value are required to be measured by reference to the following levels.
• Quoted prices in an active market (Level 1): This level of hierarchy includes financial instruments that are measured by reference to quoted prices (unadjusted) in active markets for identical assets or liabilities;
• Valuation techniques with observable inputs (Level 2): This level of hierarchy includes financial assets and liabilities measured using inputs other than quoted prices included within Level 1 that are observable for the asset or liability, either directly (i.e. as prices) or indirectly (i.e. derived from prices);
• Valuation techniques with significant unobservable inputs (Level 3): This level of hierarchy includes financial assets and liabilities measured using inputs that are not based on observable market data (unobservable inputs). Fair values are determined in whole or in part using a valuation model based on assumptions that are neither supported by prices from observable current market transactions in the same instrument nor are they based on available market data.
There has been no change in the valuation techniques adopted or any transfers between fair value levels.
The financial instruments that are measured subsequent to initial recognition at fair value are classified as Level 2 fair value measurements, as defined by IFRS 13, being those derived from inputs other than quoted prices that are observable. These valuation techniques maximise the use of observable market data where it is available and rely as little as possible on entity specific estimates. Fair value of forward derivative financial assets and liabilities are estimated by discounting expected future contractual cash flows using prevailing market interest rate curves from Reuters. Commodity swap contracts are similarly fair valued by discounting expected future contractual cash flows. Option contracts on foreign currency are entered into on a zero cost collar basis and fair value estimates are calculated from standard Black-Scholes options pricing methodology, using prevailing market interest rates and volatilities.
Additionally, a Credit Valuation Adjustment (CVA)/Debit Value Adjustment (DVA) is taken on derivative financial assets and liabilities and is calculated by discounting the fair value gain or loss on the financial derivative using credit default swap (CDS) prices quoted for the counterparty or Jaguar Land Rover respectively. CDS prices are obtained from Bloomberg.
The long-term unsecured listed bonds are held at amortised cost. Their fair value for disclosure purposes is determined using Level 1 valuation techniques, based on the closing price at 31 March 2016 on the EURO MTF market.
Fair values of cash and cash equivalents, short-term deposits, trade receivables and payables, short-term borrowings and other financial assets and liabilities (current and non-current excluding derivatives) are assumed to approximate to cost due to the short-term maturity of the instruments and as the impact of discounting is not significant.
Management uses its best judgement in estimating the fair value of its financial instruments. However, there are inherent limitations in any estimation technique. Therefore, for substantially all financial instruments, the fair value estimates presented above are not necessarily indicative of all the amounts that the Group could have realised in a sales transaction as of respective dates. The estimated fair value amounts as of 31 March 2016, 31 March 2015 and 31 March 2014 have been measured as of the respective dates. As such, the fair values of these financial instruments subsequent to the respective reporting dates may be different than the amounts reported at each year-end.
(B) FINANCIAL RISK MANAGEMENTAs discussed in the Strategic report under the section Our Risks, the Group is exposed to foreign currency exchange rate, commodity price, interest rate, liquidity and credit risks. The Group has a risk management framework in place which monitors all of these risks.
(C) FOREIGN CURRENCY EXCHANGE RATE RISKThe fluctuation in foreign currency exchange rates may have a potential impact on the consolidated income statement, the consolidated statement of comprehensive income, the consolidated balance sheet, the consolidated statement of changes in equity and the consolidated cash flow statement where any transaction references more than one currency or where assets/liabilities are denominated in a currency other than the functional currency of the respective consolidated entities.
Considering the countries and economic environment in which the Group operates, its operations are subject to risks arising from fluctuations in exchange rates in those countries. The risks primarily relate to fluctuations in US Dollar, Chinese Yuan and Euro against the functional currency of the Company and its subsidiaries.

118 JAGUAR LAND ROVER AUTOMOTIVE PLC Annual Report 2015–16
34 FINANCIAL INSTRUMENTS (CONTINUED)i) HEDGE ACCOUNTING EXPOSURESThe Group uses foreign currency contracts to hedge its risk associated with foreign currency fluctuations relating to highly probable forecast transactions. The fair value of such contracts designated in the hedge relationship as of 31 March 2016 was a net liability of £1,118 million (2015: net liability of £1,263 million, 2014: net asset of £673 million).Cash flow hedges are expected to be recognised in profit or loss during the years ending 31 March 2017 to 2021. The Group also has a number of foreign currency options which are entered into as an economic hedge of the financial risks of the Group. The time value of options is excluded from the hedge relationship and thus the change in time value is recognised immediately in the consolidated income statement.Changes in the fair value of foreign currency contracts, to the extent determined to be an effective hedge, are recognised in the statement of other comprehensive income and the ineffective portion of the fair value change is recognised in the income statement. Accordingly, the fair value change of net loss of £169 million (2015: loss of £1,768 million, 2014: gain of £1,041 million) was recognised in other comprehensive income. The loss due to hedge ineffectiveness where forecast transactions are no longer expected to occur was £2 million (2015: loss of £5 million, 2014: gain of £5 million) which has been recognised in ‘Foreign exchange (loss)/gain’ in the consolidated income statement. The gain on derivative contracts not eligible for hedging was £88 million (2015: loss of £161 million, 2014: gain of £57 million) which has been recognised in ‘Foreign exchange (loss)/gain’ in the consolidated income statement.A 10 per cent depreciation/appreciation of the foreign currency underlying such contracts would have resulted in an approximate additional (loss)/gain of (£1,824) million/£1,690 million (2015: £1,251 million/(£1,382) million, 2014: £734 million/(£893) million) in equity and a gain/(loss) of £60 million/£54 million (2015: £165 million/(£91) million, 2014: £51 million/(£31) million) in the consolidated income statement.In addition to using derivative contracts to economically hedge future purchases in US Dollars, the Group issues bonds denominated in US Dollars to give a degree of natural hedging of future sales revenues.ii) BALANCE SHEET EXPOSURESThe Group is also exposed to fluctuations in exchange rates which impact the valuation of foreign currency denominated assets and liabilities of its national sales companies and also foreign currency denominated balances on all Group’s balance sheet at each reporting period end.The following table sets forth information relating to foreign currency exposure as of 31 March 2016:
As at 31 March 2016US Dollar
£mChinese Yuan
£mEuro
£mOthers*
£mTotal
£m
Financial assets 664 666 621 384 2,335Financial liabilities (2,367) (571) (1,670) (326) (4,934)Net exposure asset/(liability) (1,703) 95 (1,049) 58 (2,599)
A 10 per cent appreciation/depreciation of the US Dollar, Chinese Yuan and Euro would result in an increase/decrease in the Group’s net profit before tax and total equity by approximately £170 million, £10 million and £105 million respectively for the year ended 31 March 2016.
The following table sets forth information relating to foreign currency exposure as of 31 March 2015:
As at 31 March 2015US Dollar
£mChinese Yuan
£mEuro
£mOthers*
£mTotal
£m
Financial assets 727 742 483 312 2,264Financial liabilities (2,139) (756) (1,098) (182) (4,175)Net exposure asset/(liability) (1,412) (14) (615) 130 (1,911)
A 10 per cent appreciation/depreciation of the US Dollar, Chinese Yuan and Euro would result in an increase/decrease in the Group’s net profit before tax and total equity by approximately £141 million, £1 million and £62 million respectively for the year ended 31 March 2015.The following table sets forth information relating to foreign currency exposure as of 31 March 2014:
As at 31 March 2014US Dollar
£mChinese Yuan
£mEuro
£mOthers*
£mTotal
£m
Financial assets 463 840 296 335 1,934Financial liabilities (1,594) (715) (1,322) (285) (3,916)Net exposure asset/(liability) (1,131) 125 (1,026) 50 (1,982)
A 10 per cent appreciation/depreciation of the US Dollar, Chinese Yuan and Euro would result in an increase/decrease in the Group’s net profit before tax and total equity by approximately £113 million, £13 million and £103 million respectively for the year ended 31 March 2014.* Others include Japanese Yen, Russian Rouble, Singapore Dollar, Swiss Franc, Australian Dollar, South African Rand, Thai Baht, Korean Won etc.
NOTES TO THE CONSOLIDATED FINANCIAL STATEMENTS CONTINUED

Overview IFC–19
Strategic report 20–59
Governance 60–71
Financial statements 72–IBC 119
34 FINANCIAL INSTRUMENTS (CONTINUED)(D) COMMODITY PRICE RISKThe Group is exposed to commodity price risk arising from the purchase of certain raw materials such as aluminium, copper, platinum and palladium. This risk is mitigated through the use of derivative contracts and fixed price contracts with suppliers. The derivative contracts do not qualify for hedge accounting as the commodity exposure does not meet the hedge accounting requirements of IAS 39.
The total fair value loss on commodities of £113 million (2015: loss of £38 million, 2014: loss of £18 million) has been recognised in other income in the consolidated income statement. The losses reported do not reflect the purchasing benefits received by the Group which are included within material and other cost of sales.
A 10 per cent appreciation/depreciation of all commodity prices underlying such contracts would have resulted in a gain/(loss) of £52 million (2015: £52 million, 2014: £36 million).
(E) INTEREST RATE RISKInterest rate risk is the risk that changes in market interest rates will lead to changes in interest income and expense for the Group.
In addition to issuing long-term fixed-rate bonds, the Group has other facilities in place which are primarily used to finance working capital that are subject to variable interest rates. When undertaking a new debt issuance the Board will consider the fixed/floating interest rate mix of the Group, the outlook for future interest rates and the appetite for certainty of funding costs.
The risk estimates provided assume a parallel shift of 100 basis points interest rate across all yield curves. This calculation also assumes that the change occurs at the balance sheet date and has been calculated based on risk exposures outstanding as at that date. The year-end balances are not necessarily representative of the average debt outstanding during the year.
As of 31 March 2016 net financial liabilities of £116 million (2015: £156 million, 2014: £167 million) were subject to the variable interest rate. An increase/decrease of 100 basis points in interest rates at the balance sheet date would result in an impact of £1 million (2015: £2 million, 2014: £2 million) in the consolidated income statement and £nil (2015, 2014: £nil) in equity.
(F) LIQUIDITY RISKLiquidity risk is the risk that the Group will not be able to meet its financial obligations as they fall due.
The Group’s policy on liquidity risk is to maintain sufficient liquidity in the form of cash and undrawn borrowing facilities to meet the Group’s operating requirements with an appropriate level of headroom.
The following are the undiscounted contractual maturities of financial liabilities, including estimated interest payments:
As at 31 March 2016
Carrying amount
£m
Contractual cash flows
£m
1 year or less
£m
1 to <2 years
£m
2 to <5 years
£m
5 years and over
£m
Financial liabilitiesLong-term borrowings 2,373 2,935 107 107 1,429 1,292Short-term borrowings 116 116 116 – – –Finance lease obligations 11 14 5 2 3 4Other financial liabilities 293 316 276 12 28 –Accounts payable 5,758 5,758 5,758 – – –Derivative financial instruments 1,475 1,882 725 698 459 –Total contractual maturities 10,026 11,021 6,987 819 1,919 1,296
As at 31 March 2015
Carrying amount
£m
Contractual cash flows
£m
1 year or less
£m
1 to <2 years
£m
2 to <5 years
£m
5 years and over
£m
Financial liabilitiesLong-term borrowings 2,381 3,066 111 110 1,510 1,335Short-term borrowings 156 156 156 – – –Finance lease obligations 13 15 6 5 4 –Other financial liabilities 223 235 210 12 13 –Accounts payable 5,450 5,450 5,450 – – –Derivative financial instruments 1,529 1,903 753 616 534 –Total contractual maturities 9,752 10,825 6,686 743 2,061 1,335

120 JAGUAR LAND ROVER AUTOMOTIVE PLC Annual Report 2015–16
34 FINANCIAL INSTRUMENTS (CONTINUED)(F) LIQUIDITY RISK (CONTINUED)
As at 31 March 2014
Carrying amount
£m
Contractual cash flows
£m
1 year or less
£m
1 to <2 years
£m
2 to <5 years
£m
5 years and over
£m
Financial liabilitiesLong-term borrowings 1,843 2,667 117 116 768 1,666 Short-term borrowings 167 167 167 – – –Finance lease obligations 18 20 6 6 8 –Other financial liabilities 208 231 195 13 23 –Accounts payable 4,787 4,787 4,787 – – –Derivative financial instruments 120 130 71 48 11 –Total contractual maturities 7,143 8,002 5,343 183 810 1,666
(G) CREDIT RISKThe majority of the Group’s credit risk pertains to the risk of financial loss arising from counterparty default on cash investments.
All Group cash is invested according to strict credit criteria and actively monitored by Group Treasury in conjunction with the current market valuation of derivative contracts. To support this, the Board has implemented an investment policy which places limits on the maximum cash investment that can be made with any single counterparty depending on their published external credit rating.
To a lesser extent the Group has an exposure to counterparties on trade receivables. The Group will seek to mitigate credit risk on sales to third parties through the use of payment at the point of delivery, credit insurance and letters of credit from banks which meet internal rating criteria.
None of the financial instruments of the Group result in material concentrations of credit risks.
EXPOSURE TO CREDIT RISKThe carrying amount of financial assets represents the maximum credit exposure.
FINANCIAL ASSETS None of the Group’s cash equivalents, including term deposits with banks, are past due or impaired. Regarding other financial assets that are neither past due nor impaired, there were no indications as at 31 March 2016 (2015, 2014: no indications) that defaults in payment obligations will occur.
Trade and other receivables past due and impaired are set out below:
As at 31 March
2016 Gross
£m
2016 Impairment
£m
2015 Gross
£m
2015 Impairment
£m
2014 Gross
£m
2014 Impairment
£m
Not yet due 967 – 1,070 – 795 2Overdue < 3 months 145 31 56 – 52 –Overdue >3<6 months 22 22 4 2 4 –Overdue >6 months 12 7 12 9 10 6Total 1,146 60 1,142 11 861 8
Included within trade receivables is £116 million (2015: £156 million, 2014: £167 million) of receivables which are part of a debt factoring arrangement. These assets do not qualify for derecognition due to the recourse arrangements in place. The related liability of £116 million (2015: £156 million, 2014: £167 million) is in short-term borrowings. Both the asset and associated liability are stated at fair value.
NOTES TO THE CONSOLIDATED FINANCIAL STATEMENTS CONTINUED

Overview IFC–19
Strategic report 20–59
Governance 60–71
Financial statements 72–IBC 121
35 LEASESLEASES AS LESSEENon-cancellable finance lease rentals are payable as follows:
As at 31 March2016
£m2015
£m2014
£m
Less than one year 5 4 5Between one and five years 5 9 13More than five years 4 – –Total lease payments 14 13 18Less future finance charges (3) – –Present value of lease obligations 11 13 18
The above leases relate to amounts payable under the minimum lease payments on plant and machinery. The Group leased certain of its manufacturing equipment under finance lease that mature between 2016 and 2030. The Group has options to purchase certain equipment for a nominal amount at the end of lease term.
Non-cancellable operating lease rentals are payable as follows:
As at 31 March2016
£m2015
£m2014
£m
Less than one year 49 47 26Between one and five years 72 60 39More than five years 33 26 18Total lease payments 154 133 83
The Group leases a number of properties, plant and machinery, IT hardware and software under operating leases.
LEASES AS LESSORThe future minimum lease receipts under non-cancellable operating leases are as follows:
As at 31 March2016
£m2015
£m2014
£m
Less than one year 2 2 4Between one and five years 1 – –More than five years 10 – –Total lease receipts 13 2 4
The above leases relate to amounts receivable in respect of land and buildings and fleet car sales. The average lease life is less than one year.
36 ACQUISITION OF SUBSIDIARYOn 16 April 2015, the Group acquired 100 per cent of the share capital of Silkplan Limited, obtaining control of Silkplan Limited. The amounts recognised in respect of the assets acquired are set out in the table below.
£m
Recognised amounts of assets acquiredProperty, plant and equipment 11Total identifiable assets 11Total consideration 11Satisfied by:Cash 11Total consideration transferred and cash outflow arising on acquisition 11
No goodwill arose on the acquisition. The Company contributed £nil revenue and £nil to the Group’s profit for the period between the date of acquisition and the balance sheet date.

122 JAGUAR LAND ROVER AUTOMOTIVE PLC Annual Report 2015–16
37 SEGMENT REPORTING Operating segments are defined as components of the Group about which separate financial information is available that is evaluated regularly by the chief operating decision-maker, or decision-making group, in deciding how to allocate resources and in assessing performance.
The Group operates in the automotive segment. The automotive segment includes all activities relating to development, design, manufacture, assembly and sale of vehicles including financing thereof, as well as sale of related parts and accessories from which the Group derives its revenues. The Group has only one operating segment, so no separate segment report is given.
The geographic spread of sales and non-current assets is as disclosed below:UK £m
US £m
China £m
Rest of Europe £m
Rest of World £m
Total £m
31 March 2016Revenue 4,529 4,344 4,930 4,109 4,296 22,208Non-current assets 10,475 18 16 26 137 10,67231 March 2015Revenue 3,564 3,112 7,595 3,200 4,395 21,866Non-current assets 9,357 16 11 10 32 9,42631 March 2014Revenue 2,989 2,683 6,687 2,978 4,049 19,386Non-current assets 7,376 13 8 10 17 7,424
In the table above, non-current assets comprise of property, plant and equipment and intangible assets.
NOTES TO THE CONSOLIDATED FINANCIAL STATEMENTS CONTINUED

Overview IFC–19
Strategic report 20–59
Governance 60–71
Financial statements 72–IBC 123
38 NOTES TO THE CONSOLIDATED CASH FLOW STATEMENT(A) RECONCILIATION OF PROFIT BEFORE TAX TO CASH GENERATED FROM OPERATIONS
2016 £m
2015 £m
2014 £m
Profit for the year 1,312 2,038 1,879Adjustments for:Depreciation and amortisation 1,418 1,051 875Write-down of intangible assets 28 – –Loss on sales of assets 13 7 4Foreign exchange loss/(gain) on loans 54 178 (87)Income tax expense 245 576 622Loss on embedded derivative – – 47Finance expense (net) 90 135 138Finance income (38) (48) (38)Foreign exchange (gain)/loss on derivatives (86) 166 (57)Foreign exchange (gain)/loss on short-term deposits (11) (51) 41Unrealised loss on commodities* 59 30 6Share of (profit)/loss of equity accounted investments (64) 6 7Exceptional item 157 – –Other non-cash adjustments 2 5 –Cash flows from operating activities before changes in assets and liabilities 3,179 4,093 3,437Trade receivables 34 (281) 96Other financial assets* (12) (4) 12Other current assets 30 26 121Inventories (451) (242) (379)Other non-current assets (18) (15) (24)Accounts payable 443 418 534Other current liabilities 52 (21) (86)Other financial liabilities* 71 13 (4)Other non-current liabilities and retirement benefit obligation 255 (102) (63)Provisions 143 131 180Cash generated from operations 3,726 4,016 3,824
* Comparatives have been revised for the amendment made in the current year to separately disclose ‘Unrealised loss on commodities’, which has resulted in a reclassification of amounts from ‘Other financial assets’ and ‘Other financial liabilities’. There is no impact on ‘Cash generated from operations’ as previously reported for the year ended 31 March 2015 or 31 March 2014.
(B) CASH FLOWS FROM/(USED IN) INVESTING ACTIVITIESPurchases of property, plant and equipment and cash paid for intangible assets are presented net of £33 million (2015: £14 million, 2014: £7 million) of capital government grants received.

124 JAGUAR LAND ROVER AUTOMOTIVE PLC Annual Report 2015–16
NOTES TO THE CONSOLIDATED FINANCIAL STATEMENTS CONTINUED
39 RELATED PARTY TRANSACTIONSThe Group’s related parties principally consist of Tata Sons Limited, subsidiaries, associates and joint ventures of Tata Sons Limited which includes Tata Motors Limited (the ultimate parent Company), subsidiaries, associates and joint ventures of Tata Motors Limited. The Group routinely enters into transactions with these related parties in the ordinary course of business including transactions for the sale and purchase of products with its associates and joint ventures. Transactions and balances with the Group’s own subsidiaries are eliminated on consolidation.
The following table summarises related party transactions and balances not eliminated in the consolidated financial statements. All related party transactions are conducted under normal terms of business. The amounts outstanding are unsecured and will be settled in cash.
With joint ventures of
the Group£m
With Tata Sons Limited and its
subsidiaries and joint ventures
£m
With immediate or ultimate
parent and its subsidiaries, joint
ventures and associates
£m
31 March 2016Sale of products 315 2 48Purchase of goods – – 118Purchase of property, plant and equipment – 6 –Services received 85 146 103Services rendered 64 – 2Trade and other receivables 71 1 28Accounts payable 2 7 3631 March 2015*Sale of products 149 – 65Purchase of goods – – 51Services received 46 141 105Services rendered 23 – 3Trade and other receivables 47 – 27Accounts payable – 27 3831 March 2014*Sale of products – – 55Services received 38 73 85Services rendered 26 – –Trade and other receivables 15 – 15Accounts payable – 5 1
* The 2015 and 2014 comparative balances for transactions with joint ventures have been restated, in order to fully reflect the transactions between all of the Group’s joint venture interests.
COMPENSATION OF KEY MANAGEMENT PERSONNEL
Year ended 31 March2016
£m2015
£m2014
£m
Short-term benefits 16 17 18Post-employment benefits 1 2 1Share-based payments 2 7 3Compensation for loss of office – 1 –Total compensation of key management personnel 19 27 22
In addition to the compensation noted above, a loan of £0.7 million was granted to a member of key management personnel in the year ended 31 March 2014. This loan is for a term of eight years and is interest bearing at the HMRC official rate.
Refer to note 31 for information on transactions with post-employment benefit plans.

Overview IFC–19
Strategic report 20–59
Governance 60–71
Financial statements 72–IBC 125
40 ULTIMATE PARENT COMPANY AND PARENT COMPANY OF LARGER GROUPThe immediate parent undertaking is TML Holdings Pte. Ltd. (Singapore) and ultimate parent undertaking and controlling party is Tata Motors Limited, India which is the parent of the smallest and largest group to consolidate these financial statements.
Copies of the Tata Motors Limited, India consolidated financial statements can be obtained from the Group Secretary, Tata Motors Limited, Bombay House, 24, Homi Mody Street, Mumbai – 400001, India.
41 SUBSEQUENT EVENTSIn May 2016, the Company proposed an ordinary dividend of £150 million to its immediate parent TML Holdings Pte. Ltd. (Singapore). This amount was paid in full in June 2016.
In May 2016, the Group repaid early the remaining $84 million Senior Notes due 2021 for a redemption premium of £2 million (see note 24).
In May 2016, a passenger airbag safety recall was announced in the United States by the National Highway Traffic System Administration (NHTSA) in respect of airbags from a supplier (Takata). Certain front-passenger airbags from Takata are installed in vehicles sold by the Group. The Group has considered this to be an adjusting Post Balance Sheet event and has recognised an additional provision of £67 million for the estimated cost of repairs in the Consolidated Income Statement for the year ended 31 March 2016. The provision is expected to be utilised between one to four years.

126 JAGUAR LAND ROVER AUTOMOTIVE PLC Annual Report 2015–16
PARENT COMPANY BALANCE SHEET
As at 31 March Note2016
£m2015
£m2014
£m
Non-current assetsInvestments 42 1,655 1,655 1,655 Other financial assets 43 2,392 2,404 1,868 Other non-current assets 44 6 5 6 Deferred tax assets 45 1 8 8 Total non-current assets 4,054 4,072 3,537 Current assetsCash and cash equivalents 46 – – 1 Other financial assets 43 211 66 61 Other current assets 44 2 3 2 Total current assets 213 69 64 Total assets 4,267 4,141 3,601 Current liabilitiesOther financial liabilities 48 26 31 28 Deferred finance income 2 3 2 Current income tax liabilities 5 12 12 Total current liabilities 33 46 42 Non-current liabilitiesLong-term borrowings 47 2,373 2,381 1,843 Deferred finance income 25 28 31 Total non-current liabilities 2,398 2,409 1,874 Total liabilities 2,431 2,455 1,916 Equity attributable to equity holders of the parentOrdinary shares 49 1,501 1,501 1,501 Capital redemption reserve 49 167 167 167 Retained earnings 168 18 17 Equity attributable to equity holders of the parent 1,836 1,686 1,685 Total liabilities and equity 4,267 4,141 3,601
These parent Company financial statements were approved by the Board of Directors and authorised for issue on 18 July 2016. They were signed on its behalf by:
Dr. Ralf SpethChief Executive OfficerCompany registered number: 06477691

Overview IFC–19
Strategic report 20–59
Governance 60–71
Financial statements 72–IBC 127
PARENT COMPANY STATEMENT OF CHANGES IN EQUITY
Ordinary share capital
£m
Capital redemption
reserve £m
Profit and loss reserve
£m
Total equity
£m
Balance at 1 April 2015 1,501 167 18 1,686Profit for the year – – 300 300Total comprehensive income – – 300 300Dividend paid – – (150) (150)Balance at 31 March 2016 1,501 167 168 1,836
Balance at 1 April 2014 1,501 167 17 1,685Profit for the year – – 151 151Total comprehensive income – – 151 151Dividend paid – – (150) (150)Balance at 31 March 2015 1,501 167 18 1,686
Balance at 1 April 2013 1,501 167 48 1,716Profit for the year – – 119 119Total comprehensive income – – 119 119Dividend paid – – (150) (150)Balance at 31 March 2014 1,501 167 17 1,685

128 JAGUAR LAND ROVER AUTOMOTIVE PLC Annual Report 2015–16
Year ended 31 March2016
£m2015
£m2014
£m
Cash flows used in operating activitiesProfit for the year 300 151 119Adjustments for:Foreign exchange loss on loans – – 1Loss on embedded derivatives – – 47Income tax credit – – (8)Dividends received (300) (150) (150)Finance income (136) (227) (285)Finance expense 135 225 236Cash flows used in operating activities before changes in assets and liabilities (1) (1) (40)Other financial assets 62 (383) (19)Other current liabilities (3) 2 2Net cash from/(used in) operating activities 58 (382) (57)
Cash flows from investing activitiesFinance income received 133 222 303Dividends received 150 150 150Net cash from investing activities 283 372 453
Cash flows from/(used in) financing activitiesFinance expenses and fees paid (133) (220) (329)Proceeds from issuance of long-term borrowings – 1,032 829Repayment of long-term borrowings (58) (653) (746)Repayment of short-term borrowings – – –Dividends paid (150) (150) (150)Net cash (used in)/from financing activities (341) 9 (396)
Net decrease in cash and cash equivalents – (1) –Cash and cash equivalents at beginning of year – 1 1Cash and cash equivalents at end of year – – 1
PARENT COMPANY CASH FLOW STATEMENT

Overview IFC–19
Strategic report 20–59
Governance 60–71
Financial statements 72–IBC 129
42 INVESTMENTSInvestments consist of the following:
2016 £m
2015 £m
2014 £m
Cost of unquoted equity investments at beginning and end of year 1,655 1,655 1,655
The Company has not made any investments or disposals of investments in the year.
The Company has the following 100 per cent direct interest in the ordinary shares of a subsidiary undertaking:
Subsidiary undertakingPrincipal place of business and country of incorporation Principal activity
Jaguar Land Rover Holdings Limited England and Wales Holding company
The shareholding above is recorded at acquisition value in the Company’s accounts. Details of the indirect subsidiary undertakings are as follows, each being a 100 per cent indirect interest in the ordinary share capital of the Jaguar Land Rover Holdings Limited:
Name of companyPrincipal place of business and country of incorporation Principal activity
Jaguar Land Rover Limited England and WalesManufacture and sale of motor vehicles
Jaguar e Land Rover Brasil Indústria e Comércio de Veículos Ltda (change of name from Jaguar e Land Rover Brasil Importacao e Comercia de Veiculos Ltda) Brazil
Manufacturing, distribution and sales
Jaguar Land Rover (South Africa) (Pty) Limited South Africa Distribution and sales
Jaguar Land Rover Australia Pty Ltd Australia Distribution and sales
Jaguar Land Rover Austria GmbH Austria Distribution and sales
Jaguar Land Rover Automotive Trading (Shanghai) Co. Ltd. China Distribution and sales
Shanghai Jaguar Land Rover Automotive Service Co. Ltd China Distribution and sales
Jaguar Land Rover Belux N.V. Belgium Distribution and sales
Jaguar Land Rover Canada, ULC Canada Distribution and sales
Jaguar Land Rover Deutschland GmbH Germany Distribution and sales
Jaguar Land Rover Espana SL Spain Distribution and sales
Jaguar Land Rover France SAS France Distribution and sales
Jaguar Land Rover India Limited India Distribution and sales
Jaguar Land Rover Italia SpA Italy Distribution and sales
Jaguar Land Rover Japan Limited Japan Distribution and sales
Jaguar Land Rover Korea Co. Ltd. Korea Distribution and sales
Jaguar Land Rover Nederland BV Holland Distribution and sales
Jaguar Land Rover North America, LLC. USA Distribution and sales
Jaguar Land Rover Portugal-Veiculos e Pecas, Lda. Portugal Distribution and sales
Limited Liability Company ‘Jaguar Land Rover’ (Russia) Russia Distribution and sales
NOTES TO THE PARENT COMPANY FINANCIAL STATEMENTS

130 JAGUAR LAND ROVER AUTOMOTIVE PLC Annual Report 2015–16
42 INVESTMENTS (CONTINUED)
Name of companyPrincipal place of business and country of incorporation Principal activity
Jaguar Land Rover (South Africa) Holdings Limited England and Wales Holding company
JLR Nominee Company Limited England and Wales Dormant
Land Rover Ireland Limited Ireland Non-trading
JDHT Limited England and Wales Non-trading
Daimler Transport Vehicles Limited England and Wales Dormant
Jaguar Cars South Africa (Pty) Limited South Africa Dormant
Jaguar Cars Limited England and Wales Dormant
Land Rover Exports Limited England and Wales Dormant
S. S. Cars Limited England and Wales Dormant
The Daimler Motor Company Limited England and Wales Dormant
The Jaguar Collection Limited England and Wales Dormant
The Lanchester Motor Company Limited England and Wales Dormant
Jaguar Land Rover Pension Trustees Limited England and Wales Dormant
Jaguar Land Rover Slovakia s.r.o. Slovakia Manufacturing
Jaguar Land Rover Singapore Pte. – Ltd Singapore Distribution and sales
Jaguar Racing Limited England and Wales Race team management
InMotion Ventures Limited England and Wales Distribution and sales
Silkplan Limited England and Wales Non-trading
Details of the indirect holdings in equity accounted investments are given in note 14 to the consolidated financial statements.
43 OTHER FINANCIAL ASSETS
As at 31 March2016
£m2015
£m2014
£m
Non-currentReceivables from subsidiaries 2,392 2,404 1,868CurrentReceivables from subsidiaries 211 66 61
44 OTHER ASSETS
As at 31 March2016
£m2015
£m2014
£m
Non-currentPrepaid expenses 6 5 6CurrentPrepaid expenses 2 3 2
45 DEFERRED TAX ASSETS AND LIABILITIESAs at 31 March 2016 the Company has recognised a deferred tax asset of £1 million (2015: £8 million, 2014: £8 million) in relation to tax losses.
46 CASH AND CASH EQUIVALENTS Cash and cash equivalents consist of the following:
As at 31 March2016
£m2015
£m2014
£m
Cash and cash equivalents – – 1
NOTES TO THE PARENT COMPANY FINANCIAL STATEMENTS CONTINUED

Overview IFC–19
Strategic report 20–59
Governance 60–71
Financial statements 72–IBC 131
47 INTEREST BEARING LOANS AND BORROWINGS
As at 31 March2016
£m2015
£m2014
£m
EURO MTF listed debt 2,373 2,381 1,843Long-term borrowings 2,373 2,381 1,843
EURO MTF LISTED DEBTThe bonds are listed on the EURO MTF market, which is a listed market regulated by the Luxembourg Stock Exchange.
Details of the tranches of the bonds outstanding at 31 March 2016 are as follows:
• $84 million Senior Notes due 2021 at a coupon of 8.125 per cent per annum – issued May 2011;
• $500 million Senior Notes due 2023 at a coupon of 5.625 per cent per annum – issued January 2013;
• $700 million Senior Notes due 2018 at a coupon of 4.125 per cent per annum – issued December 2013;
• £400 million Senior Notes due 2022 at a coupon of 5.000 per cent per annum – issued January 2014;
• $500 million Senior Notes due 2019 at a coupon of 4.250 per cent per annum – issued October 2014;
• £400 million Senior Notes due 2023 at a coupon of 3.875 per cent per annum – issued February 2015;
• $500 million Senior Notes due 2020 at a coupon of 3.500 per cent per annum – issued March 2015.
Details of the tranches of the bonds repaid in the year ended 31 March 2016 are as follows:
• £58 million Senior Notes due 2020 at a coupon of 8.250 per cent per annum – issued March 2012.
In May 2016, the Company repaid early the remaining $84 million Senior Notes due 2021 for a redemption premium of £2 million.
Details of the tranches of the bonds repaid in the year ended 31 March 2015 are as follows:
• $326 million Senior Notes due 2021 at a coupon of 8.125 per cent per annum – issued May 2011;
• £442 million Senior Notes due 2020 at a coupon of 8.250 per cent per annum – issued March 2012.
Details of the tranches of the bonds repaid in the year ended 31 March 2014 are as follows:
• £500 million Senior Notes due 2018 at a coupon of 8.125 per cent per annum – issued May 2011;
• $410 million Senior Notes due 2018 at a coupon of 7.75 per cent per annum – issued May 2011.
The contractual cash flows of interest bearing borrowings as of 31 March 2016 is set out below, including estimated interest payments and assumes the debt will be repaid at the maturity date.
As at 31 March2016
£m2015
£m2014
£m
Due in 1 year or less 117 123 1172nd and 3rd years 717 240 2314th and 5th years 857 1,403 653More than 5 years 1,292 1,336 1,666Total contractual cash flows 2,983 3,102 2,667

132 JAGUAR LAND ROVER AUTOMOTIVE PLC Annual Report 2015–16
48 OTHER FINANCIAL LIABILITIES
As at 31 March2016
£m2015
£m2014
£m
CurrentInterest payable 22 24 23Other 4 7 5Total current other financial liabilities 26 31 28
49 CAPITAL AND RESERVES
As at 31 March2016
£m2015
£m2014
£m
Authorised, called up and fully paid1,500,642,163 ordinary shares of £1 each 1,501 1,501 1,501Total capital 1,501 1,501 1,501
The holders of ordinary shares are entitled to receive dividends as declared from time to time and are entitled to one vote per share at meetings of the Company.
The capital redemption reserve of £167 million (2015, 2014: £167 million) was created in March 2011 on the cancellation of share capital.
50 DIVIDENDS
Year ended 31 March 2016
£m2015
£m2014
£m
Dividend proposed for the previous year paid during the year of £0.10 (2015: £0.10, 2014: £0.10) per ordinary share 150 150 150 Amounts recognised as distributions to equity holders during the year 150 150 150 Proposed dividend for the year of £0.10 (2015: £0.10, 2014: £0.10) per ordinary share 150 150 150
In May 2016, the Company proposed an ordinary dividend of £150 million to its immediate parent TML Holdings Pte. Ltd. (Singapore). This amount was paid in full in June 2016.
During the year ended 31 March 2016, the Company identified that, whilst the Company had profits available to pay the dividends, prior to the approval of distributions made in respect of the financial years ended 31 March 2012 – 31 March 2015, the Company did not comply with the requirement under section 836 and 838 of the Companies Act 2006 to deliver interim accounts to the registrar of companies. Corrective action was taken in March 2016 to regularise matters by ratifying the distribution made for each of the respective years and releasing the Company and the directors from any liabilities connected with those distributions.
51 COMMITMENTS AND CONTINGENCIESThe Company does not have any commitments or contingencies at 31 March 2016, 2015 or 2014.
52 CAPITAL MANAGEMENTThe Company’s objectives when managing capital are to ensure the going concern operation of its subsidiary undertakings and to maintain an efficient capital structure to reduce the cost of capital, support the corporate strategy and to meet shareholder expectations.
The Company’s policy is to borrow primarily through capital market debt issues to meet anticipated funding requirements and maintain sufficient liquidity. The Company also maintains certain undrawn committed credit facilities to provide additional liquidity. These borrowings, together with cash generated from operations, are loaned internally or contributed as equity to certain subsidiaries as required. Surplus cash in subsidiaries is pooled (where practicable) and invested to satisfy security, liquidity and yield requirements.
NOTES TO THE PARENT COMPANY FINANCIAL STATEMENTS CONTINUED

Overview IFC–19
Strategic report 20–59
Governance 60–71
Financial statements 72–IBC 133
52 CAPITAL MANAGEMENT (CONTINUED)The capital structure is governed according to Company policies approved by the Board and is monitored by various metrics such as debt to Adjusted EBITDA and Adjusted EBITDA to interest ratios, as per the debt covenants and rating agency guidance. Funding requirements are reviewed periodically with any debt issuances and capital distributions approved by the Board.
As at 31 March2016
£m2015
£m2014
£m
Long-term borrowings 2,373 2,381 1,843 Total debt 2,373 2,381 1,843 Equity 1,836 1,686 1,685 Total capital 4,209 4,067 3,528
53 FINANCIAL INSTRUMENTSThis section gives an overview of the significance of financial instruments for the Company and provides additional information on balance sheet items that contain financial instruments.
The details of significant accounting policies, including the criteria for recognition, the basis of measurement and the basis on which income and expenses are recognised, in respect of each class of financial asset, financial liability and equity instrument are disclosed in note 2 to the consolidated financial statements.
(A) FINANCIAL ASSETS AND LIABILITIESThe following table presents the carrying amounts and fair value of each category of financial assets and liabilities as of 31 March 2016:
FINANCIAL ASSETS
Loans and receivables
£m
Fair value through profit
and loss £m
Total carrying value
£mTotal fair value
£m
Other financial assets – current 211 – 211 211Other financial assets – non-current 2,392 – 2,392 2,392Total financial assets 2,603 – 2,603 2,603
FINANCIAL LIABILITIES
Other financial liabilities
£m
Fair value through profit
and loss £m
Total carrying value
£mTotal fair value
£m
Other financial liabilities – current 26 – 26 26Long-term borrowings 2,373 – 2,373 2,398Total financial liabilities 2,399 – 2,399 2,424
The following table presents the carrying amounts and fair value of each category of financial assets and liabilities as of 31 March 2015:
FINANCIAL ASSETS
Loans and receivables
£m
Fair value through profit
and loss £m
Total carrying value
£mTotal fair value
£m
Other financial assets – current 66 – 66 66Other financial assets – non-current 2,404 – 2,404 2,404Total financial assets 2,470 – 2,470 2,470
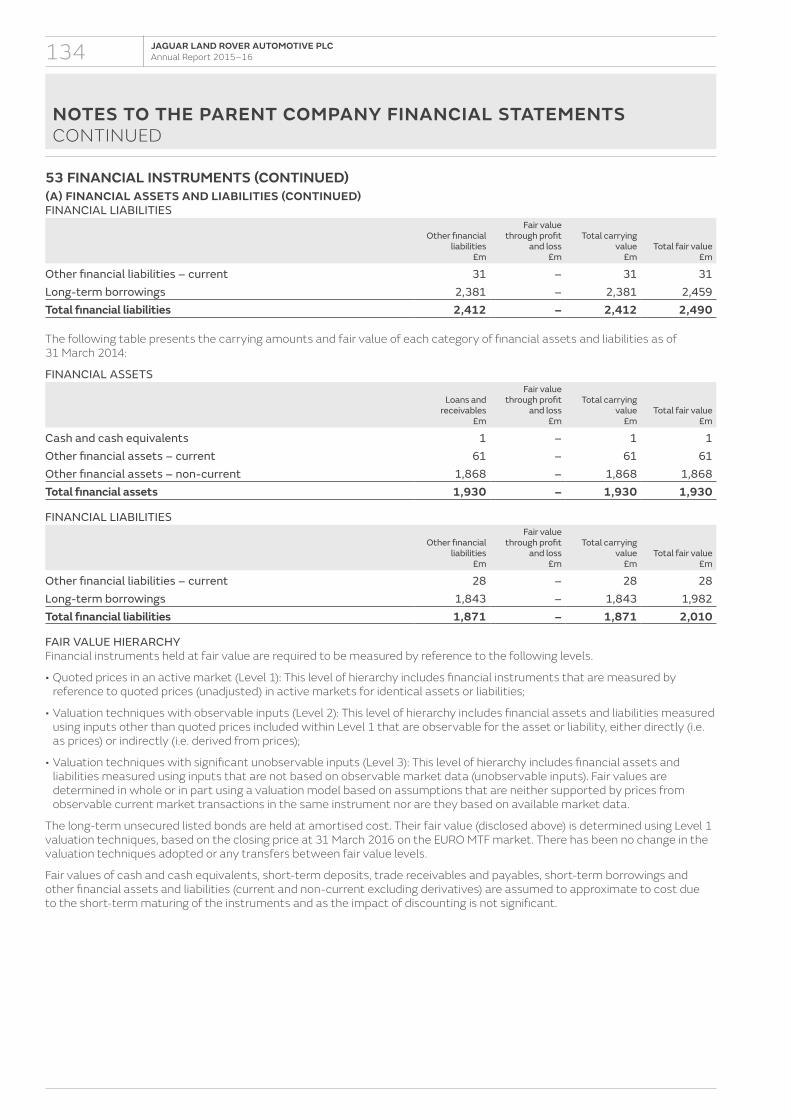
134 JAGUAR LAND ROVER AUTOMOTIVE PLC Annual Report 2015–16
53 FINANCIAL INSTRUMENTS (CONTINUED)(A) FINANCIAL ASSETS AND LIABILITIES (CONTINUED)FINANCIAL LIABILITIES
Other financial liabilities
£m
Fair value through profit
and loss £m
Total carrying value
£mTotal fair value
£m
Other financial liabilities – current 31 – 31 31Long-term borrowings 2,381 – 2,381 2,459Total financial liabilities 2,412 – 2,412 2,490
The following table presents the carrying amounts and fair value of each category of financial assets and liabilities as of 31 March 2014:
FINANCIAL ASSETS
Loans and receivables
£m
Fair value through profit
and loss £m
Total carrying value
£mTotal fair value
£m
Cash and cash equivalents 1 – 1 1Other financial assets – current 61 – 61 61Other financial assets – non-current 1,868 – 1,868 1,868Total financial assets 1,930 – 1,930 1,930
FINANCIAL LIABILITIES
Other financial liabilities
£m
Fair value through profit
and loss £m
Total carrying value
£mTotal fair value
£m
Other financial liabilities – current 28 – 28 28Long-term borrowings 1,843 – 1,843 1,982Total financial liabilities 1,871 – 1,871 2,010
FAIR VALUE HIERARCHYFinancial instruments held at fair value are required to be measured by reference to the following levels.
• Quoted prices in an active market (Level 1): This level of hierarchy includes financial instruments that are measured by reference to quoted prices (unadjusted) in active markets for identical assets or liabilities;
• Valuation techniques with observable inputs (Level 2): This level of hierarchy includes financial assets and liabilities measured using inputs other than quoted prices included within Level 1 that are observable for the asset or liability, either directly (i.e. as prices) or indirectly (i.e. derived from prices);
• Valuation techniques with significant unobservable inputs (Level 3): This level of hierarchy includes financial assets and liabilities measured using inputs that are not based on observable market data (unobservable inputs). Fair values are determined in whole or in part using a valuation model based on assumptions that are neither supported by prices from observable current market transactions in the same instrument nor are they based on available market data.
The long-term unsecured listed bonds are held at amortised cost. Their fair value (disclosed above) is determined using Level 1 valuation techniques, based on the closing price at 31 March 2016 on the EURO MTF market. There has been no change in the valuation techniques adopted or any transfers between fair value levels.
Fair values of cash and cash equivalents, short-term deposits, trade receivables and payables, short-term borrowings and other financial assets and liabilities (current and non-current excluding derivatives) are assumed to approximate to cost due to the short-term maturing of the instruments and as the impact of discounting is not significant.
NOTES TO THE PARENT COMPANY FINANCIAL STATEMENTS CONTINUED

Overview IFC–19
Strategic report 20–59
Governance 60–71
Financial statements 72–IBC 135
53 FINANCIAL INSTRUMENTS (CONTINUED)Management uses its best judgement in estimating the fair value of its financial instruments. However, there are inherent limitations in any estimation technique. Therefore, for substantially all financial instruments, the fair value estimates presented above are not necessarily indicative of all the amounts that the Company could have realised in a sales transaction as of respective dates. The estimated fair value amounts as of 31 March 2016, 31 March 2015 and 31 March 2014 have been measured as of the respective dates. As such, the fair values of these financial instruments subsequent to the respective reporting dates may be different than the amounts reported at each year-end.
(B) FINANCIAL RISK MANAGEMENTAs discussed in the Strategic report under the section Our risks, the Company is exposed to foreign currency exchange rate, commodity price, interest rate, liquidity and credit risks. The Company has a risk management framework in place which monitors all of these risks.
(C) FOREIGN CURRENCY EXCHANGE RATE RISKThe fluctuation in foreign currency exchange rates may have potential impact on the income statement and statement of changes in equity, where any transaction references more than one currency or where assets/liabilities are denominated in a currency other than the functional currency of the Company.
As at 31 March 2016, 31 March 2015 and 31 March 2014, there are no designated cash flow hedges.
The Company’s operations are subject to risks arising from fluctuations in exchange rates. The risks primarily relate to fluctuations in the GBP:US Dollar rate as the Company has US Dollar assets and liabilities and a GBP functional currency. The following analysis has been calculated based on the gross exposure as of the balance sheet date which could affect the income statement.
The following table sets forth information relating to foreign currency exposure as at 31 March 2016:US Dollar
£m
Financial assets 1,610Financial liabilities (1,609)Net exposure asset 1
A 10 per cent appreciation/depreciation of the US Dollar would result in an increase/decrease in the Company’s net profit before tax and net assets by approximately £nil.
The following table sets forth information relating to foreign currency exposure as at 31 March 2015:US Dollar
£m
Financial assets 1,565Financial liabilities (1,564)Net exposure asset 1
A 10 per cent appreciation/depreciation of the US Dollar would result in an increase/decrease in the Company’s net profit before tax and net assets by approximately £nil.
The following table sets forth information relating to foreign currency exposure as at 31 March 2014:US Dollar
£m
Financial assets 1,078Financial liabilities (1,066)Net exposure asset 12
A 10 per cent appreciation/depreciation of the US Dollar would result in an increase/decrease in the Company’s net profit before tax and net assets by approximately £1 million.

136 JAGUAR LAND ROVER AUTOMOTIVE PLC Annual Report 2015–16
53 FINANCIAL INSTRUMENTS (CONTINUED)(D) INTEREST RATE RISKInterest rate risk is measured by using the cash flow sensitivity for changes in variable interest rates.
The Company is presently funded with long-term fixed interest rate bonds. The Company is subject to variable interest rates on certain other debt obligations.
As of 31 March 2016 net financial assets of £34 million (2015: £34 million, 2014: £25 million) were subject to the variable interest rate. An increase/decrease of 100 basis points in interest rates at the balance sheet date would result in an impact of £nil (2015: £nil, 2014: £nil).
The risk estimates provided assume a parallel shift of 100 basis points interest rate across all yield curves. This calculation also assumes that the change occurs at the balance sheet date and has been calculated based on risk exposures outstanding as at that date. The year-end balances are not necessarily representative of the average debt outstanding during the year.
(E) LIQUIDITY RISKLiquidity risk is the risk that the Company will not be able to meet its financial obligations as they fall due.
The Company’s policy on liquidity risk is to ensure that sufficient borrowing facilities are available to fund ongoing operations without the need to carry significant net debt over the medium term. The quantum of committed borrowing facilities available to the Company is reviewed regularly and is designed to exceed forecast peak gross debt levels.
The following are the undiscounted contractual maturities of financial liabilities, including estimated interest payments:
As at 31 March 2016
Carrying amount
£m
Contractual cash flows
£m
1 year or less
£m
1 to <2 years
£m
2 to <5 years
£m
5 years and over
£m
Financial liabilitiesLong-term borrowings 2,373 2,935 107 107 1,429 1,292Other financial liabilities 26 52 14 10 28 –Total contractual maturities 2,399 2,987 121 117 1,457 1,292
As at 31 March 2015
Carrying amount
£m
Contractual cash flows
£m
1 year or less
£m
1 to <2 years
£m
2 to <5 years
£m
5 years and over
£m
Financial liabilitiesLong-term borrowings 2,381 3,066 111 110 1,510 1,335Other financial liabilities 31 44 20 11 13 –Total contractual maturities 2,412 3,110 131 121 1,523 1,335
As at 31 March 2014
Carrying amount
£m
Contractual cash flows
£m
1 year or less
£m
1 to <2 years
£m
2 to <5 years
£m
5 years and over
£m
Financial liabilitiesLong-term borrowings 1,843 2,667 117 116 768 1,666Other financial liabilities 28 5 5 – – –Total contractual maturities 1,871 2,672 122 116 768 1,666
NOTES TO THE PARENT COMPANY FINANCIAL STATEMENTS CONTINUED

53 FINANCIAL INSTRUMENTS (CONTINUED)(F) CREDIT RISKFinancial instruments that are subject to concentrations of credit risk consist of loans to subsidiaries, based in a varietyof geographies and markets.
EXPOSURE TO CREDIT RISKThe carrying amount of financial assets represents the maximum credit exposure.
FINANCIAL ASSETSNone of the Company’s cash equivalents or other financial receivables, including time deposits with banks, are past due or impaired. Regarding other financial assets that are neither past due nor impaired, there were no indications as at 31 March 2016 (2015, 2014: no indications) that defaults in payment obligations will occur.
54 RELATED PARTY TRANSACTIONSThe Company’s related parties principally consist of Tata Sons Limited, subsidiaries, associates and joint ventures of Tata Sons Limited which includes Tata Motors Limited (the ultimate parent Company), subsidiaries, associates and joint ventures of Tata Motors Limited. The Company routinely enters into transactions with these related parties in the ordinary course of business.
The following table summarises related party transactions and balances not eliminated in the consolidated financial statements:
With subsidiaries £m
With immediate parent
£m
31 March 2016Loans to subsidiaries 2,603 –31 March 2015Loans to subsidiaries 2,470 –31 March 2014Loans to subsidiaries 1,929 –
COMPENSATION OF KEY MANAGEMENT PERSONNEL
Year ended 31 March2016
£m2015
£m2014
£m
Short-term benefits 4 3 2Post-employment benefits 1 2 1Total compensation of key management personnel 5 5 3
Apart from the directors, the Company did not have any employees and had no employee costs in the years ended 31 March 2016, 2015 and 2014.
55 ULTIMATE PARENT COMPANY AND PARENT COMPANY OF LARGER GROUPThe immediate parent undertaking is TML Holdings Pte. Ltd. (Singapore) and ultimate parent undertaking and controlling party is Tata Motors Limited, India which is the parent of the smallest and largest group to consolidate these financial statements.
Copies of the Tata Motors Limited, India consolidated financial statements can be obtained from the Group Secretary, Tata Motors Limited, Bombay House, 24, Homi Mody Street, Mumbai – 400001, India.
56 SUBSEQUENT EVENTSIn May 2016, the Company proposed an ordinary dividend of £150 million to its immediate parent TML Holdings Pte. Ltd. (Singapore). This amount was paid in full in June 2016.
In May 2016, the Company repaid early the remaining $84 million Senior Notes due 2021 for a redemption premium of £2 million.
Designed and produced by Radley Yeldar www.ry.com
Overview IFC–19
Strategic report 20–59
Governance 60–71
Financial statements 72–IBC