financial statements consolidated statement of … · financial statements consolidated statement...
TRANSCRIPT

FINANCIAL STATEMENTSCONSOLIDATED STATEMENT OF INCOME
For the years ended 31 December
in US$’000 Notes2019 2018
Restated(i)
Continuing operationsRevenue from contracts with customers 10.1 14,597,831 15,339,393Cost of sales (13,333,021) (14,059,500)Gross profit 1,264,810 1,279,893Selling and operating costs 10.2 (1,481,978) (931,555)General and administrative expenses 10.3 (166,591) (196,314)Other operating income 10.4 81,124 9,078Other operating expenses 10.4 (31,666) (6,141)Share of net profits and losses of associates 9.2 6,831 5,919Operating loss / (profit) (327,470) 160,880Finance income 10.5 30,286 136,912Finance costs 10.6 (323,176) (232,394)Net foreign exchange gains/(losses) 10.7 9,946 9,874Loss / (profit) before tax (610,414) 75,272Income tax expense 11.1 (77,427) (60,579)Loss / (profit) after tax from continuing operations (687,841) 14,693Loss after tax from discontinued operations 12.1 (103,942) (45,675)Loss for the year (791,783) (30,982)
Attributable to:Owners of the parent (780,531) (25,208)Non-controlling interests (11,252) (5,774)
(i) The 2018 consolidated statement of income has been restated to reflect the classification of the Australian commercial and retail fuels business under discontinued operations.
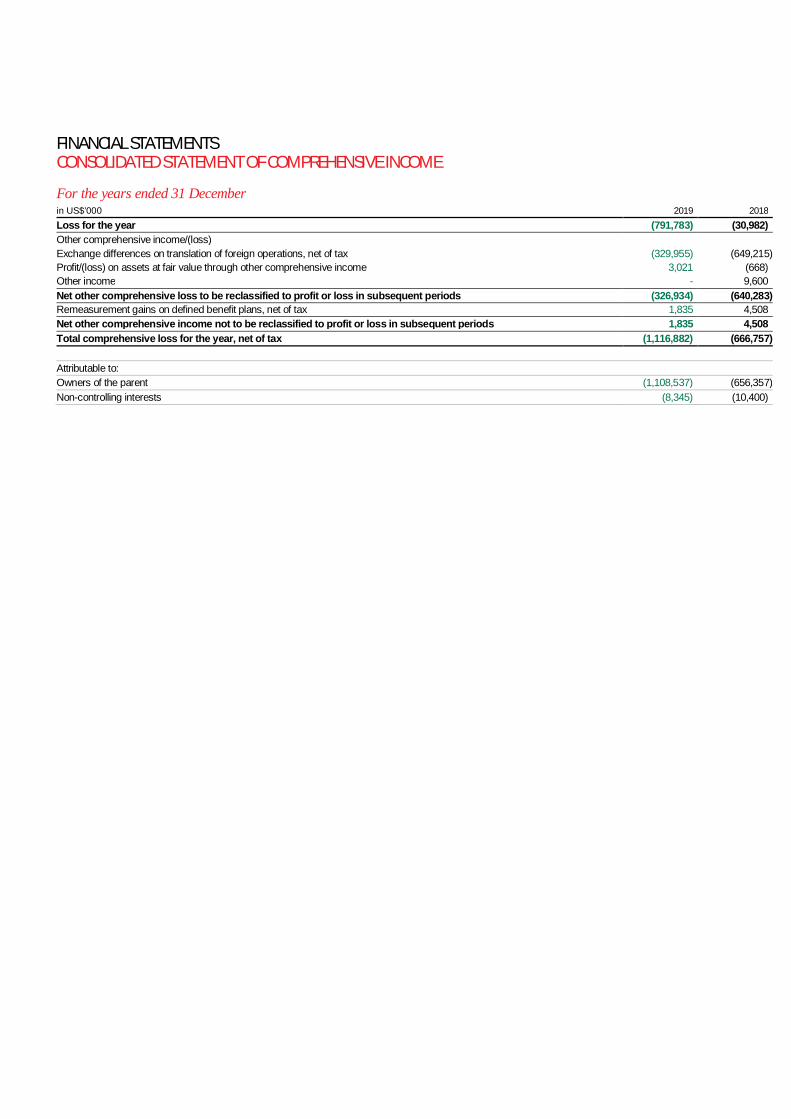
FINANCIAL STATEMENTSCONSOLIDATED STATEMENT OF COMPREHENSIVE INCOME
For the years ended 31 Decemberin US$’000 2019 2018Loss for the year (791,783) (30,982)Other comprehensive income/(loss)Exchange differences on translation of foreign operations, net of tax (329,955) (649,215)Profit/(loss) on assets at fair value through other comprehensive income 3,021 (668)Other income - 9,600Net other comprehensive loss to be reclassified to profit or loss in subsequent periods (326,934) (640,283)Remeasurement gains on defined benefit plans, net of tax 1,835 4,508Net other comprehensive income not to be reclassified to profit or loss in subsequent periods 1,835 4,508Total comprehensive loss for the year, net of tax (1,116,882) (666,757)
Attributable to:Owners of the parent (1,108,537) (656,357)Non-controlling interests (8,345) (10,400)

FINANCIAL STATEMENTSCONSOLIDATED STATEMENT OF FINANCIAL POSITION
For the years ended 31 Decemberin US$’000 Notes 2019 2018 restatedAssetsNon-current assetsProperty and equipment 13 2,420,519 3,158,720Intangible assets and goodwill 14 606,124 1,273,008Right-of-use 15 682,257 -Investments in associates 9.2 27,643 39,932Other financial assets 18 89,455 88,639Deferred tax assets 11.5 52,384 109,940Other assets 19 101,123 121,719Total non-current assets 3,979,505 4,791,958Current assetsInventories 17 1,022,175 909,662Other assets 19 341,684 386,294Income tax receivable 11.4 14,993 15,934Trade receivables 20 619,724 834,252Other financial assets 18 31,587 89,018Cash and cash equivalents 21 619,023 644,496Total current assets 2,649,186 2,879,656Asset classified as held for sale 860,117 -Total assets 7,488,808 7,671,614Equity and liabilitiesEquityShare capital 22 2,060,035 2,054,166Retained earnings 52,256 848,955Foreign currency translation reserve (1,794,559) (1,461,944)Other components of equity 5,568 3,980Equity attributable to owners of the parent 323,300 1,445,157Non-controlling interests 124,076 135,909Total equity 447,376 1,581,066Non-current liabilitiesInterest-bearing loans and borrowings 23 2,724,934 2,828,303Lease liabilities 24 591,189 -Retirement benefit obligations 294 2,121Other financial liabilities 26 4,528 10,103Deferred tax liabilities 11.5 50,997 54,842Provisions 25 43,042 43,444Total non-current liabilities 3,414,984 2,938,813Current liabilitiesTrade and other payables 27 2,619,443 2,598,873Interest-bearing loans and borrowings 23 284,733 457,032Lease liabilities 24 79,890 -Other financial liabilities 26 57,860 40,799Income tax payable 11.4 36,739 40,151Provisions 25 21,430 14,880Total current liabilities 3,100,095 3,151,735Liabilities directly associated with the assets classified as held for sale 526,353 -Total liabilities 7,041,432 6,090,548Total equity and liabilities 7,488,808 7,671,614
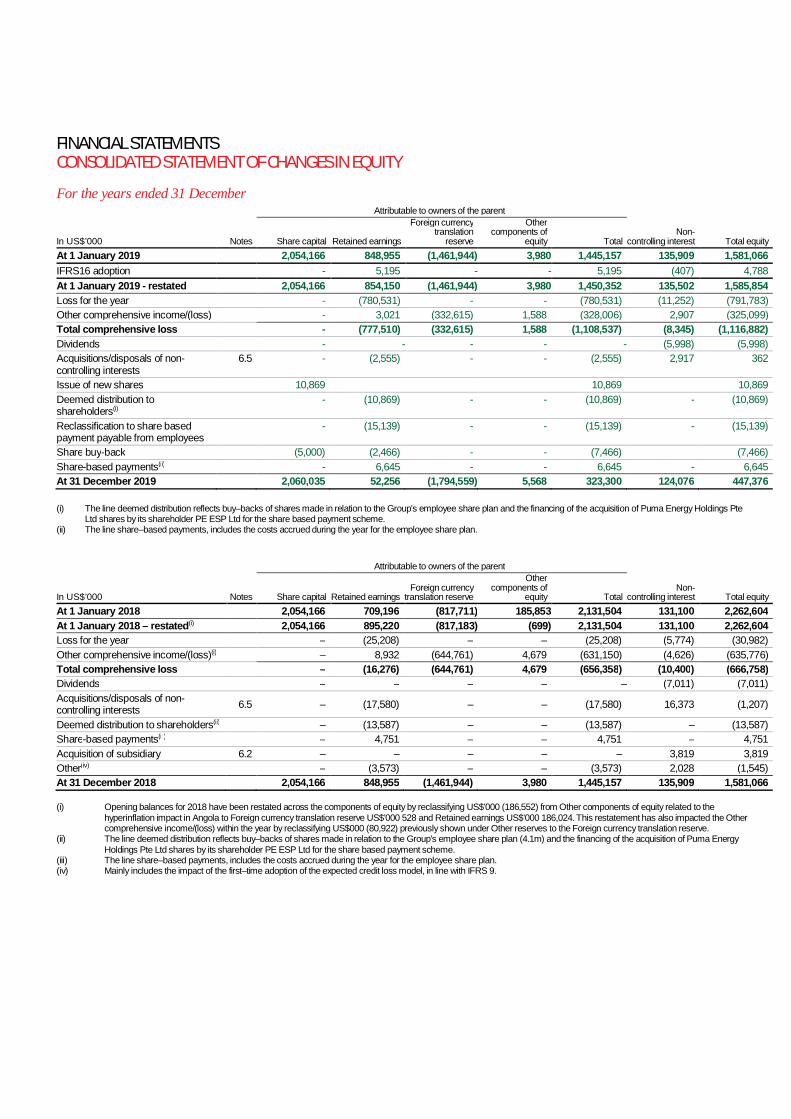
FINANCIAL STATEMENTSCONSOLIDATED STATEMENT OF CHANGES IN EQUITY
For the years ended 31 DecemberAttributable to owners of the parent
In US$’000 Notes Share capital Retained earnings
Foreign currencytranslation
reserve
Othercomponents of
equity TotalNon-
controlling interest Total equityAt 1 January 2019 2,054,166 848,955 (1,461,944) 3,980 1,445,157 135,909 1,581,066IFRS16 adoption - 5,195 - - 5,195 (407) 4,788At 1 January 2019 - restated 2,054,166 854,150 (1,461,944) 3,980 1,450,352 135,502 1,585,854Loss for the year - (780,531) - - (780,531) (11,252) (791,783)Other comprehensive income/(loss) - 3,021 (332,615) 1,588 (328,006) 2,907 (325,099)Total comprehensive loss - (777,510) (332,615) 1,588 (1,108,537) (8,345) (1,116,882)Dividends - - - - - (5,998) (5,998)Acquisitions/disposals of non-controlling interests
6.5 - (2,555) - - (2,555) 2,917 362
Issue of new shares 10,869 10,869 10,869Deemed distribution toshareholders(i)
- (10,869) - - (10,869) - (10,869)
Reclassification to share basedpayment payable from employees
- (15,139) - - (15,139) - (15,139)
Share buy-back (5,000) (2,466) - - (7,466) (7,466)Share-based payments(ii) - 6,645 - - 6,645 - 6,645At 31 December 2019 2,060,035 52,256 (1,794,559) 5,568 323,300 124,076 447,376
(i) The line deemed distribution reflects buy–backs of shares made in relation to the Group’s employee share plan and the financing of the acquisition of Puma Energy Holdings PteLtd shares by its shareholder PE ESP Ltd for the share based payment scheme.
(ii) The line share–based payments, includes the costs accrued during the year for the employee share plan.
Attributable to owners of the parent
In US$’000 Notes Share capital Retained earningsForeign currency
translation reserve
Othercomponents of
equity TotalNon-
controlling interest Total equityAt 1 January 2018 2,054,166 709,196 (817,711) 185,853 2,131,504 131,100 2,262,604At 1 January 2018 – restated(i) 2,054,166 895,220 (817,183) (699) 2,131,504 131,100 2,262,604Loss for the year – (25,208) – – (25,208) (5,774) (30,982)Other comprehensive income/(loss)(i) – 8,932 (644,761) 4,679 (631,150) (4,626) (635,776)Total comprehensive loss – (16,276) (644,761) 4,679 (656,358) (10,400) (666,758)Dividends – – – – – (7,011) (7,011)Acquisitions/disposals of non-controlling interests 6.5 – (17,580) – – (17,580) 16,373 (1,207)
Deemed distribution to shareholders(ii) – (13,587) – – (13,587) – (13,587)Share-based payments(iii) – 4,751 – – 4,751 – 4,751Acquisition of subsidiary 6.2 – – – – – 3,819 3,819Other(iv) – (3,573) – – (3,573) 2,028 (1,545)At 31 December 2018 2,054,166 848,955 (1,461,944) 3,980 1,445,157 135,909 1,581,066
(i) Opening balances for 2018 have been restated across the components of equity by reclassifying US$’000 (186,552) from Other components of equity related to thehyperinflation impact in Angola to Foreign currency translation reserve US$’000 528 and Retained earnings US$’000 186,024. This restatement has also impacted the Othercomprehensive income/(loss) within the year by reclassifying US$000 (80,922) previously shown under Other reserves to the Foreign currency translation reserve.
(ii) The line deemed distribution reflects buy–backs of shares made in relation to the Group’s employee share plan (4.1m) and the financing of the acquisition of Puma EnergyHoldings Pte Ltd shares by its shareholder PE ESP Ltd for the share based payment scheme.
(iii) The line share–based payments, includes the costs accrued during the year for the employee share plan.(iv) Mainly includes the impact of the first–time adoption of the expected credit loss model, in line with IFRS 9.

FINANCIAL STATEMENTSCONSOLIDATED STATEMENT OF CASH FLOWS
For the years ended 31 Decemberin US$’000 Notes 2019 2018Operating activitiesLoss before tax from continuing operations (610,414) 75,272Loss before tax from discontinued operations (52,896) (54,923)Loss / (profit) before tax (663,310) 20,349Non-cash adjustments to reconcile profit before tax to net cash flows:
Depreciation and impairment of property and equipment 10.2, 13 405,813 359,853Amortisation and impairment of intangible assets 10.2, 14 575,555 79,604Amortisation and impairment of lease right-of-use 15 146,074 -Tangible and intangible assets written off 493 -Gain on disposal of assets and investments 10.4 (79,315) (1,188)Net interest expense 10.5, 10.6 211,142 218,515Lease financial costs 7.2, 12.2 68,634 -Dividend income 10.5 (3,769) (3,730)Share of net profit of associate 9.2 (7,132) (6,166)Provisions 12,404 (1,597)Changes in value of derivative financial instruments 115,469 (112,685)Gain on bond exchange / modification of private placement 10.5 - (13,803)Effect from hyperinflation adjustment 10.6 10,602 (83,988)
Working capital adjustments:Increase/(decrease) in trade, other receivables and prepayments 112,243 (347,920)Decrease/(increase) in inventories (226,858) 101,103Increase in trade, other payables and accrued expenses 149,730 744,685
Interest received 10.5 26,507 21,517Dividends received from associates 1,970 2,821Income tax paid (62,330) (50,070)Net cash flows from operating activities 793,922 927,300
Investing activitiesNet proceeds from sale of subsidiaries and investments 6.6 136,499 25,290Proceeds from sale of assets 39,177 6,759Purchase of intangible assets 14 (8,242) (16,767)Purchase of property and equipment 13 (137,817) (262,541)Acquisitions of subsidiaries, net of cash acquired 6.3 - (4,165)Dividends received 10.5 2,624 3,730Net cash flows from / (used in) investing activities 32,241 (247,694)
Financing activitiesLoans (granted)/reimbursed (22,022) (453)Proceeds from/(repayment of) borrowings (303,008) (938,824)Proceeds from bond issuance 23 - 750,000Interest paid (227,328) (238,112)Lease payments (172,657) -Divestment/(acquisition) of non-controlling interests 6.5 - (8,320)Dividends paid (5,998) (17,262)Deemed distribution to shareholder (7,466) (13,587)Net cash flows used in financing activities (738,479) (466,558)Net increase in cash and cash equivalents 87,684 213,048Effects of exchange rate differences (110,661) (87,755)Cash and cash equivalents at 1 January 21 644,496 519,203Cash and cash equivalents 21 621,519 644,496Less: cash and cash equivalents under discontinued operations 2,496 -Cash and cash equivalents at 31 December under continuing operations 619,023 644,496

FINANCIAL STATEMENTSNOTES TO THE CONSOLIDATED FINANCIAL STATEMENTS
1. Corporate informationPuma Energy Holdings Pte Ltd (the ‘Company’) was incorporated inSingapore as a private company limited by shares on 2 May 2013. Theregistered office of the Company is 1 Marina Boulevard #28-00, One MarinaBoulevard, Singapore 018989.
The principal business activities of the Company and its subsidiaries(the ‘Group’) are the ownership and operation of storage facilities for, andthe sale and distribution of, petroleum products.
The Group is owned by Trafigura PE Holding Ltd (49.42%), SonangolHoldings Lda (27.99%), Cochan Holdings LLC (15.48%) and other investors(7.11%).
2. Accounting methods2.1 Basis of preparationThe consolidated financial statements of the Group have been prepared inaccordance with International Financial Reporting Standards (‘IFRS’) asissued by the International Accounting Standards Board (‘IASB’).
The consolidated financial statements have been prepared on ahistorical cost basis, except for derivative financial instruments that havebeen measured at fair value and those inventories that qualify for fair valueaccounting using the IAS 2 Inventories exemption.
The Group had current assets of US$2,649 million and currentliabilities of US$3,100 million at 31 December 2019 (2018: current assets ofUS$2,880 million and current liabilities of US$3,152 million). Despite the factthat the Group’s current liabilities exceeded the Group’s current assets, theGroup has access to various undrawn loan facilities as described in Note28.2 and therefore the Group’s consolidated financial statements have beenprepared on a going concern basis.
2.2 Basis of consolidationThe consolidated financial statements comprise the financial statements ofthe Company and its subsidiaries at 31 December 2019. Control isachieved when the Group is exposed, or has rights, to variable returns fromits involvement with the investee and has the ability to affect those returnsthrough its power over the investee. Specifically, the Group controls aninvestee if and only if the Group has all of the following:– Power over the investee (i.e. existing rights that give it the current ability to
direct the relevant activities of the investee).– Exposure, or rights, to variable returns from its involvement
with the investee.– The ability to use its power over the investee to affect its returns.
When the Group has less than a majority of the voting or similar rights of aninvestee, the Group considers all relevant facts and circumstances inassessing whether it has power over an investee, including:
– The contractual arrangement with the other vote holders of the investee.– Rights arising from other contractual arrangements.– The Group voting rights and potential voting rights.
The Group reassesses whether or not it controls an investee if facts andcircumstances indicate that there are changes to one or more of the threeelements of control. Consolidation of a subsidiary begins when the Groupobtains control over the subsidiary and ceases when the Group losescontrol of the subsidiary. Assets, liabilities, income and expenses of asubsidiary acquired or disposed of during the year are included in theconsolidated financial statements from the date the Group gains controluntil the date the Group ceases to control the subsidiary.
Profit or loss and each component of other comprehensive incomeare attributed to the equity holders of the parent of the Group and to thenon-controlling interests, even if this results in the non-controlling interestshaving a deficit balance. When necessary, adjustments are made to thefinancial statements of subsidiaries to bring their accounting policies into linewith the Group accounting policies. All intra-Group assets, liabilities, equity,income, expenses and cash flows relating to transactions betweenmembers of the Group are eliminated in full on consolidation.
A change in the ownership interest of a subsidiary, without a loss of control,is accounted for as an equity transaction. If the Group loses control over asubsidiary, it:
– Derecognises the assets (including goodwill) and liabilities of thesubsidiary.
– Derecognises the carrying amount of any non-controlling interests.– Derecognises the cumulative translation differences recorded in equity.– Recognises the fair value of the consideration received.– Recognises the fair value of any investment retained.– Recognises any surplus or deficit in profit or loss.– Reclassifies the parent’s share of components previously recognised in
other comprehensive income to profit or loss or retained earnings, asappropriate, as would be required if the Group had directly disposed ofthe related assets or liabilities.
Subsidiaries whose functional currencies have experienced a cumulativeinflation rate of close to 100% over the past three years apply the rules ofIAS 29 Financial Reporting in Hyperinflationary Economies. Gains or lossesincurred upon adjusting the carrying amounts of non-monetary assets andliabilities for inflation are recognised in the income statement. Thesubsidiaries in Angola and Zimbabwe restate non-monetary items in thebalance sheet in line with the requirements of IAS 29.
The two hyperinflationary economies applicable to the Group areAngola and Zimbabwe. The hyperinflationary treatment was applicable toAngola for the full year in 2018 but has been ceased at 31 March 2019. ForZimbabwe the hyperinflationary treatment has been applied starting with 1January 2019. The financial statements of the major subsidiaries in thesetwo countries are first adjusted for the effect of inflation with any gain or losson the net monetary position recorded in the related functional lines in theconsolidated income statement and then translated into US Dollars.
2.3 Summary of significant accounting policiesa) Business combinationsAcquisitions of businesses are accounted for using the acquisition method.The consideration transferred in a business combination is measured at fairvalue, which is calculated as the sum of the acquisition-date fair values ofthe assets transferred by the Group, liabilities incurred by the Group to theformer owners of the acquiree and the equity interests issued by the Groupin exchange for control of the acquiree. Acquisition-related costs aregenerally recognised in profit or loss as incurred.At the acquisition date, the identifiable assets acquired, and the liabilitiesassumed, are recognised at their fair value, except that:
– Deferred tax assets or liabilities, and assets or liabilities related toemployee benefit arrangements are recognised and measured inaccordance with IAS 12 Income Taxes and IAS 19 Employee Benefitsrespectively.
– Assets (or disposal groups) that are classified as held for sale inaccordance with IFRS 5 Non-current Assets Held for Sale andDiscontinued Operations are measured in accordance with that standard.
Non-controlling interests that are present ownership interests and entitletheir holders to a proportionate share of the entity’s net assets in the eventof liquidation may be initially measured either at fair value or at the non-controlling interests’ proportionate share of the recognised amounts of theacquiree’s identifiable net assets. The choice of measurement basis ismade on a transaction-by-transaction basis. Other types of non-controllinginterests are measured at fair value or, when applicable, on the basisspecified in another IFRS.When the consideration transferred by the Group in a business combinationincludes assets or liabilities resulting from a contingent considerationarrangement, the contingent consideration is measured at its acquisition-date fair value and included as part of the consideration transferred in abusiness combination. Changes in the fair value of the contingentconsideration that qualify as measurement period adjustments are adjusted

FINANCIAL STATEMENTSNOTES TO THE CONSOLIDATED FINANCIAL STATEMENTS CONTINUED
retrospectively, with corresponding adjustments against goodwill.Measurement period adjustments are adjustments that arise from additionalinformation obtained during the ‘measurement period’ (which cannot exceedone year from the acquisition date) about facts and circumstances thatexisted at the acquisition date.
When a business combination is achieved in stages, the Group’spreviously held equity interest in the acquiree is remeasured to fair value atthe acquisition date (e.g. the date when the Group obtains control) and theresulting gain or loss, if any, is recognised in profit or loss. Amounts arisingfrom interests in the acquiree prior to the acquisition date that havepreviously been recognised in other comprehensive income are reclassifiedto profit or loss where such treatment would be appropriate if that interestwere disposed of.
If the initial accounting for a business combination is incomplete bythe end of the reporting period in which the combination occurs, the Groupreports provisional amounts for the items for which the accounting isincomplete. Those provisional amounts are adjusted during themeasurement period, or additional assets or liabilities are recognised, toreflect new information obtained about facts and circumstances that existedat the acquisition date that, if known, would have affected the amountsrecognised at that date.
b) Foreign currency translationEach entity in the Group determines its own functional currency and itemsincluded in the financial statements of each entity are measured using thatfunctional currency.
Transactions and balancesTransactions in foreign currencies are initially recorded by the Group entitiesat their respective functional currency spot rates prevailing at the date thetransaction first qualifies for recognition.
Monetary assets and liabilities denominated in foreign currencies areconverted at the exchange rate in effect at the closing date of each reportingperiod. These items are recorded, according to their nature, either ascomponents of finance income or finance costs in profit or loss.
Non-monetary items that are measured in terms of historical cost in aforeign currency are translated using the exchange rates at the dates of theinitial transactions. Non-monetary items measured at fair value in a foreigncurrency are translated using the exchange rates at the date when the fairvalue is determined. The gain or loss arising on translation of non-monetaryitems is recognised in line with the gain or loss of the item that gave rise tothe translation difference (translation differences on items whose gain orloss is recognised in other comprehensive income or profit or loss are alsorecognised in other comprehensive income or profit or loss, respectively).
Group companiesThe presentation currency of the Group is the US Dollar. Consolidatedstatement of financial position items are translated into US Dollars at theexchange rate applicable on the date of closure of the reporting period, andconsolidated statement of income items are translated using the averageexchange rate over the reporting period. Foreign exchange differencesarising on translation for consolidation are recognised in othercomprehensive income and included in consolidated shareholders’ equity.On disposal of a foreign operation, the component of other comprehensiveincome relating to that particular foreign operation is recognised in profit orloss.
c) Non-current assets held for saleNon-current assets and disposal groups classified as held for sale aremeasured at the lower of their carrying amount and fair value less costs tosell. Non-current assets and disposal groups are classified as held for sale iftheir carrying amounts will be recovered principally through a saletransaction rather than through continuing use. This condition is regarded asmet only when the sale is highly probable and the asset or disposal group isavailable for immediate sale in its present condition. Management must be
committed to the sale, which should be expected to qualify for recognition asa completed sale within one year from the date of classification.
When the Group is committed to a sale plan involving loss of controlof a subsidiary, all of the assets and liabilities of that subsidiary are classifiedas held for sale when the criteria described above are met, regardless ofwhether the Group will retain a non-controlling interest in its formersubsidiary after the sale.
d) Investment in associates and joint venturesAn associate is an entity over which the Group has significant influence andthat is neither a subsidiary nor an interest in a joint venture. Significantinfluence is the power to participate in the financial and operating policydecisions of the investee but is not control or joint control over those policies.
A joint venture is a type of joint arrangement whereby the parties thathave joint control of the arrangement have rights to the net assets of thejoint venture. Joint control is the contractually agreed sharing of control of anarrangement, which exists only when decisions about the relevant activitiesrequire unanimous consent of the parties sharing control. Interest in jointoperations are recorded according to IFRS 11 Joint Arrangements:
– Assets, including its share of any assets held jointly.– Liabilities, including its share of any liabilities incurred jointly.– Revenue from the sale of its share of the output arising from the joint
operation.– Share of the revenue from the sale of the output by the joint operation.– Expenses, including its share of any expenses incurred jointly.
The results of associates are incorporated in these consolidated financialstatements using the equity method of accounting, except when theinvestment is classified as held for sale, in which case it is accounted for inaccordance with IFRS 5 Non-current Assets Held for Sale and DiscontinuedOperations. Under the equity method, an investment in an associate isinitially recognised in the consolidated statement of financial position at costand adjusted thereafter to recognise the Group’s share of the profit or lossand other comprehensive income of the associate. When the Group’s shareof losses of an associate exceeds the Group’s interest in that associate(which includes any long-term interests that, in substance, form part of theGroup’s net investment in the associate), the Group discontinuesrecognising its share of further losses. Additional losses are recognised onlyto the extent that the Group has incurred legal or constructive obligations ormade payments on behalf of the associate.
The requirements of IAS 39 Financial Instruments: Recognition andMeasurement are applied to determine whether it is necessary to recogniseany impairment loss with respect to the Group’s investment in an associate.When necessary, the entire carrying amount of the investment (includinggoodwill) is tested for impairment in accordance with IAS 36 Impairment ofAssets as a single asset by comparing its recoverable amount (higher ofvalue in use and fair value less costs to sell) with its carrying amount. Anyimpairment loss recognised forms part of the carrying amount of theinvestment. Any reversal of that impairment loss is recognised inaccordance with IAS 36 Impairment of Assets to the extent that therecoverable amount of the investment subsequently increases.
Upon disposal of an associate that results in the Group losingsignificant influence over that associate, any retained investment ismeasured at fair value at that date and the fair value is regarded as its fairvalue on initial recognition as a financial asset in accordance with IAS 39Financial Instruments: Recognition and Measurement. The differencebetween the previous carrying amount of the associate attributable to theretained interest and its fair value is included in the determination of the gainor loss on disposal of the associate. In addition, the Group accounts for allamounts previously recognised in other comprehensive income in relation tothat associate on the same basis as would be required if that associate haddirectly disposed of the related assets or liabilities. Therefore, if a gain orloss previously recognised in other comprehensive income by that associatewould be reclassified to profit or loss on the disposal of the related assets or

liabilities, the Group reclassifies the gain or loss from equity to profit or loss(as a reclassification adjustment) when it loses significant influence over thatassociate.
When a Group entity transacts with its associate, profits and lossesresulting from the transactions with the associate are recognised in theGroup’s consolidated financial statements only to the extent of interests inthe associate that are not related to the Group.
e) GoodwillGoodwill is measured as being the excess of the aggregate of theconsideration transferred, the amount recognised for any non-controllinginterest and the acquisition-date fair values of any previously held interest inthe acquiree over the fair value of the identifiable assets acquired andliabilities assumed at the acquisition date.
At the acquisition date, any goodwill acquired is allocated to each ofthe cash-generating units (CGUs) or group of CGUs expected to benefitfrom the combination’s synergies.
Following initial recognition, goodwill is measured at cost less anyimpairment losses. Goodwill is reviewed for impairment annually or morefrequently if events or changes in circumstances indicate that the carryingvalue may be impaired. Impairment is determined by assessing therecoverable amount of the CGU or group of CGUs to which the goodwillrelates. Where the recoverable amount of the CGU or group of CGUs isless than the carrying amount, an impairment loss is recognised. Animpairment loss recognised for goodwill is not reversed in a subsequentperiod. For the impairment test, see note 16.
Goodwill may also arise upon investments in associates, being thesurplus of the cost of investments in associates. Goodwill is included in thecarrying amount of the investment in an associate and is neither amortisednor individually tested for impairment.
f) Intangible assetsIntangible assets acquired separately are measured on initial recognition atcost. The cost of intangible assets acquired in a business combination istheir fair value at the date of acquisition. Following initial recognition,intangible assets are carried at cost less accumulated amortisation andaccumulated impairment losses, if any. The useful lives of intangible assetsare assessed as either finite or indefinite.
Intangible assets with finite lives are amortised according to thestraight-line method for the periods corresponding to their expected usefullives. Intangible assets are mainly comprised of software licences (usefullives ranging from three to five years) and certain long-term concessionrights related to land usage (useful lives ranging from 33 to 99 years).
Intangible assets with indefinite useful lives are not amortised, but aretested for impairment annually, either individually or at the CGU level. Theassessment of indefinite life is reviewed annually to determine whether theindefinite life continues to be supportable. If not, the change in useful lifefrom indefinite to finite is made on a prospective basis.
Gains or losses arising from derecognition of an intangible asset aremeasured as the difference between the net disposal proceeds and thecarrying amount of the asset and are recognised in profit or loss when theasset is derecognised.
g) Property and equipmentProperty and equipment is stated at cost, less accumulated depreciationand accumulated impairment losses. The initial cost of an asset comprisesits purchase price or construction cost, any costs directly attributable tobringing the asset into operation, the initial estimate of any decommissioningobligation, if any, and, for qualifying assets, borrowing costs. The purchaseprice or construction cost is the aggregate amount paid and the fair value ofany other consideration given to acquire the asset. The capitalised value ofa finance lease is also included within property and equipment. Land andbuildings are accounted for under the cost model. Hence no revaluation iscarried out, in line with IAS 16 Property, Plant and Equipment.
Depreciation is provided on a straight-line basis over estimated usefullives of the respective assets, taking into account the residual value. Theestimated useful lives are:
Buildings 33 yearsMachinery and equipment 3 to 20 yearsOther fixed assets 1 to 5 years
The expected useful lives of property and equipment are reviewed on anannual basis and, if necessary, changes in useful lives are accounted forprospectively.
The carrying value of property and equipment is reviewed forimpairment whenever events or changes in circumstances indicate thecarrying value may not be recoverable.
When significant parts of property and equipment are required to bereplaced at intervals, the Group recognises such parts as individual assetswith specific useful lives and depreciates them accordingly. Likewise, whena major inspection is performed, its cost is recognised in the carryingamount of the property and equipment as a replacement if the recognitioncriteria are satisfied. All other repair and maintenance costs are recognisedin profit or loss as incurred.
An item of property and equipment is derecognised upon disposal orwhen no future economic benefits are expected to arise from the continueduse of the asset. Any gain or loss arising on derecognition of the asset(calculated as the difference between the net disposal proceeds and thecarrying amount of the item) is included in profit or loss in the period in whichthe item is derecognised.
h) Impairment of non-financial assetsThe Group assesses its non-financial assets at each reporting date forpossible impairment if there are events or changes in circumstances thatindicate that carrying values of the assets may not be recoverable and, as aresult, charges for impairment are recognised in the Group results from timeto time.
Such indicators include changes in the Group business plans,changes in commodity prices leading to sustained unprofitableperformance, an increase in the discount rate, low asset utilisation, evidenceof physical damage and, for petroleum-related properties, significantdownward or upward revisions of estimated volumes.
The assessment for impairment entails comparing the carrying valueof the asset or CGU with its recoverable amounts being the higher of fairvalue less costs to sell and value in use. A CGU is the smallest group ofassets whose continued use generates cash inflows that are largelyindependent of cash inflows generated by other groups of assets. Value inuse is usually determined on the basis of discounted estimated future netcash flows. When the carrying amount of an asset or a CGU exceeds therecoverable amount, the asset or CGU is considered impaired and is writtendown to its recoverable amount. Determination as to whether and howmuch an asset is impaired involves management estimates on highlyuncertain matters such as future commodity prices, the effects of inflation onoperating expenses, discount rates and the outlook for global or regionalmarket supply and demand conditions for petroleum products. The Groupbases its impairment calculation on detailed budgets and forecastcalculations, which are prepared separately for each of the Group’s CGUsto which the individual assets are allocated. These budgets and forecastcalculations generally cover a period of five years.
Goodwill and intangible assets with an indefinite useful life are subjectto an annual impairment test or, more frequently, if there are indications of aloss in value.
For assets, excluding goodwill and intangible assets with an indefinitelife, an assessment is made at each reporting date of whether there is animpairment and if such an indication exists, an impairment test is carried out.If such indication exists, the Group estimates the asset’s or CGU’srecoverable amount. A previously recognised impairment loss is reversed

FINANCIAL STATEMENTSNOTES TO THE CONSOLIDATED FINANCIAL STATEMENTS CONTINUED
only if there has been a change in the assumptions used to determine theasset’s recoverable amount since the last impairment loss was recognised.The reversal is limited so that the carrying amount of the asset does notexceed its recoverable amount, nor exceed the carrying amount that wouldhave been determined, net of depreciation, had no impairment loss beenrecognised for the asset in prior years. Impairment losses relating togoodwill cannot be reversed in future periods.
i) Financial assetsFinancial assets are classified, at initial recognition, as subsequentlymeasured at amortised cost, fair value through other comprehensiveincome (OCI), and fair value through profit or loss. The classification offinancial assets at initial recognition depends on the financial asset’scontractual cash flow characteristics and the Group’s business model formanaging them.
The subsequent measurement of financial assets depends on theirclassification as follows:
Financial assets at amortised cost (debt instruments)The Group measures financial assets (debt instruments) at amortised cost ifboth of the following conditions are met:
- The financial asset is held in order to collect contractual cash flows, and,- The contractual terms of the financial asset give rise on specified dates
to cash flows that are solely payments of principal and interest on theprincipal amount outstanding.
They are subsequently measured using the effective interest (EIR) methodand are subject to impairment. Gains and losses are recognised in profit orloss when the asset is derecognised, modified or impaired.
Financial assets at fair value through OCI (debt instruments)The Group measures debt instruments at fair value through OCI if both ofthe following conditions are met:
- The financial asset is held with the objective of both holding to collectcontractual cash flows and selling, and
- The contractual terms of the financial asset give rise on specified datesto cash flows that are solely payments of principal and interest on theprincipal amount outstanding
For debt instruments at fair value through OCI, interest income,foreign exchange revaluation and impairment losses or reversals arerecognised in the statement of profit or loss and computed in the samemanner as for financial assets measured at amortised cost. The remainingfair value changes are recognised in OCI. Upon derecognition, thecumulative fair value change recognised in OCI is recycled to profit or loss.
Financial assets designated at fair value through OCI (equity instruments)Upon initial recognition, the Group can elect to classify irrevocably its equityinvestments as equity instruments designated at fair value through OCIwhen they meet the definition of equity under IAS 32 and are not held fortrading. The classification is determined on an instrument-by-instrumentbasis.
Gains and losses on these financial assets are never recycled to profitor loss. Dividends are recognised as other income in the statement of profitor loss when the right of payment has been established, except when theGroup benefits from such proceeds as a recovery of part of the cost of thefinancial asset, in which case, such gains are recorded in OCI.
Financial assets at fair value through profit or lossFinancial assets at fair value through profit or loss include financial assetsheld for trading, financial assets designated upon initial recognition at fairvalue through profit or loss, or financial assets mandatorily required to bemeasured at fair value. Financial assets are classified as held for trading ifthey are acquired for the purpose of selling or repurchasing in the near term.Derivatives, including separated embedded derivatives, are also classifiedas held for trading. Financial assets with cash flows that are not solely
payments of principal and interest are classified and measured at fair valuethrough profit or loss, irrespective of the business model.
Financial assets at fair value through profit or loss are carried in thestatement of financial position at fair value with net changes in fair valuerecognised in the statement of profit or loss
DerecognitionA financial asset (or, where applicable, a part of a financial asset or part of agroup of similar financial assets) is primarily derecognised (i.e., removedfrom the Group’s consolidated statement of financial position) when:
- The rights to receive cash flows from the asset have expired, or- The Group has transferred its rights to receive cash flows from the asset
or has assumed an obligation to pay the received cash flows in fullwithout material delay to a third party under a ‘pass-through’arrangement; and either (a) the Group has transferred substantially allthe risks and rewards of the asset, or (b) the Group has transferredcontrol of the asset
When the Group has neither transferred nor retained substantially allof the risks and rewards of the asset, nor transferred control of the asset, theGroup continues to recognise the transferred asset to the extent of itscontinuing involvement. In that case, the Group also recognises anassociated liability. The transferred asset and the associated liability aremeasured on a basis that reflects the rights and obligations that the Grouphas retained.
Continuing involvement that takes the form of a guarantee over thetransferred asset is measured at the lower of the original carrying amount ofthe asset and the maximum amount of consideration that the Group couldbe required to repay.
Impairment of financial assetsThe Group recognises an allowance for expected credit losses (ECLs) for alldebt instruments not held at fair value through profit or loss. ECLs are basedon the difference between the contractual cash flows due in accordancewith the contract and all the cash flows that the Group expects to receive,discounted at an approximation of the original effective interest rate. Theexpected cash flows will include cash flows from the sale of collateral held orother credit enhancements that are integral to the contractual terms.
For trade receivables and contract assets, the Group applies asimplified approach in calculating ECLs. Therefore, the Group does nottrack changes in credit risk, but instead recognises a loss allowance basedon lifetime ECLs at each reporting date. The Group has established aprovision matrix that is based on its historical credit loss experience,adjusted for forward-looking factors specific to the debtors and the economicenvironment
j) Financial liabilitiesAll financial liabilities are recognised initially at fair value plus, in the case ofloans and borrowings, directly attributable transaction costs. Thesubsequent measurement of financial liabilities depends on theirclassification as follows:
Financial liabilities at fair value through profit or lossFinancial liabilities at fair value through profit or loss include financialliabilities held for trading and financial liabilities designated upon initialrecognition at fair value through profit or loss.Financial liabilities are classified as held for trading if they are incurred forthe purpose of repurchasing in the near term. This category also includesderivative financial instruments entered into by the Group that are notdesignated as hedging instruments in hedge relationships as defined byIFRS 9. Separated embedded derivatives are also classified as held fortrading unless they are designated as effective hedging instruments.
Gains or losses on liabilities held for trading are recognised in thestatement of profit or loss.

Financial liabilities designated upon initial recognition at fair valuethrough profit or loss are designated at the initial date of recognition, andonly if the criteria in IFRS 9 are satisfied.
Loans and borrowingsThis is the category most relevant to the Group. After initial recognition,interest-bearing loans and borrowings are subsequently measured atamortised cost using the EIR method. Gains and losses are recognised inprofit or loss when the liabilities are derecognised as well as through the EIRamortisation process.
Amortised cost is calculated by taking into account any discount orpremium on acquisition and fees or costs that are an integral part of the EIR.The EIR amortisation is included as finance costs in the statement of profitor loss. This category generally applies to interest-bearing loans andborrowings. For more information, refer to Note 23.
DerecognitionA financial liability is derecognised when the obligation under the
liability is discharged or cancelled or expires. When an existing financialliability is replaced by another from the same lender on substantially differentterms, or the terms of an existing liability are substantially modified, such anexchange or modification is treated as the derecognition of the originalliability and the recognition of a new liability. The difference in the respectivecarrying amounts is recognised in the statement of profit or loss.
k) Derivative financial instrumentsThe Group utilises derivative financial instruments (shown separately in theconsolidated statement of financial position under other financial assets andother financial liabilities) to economically hedge its primary market riskexposures, primarily risks related to commodity price movements, and to alesser extent, related to exposure to foreign currency exchange and interestrate movements. For some of these derivative transactions, the Group willenter into positions through Trafigura Pte Ltd and Trafigura Derivatives Ltd.The Group has an agreement in place with Trafigura Pte Ltd and TrafiguraDerivatives Ltd whereby those derivative transactions entered into on behalfof the Group by Trafigura Pte Ltd and Trafigura Derivatives Ltd arecontractually binding to the Group and therefore any gains or losses arisingfrom such transactions are strictly for the account of the Group.
Derivatives, including separated embedded derivatives, are classifiedas held for trading at fair values and related gains and losses are recordedin profit or loss unless they are designated as effective hedging instrumentsas defined by IFRS 9 The Group does not generally apply hedgeaccounting as defined by IFRS9.
Offsetting of financial instrumentsFinancial assets and financial liabilities are offset and the net amountreported in the consolidated statement of financial position if, and only if,there is a currently enforceable legal right to offset the recognised amountsand there is an intention to settle on a net basis, or to realise the assets andsettle the liabilities simultaneously.
Fair value of financial instrumentsThe fair value of financial instruments that are traded in active markets ateach reporting date is determined by reference to quoted market prices ordealer price quotations (bid price for long positions and ask price for shortpositions), without any deduction for transaction costs.
For financial instruments not traded in an active market, the fair valueis determined using appropriate valuation techniques. Such techniques mayinclude: using recent arm’s length market transactions; reference to thecurrent fair value of another instrument that is substantially the same; adiscounted cash flow analysis; or other valuation models.
Current versus non-current classificationDerivative instruments that are not designated as effective hedginginstruments are classified as current or non-current or separated into currentand non-current portions based on an assessment of the facts andcircumstances (e.g. the underlying contracted cash flows).
– Where the Group will hold a derivative as an economic hedge (and doesnot apply hedge accounting) for a period beyond 12 months after thereporting date, the derivative is classified as non-current (or separatedinto current and non-current portions) consistent with the classification ofthe underlying item.
– Embedded derivatives that are not closely related to the host contract areclassified consistent with the cash flows of thehost contract.
l) InventoryInventories, other than inventories held for trading purposes, are stated atthe lower of cost and net realisable value. Cost is determined by the weightedaverage method and comprises direct purchase costs, cost of production,transportation and manufacturing expenses. Borrowing costs are notincluded in the cost of inventory.
Net realisable value of petroleum products is based on the estimatedselling price in the ordinary course of business less the estimated costs ofcompletion and the estimated costs necessary to make the sale. Costincludes all costs incurred in the normal course of business in bringing eachproduct to its present location and condition.
Any write-off is recognised when the probable realisable value islower than the net book value.
With respect to inventories held for trading purposes, the Groupaccounts for them at fair value less costs to sell and any changes in valueare recognised in profit or loss. Trading activities include optimisation of theGroup’s supply cycle and the supply of petroleum products to business-to-business and wholesale clients. Further details are provided in Note 17.
m) LeasesThe group has applied IFRS16 using the modified retrospective approachand therefore the comparative information has not been restated andcontinues to be reported under IAS17 and IFRIC 4.
Under IAS17, in the comparative period, as a lessee the Group classifiedleases that transfer substantially all of the risks and rewards of ownership asfinance leases. They were capitalised at the commencement of the lease atthe fair value of the leased property or, if lower, at the present value of theminimum lease payments. Lease payments were apportioned betweenfinance charges and reduction of the lease liability so as to achieve aconstant rate of interest on the remaining balance of the liability. Financecharges were recognised in profit or loss.
Leased assets were depreciated over the useful life of the asset. However, ifthere is no reasonable certainty that the Group will obtain ownership by theend of the lease term, the asset is depreciated over the shorter of theestimated useful life of the asset and the lease term.
Operating lease payments were recognised as an operating expense inprofit or loss on a straight-line basis over the lease term.
Policy applicable from 1 January 2019
The Group adopted IFRS16 using the modified retrospective method ofadoption with the date of initial application of 1 January 2019. Under thismethod, the standard is applied retrospectively with the cumulative effect ofinitially applying the standard recognised at the date of initial application.
At inception of a contract, the Group assesses whether a contract is, orcontains, a lease. A contract is, or contains, a lease if the contract conveysthe right to control the use of an identified asset for a period of time inexchange for consideration. For this assessment, the Group verifies that:- The contract involves the use of an identified asset- The Group has the right to obtain substantially all of the economic benefitsfrom the use of the asset throughout the period of use.

FINANCIAL STATEMENTSNOTES TO THE CONSOLIDATED FINANCIAL STATEMENTS CONTINUED
- The Group has the right to direct the use of the asset.
At inception or on reassessment of a contract that contains a leasecomponent, the Group allocates the consideration in the contract to eachlease component on the basis of their relative stand-alone prices separating,whenever it has been possible, any non-lease components.
The Group as lessee
The Group recognises a right-of-use asset and a lease liability at the leasecommencement date. Both are presented as separated items in thestatement of financial position under the note 15 and the note 24.
The right-of-use assets is measured at cost, which comprises the initialamount of the lease liability adjusted for any lease payments made at orbefore the commencement date, plus any initial direct costs incurred and anestimated of costs for dismantling less any lease incentive received.
The right-of-use asset is subsequently depreciated using the straight-linemethod from the commencement date to the end of the lease term. Inaddition, the right-of-use asset is periodically reduced by impairment losses,if any, and adjusted for certain remeasurements of the lease liability (ex:escalations). At implementation of the norm, we included any leaseprepayment pending to amortise as of 31st December 2018 in the right-of-use.
The lease liability is initially measured at the present value of the leasepayments that are not paid at the commencement date, discounted usingthe interest rate implicit in the lease or, if that rate cannot be readilydetermined, the Group’s incremental borrowing rate. Generally, the Groupuses its incremental borrowing rate as the discount rate.
Lease payments included in the measurement of the lease liability comprisethe following:– Fixed payments, including in-substance fixed payments;– Variable lease payments that depend on an index or a rate, initiallymeasured using the index or rate as at the commencement date;– Amounts expected to be payable under a residual value guarantee; and– The exercise price under a purchase option that the Group is reasonablycertain to exercise, lease payments in an optional renewal period if theGroup is reasonably certain to exercise an extension option, and penaltiesfor early termination of a lease unless the Group is reasonably certain not toterminate early.
The lease liability is measured at amortised cost using the effective interestmethod. It is remeasured when there is a change in future lease paymentsarising from a change in an index or rate, if there is a change in the Group’sestimate of the amount expected to be payable under a residual valueguarantee, or if the Group changes its assessment of whether it will exercisea purchase, extension or termination option.
When the lease liability is remeasured in this way, a correspondingadjustment is made to the carrying amount of the right-of-use asset, or isrecorded in profit or loss if the carrying amount of the right-of-use asset hasbeen reduced to zero.
Short-term leases and leases of low-value assets
The Group has elected not to recognise right-of-use assets and leaseliabilities for short-term leases of machinery, vehicles, vessels and IT andoffice equipment that have a lease term of 12 months or less and any kindof leases nature when low-value assets are concerned. The Grouprecognises the lease payments associated with these leases as an expenseon a straight-line basis over the lease term.
The Group as lessorWhen the Group acts as a lessor, it determines at lease inception whethereach lease is a finance lease or an operating lease.
To classify each lease, the Group makes an overall assessment of whetherthe lease transfers substantially all of the risks and rewards incidental toownership of the underlying asset. If this is the case, then the lease is afinance lease; if not, then it is an operating lease. As part of thisassessment, the Group considers certain indicators such as whether thelease is for the major part of the economic life of the asset.
Amounts due from lessees under finance leases are recognised asreceivables at the amount of the Group net investment in the leases.Finance lease income is allocated to accounting periods so as to reflect aconstant periodic rate of return on the Group net investment outstanding inrespect of the leases.
When the Group is an intermediate lessor, it accounts for its interests in thehead lease and the sub-lease separately. It assesses the leaseclassification of a sub-lease with reference to the right-of-use asset arisingfrom the head lease, not with reference to the underlying asset. If a headlease is a short-term lease to which the Group applies the exemptiondescribed above, then it classifies the sub-lease as an operating lease.
If an arrangement contains lease and non-lease components, the Groupapplies IFRS 15 to allocate the consideration in the contract.
Rental income from operating leases is recognised on a straight-line basisover the term of the relevant lease. Initial direct costs incurred in negotiatingand arranging an operating lease are subtracted from lease on a straight-line basis over the lease term.
The accounting policies applicable to the Group as a lessor in thecomparative period were not different from IFRS 16. However, when theGroup was an intermediate lessor the sub-leases were classified withreference to the underlying asset.
n) Cash and short-term depositsCash and short-term deposits in the consolidated statement of financialposition comprise cash at banks and on hand and short-term deposits witha maturity of three months or less. For the purpose of the consolidatedstatement of cash flows, cash and cash equivalents consist of cash andshort-term deposits as defined above.
o) ProvisionsProvisions are recognised when the Group has a present obligation as aresult of a past event, it is probable that the Group will be required to settlethe obligation, and a reliable estimate can be made of the amount of theobligation. The amount recognised as a provision is the best estimate of theconsideration required to settle the present obligation at the end of thereporting period, taking into account the risks and uncertainties surroundingthe obligation. When a provision is measured using the cash flowsestimated to settle the present obligation, its carrying amount is the presentvalue of those cash flows (when the effect of the time value of money ismaterial).
When some or all of the economic benefits required to settle aprovision are expected to be recovered from a third party, a receivable isrecognised as an asset if it is virtually certain that reimbursement will bereceived and the amount of the receivable can be measured reliably.p) Revenue recognitionRevenue is measured at the fair value of the consideration received orreceivable, taking into account contractually defined terms of payment andexcluding taxes or duty. Revenue is reduced for estimated customer
returns, discounts and other similar allowances. The Group assesses itsrevenue arrangements against specific criteria in order to determine if it isacting as principal or agent. The Group has concluded that it is acting as aprincipal in all of its revenue arrangements. Revenue is recognised to theextent that it is probable that the economic benefits will flow to the Groupand the revenue can be reliably measured, regardless of when the paymentis being made. The following specific recognition criteria must also be metbefore revenue is recognised:
Sale of goodsRevenue from the sale of goods is recognised when the significant risks andrewards of ownership of the goods have passed to the buyer, usually ondelivery of the goods.
Rendering of servicesRevenue from a contract to provide services is recognised by reference tothe stage of completion of the contract. The stage of completion of thecontract is determined as follows:
– Servicing fees included in the price of products sold are recognised byreference to the proportion of the total cost of providing the servicing forthe product sold.
– Revenue from time and material contracts is recognised at thecontractual rates as labour hours and direct expenses are incurred.
Dividend and interest incomeDividend income from investments is recognised when the shareholder’sright to receive payment has been established (provided that it is probablethat the economic benefits will flow to the Group and the amount of incomecan be measured reliably).
Interest income from a financial asset is recognised when it isprobable that the economic benefits will flow to the Group and the amount ofincome can be measured reliably. Interest income is accrued by referenceto the principal outstanding and at the effective interest rate applicable,which is the rate that exactly discounts estimated future cash receiptsthrough the expected life of the financial asset to that asset’s net carryingamount on initial recognition.
q) TaxesCurrent income taxCurrent income tax assets and liabilities are measured at the amountsexpected to be recovered from or paid to the taxation authorities. The taxrates and tax laws used to compute the amounts are those that are enactedor substantively enacted, at the reporting date in the countries where theGroup operates and generates taxable income. Current income tax relatingto items recognised in other comprehensive income is also recognised inother comprehensive income and not in profit or loss.
Deferred taxDeferred tax assets and liabilities are recorded on temporary differencesbetween the tax bases of assets and liabilities and their carrying amounts forfinancial reporting purposes at the reporting date and for operating loss andtax credit carry forwards. Deferred tax liabilities are generally recognised forall taxable temporary differences.
Deferred tax assets are generally recognised for all deductibletemporary differences to the extent that it is probable that taxable profits willbe available against which those deductible temporary differences, and thecarry forward of unused tax credits and unused tax losses can be utilised.Such deferred tax assets and liabilities are not recognised if the temporarydifference arises from goodwill or from the initial recognition (other than in abusiness combination) of other assets and liabilities in a transaction thataffects neither the taxable profit nor the accounting profit.
Deferred tax liabilities are recognised for taxable temporarydifferences associated with investments in subsidiaries and associates, andinterests in joint ventures, except where the Group is able to control thereversal of the temporary difference and it is probable that the temporary
difference will not reverse in the foreseeable future. Deferred tax assetsarising from deductible temporary differences associated with suchinvestments and interests are only recognised to the extent that it isprobable that there will be sufficient taxable profits against which to utilisethe benefits of the temporary differences and they are expected to reversein the foreseeable future.
The carrying amount of deferred tax assets is reviewed at eachreporting date and reduced to the extent that it is no longer probable thatsufficient taxable profit will be available to allow all or part of the deferred taxasset to be utilised. Unrecognised deferred tax assets are reassessed ateach reporting date and are recognised to the extent that it has becomeprobable that future taxable profits will allow the deferred tax asset to berecovered.
Deferred tax assets and liabilities are measured at the tax rates thatare expected to apply in the year when the asset is realised or the liability issettled, based on tax rates (and tax laws) that have been enacted orsubstantively enacted at the reporting date. The effect on deferred taxassets and liabilities of changes in tax rates is recognised in profit or loss inthe period of the enactment of the change in tax rates.
Tax exposureIn determining the amount of current and deferred tax, the Company takesinto account the impact of uncertain tax positions and whether additionaltaxes and interest may be due. The Company believes that its accruals fortax liabilities are adequate for all open tax years based on its assessment ofmany factors, including interpretations of tax law and prior experience. Thisassessment relies on estimates and assumptions and may involve a seriesof judgements about future events. New information may become availablethat causes the Company to change its judgement regarding the adequacyof existing tax liabilities and such changes to tax liabilities will impact taxexpense in the period that such a determination is made.
r) Share-based paymentsEmployees of the Group receive remuneration in the form of share-basedpayments, whereby employees render services as consideration for equityinstruments (equity-settled transactions). This is considered an equity-settled share scheme as the Company neither has a present legal norconstructive obligation to settle in cash, nor has a past practice or statedpolicy of settling in cash until today.
The cost of equity-settled transactions is determined by the fair valueat the date when the grant is made using an appropriate valuation model.That cost is recognised in employee benefits expense, together with acorresponding increase in equity (retained earnings), over the period inwhich the service and, where applicable, the performance conditions arefulfilled (the vesting period).
The cumulative expense recognised for equity-settled transactions ateach reporting date until the vesting date reflects the extent to which thevesting period has expired and the Group’s best estimate of the number ofequity instruments that will ultimately vest. The expense or credit in thestatement of profit or loss for a period represents the movement incumulative expense recognised at the beginning and end of that period.
3. Significant accounting judgements, estimates and assumptionsThe preparation of the Group consolidated financial statements in conformitywith IFRS requires management to make judgements, estimates andassumptions that affect the reported amounts of revenues, expenses, assetsand liabilities, as well as the contingent liabilities at the date of theconsolidated financial statements. Estimates and assumptions arecontinuously evaluated and are based on management’s experience andother factors, including expectations of future events. Changes in theseassumptions may materially affect the consolidated financial position orperformance reported in future periods.Impairment of assetsIn accordance with IAS 36 Impairment of Assets, the Group performs anassessment at each reporting date to determine whether there are any

FINANCIAL STATEMENTSNOTES TO THE CONSOLIDATED FINANCIAL STATEMENTS CONTINUED
indications of impairment at each reporting date. If indications of impairmentexist, an impairment test is performed to assess the recoverable amount ofthe assets.
Goodwill impairmentDetermining whether goodwill is impaired requires an estimation of thevalue in use of the CGUs to which goodwill has been allocated. The value inuse calculation requires management to estimate the future cash flowsexpected to arise from the CGU, and a suitable discount rate, in order tocalculate present value. Details of the Group goodwill impairmentassessment at 31 December 2019 and 2018 are described in Note 16.
Useful lives of intangible assets and property and equipmentIntangible assets and property and equipment are depreciated on a straight-line basis over the estimated useful lives of the assets. The useful lives areestimated by management at the time the assets are acquired and arereassessed annually, with the estimated useful lives being based onhistorical experience with similar assets, market conditions and futureanticipated events.Provision for expected credit lossesFor trade receivables and contract assets, the Group applies a simplifiedapproach in calculating ECLs. Therefore, the Group does not track changesin credit risk, but instead recognises a loss allowance based on lifetimeECLs at each reporting. The Group has established a provision matrix thatis based on its historical credit loss experience date (taking into account theageing of trade receivables, and geographical risk as a proxy forcounterparty risk), adjusted for forward-looking factors specific to the debtorsand the economic environment.
The provision matrix is initially based on the Group’s historicalobserved default rates. The Group will calibrate the matrix to adjust thehistorical credit loss experience with forward-looking information. At everyreporting date, the historical observed default rates are updated andchanges in the forward-looking estimates are analysed.
The assessment of the correlation between historical observeddefault rates, forecast economic conditions and ECLs is a significantestimate. The amount of ECLs is sensitive to changes in circumstances andof forecast economic conditions. The Group’s historical credit lossexperience and forecast of economic conditions may also not berepresentative of customer’s actual default in the future.
Environmental costsCosts associated with environmental remediation obligations are providedfor when the Group has a present obligation and the provision can bereasonably estimated. Such provisions are adjusted as further informationdevelops or circumstances change.
Recovery of deferred tax assetsJudgement is required in determining whether deferred tax assets should berecognised in the consolidated statement of financial position. Deferred taxassets, including those arising from unutilised tax losses, requiremanagement to assess the likelihood that the Group will generate sufficienttaxable earnings in future periods, in order to utilise recognised deferredincome tax assets. Assumptions about the generation of future taxableprofits depend on management’s estimates of future cash flows. Theseestimates of future taxable income are based on forecast cash flows fromoperations (which are impacted by production and sales volumes, oil andnatural gas prices, reserves, operating costs, decommissioning costs,capital expenditure, dividends and other capital management transactions)and judgement about the application of existing tax laws in each jurisdiction.
To the extent that future cash flows impacting the taxable incomediffer significantly from estimates, the ability of the Group to realise the netdeferred tax assets recorded at the reporting date could be impacted. Inaddition, future changes in tax laws in the jurisdictions in which the Groupoperates could limit the ability of the Group to obtain tax deductions in futureperiods.
ContingenciesBy their nature, contingencies will only be resolved when one or moreuncertain future events occur or fail to occur. The assessment of theexistence, and potential quantum, of contingencies inherently involves theexercise of significant judgement and the use of estimates regarding theoutcome of future events.
Determination of fair values in business combinationsThe Group has applied estimates and judgements to determine the fairvalue of assets acquired and liabilities and contingent liabilities assumed byway of a business combination. The value of assets, liabilities and contingentliabilities recognised at the acquisition date are recognised at fair value. Indetermining fair value the Group has utilised valuation methodologiesincluding discounted cash flow analysis market value assessments orreplacement value by third parties for, in particular, acquired property andequipment. The market value of property and equipment is the estimatedamount for which a property could be exchanged on the date of valuationbetween a willing buyer and a willing seller in an arm’s length. Theassumptions made in performing these valuations include assumptions asto discount rates, foreign exchange rates, commodity prices, the timing ofdevelopment, capital costs, and future operating costs. Any significantchange in key assumptions may cause the acquisition accounting to berevised including the recognition of additional goodwill or a discount onacquisition.
4. Significant events
Refinancing of and existing revolving credit facilityIn April 2019 the company successfully closed a 1-year USD 350 millionRevolving Credit Facility, with two 1 – year extension options, to refinancethe Company’s existing 1-year USD 520 million revolving credit facility datedApril 2018.
Disposal of IndonesiaIn July 2019 the company disposed of its operations in Indonesia.
Disposal of ParaguayIn September 2019 the company announced the sale of its businessoperations in Paraguay to Impala Terminals Group, a joint venture betweenTrafigura and IFM Global Infrastructure Fund. The transaction has beencompleted in January 2020.
Announced the disposal of AustraliaIn December 2019 the company announced the sale of its Australiancommercial and retail fuels business to Chevron Australia Downstream PtyLtd. The transaction is expected to complete by mid-2020. As aconsequence this operation has been classified as asset held for sale andpresented accordingly in the consolidated financial statements.
5. Changes in accounting standards
New and amended standards and interpretationsIn 2019, the Group adopted the following new or amended standards andinterpretations for the first time:
– IFRS 16 - Leases (effective for annual periods beginning on or after 1January 2019).
– IFRIC 23 - Uncertainty over Income Tax Treatments (effective for annualperiods beginning on or after 1 January 2019).
– Amendments to IFRS 9 - Prepayment Features with NegativeCompensation (effective for annual periods beginning on or after 1January 2019).
– Amendments to IAS 28 - Long-term Interests in Associates and JointVentures (effective for annual periods beginning on or after 1 January2019).
– AIP (2015-2017 Cycle): IFRS 3 - Business Combinations - Previouslyheld Interests in a joint operation (effective for annual periods beginningon or after 1 January 2019).
– AIP (2015-2017 Cycle): IFRS 11 - Joint Arrangements - Previously heldInterests in a joint operation (effective for annual periods beginning on orafter 1 January 2019).
– AIP (2015-2017 Cycle): IAS 12 - Income Taxes - Income taxconsequences of payments on financial instruments classified as equity(effective for annual periods beginning on or after 1 January 2019).
– AIP (2015-2017 Cycle): IAS 23 - Borrowing Costs - Borrowing costseligible for capitalization (effective for annual periods beginning on or after1 January 2019).
– Amendments to IAS 19 - Plan Amendment, Curtailment or Settlement(effective for annual periods beginning on or after 1 January 2019).
– Amendments to IAS 1 - Classification of liabilities as current or non-current (effective for annual periods on or after 1 January 2022).
Standards issued but not yet effectiveThe standards and interpretations that have been issued or amended butnot yet effective, up to the date of issuance of the Group’s consolidatedfinancial statements are disclosed below. The Group intends to adopt thefollowing standards, interpretations and amendments when they becomeeffective, to the extent they are relevant to the Group.– IFRS 17 - Insurance Contracts (effective for annual periods on or after
1 January 2021)– Amendments to References to the Conceptual Framework in IFRS
Standards (effective for annual periods on or after1 January 2020)
– Amendments to IAS 1 and IAS 8 - Definition of Material (effective forannual periods on or after 1 January 2020)
– Amendments to IFRS 3 - Definition of a Business (effective for annualperiods on or after 1 January 2020)
The adoption of these issued or amended standards and interpretations isnot expected to have a material impact on the consolidated financial positionor performance of the Group.
FINANCIAL STATEMENTSNOTES TO THE CONSOLIDATED FINANCIAL STATEMENTS CONTINUED
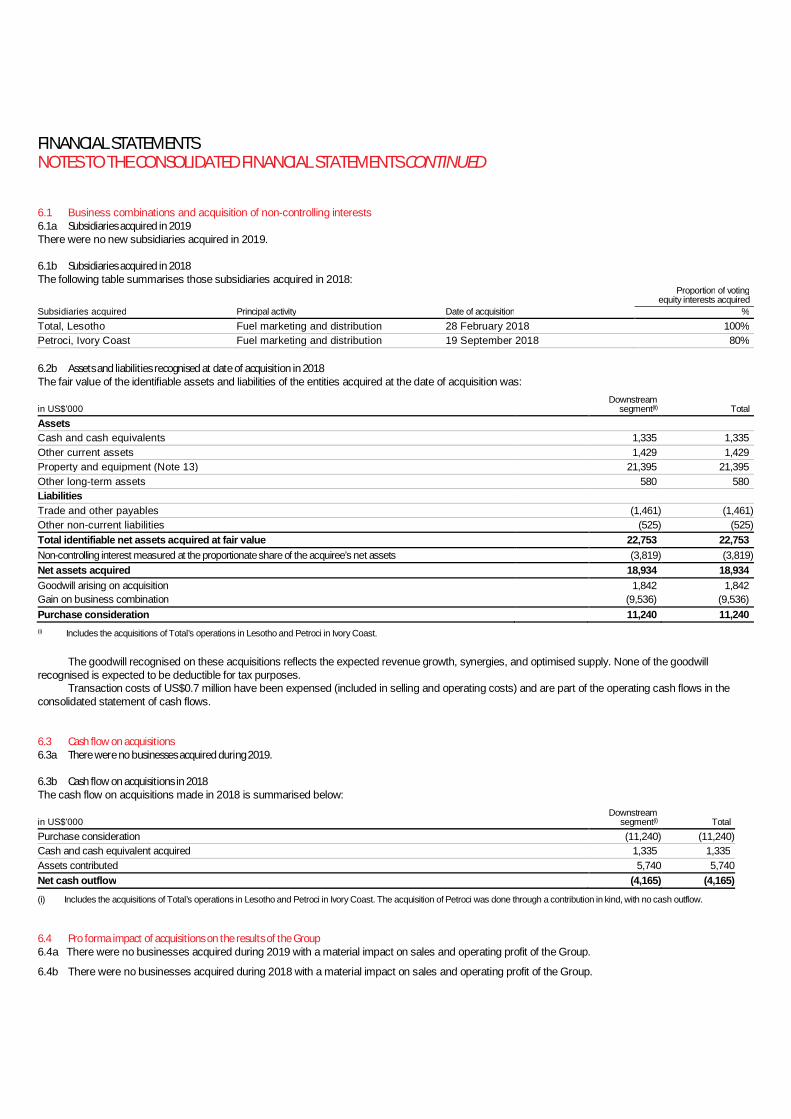
6.1 Business combinations and acquisition of non-controlling interests6.1a Subsidiaries acquired in 2019There were no new subsidiaries acquired in 2019.
6.1b Subsidiaries acquired in 2018The following table summarises those subsidiaries acquired in 2018:
Proportion of votingequity interests acquired
Subsidiaries acquired Principal activity Date of acquisition %Total, Lesotho Fuel marketing and distribution 28 February 2018 100%Petroci, Ivory Coast Fuel marketing and distribution 19 September 2018 80%
6.2b Assets and liabilities recognised at date of acquisition in 2018The fair value of the identifiable assets and liabilities of the entities acquired at the date of acquisition was:
in US$’000Downstream
segment(ii) TotalAssetsCash and cash equivalents 1,335 1,335Other current assets 1,429 1,429Property and equipment (Note 13) 21,395 21,395Other long-term assets 580 580LiabilitiesTrade and other payables (1,461) (1,461)Other non-current liabilities (525) (525)Total identifiable net assets acquired at fair value 22,753 22,753Non-controlling interest measured at the proportionate share of the acquiree’s net assets (3,819) (3,819)Net assets acquired 18,934 18,934Goodwill arising on acquisition 1,842 1,842Gain on business combination (9,536) (9,536)Purchase consideration 11,240 11,240(i) Includes the acquisitions of Total’s operations in Lesotho and Petroci in Ivory Coast.
The goodwill recognised on these acquisitions reflects the expected revenue growth, synergies, and optimised supply. None of the goodwillrecognised is expected to be deductible for tax purposes.
Transaction costs of US$0.7 million have been expensed (included in selling and operating costs) and are part of the operating cash flows in theconsolidated statement of cash flows.
6.3 Cash flow on acquisitions6.3a There were no businesses acquired during 2019.
6.3b Cash flow on acquisitions in 2018The cash flow on acquisitions made in 2018 is summarised below:
in US$’000Downstream
segment(i) TotalPurchase consideration (11,240) (11,240)Cash and cash equivalent acquired 1,335 1,335Assets contributed 5,740 5,740Net cash outflow (4,165) (4,165)(i) Includes the acquisitions of Total’s operations in Lesotho and Petroci in Ivory Coast. The acquisition of Petroci was done through a contribution in kind, with no cash outflow.
6.4 Pro forma impact of acquisitions on the results of the Group6.4a There were no businesses acquired during 2019 with a material impact on sales and operating profit of the Group.
6.4b There were no businesses acquired during 2018 with a material impact on sales and operating profit of the Group.

6.5 Non-controlling interests acquired6.5a Non-controlling interests acquired in 2019There were no non-controlling interest acquired during 2019.
6.5b Non-controlling interests acquired in 2018
in US$’000Midstreamsegment(i)
Downstreamsegment(ii) Total
Increase / (decrease) in non-controlling interests (1,454) 17,827 16,373Change in retained earnings from non-controlling interest purchased – (17,581) (17,581)Loan granted / assets contributed 1,454 (9,284) (7,830)Foreign currency effects – 717 717Purchase consideration – (8,321) (8,321)(i) Includes a reduction in share capital for AS Alexela Logistics.(ii) Includes the repurchase of a 25% stake in Puma Energy South Africa (Pty) Ltd, the sale of a 20% stake in Puma Energy Distribution Côte d’Ivoire SARL and the contribution of 25%
of our Puma Energy Ivory Coast SA operations in exchange of an 80% stake in the Petroci retail network.
6.6 Sale of assets and investments
During 2019 the Group disposed activities in Indonesia on 1st July 2019 and Paraguay on 30th September 2019 as reflected by the figures in thebelow table. In December 2019 the company announced the sale of its Australian commercial and retail fuels business to Chevron AustraliaDownstream Pty Ltd. The transaction is expected to complete by mid-2020. The operation has been classified as asset held for sale but the transactiondoes not have any impact on the disclosure for the sale of assets and investments in 2019.
in US$’000Notes Downstream
segment
AssetsCash and cash equivalents (2,545)Inventories (23,078)Receivables (17,954)Property and equipment 13 (51,542)Goodwill and intangible assets 14 & 15 (14,911)Other long term assets (434)
LiabilitiesTrade and other payables 27,528Other current liabilities 3,443Non-current liabilities 2,003
Total net assets disposed of (77,490)
Accumulated translation gains/(losses) (35,321)Sales proceeds 182,922Gain on disposal 70,111
in US$'000 Downstream segmentSales proceeds 183,121Cash and cash equivalents exit (2,545)Receivables (44,077)Net cash inflow 136,499
FINANCIAL STATEMENTSNOTES TO THE CONSOLIDATED FINANCIAL STATEMENTS CONTINUED
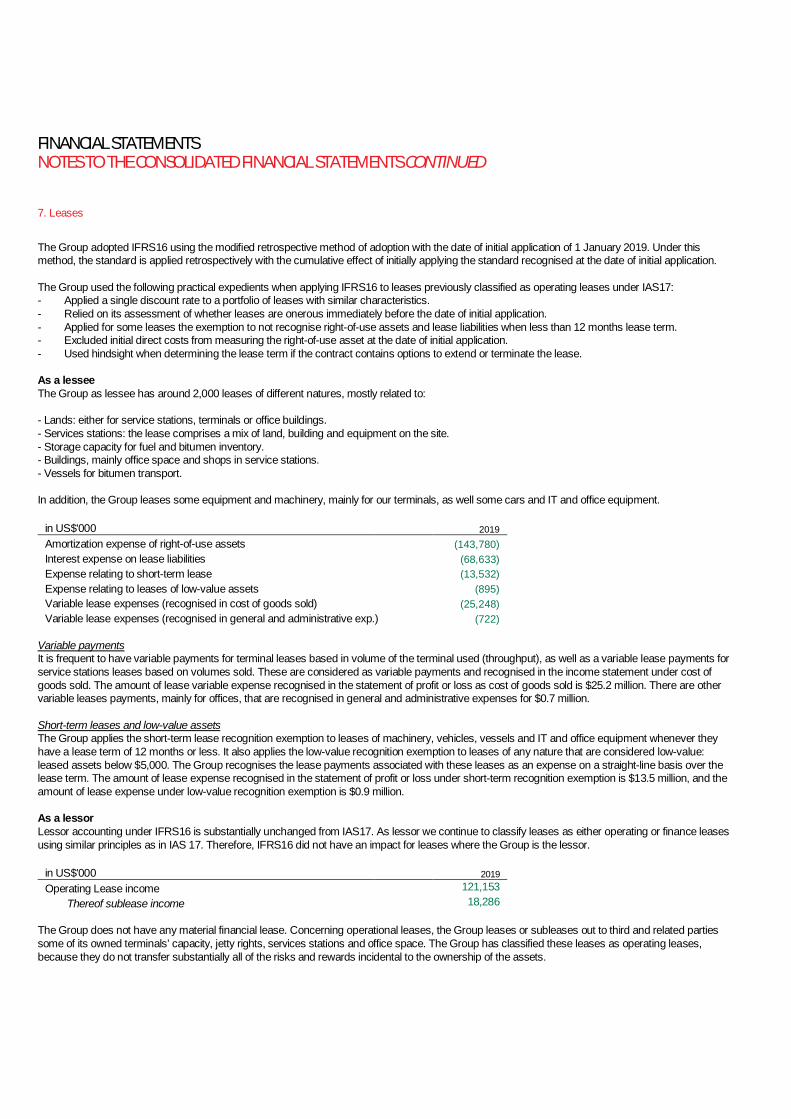
7. Leases
The Group adopted IFRS16 using the modified retrospective method of adoption with the date of initial application of 1 January 2019. Under thismethod, the standard is applied retrospectively with the cumulative effect of initially applying the standard recognised at the date of initial application.
The Group used the following practical expedients when applying IFRS16 to leases previously classified as operating leases under IAS17:- Applied a single discount rate to a portfolio of leases with similar characteristics.- Relied on its assessment of whether leases are onerous immediately before the date of initial application.- Applied for some leases the exemption to not recognise right-of-use assets and lease liabilities when less than 12 months lease term.- Excluded initial direct costs from measuring the right-of-use asset at the date of initial application.- Used hindsight when determining the lease term if the contract contains options to extend or terminate the lease.
As a lesseeThe Group as lessee has around 2,000 leases of different natures, mostly related to:
- Lands: either for service stations, terminals or office buildings.- Services stations: the lease comprises a mix of land, building and equipment on the site.- Storage capacity for fuel and bitumen inventory.- Buildings, mainly office space and shops in service stations.- Vessels for bitumen transport.
In addition, the Group leases some equipment and machinery, mainly for our terminals, as well some cars and IT and office equipment.
in US$'000 2019Amortization expense of right-of-use assets (143,780)Interest expense on lease liabilities (68,633)Expense relating to short-term lease (13,532)Expense relating to leases of low-value assets (895)Variable lease expenses (recognised in cost of goods sold) (25,248)Variable lease expenses (recognised in general and administrative exp.) (722)
Variable paymentsIt is frequent to have variable payments for terminal leases based in volume of the terminal used (throughput), as well as a variable lease payments forservice stations leases based on volumes sold. These are considered as variable payments and recognised in the income statement under cost ofgoods sold. The amount of lease variable expense recognised in the statement of profit or loss as cost of goods sold is $25.2 million. There are othervariable leases payments, mainly for offices, that are recognised in general and administrative expenses for $0.7 million.
Short-term leases and low-value assetsThe Group applies the short-term lease recognition exemption to leases of machinery, vehicles, vessels and IT and office equipment whenever theyhave a lease term of 12 months or less. It also applies the low-value recognition exemption to leases of any nature that are considered low-value:leased assets below $5,000. The Group recognises the lease payments associated with these leases as an expense on a straight-line basis over thelease term. The amount of lease expense recognised in the statement of profit or loss under short-term recognition exemption is $13.5 million, and theamount of lease expense under low-value recognition exemption is $0.9 million.
As a lessorLessor accounting under IFRS16 is substantially unchanged from IAS17. As lessor we continue to classify leases as either operating or finance leasesusing similar principles as in IAS 17. Therefore, IFRS16 did not have an impact for leases where the Group is the lessor.
in US$'000 2019Operating Lease income 121,153
Thereof sublease income 18,286
The Group does not have any material financial lease. Concerning operational leases, the Group leases or subleases out to third and related partiessome of its owned terminals’ capacity, jetty rights, services stations and office space. The Group has classified these leases as operating leases,because they do not transfer substantially all of the risks and rewards incidental to the ownership of the assets.
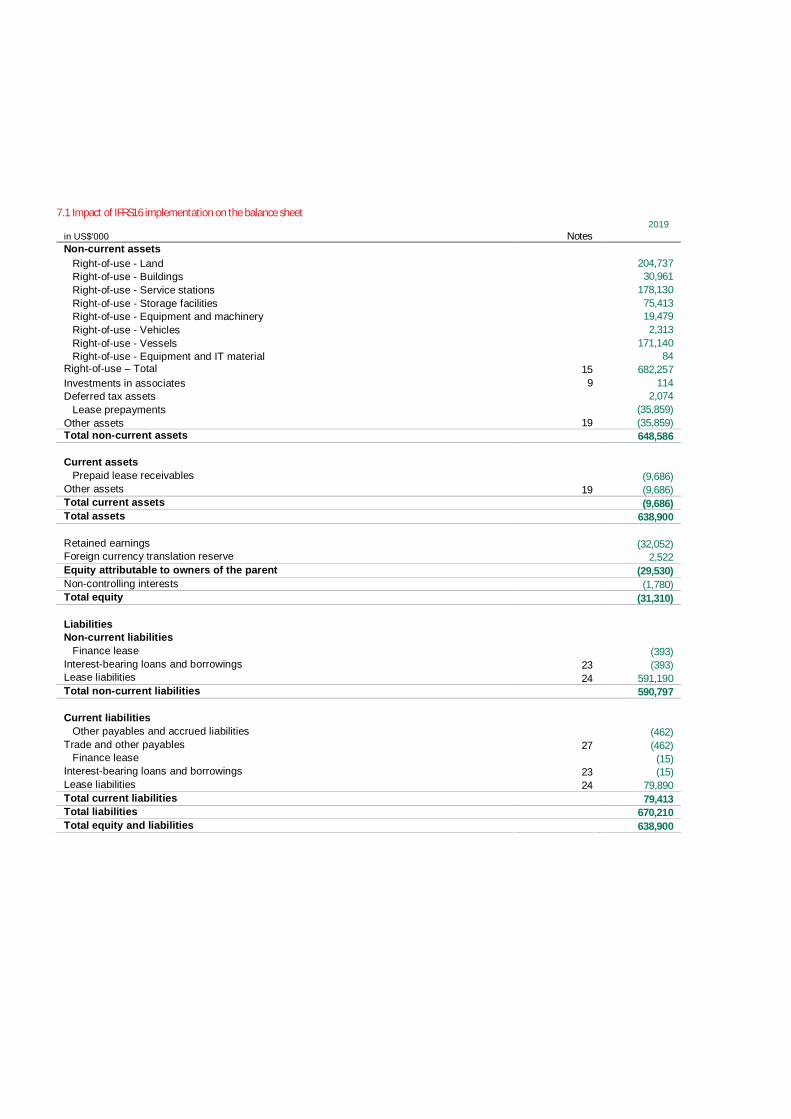
7.1 Impact of IFRS16 implementation on the balance sheet2019
in US$'000 NotesNon-current assets Right-of-use - Land 204,737 Right-of-use - Buildings 30,961 Right-of-use - Service stations 178,130 Right-of-use - Storage facilities 75,413 Right-of-use - Equipment and machinery 19,479 Right-of-use - Vehicles 2,313 Right-of-use - Vessels 171,140 Right-of-use - Equipment and IT material 84Right-of-use – Total 15 682,257Investments in associates 9 114Deferred tax assets 2,074 Lease prepayments (35,859)Other assets 19 (35,859)Total non-current assets 648,586
Current assetsPrepaid lease receivables (9,686)
Other assets 19 (9,686)Total current assets (9,686)Total assets 638,900
Retained earnings (32,052)Foreign currency translation reserve 2,522Equity attributable to owners of the parent (29,530)Non-controlling interests (1,780)Total equity (31,310)
LiabilitiesNon-current liabilities
Finance lease (393)Interest-bearing loans and borrowings 23 (393)Lease liabilities 24 591,190Total non-current liabilities 590,797
Current liabilitiesOther payables and accrued liabilities (462)
Trade and other payables 27 (462)Finance lease (15)
Interest-bearing loans and borrowings 23 (15)Lease liabilities 24 79,890Total current liabilities 79,413Total liabilities 670,210Total equity and liabilities 638,900
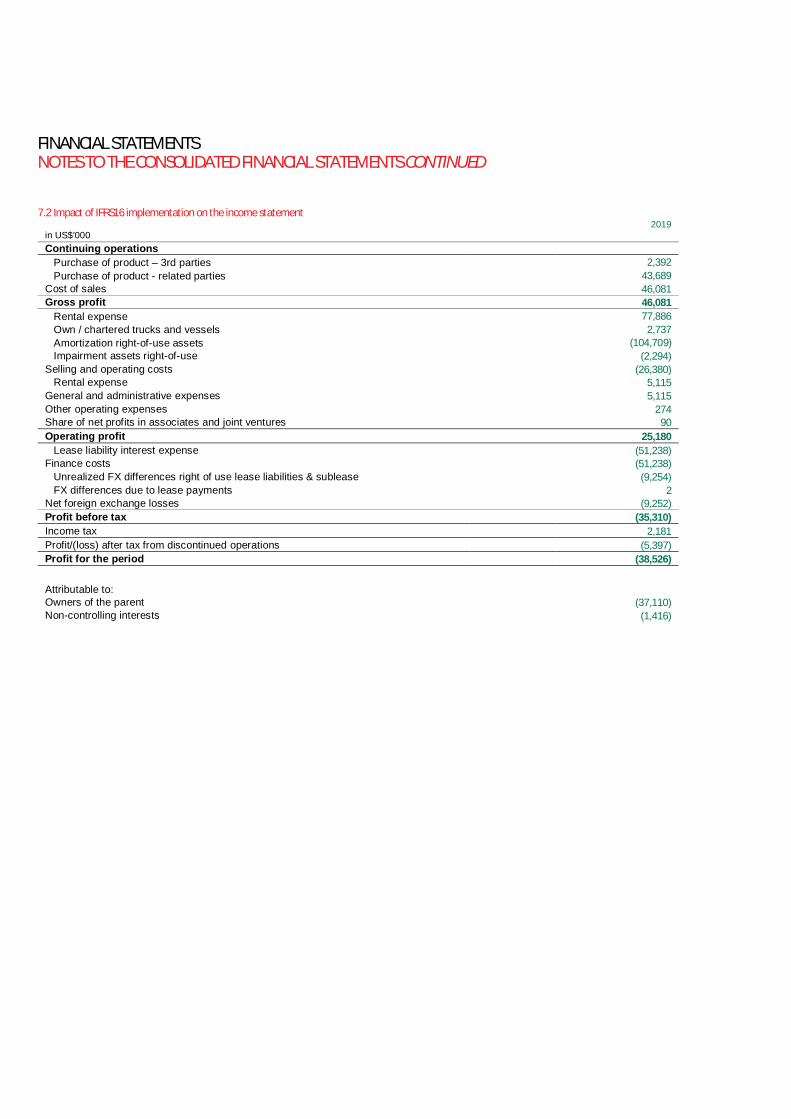
FINANCIAL STATEMENTSNOTES TO THE CONSOLIDATED FINANCIAL STATEMENTS CONTINUED
7.2 Impact of IFRS16 implementation on the income statement2019
in US$’000Continuing operations Purchase of product – 3rd parties 2,392 Purchase of product - related parties 43,689Cost of sales 46,081Gross profit 46,081 Rental expense 77,886 Own / chartered trucks and vessels 2,737 Amortization right-of-use assets (104,709) Impairment assets right-of-use (2,294)Selling and operating costs (26,380) Rental expense 5,115General and administrative expenses 5,115Other operating expenses 274Share of net profits in associates and joint ventures 90Operating profit 25,180 Lease liability interest expense (51,238)Finance costs (51,238) Unrealized FX differences right of use lease liabilities & sublease (9,254) FX differences due to lease payments 2Net foreign exchange losses (9,252)Profit before tax (35,310)Income tax 2,181Profit/(loss) after tax from discontinued operations (5,397)Profit for the period (38,526)
Attributable to:Owners of the parent (37,110)Non-controlling interests (1,416)
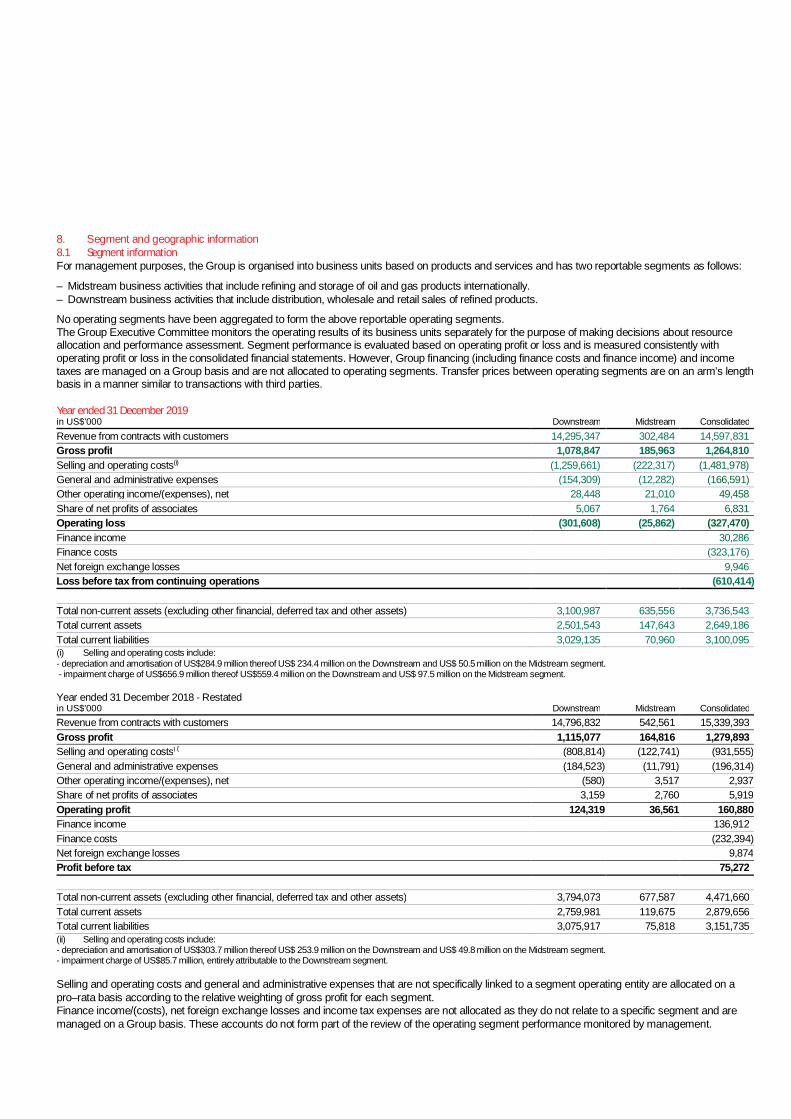
8. Segment and geographic information8.1 Segment informationFor management purposes, the Group is organised into business units based on products and services and has two reportable segments as follows:
– Midstream business activities that include refining and storage of oil and gas products internationally.– Downstream business activities that include distribution, wholesale and retail sales of refined products.
No operating segments have been aggregated to form the above reportable operating segments.The Group Executive Committee monitors the operating results of its business units separately for the purpose of making decisions about resourceallocation and performance assessment. Segment performance is evaluated based on operating profit or loss and is measured consistently withoperating profit or loss in the consolidated financial statements. However, Group financing (including finance costs and finance income) and incometaxes are managed on a Group basis and are not allocated to operating segments. Transfer prices between operating segments are on an arm’s lengthbasis in a manner similar to transactions with third parties.
Year ended 31 December 2019in US$’000 Downstream Midstream ConsolidatedRevenue from contracts with customers 14,295,347 302,484 14,597,831Gross profit 1,078,847 185,963 1,264,810Selling and operating costs(i) (1,259,661) (222,317) (1,481,978)General and administrative expenses (154,309) (12,282) (166,591)Other operating income/(expenses), net 28,448 21,010 49,458Share of net profits of associates 5,067 1,764 6,831Operating loss (301,608) (25,862) (327,470)Finance income 30,286Finance costs (323,176)Net foreign exchange losses 9,946Loss before tax from continuing operations (610,414)
Total non-current assets (excluding other financial, deferred tax and other assets) 3,100,987 635,556 3,736,543Total current assets 2,501,543 147,643 2,649,186Total current liabilities 3,029,135 70,960 3,100,095(i) Selling and operating costs include:- depreciation and amortisation of US$284.9 million thereof US$ 234.4 million on the Downstream and US$ 50.5 million on the Midstream segment. - impairment charge of US$656.9 million thereof US$559.4 million on the Downstream and US$ 97.5 million on the Midstream segment.
Year ended 31 December 2018 - Restatedin US$’000 Downstream Midstream ConsolidatedRevenue from contracts with customers 14,796,832 542,561 15,339,393Gross profit 1,115,077 164,816 1,279,893Selling and operating costs(ii) (808,814) (122,741) (931,555)General and administrative expenses (184,523) (11,791) (196,314)Other operating income/(expenses), net (580) 3,517 2,937Share of net profits of associates 3,159 2,760 5,919Operating profit 124,319 36,561 160,880Finance income 136,912Finance costs (232,394)Net foreign exchange losses 9,874Profit before tax 75,272
Total non-current assets (excluding other financial, deferred tax and other assets) 3,794,073 677,587 4,471,660Total current assets 2,759,981 119,675 2,879,656Total current liabilities 3,075,917 75,818 3,151,735(ii) Selling and operating costs include:- depreciation and amortisation of US$303.7 million thereof US$ 253.9 million on the Downstream and US$ 49.8 million on the Midstream segment.- impairment charge of US$85.7 million, entirely attributable to the Downstream segment.
Selling and operating costs and general and administrative expenses that are not specifically linked to a segment operating entity are allocated on apro–rata basis according to the relative weighting of gross profit for each segment.Finance income/(costs), net foreign exchange losses and income tax expenses are not allocated as they do not relate to a specific segment and aremanaged on a Group basis. These accounts do not form part of the review of the operating segment performance monitored by management.
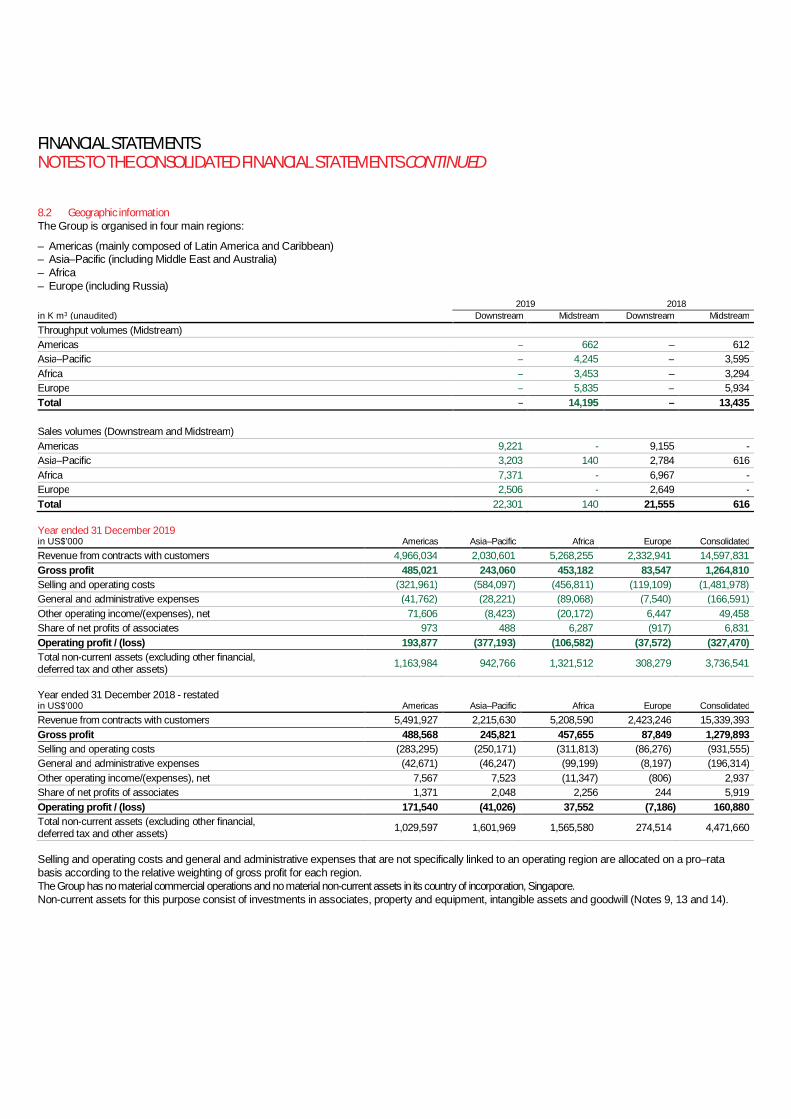
FINANCIAL STATEMENTSNOTES TO THE CONSOLIDATED FINANCIAL STATEMENTS CONTINUED
8.2 Geographic informationThe Group is organised in four main regions:
– Americas (mainly composed of Latin America and Caribbean)– Asia–Pacific (including Middle East and Australia)– Africa– Europe (including Russia)
2019 2018in K m3 (unaudited) Downstream Midstream Downstream MidstreamThroughput volumes (Midstream)Americas – 662 – 612Asia–Pacific – 4,245 – 3,595Africa – 3,453 – 3,294Europe – 5,835 – 5,934Total – 14,195 – 13,435
Sales volumes (Downstream and Midstream)Americas 9,221 - 9,155 -Asia–Pacific 3,203 140 2,784 616Africa 7,371 - 6,967 -Europe 2,506 - 2,649 -Total 22,301 140 21,555 616
Year ended 31 December 2019in US$’000 Americas Asia–Pacific Africa Europe ConsolidatedRevenue from contracts with customers 4,966,034 2,030,601 5,268,255 2,332,941 14,597,831Gross profit 485,021 243,060 453,182 83,547 1,264,810Selling and operating costs (321,961) (584,097) (456,811) (119,109) (1,481,978)General and administrative expenses (41,762) (28,221) (89,068) (7,540) (166,591)Other operating income/(expenses), net 71,606 (8,423) (20,172) 6,447 49,458Share of net profits of associates 973 488 6,287 (917) 6,831Operating profit / (loss) 193,877 (377,193) (106,582) (37,572) (327,470)Total non-current assets (excluding other financial,deferred tax and other assets) 1,163,984 942,766 1,321,512 308,279 3,736,541
Year ended 31 December 2018 - restatedin US$’000 Americas Asia–Pacific Africa Europe ConsolidatedRevenue from contracts with customers 5,491,927 2,215,630 5,208,590 2,423,246 15,339,393Gross profit 488,568 245,821 457,655 87,849 1,279,893Selling and operating costs (283,295) (250,171) (311,813) (86,276) (931,555)General and administrative expenses (42,671) (46,247) (99,199) (8,197) (196,314)Other operating income/(expenses), net 7,567 7,523 (11,347) (806) 2,937Share of net profits of associates 1,371 2,048 2,256 244 5,919Operating profit / (loss) 171,540 (41,026) 37,552 (7,186) 160,880Total non-current assets (excluding other financial,deferred tax and other assets) 1,029,597 1,601,969 1,565,580 274,514 4,471,660
Selling and operating costs and general and administrative expenses that are not specifically linked to an operating region are allocated on a pro–ratabasis according to the relative weighting of gross profit for each region.The Group has no material commercial operations and no material non-current assets in its country of incorporation, Singapore.Non-current assets for this purpose consist of investments in associates, property and equipment, intangible assets and goodwill (Notes 9, 13 and 14).

9. Investments in associatesThe following table summarises the Group’s investments in associates for the years ended 31 December 2019 and 2018. None of the entities includedbelow is listed on any public exchange.
9.1 List of investmentsProportion of voting interests held at
31 DecemberAssociate name Activity Location 2019 2018
% %Empresa Cubana de Gas Fuel marketing Caribbean 50% 50%Puma Energy Belfast Ltd Storage United Kingdom 50% 50%Emoil Petroleum Storage FZCO Storage United Arab Emirates 20% 20%Oil Malal SA Storage Chile 33% 33%Sakunda Petroleum (Pvt) Ltd Fuel marketing Zimbabwe 49% 49%Fuel Distributors of Western Australia Pty Ltd(i) Fuel supply and cartage Australia 50% 50%Bitumen Storage Services (WA) Pty Ltd (Australia) Storage Australia 50% 50%RAM Petroleum (Pvt) Ltd Fuel supply Zimbabwe 48% 48%High Heat Tankers Pte. Ltd. Shipping of high heat liquid products Singapore 50% 50%(i) considered as part of discontinued operations
9.2 Associates summarised financial informationThe following table illustrates summarised financial information of the Group’s investments in associates:in US$’000 2019 2018Associates’ assets and liabilitiesCurrent assets 102,988 106,869Non-current assets 85,176 97,746Current liabilities (82,083) (62,963)Non-current liabilities (35,733) (54,991)Equity 70,348 86,661Total carrying amount of the investments 37,634 39,932Less: discontinued operations 9,991 -Carrying amount of the investments 27,643 39,932
Associates’ revenues and net profits:Revenues 428,110 475,216Profits net of tax 1,366 17,167Total group’s share of net profits of associates 7,132 6,166Less: discontinued operations 301 247Group’s share of net profits of associates 6,831 5,919
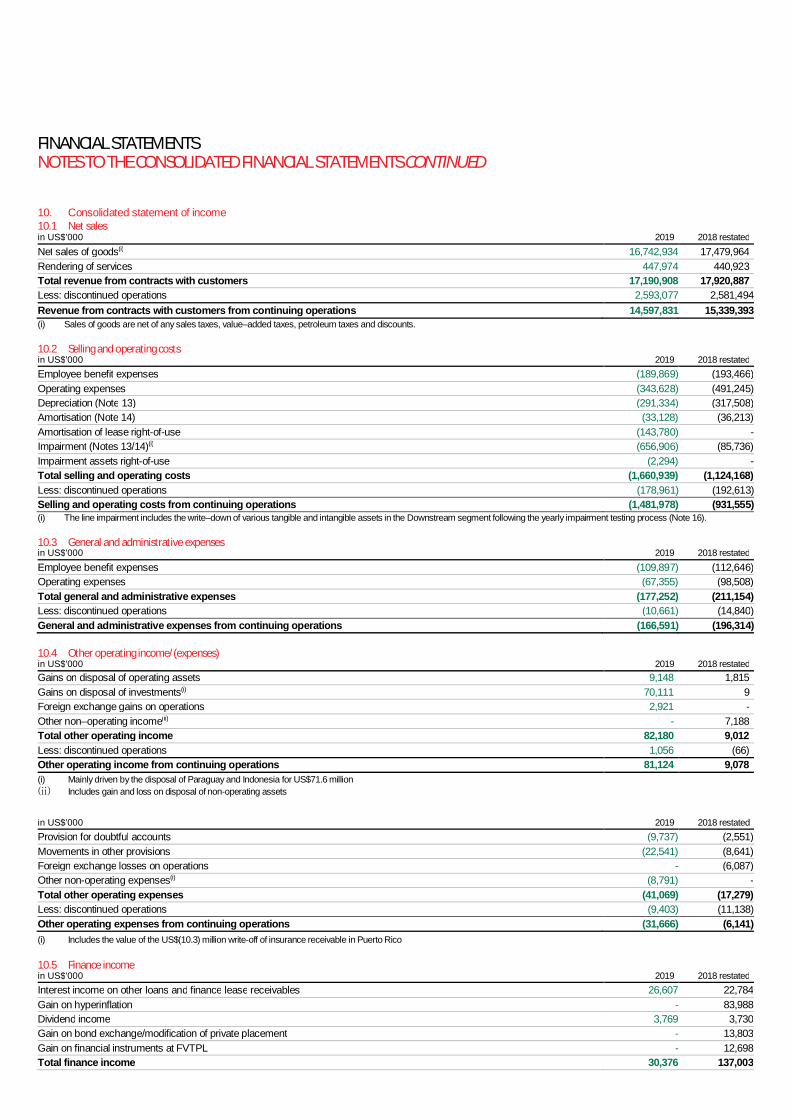
FINANCIAL STATEMENTSNOTES TO THE CONSOLIDATED FINANCIAL STATEMENTS CONTINUED
10. Consolidated statement of income10.1 Net salesin US$’000 2019 2018 restatedNet sales of goods(i) 16,742,934 17,479,964Rendering of services 447,974 440,923Total revenue from contracts with customers 17,190,908 17,920,887Less: discontinued operations 2,593,077 2,581,494Revenue from contracts with customers from continuing operations 14,597,831 15,339,393(i) Sales of goods are net of any sales taxes, value–added taxes, petroleum taxes and discounts.
10.2 Selling and operating costsin US$’000 2019 2018 restatedEmployee benefit expenses (189,869) (193,466)Operating expenses (343,628) (491,245)Depreciation (Note 13) (291,334) (317,508)Amortisation (Note 14) (33,128) (36,213)Amortisation of lease right-of-use (143,780) -Impairment (Notes 13/14)(i) (656,906) (85,736)Impairment assets right-of-use (2,294) -Total selling and operating costs (1,660,939) (1,124,168)Less: discontinued operations (178,961) (192,613)Selling and operating costs from continuing operations (1,481,978) (931,555)(i) The line impairment includes the write–down of various tangible and intangible assets in the Downstream segment following the yearly impairment testing process (Note 16).
10.3 General and administrative expensesin US$’000 2019 2018 restatedEmployee benefit expenses (109,897) (112,646)Operating expenses (67,355) (98,508)Total general and administrative expenses (177,252) (211,154)Less: discontinued operations (10,661) (14,840)General and administrative expenses from continuing operations (166,591) (196,314)
10.4 Other operating income/(expenses)in US$’000 2019 2018 restatedGains on disposal of operating assets 9,148 1,815Gains on disposal of investments(i) 70,111 9Foreign exchange gains on operations 2,921 -Other non–operating income(ii) - 7,188Total other operating income 82,180 9,012Less: discontinued operations 1,056 (66)Other operating income from continuing operations 81,124 9,078(i) Mainly driven by the disposal of Paraguay and Indonesia for US$71.6 million(ii) Includes gain and loss on disposal of non-operating assets
in US$’000 2019 2018 restatedProvision for doubtful accounts (9,737) (2,551)Movements in other provisions (22,541) (8,641)Foreign exchange losses on operations - (6,087)Other non-operating expenses(i) (8,791) -Total other operating expenses (41,069) (17,279)Less: discontinued operations (9,403) (11,138)Other operating expenses from continuing operations (31,666) (6,141)(i) Includes the value of the US$(10.3) million write-off of insurance receivable in Puerto Rico
10.5 Finance incomein US$’000 2019 2018 restatedInterest income on other loans and finance lease receivables 26,607 22,784Gain on hyperinflation - 83,988Dividend income 3,769 3,730Gain on bond exchange/modification of private placement - 13,803Gain on financial instruments at FVTPL - 12,698Total finance income 30,376 137,003

Less: discontinued operations 90 91Finance income from continuing operations 30,286 136,912
10.6 Finance costsin US$’000 2019 2018 restatedInterest on loans and borrowings from third parties (224,668) (240,776)Interest on loans and borrowings from related parties (13,081) (523)Interest on lease liability (68,634) -Loss on hyperinflation(i) (10,602) -Unwinding of discount (1,059) (1,354)Other financial costs (28,433) (5,828)Total finance costs (346,477) (248,481)Less: discontinued operations (23,301) (16,087)Finance costs from continuing operations (323,176) (232,394)(i) The amount is a net between a loss in Zimbabwe and a gain in Angola
10.7 Net foreign exchange gains/(losses)in US$’000 2019 2018 restatedFinancial FX gains / (losses) (25) (16,401)Net gain / (loss) on FX derivatives 9,954 26,095Net foreign exchange gains / (losses) 9,929 9,694Less: discontinued operations (17) (180)Net foreign exchange gains / (losses) from continuing operations 9,946 9,874
11. Income tax
11.1 Current income tax expenseThe major components of income tax expense for the years ended 31 December 2019 and 2018 were:in US$’000 2019 2018 restatedCurrent income taxCurrent income tax charge 63,831 49,015Adjustments in respect of current income tax of previous year 1,761 3,203Current income tax 65,592 52,218Deferred taxRelating to origination and reversal of temporary differences 615 4,148Withholding taxApplicable withholding tax in the current year 11,220 4,213
Income tax expense reported in the consolidated statement of income 77,427 60,579
11.2 Income tax recognised directly in other comprehensive incomeIncome tax totalling US$(0.4) million (2018: US$(0.3) million) was recognised directly in other comprehensive income. The entire amount recognisedrelated to the actuarial losses recognised during the year from the Group’s various defined benefit plans.

FINANCIAL STATEMENTSNOTES TO THE CONSOLIDATED FINANCIAL STATEMENTS CONTINUED
11.3 Reconciliation of accounting profit to income tax expenseThe Group’s effective tax rate differs from the Company’s statutory income tax rate in Singapore, which was 17% in 2019 (2018: 17%) due to theGroup operating in several jurisdictions. A reconciliation between tax expense and the product of accounting profit multiplied by the Group’s statutoryblended income tax rate of jurisdictions the Group operates in for the years ended 31 December 2019 and 2018 was as follows:in US$’000 2019 2018 restatedAccounting (loss)/profit before Income tax (610,414) 75,272Share of net profits in associates 6,831 5,919Accounting (loss)/profit before tax net of share of net profits in associates (617,245) 69,353Income tax (expense) / benefit at expected statutory rate 44,164 (46,337)Permanent differencesNon-deductible expenses (27,556) (30,536)Other non–taxable income 2,896 3,850Capital gains or losses 38 8Income exempt or subject to specific tax holidays 1,872 6,423Other permanent differences (20,048) (8,687)
Adjustment for countries not based on net taxable income 351 27,462Adjustments recognised in the current year in relation to current income tax of previous years (1,779) (3,203)Adjustments recognised in the current year in relation to deferred income tax of previous years (362) 5,305Impact of rate differences on deferred tax items (622) (1,728)Effect of unrecognised and unused tax losses not recognised as deferred tax assets (56,048) (3,752)Withholding tax (11,220) (4,213)Minimum tax and surtax (5,449) (3,465)Rate difference impacts 1,569 (327)Other adjustments (5,233) (1,379)At the effective income tax rate of -13% (2018: 252%) (77,427) (60,579)(i) Income exempt or subject to specific tax holidays is mainly the result from tax–specific incentives granted by certain national authorities to the Group given certain investments made
by the Group that resulted in the development of local infrastructure.
The Group operates in a multitude of jurisdictions and adheres to applicable local and international tax law in the countries in which it operates,including legislation on transfer pricing. The Group’s tax policy is to pay appropriate tax according to work carried out in each jurisdiction, as determinedby a functional analysis of operations using standard measures wherever possible, underpinned by reports prepared to fulfil local transfer pricingrequirements. The Group’s effective tax rate – the average rate at which consolidated pre-tax profits are taxed – varies from year to year according tocircumstances, but in 2019 it was -19.37%, excluding Australia discontinued operations the ETR is -13% (2018: 252.25%). The difference in effectivetax rate between the two years is explained, by non-recognition of deferred tax assets relating to tax loss carry forwards.
11.4 Current tax assets and liabilitiesCurrent income taxes are computed on the profit before tax presented in the consolidated statement of income adjusted to taxable profit in accordancewith local tax legislation. Current income tax assets and liabilities for the current and prior periods are measured at the amount expected to berecovered from or paid to the tax authorities. Current tax assets mainly relate to overpaid tax. Current tax liabilities relate to income tax payable.
11.5 Deferred tax assets and liabilitiesConsolidated statement
of financial positionConsolidated statement
of incomein US$’000 2019 2018 2019 2018Accelerated depreciation for tax purposes (12,496) (25,922) (11,797) (400)Revaluations (27,078) (30,682) (3,180) (4,795)Losses 98,206 126,470 (29,492) (27,370)Other temporary differences (57,245) (14,768) 96,131 25,884Deferred tax expense/(income) 51,662 (6,681)Deferred tax assets/(liabilities), net 1,387 55,098Reflected in the consolidated statement of financial position as follows:Deferred tax assets 52,384 109,940Deferred tax liabilities (50,997) (54,842)Deferred tax assets/(liabilities), net 1,387 55,098
Reconciliation of net deferred tax assets/(liabilities)in US$’000 2019 2018Opening balance at 1 January 3,414 51,491Tax income recognised in profit or loss during the year (616) 6,717Change in tax rate recognised in profit or loss during the year - 481Other movements during the year (1,411) (3,591)Closing balance at 31 December 1,387 55,098

At 31 December 2019, the Group had unrecognised tax loss carry forwards amounting to US$ 516.7 million excluding the impact of Australia discontinued operations(2018: US$240.8million). These losses relate to subsidiaries that have had historical losses, which have an expiry date of more than four years. Theselosses may not be used to offset taxable income elsewhere in the Group and where the subsidiaries have no taxable temporary differences nor any taxplanning opportunities available that could partly support the recognition of these losses as deferred tax assets.At 31 December 2019, the Group had unrecognised other temporary differences amounting to US$2.7million (2018: US$0.9million). These temporarydifferences have no expiry date. If the Group was able to recognise all unrecognised deferred tax assets, profit would increase by US$69.1million(2018: US$56.9million).
11.6 Tax uncertaintiesThe Group operates in numerous jurisdictions worldwide resulting in cross–border intercompany transactions whereby the transfer pricing rules applied in onecountry have an impact on the results in another country. Due to complexity of tax rules, interpretation by local taxing authorities can differ from the Group’sinterpretation based on opinions provided by local tax counsel.In countries where the Group starts new operations or alters business models, the issue of having a permanent establishment and profit allocationthereto may arise. The risk is that tax authorities in multiple jurisdictions claim taxation rights over the same profit.
12. Discontinued operations
In December 2019 the company announced the sale of its Australian commercial and retail fuels business. The operation is part of the Downstreamsegment and the Asia-Pacific region of the group. The transaction is expected to complete by mid-2020. The operation has been classified as adisposal group held for sale.
12.1 Statement of income from discontinued operations
in US$’0002019 2018
Revenue from contracts with customers 2,593,077 2,581,494Cost of sales (2,425,077) (2,401,831)Gross profit 168,000 179,663Selling and operating costs (178,961) (192,613)General and administrative expenses (10,661) (14,840)Other operating income 1,056 (66)Other operating expenses (9,403) (11,138)Share of net profits and losses of associates 301 247Operating profit (29,668) (38,747)Finance income 90 91Finance costs (23,301) (16,087)Net foreign exchange gains/(losses) (17) (180)Loss before tax (52,896) (54,923)Income tax expense (51,046) 9,248Loss for the year from discontinued operations (103,942) (45,675)
Attributable to:Owners of the parent (103,942) (45,675)Non-controlling interests

FINANCIAL STATEMENTSNOTES TO THE CONSOLIDATED FINANCIAL STATEMENTS CONTINUED
12.2 Impact of IFRS16 implementation on the income statement from discontinued operationsin US$’000 2019Gross profit - Rental expense 45,049 Amortization right-of-use assets (39,071) Impairment charge / (reversal) 3,616Selling and operating costs 9,594 Rental expense 2,391General and administrative expenses 2,391Other operating expenses 13Operating profit 11,998 Lease liability interest expense (17,395)Finance costs (17,395)Profit before tax (5,397)Income tax -Profit for the period (5,397)
12.3 Net sales from discontinued operationsin US$’000 2019 2018Net sales of goods(i) 2,428,298 2,438,664Rendering of services 164,779 142,830Revenue from contracts with customers 2,593,077 2,581,494(i) Sales of goods are net of any sales taxes, value–added taxes, petroleum taxes and discounts.
12.4 Selling and operating costs from discontinued operationsin US$’000 2019 2018Employee benefit expenses (53,354) (44,612)Operating expenses (46,953) (97,261)Depreciation (Note 13) (35,710) (39,633)Amortisation (Note 14) (3,873) (10,351)Amortisation of lease right-of-use (39,071) -Impairment (Notes 13/14) - (756)Selling and operating costs (178,961) (192,613)
12.5 General and administrative expenses from discontinued operationsin US$’000 2019 2018Employee benefit expenses (6,684) (10,075)Operating expenses (3,977) (4,765)General and administrative expenses (10,661) (14,840)
12.6 Other operating income/(expenses) from discontinued operationsin US$’000 2019 2018Gains / (losses) on disposal of assets 971 (66)Foreign exchange gains on operations 85 -Other operating income 1,056 (66)
in US$’000 2019 2018Provision for doubtful accounts (5,113) (540)Movements in other provisions (958) (2,621)Foreign exchange losses on operations - (195)Other non-operating expenses(i) (3,332) (7,782)Other operating expenses (9,403) (11,138)
12.7 Finance income from discontinued operationsin US$’000 2019 2018Interest income on other loans and finance lease receivables 90 91Finance income 90 91
12.8 Finance costs from discontinued operationsin US$’000 2019 2018Interest on loans and borrowings from third parties (2,283) (2,777)Interest on loans and borrowings from related parties (3,622) (13,234)Lease financial costs (17,396) -Unwinding of discount - (76)Finance costs from continuing operations (23,301) (16,087)

12.9 Statement of financial position from discontinued operationsin US$’000 2019AssetsNon-current assetsProperty and equipment 216,383Intangible assets and goodwill 63,036Right-of-use (IFRS16) 418,890Investments in associates 9,992Other financial assets -Deferred tax assets 3,085Other assets 218Total non-current assets 711,604Current assetsInventories 65,835Other assets 5,389Income tax receivable -Trade receivables 74,791Other financial assets -Cash and cash equivalents 2,496Total current assets 148,511Total assets held for sale 860,115Non-current liabilitiesInterest-bearing loans and borrowings -Lease liabilities 401,168Retirement benefit obligations -Other financial liabilities 294Deferred tax liabilities 3,085Provisions 2,192Total non-current liabilities 406,739Current liabilitiesTrade and other payables 86,418Interest-bearing loans and borrowings 69Lease liabilities 29,274Other financial liabilities -Income tax payable -Provisions 3,853Total current liabilities 119,614Total liabilities 526,353Net assets associated with the disposal group 333,762
Statement of cash flows from discontinued operations
in US$’000 2019Net cash flows from operating activities 38,261Net cash flows used in investing activities (35,587)Net cash flows from financing activities (3,337)Net decrease in cash and cash equivalents (663)Effects of exchange rate differences (444)Cash and cash equivalents at 1 January 2019 3,603Cash and cash equivalents at 31 December 2019 under discontinued operations 2,496

FINANCIAL STATEMENTSNOTES TO THE CONSOLIDATED FINANCIAL STATEMENTS CONTINUED
13. Property and equipment
in US$’000Land andbuildings
Machinery andequipment
Motorvehicles
Office and ITequipment
Fixed assets in progress Total
CostAt 1 January 2018 1,472,231 3,435,271 182,880 99,386 158,077 5,347,845Additions(i) 52,598 77,744 15,262 7,019 109,918 262,541Sale of interest in subsidiary (4,345) (273) (93) (79) - (4,790)Disposals (7,133) (19,947) (11,415) (3,230) (261) (41,986)Acquisitions of subsidiaries (Note 6.2) 15,375 4,363 - 116 1,541 21,395Write–offs (2,022) (29,804) (856) (1,261) - (33,943)Reclassifications 31,207 100,475 6,071 953 (145,614) (6,908)Exchange adjustment(i) (212,555) (342,840) (17,914) (6,745) (12,330) (592,384)At 31 December 2018 1,345,356 3,224,989 173,935 96,159 111,331 4,951,770Additions(i) 7,164 47,386 6,937 4,278 72,052 137,817Sale of interest in subsidiary (40,232) (56,679) (1,814) (2,892) (1,690) (103,307)Disposals (21,964) (12,259) (11,669) (1,448) 1,256 (46,084)Write–offs (1,284) (1,739) (77) (366) - (3,466)Reclassifications 22,803 48,681 2,043 5,851 (86,095) (6,717)Exchange adjustment, other(i) (105,324) (192,867) (2,764) (2,808) (3,844) (307,607)Total costs at 31 December 2019 1,206,519 3,057,512 166,591 98,774 93,010 4,622,406Less: assets held for sale (71,462) (222,089) (57,526) (19,641) (896) (371,614)Cost at 31 December 2019 for continuing operations 1,135,058 2,835,423 109,065 79,133 92,114 4,250,793
Depreciation and impairmentAt 1 January 2018 (438,585) (1,161,324) (76,957) (56,555) - (1,733,421)Depreciation (Note 10.2) (50,619) (228,008) (21,712) (17,169) - (317,508)Sale of interest in subsidiary 192 13 43 76 - 324Disposals 3,945 18,725 11,199 3,286 - 37,155Impairment (Note 10.2) (18,728) (18,439) (4,145) (1,033) - (42,345)Write–offs 2,022 29,804 856 1,261 - 33,943Exchange adjustment, other(i) 102,614 113,958 7,749 5,007 (526) 228,802At 31 December 2018 (399,159) (1,245,271) (82,967) (65,127) (526) (1,793,050)Depreciation (Note 10.2) (46,548) (210,530) (20,254) (14,002) - (291,334)Sale of interest in subsidiary 11,633 36,462 1,214 2,456 - 51,765Disposals 3,608 4,198 8,660 1,416 - 17,882Impairment (Note 10.2) (33,996) (75,787) (869) (3,827) - (114,479)Write–offs 791 1,739 77 366 - 2,973Reclassifications (4,149) 1,488 2,814 (952) - (799)Exchange adjustment, other(i) 49,484 86,905 1,522 3,099 526 141,536Total depreciation and impairment at 31 December 2019 (418,336) (1,400,796) (89,803) (76,571) - (1,985,506)Less: assets held for sale 21,483 90,652 28,749 14,348 - 155,232Depreciation and impairment at 31 December 2019 forcontinuing operations
(396,853) (1,310,144) (61,054) (62,223) - (1,830,274)
Net book value for continuing operationsAt 31 December 2019 738,205 1,525,279 48,011 16,910 92,114 2,420,519At 31 December 2018 946,197 1,979,718 90,968 31,032 110,805 3,158,720(i) Includes the impact from hyperinflation adjustment in Angola and Zimbabwe, for a net amount of US$8.7 million (2018: US$74.2 million).
Certain items included in property and equipment are pledged as collateral for the third–party loans granted to certain of the Group’s affiliates amountingto US$53 million (2018: US$52 million). The Group does not hold any property for investment purposes.
Exchange rate adjustments reflect the translation effects from movements in foreign currencies against the US Dollar.All property, plant and equipment is valued at historic cost, and no revaluations are made, in line with Group policy.

14. Intangible assets and goodwillin US$’000 Goodwill Licences Other intangibles TotalCost or valuationAt 1 January 2018 1,076,413 91,161 475,161 1,642,735Acquisitions/disposals of subsidiaries (Note 6.2) 1,842 - - 1,842Additions - 11,884 4,883 16,767Sale of interest in subsidiary (5,411) (117) (2,343) (7,871)Disposals - (677) (2,100) (2,777)Exchange adjustment(i) (75,490) (4,774) (51,558) (131,822)Reclassifications - 2,577 4,331 6,908Write–offs - (123) (8,307) (8,430)At 31 December 2018 997,354 99,931 420,067 1,517,352Additions - 5,852 2,390 8,242Sale of interest in subsidiary (Note 6.6) (9,229) (389) (33,341) (42,959)Disposals - (387) (2,042) (2,429)Exchange adjustment, other(i) (3,108) (628) (24,393) (28,129)Reclassifications - 431 2,950 3,381Total cost or valuation at 31 December 2019 985,017 104,810 365,631 1,455,458Less: assets held for sale (49,419) (14,181) (46,971) (110,571)Cost or valuation at 31 December 2019 for continuing operations 935,598 90,629 318,660 1,344,887
Amortisation and impairmentAt 1 January 2018 (25,988) (51,434) (111,453) (188,875)Amortisation charge for the year (Note 10.2) - (10,685) (25,528) (36,213)Impairment (Note 10.2) (41,114) (133) (2,144) (43,391)Sale of interest in subsidiary (Note 6.6) - 101 432 533Disposals - 673 1,318 1,991Exchange adjustment, other(i) - 4,310 8,871 13,181Write–offs - 123 8,307 8,430At 31 December 2018 (67,102) (57,045) (120,197) (244,344)Amortisation charge for the year (Note 10.2) - (14,752) (18,376) (33,128)Impairment (Note 10.2) (542,336) (41) (50) (542,427)Sale of interest in subsidiary (Note 6.6) 9,228 326 21,525 31,079Disposals - 386 165 551Exchange adjustment, other(i) (2,787) 650 4,108 1,971Total amortisation and impairment at 31 December 2019 (602,997) (70,476) (112,825) (786,298)Less: assets held for sale - 13,740 33,795 47,535Amortisation and impairment at 31 December 2019 for continuing operations (602,997) (56,736) (79,030) (738,763)
Net book value:At 31 December 2019 332,601 33,893 239,630 606,124At 31 December 2018 930,252 42,886 299,870 1,273,008(i) Includes the impact from hyperinflation adjustment in Angola and Zimbabwe, for a net amount of US$(0.4) million (2018: US$ 8.6 million).

FINANCIAL STATEMENTSNOTES TO THE CONSOLIDATED FINANCIAL STATEMENTS CONTINUED
15. Right-of-use
in US$’000 Land Buildings Servicestations
Storagefacilities
Equipment andmachinery Vehicles Vessels
Equipmentand IT
materialTotal
CostAt 1 January 2018 - - - - - - - - -At 31 December 2018 - - - - - - - - -Additions 260,562 260,211 404,341 93,957 21,330 3,497 207,104 156 1,251,158Decrease (5) (3) (18) - - - - - (26)Write-off (370) (611) (981) (9) - (195) - - (2,166)Reclassification 633 - - - - - - - 633Sale of interest in subsidiaries (3,104) - (68) (541) - - - - (3,713)Exchange adjustment , other (5,121) 1,255 450 1,788 117 26 - (1) (1,486)Total cost at 31 December 2019 252,595 260,852 403,724 95,195 21,447 3,328 207,104 155 1,244,400Assets held for sale (26,467) (222,266) (200,416) (8,949) (58) - - - (458,156)Cost at 31 December 2019 forcontinuing operations 226,128 38,586 203,308 86,246 21,389 3,328 207,104 155 786,244
in US$’000 Land Buildings Servicestations
Storagefacilities
Equipment andmachinery Vehicles Vessels
Equipmentand IT
materialTotal
Amortisation and impairmentAt 1 January 2018 - - - - - - - - -At 31 December 2018 - - - - - - - - -Amortization (22,607) (25,095) (46,293) (11,071) (1,477) (1,202) (35,964) (71) (143,780)Impairment (1,499) (149) - (235) (411) - - - (2,294)Write-off 371 611 981 8 - 195 - - 2,166Sale of interest in subsidiaries 349 - 7 324 - - - - 680Exchange adjustment , other 282 (77) 4 (199) (28) (8) - - (26)Total amortisation and impairment at 31December 2019 (23,104) (24,710) (45,301) (11,173) (1,916) (1,015) (35,964) (71) (143,254)
Assets held for sale 1,712 17,086 20,122 340 7 - - - 39,267Amortisation and impairment at 31December 2019 for continuingoperations
(21,392) (7,624) (25,179) (10,833) (1,909) (1,015) (35,964) (71) (103,987)
At 31 December 2019 204,736 30,962 178,129 75,413 19,480 2,313 171,140 84 682,257At 31 December 2018 - - - - - - - - -
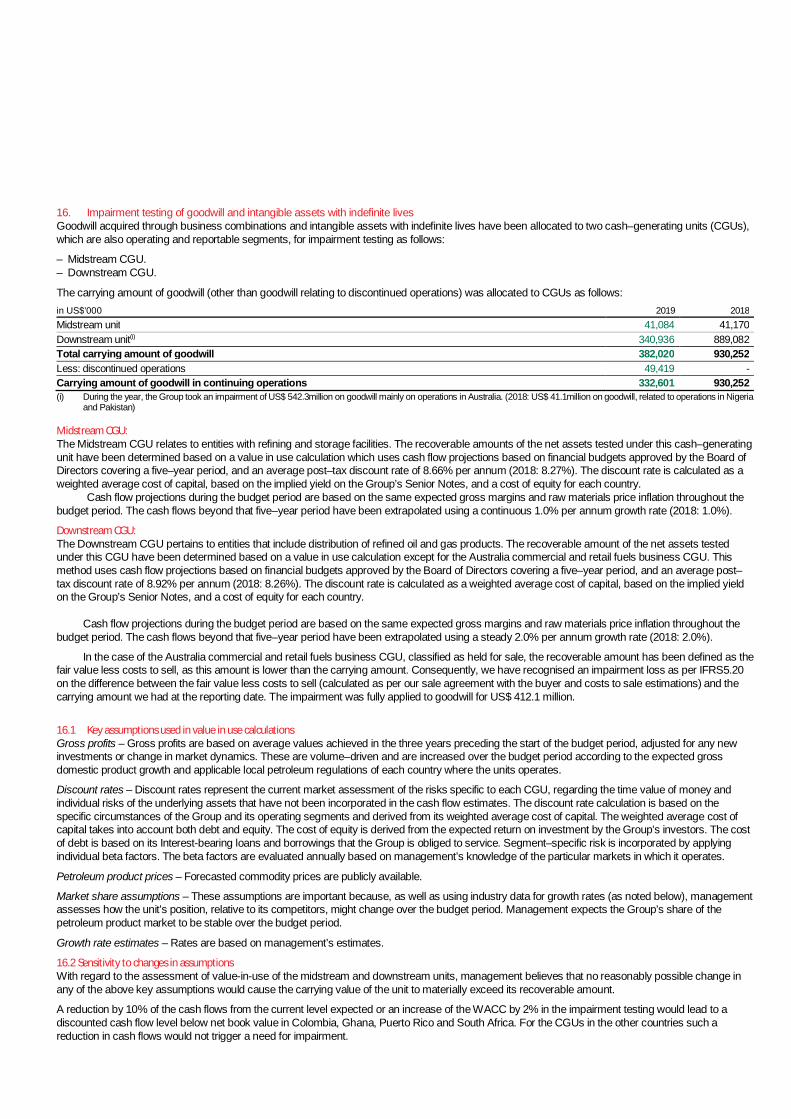
16. Impairment testing of goodwill and intangible assets with indefinite livesGoodwill acquired through business combinations and intangible assets with indefinite lives have been allocated to two cash–generating units (CGUs),which are also operating and reportable segments, for impairment testing as follows:
– Midstream CGU.– Downstream CGU.
The carrying amount of goodwill (other than goodwill relating to discontinued operations) was allocated to CGUs as follows:in US$’000 2019 2018Midstream unit 41,084 41,170Downstream unit(i) 340,936 889,082Total carrying amount of goodwill 382,020 930,252Less: discontinued operations 49,419 -Carrying amount of goodwill in continuing operations 332,601 930,252(i) During the year, the Group took an impairment of US$ 542.3million on goodwill mainly on operations in Australia. (2018: US$ 41.1million on goodwill, related to operations in Nigeria
and Pakistan)
Midstream CGU:The Midstream CGU relates to entities with refining and storage facilities. The recoverable amounts of the net assets tested under this cash–generatingunit have been determined based on a value in use calculation which uses cash flow projections based on financial budgets approved by the Board ofDirectors covering a five–year period, and an average post–tax discount rate of 8.66% per annum (2018: 8.27%). The discount rate is calculated as aweighted average cost of capital, based on the implied yield on the Group’s Senior Notes, and a cost of equity for each country.
Cash flow projections during the budget period are based on the same expected gross margins and raw materials price inflation throughout thebudget period. The cash flows beyond that five–year period have been extrapolated using a continuous 1.0% per annum growth rate (2018: 1.0%).
Downstream CGU:The Downstream CGU pertains to entities that include distribution of refined oil and gas products. The recoverable amount of the net assets testedunder this CGU have been determined based on a value in use calculation except for the Australia commercial and retail fuels business CGU. Thismethod uses cash flow projections based on financial budgets approved by the Board of Directors covering a five–year period, and an average post–tax discount rate of 8.92% per annum (2018: 8.26%). The discount rate is calculated as a weighted average cost of capital, based on the implied yieldon the Group’s Senior Notes, and a cost of equity for each country.
Cash flow projections during the budget period are based on the same expected gross margins and raw materials price inflation throughout thebudget period. The cash flows beyond that five–year period have been extrapolated using a steady 2.0% per annum growth rate (2018: 2.0%).
In the case of the Australia commercial and retail fuels business CGU, classified as held for sale, the recoverable amount has been defined as thefair value less costs to sell, as this amount is lower than the carrying amount. Consequently, we have recognised an impairment loss as per IFRS5.20on the difference between the fair value less costs to sell (calculated as per our sale agreement with the buyer and costs to sale estimations) and thecarrying amount we had at the reporting date. The impairment was fully applied to goodwill for US$ 412.1 million.
16.1 Key assumptions used in value in use calculationsGross profits – Gross profits are based on average values achieved in the three years preceding the start of the budget period, adjusted for any newinvestments or change in market dynamics. These are volume–driven and are increased over the budget period according to the expected grossdomestic product growth and applicable local petroleum regulations of each country where the units operates.
Discount rates – Discount rates represent the current market assessment of the risks specific to each CGU, regarding the time value of money andindividual risks of the underlying assets that have not been incorporated in the cash flow estimates. The discount rate calculation is based on thespecific circumstances of the Group and its operating segments and derived from its weighted average cost of capital. The weighted average cost ofcapital takes into account both debt and equity. The cost of equity is derived from the expected return on investment by the Group’s investors. The costof debt is based on its Interest-bearing loans and borrowings that the Group is obliged to service. Segment–specific risk is incorporated by applyingindividual beta factors. The beta factors are evaluated annually based on management’s knowledge of the particular markets in which it operates.
Petroleum product prices – Forecasted commodity prices are publicly available.
Market share assumptions – These assumptions are important because, as well as using industry data for growth rates (as noted below), managementassesses how the unit’s position, relative to its competitors, might change over the budget period. Management expects the Group’s share of thepetroleum product market to be stable over the budget period.
Growth rate estimates – Rates are based on management’s estimates.
16.2 Sensitivity to changes in assumptionsWith regard to the assessment of value-in-use of the midstream and downstream units, management believes that no reasonably possible change inany of the above key assumptions would cause the carrying value of the unit to materially exceed its recoverable amount.
A reduction by 10% of the cash flows from the current level expected or an increase of the WACC by 2% in the impairment testing would lead to adiscounted cash flow level below net book value in Colombia, Ghana, Puerto Rico and South Africa. For the CGUs in the other countries such areduction in cash flows would not trigger a need for impairment.

FINANCIAL STATEMENTSNOTES TO THE CONSOLIDATED FINANCIAL STATEMENTS CONTINUED
17. Inventoriesin US$’000 2019 2018Petroleum inventories at fair value(i) 468,506 204,770Petroleum product inventories at lower of cost and net realisable value, net 545,246 689,696Merchandise inventories, net 8,423 15,196Total inventories, net 1,022,175 909,662(i) As indicated in Note 2.3.l, inventories held for trading purposes are stated at fair value less costs to sell and any changes in net fair value are recognised in profit or loss. Certain of
the Group’s subsidiaries engage in commodity trading activities for which the exemption stipulated in IAS 2 Inventories for commodity broker–traders applies. Trading activitiesundertaken include optimisation of the Group’s supply cycle and the supply of petroleum products to business–to–business and wholesale clients.
The cost of inventories recognised in cost of sales in 2019 amounted to US$13,134 million (2018: US$16,135 million). Out of the total net inventoriesheld US$ 22.2 million have been pledged at 31 December 2019 (2018: US$ 130.6 million).
18. Other financial assetsin US$’000 2019 2018Financial assets carried at fair value through profit or loss(i) 47,732 106,972Finance lease receivable(ii) 2,652 3,255Loans to other entities(iii) 52,658 43,057Financial assets (equity) at fair value through OCI(iv) 16,287 18,933Other financial assets(v) 1,713 5,440Total other financial assets 121,042 177,657Of which due from related parties (Note 28) 34,124 23,794
Current 31,587 89,018Non-current 89,455 88,639
121,042 177,657(i) All held for trading derivatives are swaps and commodity futures. Besides trading derivatives the account also includes a bond held in Angola and an equity instrument in Senegal.(ii) The Group has a finance lease arrangement for petroleum storage equipment.(iii) The Group makes a limited number of loans to third and related parties. Management believes that none of these loans should be impaired however they are subject to loss
provisions in line with IFRS 9.(iv) Includes the investment in APN Retail Property Fund in Australia.(v) Includes the investment in a storage company, and debt securities.
19. Other assetsin US$’000 2019 2018Prepayments, deposits and guarantees(i) 88,666 152,363Other tax receivables(ii) 236,951 269,694Other receivables 117,190 85,956Total other assets 442,807 508,013Of which due from related parties (Note 28) 56,534 7,278
Current 341,684 386,294Non-current 101,123 121,719
442,807 508,013(i) Prepayments, deposits and guarantees mainly include payments made for the purchase of equipment and construction materials, capital expenditure prepayments, as well as other
guarantees and deposits.(ii) Other tax receivables include non–income tax related items such as VAT and petroleum tax receivables.

20. Trade receivablesTrade and other accounts receivable include the short-term portion of trade accounts receivable and related accounts.in US$’000 2019 2018Trade receivables 619,724 834,252Of which due from related parties (Note 28) 149,118 267,031
Trade receivables are non–Interest-bearing and are generally on cash to 30 day terms. At year–end Group days of sales outstanding amounted to 12.4days (2018: 12.3 days).
The impairment recognised represents the difference between the carrying amount of the trade receivables and the present value of theexpected proceeds. The Group does not hold any collateral over these balances. As illustrated below, there were no significant movements in theallowance for impairment of receivables (see credit risk disclosure in Note 30.3 for further guidance).
The movement in the allowance for doubtful debts was as follows:in US$’000 2019 2018Balance at beginning of the year (18,864) (15,212)Impairment losses recognised on receivables(i) (2,439) (9,226)Amounts written off during the year as uncollectible 920 (394)Amounts recovered during the year 514 3,774Disposal of subsidiary (635) 538Foreign exchange translation gains and (losses), other 128 1,341Balance at end of the year (20,376) (19,179)
(i) Includes additional provision of US$ 1.1million (2018: US$2.1 million) recorded, to reflect expected credit losses, in accordance with IFRS 9.
Set out below is the information about the credit risk exposure on the Group’s trade receivables and contract assets using a provision matrix at 31December, in line with IFRS 9:
At 31 December 2019 – in US$’000 Total CurrentDays past due
< 90 days 90 -180 days(i) 180 – 360 days >360 daysExpected credit loss rate – – – – 35% 70%Gross carrying amount 485,058 375,615 81,631 6,810 9,887 11,115Expected credit loss (11,241) – – – (3,460) (7,781)
At 31 December 2018 – in US$’000 Total CurrentDays past due
< 90 days 90 -180 days(i) 180 – 360 days >360 daysExpected credit loss rate – – – – 35% 70%Gross carrying amount 586,400 487,639 78,236 4,527 2,943 13,055Expected credit loss (10,169) – – – (1,030) (9,139)
(ii) No provision has been recorded on receivables due between 90 and 180 days. Based on past experience, the Group has grounds to believe that these receivables should not beimpaired.
Receivables from related parties are neither past due nor impaired and are therefore excluded from the table above.
At 31 December, the ageing analysis of trade receivables from third parties (net of allowance for doubtful debts) was as follows:
in US$’000 TotalNeither past due nor
impairedPast due but not impaired
< 90 days 90 -180 days 180 – 360 days >360 days2019 470,516 390,236 65,659 14,621 – –2018 567,221 482,164 78,595 4,946 1,516 –
20.1 Receivables sold without recourseAt 31 December 2019, trade receivables of US$283.7 million (2018: US$297.1 million), related to the United Kingdom, Australia, Guatemala and ouraviation operations had been sold without recourse.
21. Cash and cash equivalentsin US$’000 2019 2018Cash at banks and on hand 388,108 441,721Restricted cash 5,418 5,803Short-term deposits 225,497 196,972Cash and short-term deposits 619,023 644,496
Cash at banks earns interest at floating rates based on daily bank deposit rates. Short-term deposits are made for varying periods of between one dayand three months, depending on the immediate cash requirements of the Group, and earn interest at the respective short-term deposit rates.

FINANCIAL STATEMENTSNOTES TO THE CONSOLIDATED FINANCIAL STATEMENTS CONTINUED
22. Capital and reservesShares 2019 2018Registered share capital(i)
107,198,551 ordinary shares 356,869 351,0001 share for Trafigura PE Holding Limited of US$830,967 thousand 830,967 830,9671 share for Sonangol Holdings Lda of US$510,950 thousand 510,950 510,9501 share for Cochan Holdings LLC of US$255,475 thousand 255,475 255,4751 share for PE Investments Limited of US$105,774 thousand 105,774 105,774Total share capital 2,060,035 2,054,166(i) At 31 December 2019, the Group had 107,198,555 shares issued.
23. Interest-bearing loans and borrowingsin US$’000 2019 2018Unsecured – at amortised costSenior notes(i) 1,576,168 1,605,497Bank overdrafts 98,783 167,705Obligations under finance leases 52 478Accrued interest 37,324 39,280Unsecured bank loans(ii) 1,272,949 1,431,472Related parties 16,155 1,192
3,001,431 3,245,624Secured – at amortised costSecured bank loans(ii)(iii) 8,236 39,711
8,236 39,711Total Interest-bearing loans and borrowings 3,009,667 3,285,335Of which due to related parties (Note 28) 16,630 1,192
Current 284,733 457,032Non-current 2,724,934 2,828,303
3,009,667 3,285,335(i) Includes US$ 600 million of 5.125% Senior Notes maturing in 2024, US$ 750 million of 5% Senior Notes maturing in 2026, a 2.65% private placement of EUR 200 million,
repayable in instalments and maturing in 2024, and a 5.87% private placement of US$ 100 million, maturing in 2023.(ii) Secured and unsecured bank loans consist of fixed and floating rate loans, for which the weighted average effective interest rate (including arrangement fees) was 6.7% for the year
ended 31 December 2019 and 5.6% for the year ended 31 December 2018. The Group economically hedges a portion of the loans for interest rate risk via an interest rate swap,exchanging variable rate interest for fixed rate interest. The fair value of Interest-bearing loans and borrowings for disclosure purposes is based on quoted prices in an active marketfor similar liabilities. These financial instruments are fair valued, based on Level 2 measurement.
(iii) Bank loans are secured by mortgages over certain of the Group’s assets (mainly inventories, qualifying receivables, shares of certain subsidiaries and other long-term assets). Thetotal value of the pledged assets at 31 December 2019 was US$156.3 million (2018: US$303 million).
Loan maturity schedule
in US$’000 2019 2018Not later than one year 284,733 457,032Later than one year and not later than five years 1,974,934 1,440,166Later than five years 750,000 1,388,137Total Interest-bearing loans and borrowings 3,009,667 3,285,335
In addition to the aforementioned debt facilities, the Group entered into a US$1.5 billion loan with Trafigura Pte Ltd. This loan was not drawn at 31December 2019 and 2018, and consists of a US$500 million committed revolving credit facility and a US$1.0 billion uncommitted revolving credit facility.This loan is not secured and bears interest of 8.0% per annum (2018: 8.1% per annum). The loan will mature on September 2023.
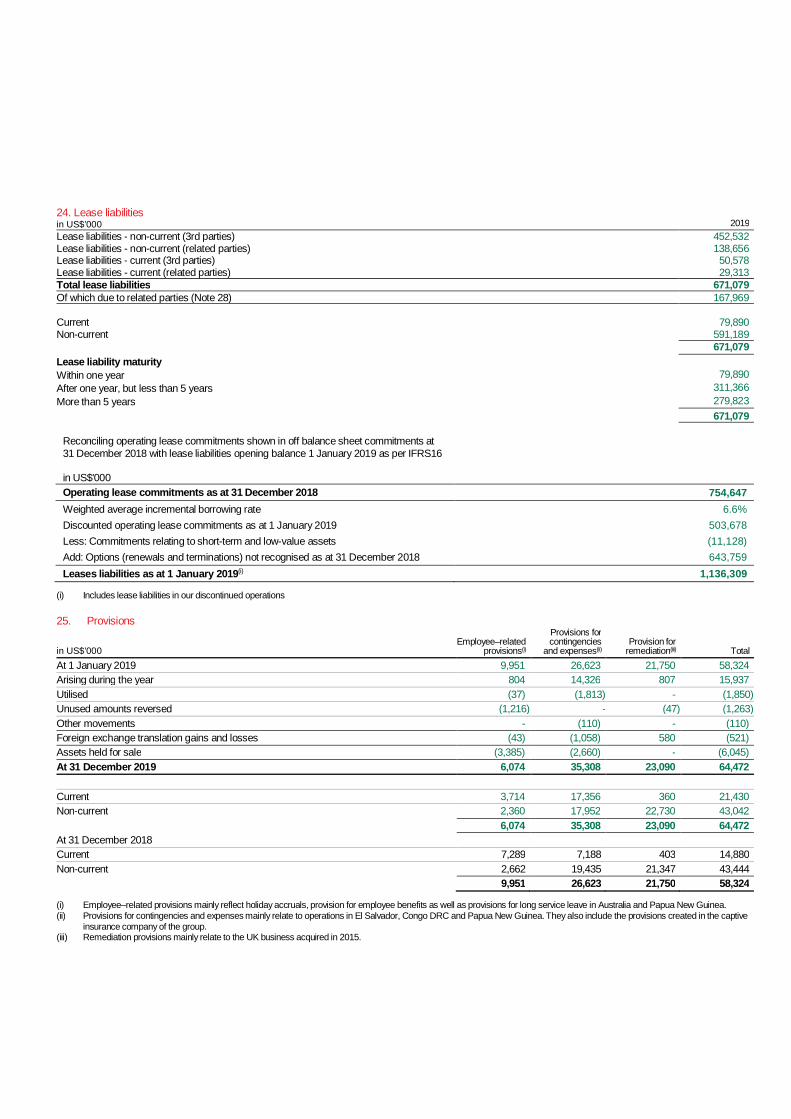
24. Lease liabilitiesin US$’000 2019Lease liabilities - non-current (3rd parties) 452,532Lease liabilities - non-current (related parties) 138,656Lease liabilities - current (3rd parties) 50,578Lease liabilities - current (related parties) 29,313Total lease liabilities 671,079Of which due to related parties (Note 28) 167,969
Current 79,890Non-current 591,189
671,079Lease liability maturityWithin one year 79,890After one year, but less than 5 years 311,366More than 5 years 279,823
671,079
Reconciling operating lease commitments shown in off balance sheet commitments at31 December 2018 with lease liabilities opening balance 1 January 2019 as per IFRS16
in US$'000Operating lease commitments as at 31 December 2018 754,647Weighted average incremental borrowing rate 6.6%Discounted operating lease commitments as at 1 January 2019 503,678Less: Commitments relating to short-term and low-value assets (11,128)Add: Options (renewals and terminations) not recognised as at 31 December 2018 643,759Leases liabilities as at 1 January 2019(i) 1,136,309
(i) Includes lease liabilities in our discontinued operations
25. Provisions
in US$’000Employee–related
provisions(i)
Provisions forcontingencies
and expenses(ii)Provision for
remediation(iii) TotalAt 1 January 2019 9,951 26,623 21,750 58,324Arising during the year 804 14,326 807 15,937Utilised (37) (1,813) - (1,850)Unused amounts reversed (1,216) - (47) (1,263)Other movements - (110) - (110)Foreign exchange translation gains and losses (43) (1,058) 580 (521)Assets held for sale (3,385) (2,660) - (6,045)At 31 December 2019 6,074 35,308 23,090 64,472
Current 3,714 17,356 360 21,430Non-current 2,360 17,952 22,730 43,042
6,074 35,308 23,090 64,472At 31 December 2018Current 7,289 7,188 403 14,880Non-current 2,662 19,435 21,347 43,444
9,951 26,623 21,750 58,324
(i) Employee–related provisions mainly reflect holiday accruals, provision for employee benefits as well as provisions for long service leave in Australia and Papua New Guinea.(ii) Provisions for contingencies and expenses mainly relate to operations in El Salvador, Congo DRC and Papua New Guinea. They also include the provisions created in the captive
insurance company of the group.(iii) Remediation provisions mainly relate to the UK business acquired in 2015.

FINANCIAL STATEMENTSNOTES TO THE CONSOLIDATED FINANCIAL STATEMENTS CONTINUED
26. Other financial liabilitiesin US$’000 2019 2018Financial liabilities carried at fair value through profit or loss(i) 57,860 10,749Vendor loan – third parties(ii) 352 30,469Other liabilities 4,176 9,684Total other financial liabilities 62,388 50,902Of which due to related parties (Note 28) – –
Current 57,860 40,799Non-current 4,528 10,103
62,388 50,902(i) Derivative positions include commodity futures, commodity swaps and interest rate swaps used to economically hedge certain of the Group’s financial risks. A substantial portion of
the derivatives are transacted with Trafigura Pte Ltd and Trafigura Derivatives Ltd.(ii) In 2018 it included a vendor loan granted for capex payables related to the Matola terminal in Mozambique. This has been repaid in 2019.
27. Trade and other payablesin US$’000 2019 2018Trade payables 2,263,859 2,204,870Other payables and accrued liabilities 208,181 211,056Other liabilities(i) 147,403 182,947Total trade and other payables 2,619,443 2,598,873Of which due to related parties (Note 28) 1,615,267 1,725,799(i) Other current liabilities include mainly tax, social security and VAT payables.
Terms and conditions of the above liabilities:– Trade payables are generally non–interest–bearing.– Interest payable is normally settled on a monthly basis throughout the financial year.
28. Related parties disclosuresBalances and transactions between the Company and its subsidiaries have been eliminated on consolidation and are not disclosed in this note. Detailsof transactions between the Group and other related parties are disclosed below.
Related parties not part of the Group include the following:% equity interest in the Group
Entity name Country of incorporation 2019 2018Trafigura PE Holding Limited Malta 49.42% 49.41%Sonangol Holdings Lda Angola 27.99% 27.99%Cochan Holdings LLC Marshall Islands 15.48% 15.48%PE Investments Limited Malta 5.86% 5.86%Global PE Investors PLC Malta 0.22% 0.22%PE SPV Limited Malta 0.45% 0.56%PE ESP LLC Marshall Islands 0.58% 0.48%

28.1 Related party transactionsGroup entities entered into the following transactions with related parties that are not members of the Group:
Sales and finance incomerelated parties
Purchases, management fees andfinance cost
related partiesin US$’000 2019 2018 restated 2019 2018 restatedTrafigura Group 777,589 903,804 (6,979,748) (8,684,069)Sonangol Group 2,054 12,029 (370,994) (584,739)Others 131,593 208,362 (9,626) (6,538)Total 911,236 1,124,195 (7,360,368) (9,275,346)
Amounts owed byrelated parties(i)
Amounts owed torelated parties(ii)
in US$’000 2019 2018 2019 2018Trafigura Group 146,402 240,932 (1,745,668) (1,647,220)Sonangol Group 209 3,605 (35,462) (75,803)Others 93,165 53,566 (18,736) (3,968)Total 239,776 298,103 (1,799,866) (1,726,991)(i) Includes trade and other receivables, loans to related parties and other assets.(ii) Includes trade and other payables, lease liabilities, and loans from related parties.
In addition to the above transactions and balances, a substantial portion of the Group’s derivatives are transacted with Trafigura Pte Ltd and TrafiguraDerivatives Ltd. The fair value of derivatives contracted with Trafigura Pte Ltd and Trafigura Derivatives Ltd amounted to US$(37.4) million at 31December 2019 (2018: US$70.9 million).
28.2 Related party loansThe Group has acquired, by virtue of its various acquisitions, certain legacy loans made to employees of acquired entities. These loans are, individually and inaggregate, immaterial to the Group. Furthermore, the Group entered into a US$1.5 billion loan with Trafigura Pte Ltd, which was not drawn at 31 December2019 and 2018. This loan is not secured, and bears interest of 8.0% per annum (2018: 8.1% per annum) and is meant to support the Group in its investmentactivities.
28.3 Key management personnel compensationKey management personnel compensation amounted to US$11.7 million in 2019 (2018: US$7.6 million).
29. Commitments and contingenciesOff balance sheet commitments:in US$’000 2019 2018Storage and land rental(i) 1,690 754,647Assets under construction 8,484 5,712Supply contract 429 -Other commitments 81,148 46,454Total 91,751 806,813
in US$’000 2019 2018Within one year 90,596 144,181After one year but not more than five years 251 244,904More than five years 904 417,728Total 91,751 806,813
Contingent liabilities:in US$’000 2019 2018Letters of credit(ii) 618,074 504,423Guarantees(iii) 100,748 58,675Legal and other claims(iv) 53,410 76,403Total 772,232 639,501(i) The significant reduction versus prior year is related to the implementation of IFRS16 as lease contracts are now accounted for on the balance sheet.(ii) The Group utilises standby letters of credit and documentary credits, where appropriate, where certain of the Group suppliers or underwriting banks require such facilities to be put in
place.(iii) Guarantees issued by the Group are mostly related to performance bonds for performance on specific contracts. No liability is expected to arise from these guarantees.(iv) Legal and other claims includes existing legal cases for which the Group believes no further charge will arise in the future as the Group believes it has the legal grounds to eventually
conclude the cases favourably.
Excluded from the contingent liabilities listed above are those mortgages and assets pledged as collateral on certain financing transactions. Theseitems are disclosed in Note 13.

FINANCIAL STATEMENTSNOTES TO THE CONSOLIDATED FINANCIAL STATEMENTS CONTINUED
30. Financial risk management objectives and policiesThe Group Executive Committee oversees the management of financial risks and reviews and agrees policies for managing these risks, which aredefined in the Group Risk Management Framework. The Group Risk Management Framework is a comprehensive management tool utilised by theGroup Executive Committee to assess potential risks facing the Group. With the support of the Group internal audit team, the Group Risk ManagementFramework provides a context through which the Group is able to continuously monitor external risks. The Group Risk Management Framework isreviewed on a quarterly basis by the Group Executive Committee.
The Group is primarily a Midstream and Downstream business with a strong risk management philosophy. The Group manages its exposure tokey financial risks in accordance with the Group Risk Management Framework. The objective of the policy is to support the delivery of the Group’sfinancial targets while protecting future financial security. The main risks that could adversely affect the Group’s financial assets, liabilities or future cashflows are: market risks, comprising commodity price risk, cash flow interest rate risk and foreign currency risk; liquidity risk; and credit risk. As a rule,commodity price risk relating to the physical supply activities is systematically economically hedged, with the support of Trafigura Pte Ltd and TrafiguraDerivatives Ltd. All derivative activities for risk management purposes are carried out by specialist teams that have the appropriate skills, experienceand supervision.
It is the Group’s policy that no trading in derivatives for speculative purposes shall be undertaken as all derivative transactions are entered into forthe purpose of managing the Group’s physical inventory exposure. At this stage, the Group does not currently apply any form of hedge accounting.
Furthermore, the Group, through the Group Risk Management Framework, has established conservative consolidated risk limits and closelymonitors the Group’s risk positions to ensure that the Group’s risk exposure remains well within these limits.
30.1 Market riskThe Group operates in various national markets where petroleum prices are predominantly regulated and, therefore, in many of its markets it haslimited market risk in terms of price exposure. Furthermore, where the Group operates in unregulated markets, the Group is typically able to price itsproducts so as to reflect increases or decreases in market prices on a timely basis and thereby substantially mitigate its price exposure. Despite theGroup selling into markets where price exposure is largely mitigated, the Group does economically hedge its physical supply. The primary purpose ofthe economic hedging activities is to protect the Group against the risk of physical supply transactions being adversely affected by changes incommodity prices. The Group systematically enters into economic hedging contracts to cover price exposures in its physical supply activities. Inparticular, substantially all supply stock is at all times either pre–sold or the commodity index price risk is economically hedged. By virtue of the nature ofthe markets in which the Group operates and given the economic hedging conducted in the Group’s supply activities as per the Group RiskManagement Framework, the Group faces limited market risk.
The following table provides an overview of the derivative contracts at the year–end. All commodity derivatives had maturities of less than oneyear at each year–end.
Fair value of derivativesin US$’000 2019 2018Commodity futures and swaps (37,372) 70,909Currency swaps (2,295) 5,118Total (39,667) 76,027
Currency riskThe Group has exposures to foreign currency risk on its activities, and movements in currency exchange rates may have a material negative effect onour financial condition and result of operations. The Group reduces its exposure to changes in foreign currency exchange rates by borrowing in localcurrencies and entering into currency hedges.
The Group does not use financial instruments to hedge the translation risk related to equity and earnings of foreign subsidiaries and non–consolidated companies. Refer to the consolidated statement of changes in equity to see the impact of changes in foreign currencies on the Group’sequity.Interest rate riskInterest rate risk of the Group is mainly applicable on the long-term funding of the Group. Please refer to the comments below for further details on theGroup’s funding. The Group has entered into certain interest rate swap transactions in order to limit its exposure to floating interest rates.
The following table demonstrates the sensitivity to a reasonably possible change in interest rates, with all other variables held constant, of theGroup’s profit before tax through the impact on floating rate Interest-bearing loans and borrowings and cash and cash equivalents. The impact onequity is the same as the impact on profit before tax.
Effect on profit beforetax for the year ended
in US$’000 2019 2018+ 1.0 percentage point (6,626) (9,224)– 1.0 percentage point 6,626 9,224
The carrying amount of all financial assets and liabilities except for Interest-bearing loans and borrowings approximated the estimated fair value, due tothe short-term nature of the financial instruments. The following table summarises the fair value of Interest-bearing loans and borrowings:
Carrying amount Fair valuein US$’000 2019 2018 2019 2018Interest-bearing loans and borrowings(i) 3,009,667 3,285,335 2,484,346 2,823,467Total 3,009,667 3,285,335 2,484,346 2,823,467(i) For the purpose of the above disclosure, fixed rate Interest-bearing loans and borrowing have been discounted using the actual cost of debt of the Group. The fair value of Interest-
bearing loans and borrowings for disclosure purposes is based on quoted prices in an active market for identical liabilities. These financial instruments are based on a Level 2 fairvalue measurement (refer to Note 30.7).

30.2 Liquidity riskThe Group, by virtue of the nature of its operations, has demonstrated a consistent ability to generate cash through its ongoing daily operations. TheGroup generates stable cash flows as the Group’s assets are utilised to deliver an essential product to customers in specific, national markets and theGroup is therefore not entirely exposed to international commodity market movements. At the same time, the Group has the flexibility to decide whetherto invest or not in capital expenditures as its ability to generate cash flows is not bound, in the short term, by significant capital commitments orsignificant mandatorycapital asset maintenance.
Furthermore, the Group monitors its risk to a shortage of funds by monitoring the maturity dates of existing debt. The Group’s objective is tomaintain a balance between continuity of funding and flexibility through the use of bank overdrafts and bank loans.At 31 December 2019, the Group had US$1,089 million (2018: US$1,117 million) of undrawn committed borrowing facilities. In addition,the Group had US$500 million of undrawn committed shareholder loans.
9% of the Group’s debt will mature in less than one year at 31 December 2019 (2018: 14%) based on the balances reflected in the consolidatedfinancial statements. The maturity profile of the Group’s debt is summarised in Note 23 and below. The Group liquidityrisk is further mitigated as a large part of the borrowing activities of the Group are related to the financing of petroleum stocks andby their nature, these stocks are easily convertible into cash.
The table below summarises the maturity profile of the Group’s financial liabilities based on non–discounted contractual payments:
in US$’000Less than
1 year 1–5 years 5+ years TotalAt 31 December 2019:Interest-bearing loans and borrowings 415,659 2,325,534 768,750 3,509,943Trade and other payables 2,619,443 - - 2,619,443Financial derivatives 57,860 - - 57,860Other financial liabilities - 4,528 - 4,528Total 3,092,962 2,330,062 768,750 6,191,774
At 31 December 2018:Interest-bearing loans and borrowings 609,018 1,857,721 1,479,370 3,946,109Trade and other payables 2,598,873 - - 2,598,873Financial derivatives 10,749 - - 10,749Other financial liabilities 30,050 10,103 - 40,153Total 3,248,690 1,867,824 1,479,370 6,595,884
30.3 Credit riskThe Group has a formalised credit process, with credit officers in the key locations around the world. Strict credit limits are established for eachcounterparty on the basis of detailed financial and business analyses. These limits are constantly monitored and revised in light of counterparty ormarket developments and the amount of exposure relative to the size of the Group’s consolidated statement of financial position. The Group conductstransactions with the following major types of counterparties:
– Physical commodity counterparties spread across the vertical chains for oil (e.g. resellers and end–users). Sales to counterpartiesare made on open terms up to internally approved credit limits. Exposures above such limits are subject to independentpayment guarantees.
– Payment guarantee counterparties (e.g. prime financial institutions from which the Group obtains payment guarantees).
The Group is present in different geographic regions. Wherever appropriate, guarantees, insurance and letters of credit are used to reduce payment orperformance risk. The Group’s maximum exposure to credit risk is equivalent to the amounts of financial assets presented in the consolidatedstatement of financial position. The Group has no significant concentrations of credit risk and no single customer accounts for more than 3% of theGroup’s sales volumes. In addition, a significant part of the activity of the Group’s Downstream business (mainly retail sites) is on a cash or prepaymentbasis.
Refer to Note 20 for an ageing analysis of trade receivables.
30.4 Operational riskThe operations department has representatives in key locations around the world and is responsible for a number of tasks including contract insuranceand logistics management. The operations department is also responsible for ensuring that industry, environmental safety, and internal policies andprocedures are complied with at all times. Detailed procedures manuals are implemented throughout the Group and all operations personnel receiveregular and adequate training covering the relevant subjects according to their specific functions within the operating activities of the Group. Thisensures that operations staff are kept up to date with all applicable procedural, legal, regulatory and industry changes.
The Group, when chartering vessels, applies a strict vessel vetting procedure that complements insurance requirements and focuses on thevessel age, classification, protection, indemnity and pollution insurance cover. Similar vetting procedures are also applied for both rail, car and truckmovements. The Group also has a storage procedure which involves full due diligence being undertaken of every proposed storage location – includinga site visit to the storage location, the tank or warehouse. Regular stock analysis is undertaken to avoid losses such as theft and contamination, andeach approved location is checked annually to evaluatethe ongoing situation.
By virtue of the Group’s relationship with its significant shareholder, Trafigura PE Holding Limited, the Group does have a risk of supplierconcentration as the Trafigura group of companies accounts for around 53% (2018: 70%) of all purchases made by the Group.

FINANCIAL STATEMENTSNOTES TO THE CONSOLIDATED FINANCIAL STATEMENTS CONTINUED
30.5 Capital managementThe primary objective of the Group’s capital management is to ensure that it maintains a strong capital structure and healthy capital ratios in order tosupport its business and maximise shareholder value.
The Group manages its capital structure and makes adjustments to it in light of changes in economic conditions in orderto ensure a sound capital structure.
30.6 Changes in liabilities arising from financing activitiesin US$’000 Financial debt(i) Finance leases Vendor loans Dividends TotalAt 1 January 2018 3,535,426 525 30,655 10,251 3,576,857Cash flows (426,936) (15) 527 (17,262) (443,686)Non-cash movement (5,921) - - - (5,921)Acquisitions/Disposals (11,036) - - - (11,036)Interest expense 241,299 - - - 241,299Dividends declared during the year - - - 7,011 7,011New leases - 18 - - 18FX movements (47,975) (50) (713) - (48,738)At 31 December 2018 3,284,857 478 30,469 - 3,315,804Cash flows (500,726) (329) (29,281) (5,998) (536,334)Non-cash movement (558) - - - (558)Acquisitions/Disposals (1,035) - - - (1,035)Interest expense 237,749 - - - 237,749Dividends declared during the year - - - 5,998 5,998New leases - 3 - - 3FX movements (10,551) (11) (836) - (11,398)Reclassification - (89) - (89)Less: discontinued operations (69) - - - (69)At 31 December 2019 3,009,667 52 352 - 3,010,071
(i) For the purpose of the above disclosure, current and non-current Interest-bearing loans and borrowings have been grouped together.
At 31 December 2019 the balance sheet of the group discloses also US$ 671.1 of lease liabilities. These lease liabilities have been taken onto the balance sheet as a result of the IFRS16implementation.
30.7 Fair value hierarchyThe Group uses the following hierarchy for determining and disclosing the fair value of financial instruments, which are measuredat fair value by valuation technique:
– Level 1: Quoted (unadjusted) prices in active markets for identical assets or liabilities.– Level 2: Other techniques for which all inputs which have a significant effect on the recorded fair value are observable,
either directly or indirectly.– Level 3: Techniques that use inputs that have a significant effect on the recorded fair value that are not based on
observable market data.
All financial assets and liabilities, and inventories measured at fair value, at 31 December 2019 and 2018, fall under the Level 2 category describedabove, and include financial derivatives for a net amount of US$(39.7) million (2018: US$76.0 million) and inventories for US$468.5 million (2018:$204.8 million). There have been no transfers between fair value levels during any of the reporting periods.
31. Events after the reporting period
Sale of stake in EmoilIn February 2020 the Group announced the divestment of its 20% stake in Emoil Petroleum Storage FZCO (United Arab Emirates) to Emaret. Thetransaction is expected to complete before the end of the first quarter of 2020.
Shareholder restructuringOn 2nd March 2020, Puma Energy Holdings Pte Ltd has agreed to a shareholding restructuring transaction whereby Cochan Holdings shareholding isreduced to less than 5%. The transaction is subject to receipt of regulatory approval and will be implemented by a buyback of shares from Trafigura PteLtd. This follows an equivalent purchase by Trafigura Pte Ltd of Puma Energy’s shares from Cochan Holdings. The re-purchase by Puma Energy willbe funded by a subordinated shareholder loan from Trafigura Pte Ltd of around US$390 million with an initial tenor of seven years.

32. Significant consolidated subsidiaries and participating interestsThe consolidated financial statements for the year ended 31 December 2019 include the Company’s financial statements and those of the followingoperating entities listed in the table below:
Proportion of ownership interest heldby the Group at 31 December for the
year endedName of subsidiary Place of incorporation 2019 2018 Legal relationshipPuma Energy Holdings Pte Ltd Singapore 100% 100% Parent companyPuma Energy Pakistan (Private) Ltd (Admore) Pakistan 51% 51% SubsidiaryAlexela Slovag AS Norway 95% 95% SubsidiaryAngobetumes Lda Angola 100% 100% SubsidiaryAS Alexela Logistics Estonia 95% 95% SubsidiaryAS Alexela Sillamäe Estonia 95% 95% SubsidiaryAS Alexela Terminal Estonia 95% 95% SubsidiaryBitumen Storage Services (WA) Pty Ltd (Australia) Australia 50% 50% Equity investmentCentral Combined Group Pty Ltd Australia 100% 100% SubsidiaryComercial el Hogar SA Honduras 100% 100% SubsidiaryDirecthaul Pty Ltd Australia 100% 100% SubsidiaryDP Drakensberg Properties Pty Ltd South Africa 100% 100% SubsidiaryDrakensberg Oil Pty Ltd South Africa 100% 100% SubsidiaryEmoil Petroleum Storage FZCO United Arab Emirates 20% 20% Equity investmentEmpresa Cubana de Gas Cuba 50% 50% Equity investmentFuel Distributors of Western Australia Pty Ltd Australia 50% 50% Equity investmentGulf Refining Company NV Curaçao 64% 64% SubsidiaryHigh Heat Tankers Pte Ltd Singapore 50% 50% Equity investmentHull Ocean Going Barges UK Ltd United Kingdom 100% 100% SubsidiaryKpone Marine Services Ltd Ghana 100% 100% Subsidiary
Mazen Global Insurance LtdFederal Territory of
Labuan 100% 100% SubsidiaryNational Energy Puma Aviation Services Co Ltd(i) Myanmar 34% 49% SubsidiaryNeumann Petroleum Pty Ltd Australia 100% 100% SubsidiaryOil Malal SA Chile 33% 33% Equity investmentPC Puerto Rico LLC Puerto Rico 100% 100% SubsidiaryPE Bitumen Resources Nigeria Ltd Nigeria 60% 60% SubsidiaryPE Petroleum Cote d’Ivoire SA Ivory Coast 56% 56% SubsidiaryPE Swaziland (Pty) Ltd Swaziland 100% 100% SubsidiaryPE Tanzania Services Assets Ltd Tanzania 100% 100% SubsidiaryPervyi Murmanskiy Terminal(i) Russia 47% 47% SubsidiaryPetrobeira Lda(ii) Mozambique 49% 49% SubsidiaryPT Puma Energy Indonesia Indonesia 0% 100% SubsidiaryPuma El Salvador SA de CV El Salvador 100% 100% SubsidiaryPuma Energia España SLU Spain 100% 100% SubsidiaryPuma Energy (Australia) Bitumen Pty Ltd Australia 100% 100% SubsidiaryPuma Energy (Australia) Fuels Pty Ltd Australia 100% 100% SubsidiaryPuma Energy (Aviation) SA Switzerland 100% 100% SubsidiaryPuma Energy (Malaysia) Sdn Bhd Malaysia 100% 100% SubsidiaryPuma Energy (Moçambique) Lda Mozambique 100% 100% SubsidiaryPuma Energy (Namibia) (Pty) Ltd Namibia 100% 100% SubsidiaryPuma Energy (Singapore) Pte Ltd Singapore 100% 100% SubsidiaryPuma Energy (UK) Ltd United Kingdom 100% 100% SubsidiaryPuma Energy Asia Sun Co Limited Myanmar 80% 80% SubsidiaryPuma Energy Asia Supply Company SA Panama 0% 100% SubsidiaryPuma Energy Bahamas SA Bahamas 100% 100% SubsidiaryPuma Energy Belfast Ltd United Kingdom 50% 50% Equity investmentPuma Energy Benin SA Benin 100% 100% SubsidiaryPuma Energy Bitumen (Vietnam) Ltd Vietnam 80% 80% SubsidiaryPuma Energy Bitumen Supply SA Panama 100% 100% Subsidiary

FINANCIAL STATEMENTSNOTES TO THE CONSOLIDATED FINANCIAL STATEMENTS CONTINUED
32. Significant consolidated subsidiaries and participating interests continuedProportion of ownership interest heldby the Group at 31 December for the
year endedName of subsidiary Place of incorporation 2019 2018 Legal relationshipPuma Energy Botswana (Pty) Ltd Botswana 80% 80% SubsidiaryPuma Energy Caribe LLC Puerto Rico 100% 100% SubsidiaryPuma Energy Colombia Combustibles SAS Colombia 100% 100% SubsidiaryPuma Energy Colombia Holdings AG Switzerland 100% 100% SubsidiaryPuma Energy Cote d’Ivoire SA Ivory Coast 75% 75% SubsidiaryPuma Energy Distribution Benin SA Benin 100% 100% SubsidiaryPuma Energy Distribution Côte d’Ivoire Sarl Ivory Coast 70% 70% SubsidiaryPuma Energy Guatemala SA Guatemala 100% 100% SubsidiaryPuma Energy Honduras SA de CV Honduras 100% 100% SubsidiaryPuma Energy International BV, Geneva Branch Netherlands 100% 100% BranchPuma Energy International SA Switzerland 100% 100% SubsidiaryPuma Energy Irrawaddy Pte Ltd Singapore 100% 100% SubsidiaryPuma Energy Johannesburg Supply SA Panama 100% 100% SubsidiaryPuma Energy LS (Pty) Ltd Lesotho 100% 100% SubsidiaryPuma Energy Ltd (FZE) Nigeria 100% 100% SubsidiaryPuma Energy Luxembourg Sàrl Luxembourg 100% 100% SubsidiaryPuma Energy (Malawi) Ltd(ii) Malawi 50% 50% SubsidiaryPuma Energy Panama Supply SA Panama 0% 100% SubsidiaryPuma Energy Paraguay SA Paraguay 0% 100% SubsidiaryPuma Energy PNG Ltd Papua New Guinea 100% 100% SubsidiaryPuma Energy PNG Refining Ltd Papua New Guinea 100% 100% SubsidiaryPuma Energy PNG Supply Ltd Cayman Islands 100% 100% SubsidiaryPuma Energy Senegal SA Senegal 80% 80% SubsidiaryPuma Energy Services (Singapore) Pte Ltd Singapore 100% 100% SubsidiaryPuma Energy Services South Africa (Pty) Ltd South Africa 100% 100% SubsidiaryPuma Energy South Africa (Pty) Ltd South Africa 100% 100% SubsidiaryPuma Energy Supply & Trading Pte Ltd Singapore 100% 100% SubsidiaryPuma Energy Tanzania Ltd(ii) Tanzania 50% 50% SubsidiaryPuma Energy Zambia PLC Zambia 75% 76% SubsidiaryPuma International Congo SA Congo 100% 100% SubsidiaryPuma International Financing SA Luxembourg 100% 100% SubsidiaryPuma Overseas Projects Pte Ltd Singapore 100% 100% SubsidiaryPumangol Industrial Lda Angola 100% 100% SubsidiaryPumangol Lda Angola 100% 100% SubsidiaryRAM Petroleum (Pvt) Ltd Zimbabwe 48% 48% Equity investmentRedan Petroleum (Pvt) Ltd Zimbabwe 60% 60% SubsidiaryRefineria Petrolera de Acajutla SA de CV El Salvador 100% 100% SubsidiaryRutile Investments Ltd Mauritius 100% 100% SubsidiarySakunda Petroleum (Pvt) Ltd Zimbabwe 49% 49% Equity investmentTema Offshore Mooring Ltd Ghana 100% 100% SubsidiaryTotal Lesotho (Pty) Ltd(Lesotho) Lesotho 100% 100% SubsidiaryTropifuels SA Panama 100% 100% SubsidiaryUBI Group Ltd(ii) Ghana 49% 49% SubsidiaryUltrapar SA Paraguay 0% 100% Subsidiary
Presented below are explanations for those entities that are consolidated despite the Group having less than 50% interest in those entities:(i) The Group retains effective control over these entities, despite the fact that it does not hold clear majority of the shares, by virtue of the fact the Group is exposed to, or has rights to, variable
returns from its involvement with the entities and has the ability to affect those returns through its power over the entities.(ii) Management believes that the Group retains effective control over this entity as a result of there being both a shareholder and an investment agreement stipulating that the Group
has 100% economic control over the entity.
The Group does not have any non-controlling interests exceeding 5% of the Group’s long-term assets or 20% of the Group’s operating profit.
FINANCIAL STATEMENTSINDEPENDENT AUDITOR’S REPORT
Report of the independent auditor with consolidated financial statementsat 31 December 2019 of Puma Energy Holdings Pte Ltd
3 March 2020
OpinionWe have audited the consolidated financial statements of Puma EnergyHoldings Pte Ltd and its subsidiaries (the ‘Group’), which comprise theconsolidated statement of financial position at 31 December 2019 and theconsolidated statement of income, the consolidated statement ofcomprehensive income, the consolidated statement of changes in equity,and the consolidated statement of cash flows for the year then ended, andnotes to the consolidated financial statements, including a summary ofsignificant accounting policies.
In our opinion the accompanying consolidated financial statements give atrue and fair view of the consolidated financial position of the Group at 31December 2019, and its consolidated financial performance and its cashflows for the year then ended in accordance with International FinancialReporting Standards (‘IFRS’).
Basis for opinionWe conducted our audit in accordance with International Standards onAuditing (‘ISA’). Our responsibilities under those provisions and standardsare further described in the Auditor’s responsibilities for the audit of theconsolidated financial statements section of our report.
We are independent of the Group in accordance with the InternationalEthics Standards Board for Accountants’ Code of Ethics for ProfessionalAccountants (‘IESBA Code’) and we have fulfilled our ethicalresponsibilities in accordance with the IESBA Code.
We believe that the audit evidence we have obtained is sufficient andappropriate to provide a basis for our opinion.
Key audit mattersKey audit matters are those matters that, in our professional judgment,were of most significance in our audit of the consolidated financialstatements of the current period. These matters were addressed in thecontext of our audit of the consolidated financial statements as a whole,and in forming our opinion thereon, and we do not provide a separateopinion on these matters. For each matter below, our description of howour audit addressed the matter is provided in that context.
We have fulfilled the responsibilities described in the Auditor’sresponsibilities for the audit of the consolidated financial statementssection of our report, including in relation to these matters. Accordingly,our audit included the performance of procedures designed to respond toour assessment of the risks of material misstatement of the consolidatedfinancial statements. The results of our audit procedures, including theprocedures performed to address the matters below, provide the basis forour audit opinion on the accompanying consolidated financial statements.
Valuation of property and equipment, intangible assetsand goodwillRiskAt 31 December 2019, the Group's balance sheet includes property andequipment amounting to US$2,421m, intangible assets amounting toUS$274m and goodwill amounting to US$333m. The assessment of therecoverable value of these assets for property and equipment and intangibleassets, or of the relevant cash-generating unitfor goodwill, incorporates significant judgement in respect of factors such asgross profits, discount rates, petroleum product prices, market shares andgrowth rates which are affected by expected future market or economicconditions in many different countries.
The Group’s disclosures about property and equipment, intangible assetsand goodwill, are included in Notes 13, 14 and 16 of the consolidatedfinancial statements.
Our audit responseWe performed the following procedures:
We reviewed the Group's calculation of value in use or fair value lesscosts of disposal.
We involved our valuation specialists to evaluate methodologies and keyassumptions, such as cash flow forecasts included in the impairmentassessment for each cash generating unit or asset tested on a stand-alone basis, and discount rate assumptions.
We assessed whether the Group's disclosures about the sensitivity of theoutcome of the impairment assessment to changes in key assumptionsreflected the risks inherent in the valuation.
Our audit procedures did not lead to any material reservations regardingthe impairment testing.
Recoverability of deferred tax assetsRiskAt 31 December 2019, the Group had deferred tax assets on deductibletemporary differences of US$97 million, which were recognized and relateto tax losses carried forward. In addition, there was an amount of US$62million which had not been recognised. The analysis of the recognitionand recoverability of the deferred tax assets was significant to our auditbecause the amounts are material, the assessment process is complexand judgemental and is based on assumptions that are affected byexpected future market or economic conditions.
The Group’s disclosures about deferred tax assets are included in Note 11of the consolidated financial statements.
Our audit responseWe performed the following procedures:
We evaluated the Group’s process for the identification and evaluation ofuncertain tax positions and other tax risks as well as for the assessmentof the recoverability of deferred tax assets.
We also considered the Group’s process for the recording and continuousre-assessment of the related (contingent) liabilities and provisions aswell as deferred taxes.
We reviewed tax exposures estimated by management and the riskanalysis associated with these exposures along with claims orassessments made by tax authorities to date.
We analysed the tax risk provision and the related business tax risks.We reviewed documentation of tax audits and considered whether
exposures raised by the tax authorities have been considered.We analysed these with involvement of our internal tax experts, and
assessed the tax risk provision.We tested the calculation of deferred tax assets and liabilities and
analysed the management estimates relating to the recoverability ofdeferred tax assets.
We analysed the offsetting and presentation of deferred tax positions.
Our audit procedures did not lead to any material reservations regardingthe recoverability of deferred tax assets.
FINANCIAL STATEMENTSINDEPENDENT AUDITOR’S REPORT CONTINUED
Hyperinflation accounting for Angola and Zimbabwe subsidiariesRiskAngola was identified as a hyperinflationary economy from 1 January2017 to 30 March 2019. Zimbabwe was identified as hyperinflationaryeconomy from 1 January 2019. Applying IAS 29 – Financial Reporting inHyperinflation Reporting had a net impact on the 2019 loss of US$11million. The most impacted balances of the consolidated statement offinancial position were Property and equipment and intangible assets,revalued respectively by US$8 million and US$2 million.
This application of hyperinflation accounting was significant to our auditbecause the amounts materially impact equity and because it is a non–routine accounting matter.
Our audit responseWe performed the following procedures:
We reviewed the approach to revalue the financial statement positionsunder the IAS 29 principles,
We verified the underlying inputs and the mathematical accuracy of thehyperinflation reevaluation model.
We assessed the classification of the hyperinflationary economies.We analysed the disclosures relating to hyperinflation.
Our audit procedures did not lead to any material reservations regardingthe hyperinflation accounting.
Discontinued operations and assets held for saleRiskPuma energy signed a share purchase agreement to sell its Australianfuel business to chevron in December 2019. The transaction is expectedto complete by mid-2020.
As a consequence, this operation has been classified in the balance sheetin accordance with IFRS 5 as asset held for sale and liabilities directlyassociated with these assets held for sale for respectively US$ 860.1million and US$526.4 million. Discontinued loss for 2019 amounts toUS$104million.
The Group’s disclosures about assets held for sales and discontinuedoperations are included in Note 12 of the consolidated financialstatements.
Discontinued operations and assets held for were significant to our auditgiven their materiality and the management estimate in evaluating thecriteria to fulfil to account for discontinued operations and measure assetsheld for sale at the lower of carrying value and fair value less cost ofdisposal.
Our audit responseWe performed the following procedures:
We assessed the classification of the discontinued operations and assetsheld for sale
We verified the underlying inputs and the mathematical accuracy of thefair value less cost of disposal valuation of the assets held for sale
We analyzed the disclosures relating to assets held for sale anddiscontinued operations
Our audit procedures did not lead to any material reservations regardingthe discontinuing operation and assets held for sale classification andmeasurement.
Other information in the annual reportManagement is responsible for the other information in the annual report.The other information comprises all information included in the annual
report, but does not include the consolidated financial statements and ourauditor’s reports thereon. Our opinion on the consolidated financialstatements does not cover the other information in the annual report andwe do not express any form of assurance conclusion thereon.
In connection with our audit of the consolidated financial statements, ourresponsibility is to read the other information in the annual report and, indoing so, consider whether the other information is materially inconsistentwith the consolidated financial statements or our knowledge obtained inthe audit, or otherwise appears to be materially misstated. If, based on thework we have performed, we conclude that there is a materialmisstatement of this other information, we are required to report that fact.We have nothing to report in this regard.
Responsibility of management for the consolidated financial statementsManagement is responsible for the preparation of the consolidatedfinancial statements that give a true and fair view in accordance with IFRS,and for such internal control as management determines is necessary toenable the preparation of consolidated financial statements that are freefrom material misstatement, whether due to fraud or error.
In preparing the consolidated financial statements, management isresponsible for assessing the Group’s ability to continue as a goingconcern, disclosing, as applicable, matters related to going concern andusing the going concern basis of accounting unless management eitherintends to liquidate the Group or to cease operations, or has no realisticalternative but to do so. Management is responsible for overseeing theGroup’s financial reporting process.
Auditor’s responsibilities for the audit of the consolidated financialstatementsOur objectives are to obtain reasonable assurance about whether theconsolidated financial statements as a whole are free from materialmisstatement, whether due to fraud or error, and to issue an auditor’sreport that includes our opinion. Reasonable assurance is a high level ofassurance, but is not a guarantee that an audit conducted in accordancewith ISA will always detect a material misstatement when it exists.Misstatements can arise from fraud or error and are considered material if,individually or in the aggregate, they could reasonably be expected toinfluence the economic decisions of users taken on the basis of theseconsolidated financial statements. As part of an audit in accordance withISA, we exercise professional judgment and maintain professionalscepticism throughout the audit. We also:
Identify and assess the risks of material misstatement of the consolidatedfinancial statements, whether due to fraud or error, design and performaudit procedures responsive to those risks, and obtain audit evidencethat is sufficient and appropriate to provide a basis for our opinion. Therisk of not detecting a material misstatement resulting from fraud ishigher than for one resulting from error, as fraud may involve collusion,forgery, intentional omissions, misrepresentations, or the override ofinternal control.
Obtain an understanding of internal control relevant to the audit in order todesign audit procedures that are appropriate in the circumstances, butnot for the purpose of expressing an opinion on the effectiveness of theGroup’s internal control.
Evaluate the appropriateness of accounting policies used and thereasonableness of accounting estimates and related disclosures madeby management.
Conclude on the appropriateness of management’s use of the goingconcern basis of accounting and, based on the audit evidence obtained,whether a material uncertainty exists related to events or conditions thatmay cast significant doubt on the Group’s ability to continue as a goingconcern. If we conclude that a material uncertainty exists, we arerequired to draw attention in our auditor’s report to the related
disclosures in the consolidated financial statements or, if suchdisclosures are inadequate, to modify our opinion. Our conclusions arebased on the audit evidence obtained up to the date of our auditor’sreport. However, future events or conditions may cause the Group tocease to continue as a going concern.
Evaluate the overall presentation, structure and content of theconsolidated financial statements, including the disclosures, andwhether the consolidated financial statements represent the underlyingtransactions and events in a manner that achieves fair presentation.
Obtain sufficient appropriate audit evidence regarding the financialinformation of the entities or business activities within the Group toexpress an opinion on the consolidated financial statements. We areresponsible for the direction, supervision and performance of the Groupaudit. We remain solely responsible for our audit opinion.
We communicate with management regarding, among other matters, theplanned scope and timing of the audit and significant audit findings,including any significant deficiencies in internal control that we identifyduring our audit.
We also provide management with a statement that we have compliedwith relevant ethical requirements regarding independence, and tocommunicate with them all relationships and other matters that mayreasonably be thought to bear on our independence, and whereapplicable, related safeguards.
From the matters communicated with management, we determine thosematters that were of most significance in the audit of the financialstatements of the current period and are therefore the key audit matters.We describe these matters in our auditor’s report unless law or regulationprecludes public disclosure about the matter or when, in extremely rarecircumstances, we determine that a matter should not be communicatedin our report because the adverse consequences of doing so wouldreasonably be expected to outweigh the public interest benefits of suchcommunication.
Ernst & Young Ltd
Mark Hawkins Didier LequinSwiss licensed audit expert Swiss licensed audit expert
(Auditor in charge)