financial stability report 2014 - bank of thailand · ability to manage income and expenditure, ......
TRANSCRIPT


Financial Stability Report 2014
Financial Stability Report 2014


Message from the Governor
The Thai financial sector faced challenges from various directions throughout 2014, ranging from the slowdown of domestic economy and political situation during the first half of the year, to the impacts of external uncertainties surrounding the ongoing recovery of major economies. Nevertheless, Thailand has made a steady progress in strengthening the financial sector fundamentals in over a decade since the 1997 financial crisis. With better risk management and governance in financial institutions, major development in the money and capital markets, supervisory practices in line with the international standards, and the establishment of key infrastructure such as the National Credit Bureau, the Thai financial sector has become better-immune to these challenges.
Nonetheless, one should be mindful that the global financial environment of prolonged high liquidity and low interest rates could induce underpricing of risks. Going forward, should various countries make sudden drastic shifts in policy direction, while relevant stakeholders may be caught off guard, a significant and widespread impact could very well be felt.
The Bank of Thailand hopes that this Financial Stability Report would assist relevant stakeholders to become aware of risks in the financial sector and take the opportunity to adapt and make necessary preparations to deal with potential challenges that may arise in the future.
Mr. Prasarn Trairatvorakul Governor
26 December 2014


Content
Executive Summary 1
Chapter 1 Economic and financial condition 3 1.1 Global economic and financial condition 3 1.2 Domestic economy 5 1.3 Domestic financial markets 13 1.4 Commercial banks 16 Box 1 : The role of non-bank in credit extension to the private sector 20
Chapter 2 Risks to current financial stability and risk-mitigating policy implementation 23 2.1 Impact of household debt on Thailand’s economic and financial stability 23 2.2 Impact of the economic slowdown on commercial banks’ loan quality 30 2.3 Risk from high growth of small equities’ market capitalization 33 Box 2 : Stress testing framework 36 Box 3 : Measures to support SMEs by the Bank of Thailand and commercial banks 38
Chapter 3 Risks to financial stability in the medium-term and policy implication 41
3.1 Recovery and policy divergence of major economies: Impact on Asian financial markets 41
3.2 Fiscal risk from structural problem 44


Financial Stability Report 2014 | 1
Executive Summary In 2014, recovery in the global economy remained fragile with disparities between
countries. While the U.S. and the U.K. economies expanded steadily, many countries were at risk of receding to a slowdown, particularly the euro area, Japan and China, resulting in a divergence in policy directions of major economies. Impact of the Russian financial problem at the end of the year also warranted close monitoring. Meanwhile, the significant decline in oil price helped facilitate overall economic recovery through lower inflation and cost of production. The Thai economy slowed down from weaker domestic demand and stagnant exports. The political situation was the key factor causing the economic contraction in the first half of the year, though a gradual turnaround was noted towards the end of the second quarter. Growth of the household debt decelerated continuously and risk of real estate speculation remained low. Stability of both the domestic and external sectors was well maintained. Nonetheless, some large corporates tended to accumulate more debt, in part to support business expansion to increase production capacity and competitiveness. Such development could cause these corporates to be more vulnerable to various factors. Volatility in the Thai financial market decreased compared to last year. Despite that the return of inflow to the equity market after political uncertainties had eased, a net sell was recorded for the whole year and the Thai baht depreciated during the second half of the year. The Stock Exchange of Thailand (SET) index edged up from local investors’ demand. Stability of the Thai banking system was sound. Banks’ income generating ability was satisfactory, with high level of capital and loan loss provision. Thus, banks were able to expand credits to support economic recovery.
Risks to Thailand’s current economic and financial stability that were continually monitored and addressed included the increased household debt during the last 2-3 years. Although the growth of household debt has already decelerated and the impact on the Thai financial institutions was limited, the elevated level of debt could affect consumption and the economic recovery. Hence, efforts should be escalated to improve households’ ability to manage income and expenditure, and financial discipline, as well as enhancing the efficiency of market mechanism, for example, increasing membership of the National Credit Bureau. Commercial banks’ loan quality deteriorated slightly in tandem with the economic slowdown. The effect was largest for debtors with domestic consumption-related business, particularly small businesses and retail debtors that borrowed for personal consumption and used cars. Furthermore, the group of debtors that had undergone debt rescheduling and debt restructuring would require close monitoring in order to assess whether their debt servicing ability would return to normal. For the equity market, signs of speculative activity were observed in small equity trading by retail investors in the Market for Alternative Investment (mai), raising a concern on underpricing of risk. Should prices fall, investors’ net worth and consumption could be affected. Nonetheless, the aforementioned risk was still contained, given that the market capitalization in the mai was

2 | Financial Stability Report 2014
not significant and the authorities had continually implemented measures to maintain stability in the equity market.
Risks to economic and financial stability in the medium-term included uncertainties on global recovery prospect and major economies’ monetary policy direction. With these uncertainties, there is a risk of a faster and more severe-than-expected change in global liquidity conditions, which could increase volatility of capital flow and Asian financial markets. Nonetheless, the impact on Asian EMEs including Thailand was not expected to be significant given their generally strong economic fundamentals. Fiscal risk was also noted although there was no immediate concern in the short-term as the level of public debt was within the threshold for fiscal sustainability. However, fiscal risk could heighten in the long-term since the tax revenue was rather stable and could reduce in the future, if the government chooses to continue using tax as a tool to stimulate the economy amid rising expenditure from the aging population. Therefore, acceleration of fiscal reforms that are already planned, such as increasing in the VAT at appropriate time and enhancing revenue collection efficiency and capacity, would be the key to reducing risk to fiscal stability in the long-term.

Financial Stability Report 2014 | 3
Chapter 1 : Economic and Financial Condition
Fragilities and disparities in the global economic recovery were observed throughout 2014, resulting in a notable divergence in major economies’ monetary policy directions that could potentially affect capital flow volatility. The Thai economy recovered slowly while economic and financial stability continued to be well maintained. Commercial banks’ performance was satisfactory despite caution in lending, thus credits were still expanding to facilitate the economic recovery. Growth in household debt eased continually. Commercial banks’ loan quality worsened slightly as a result of the economic slowdown in prior periods. Moreover, some large corporates recorded high debt-to-equity ratio which in part stemmed from business expansion and funding cost adjustment during the low interest rate environment. The situation could potentially make these firms more susceptible to risk factors.
1.1 Global economic and financial condition The global economy recovered steadily in 2014 with improving prospects in 2015.
Nonetheless, fragilities and disparities in the recovery process were observed and risks to growth increased for a number of economies. There was a divergence in major economies’ growth prospects. The U.S. and the U.K. economies expanded well from continual improvement in fundamentals. Improvement in the U.S. labor market and private sector’s financial conditions was noted. Meanwhile, recovery in euro area economies continued to be fragile with risks of a potential slowdown and very low inflation.1 The assessment owed to structural problems in peripheral economies (Portugal, Ireland, Italy, Greece and Spain) which took time to resolve, and impact of the sanctions against Russia that affected confidence as well as the real sector. Additionally, the latest outlook of the Japanese economy pointed to a slowdown as a result of the consumption tax hike in April 2014 and low inflation prospect. Taken together, differences in recovery speed of major economies resulted in a notable divergence in monetary policy directions, known as unsynchronized monetary policy. In this regard, the Fed discontinued its asset purchase program and might increase the fed funds rate next year. Meanwhile, the ECB and the Bank of Japan (BOJ) continued to ease monetary policies to stimulate economic growth. Asian EMEs exhibited some signs of slowing down. The Chinese economy, in particular, was poised to slow down due to the government’s reform efforts which in part aimed at cooling off the overheat by trading off short-term performance for long-term stability in economic growth. At the same time, Asia’s domestic demand slowed down from a decrease in public spending to maintain fiscal sector stability and from financial institutions’ tightened lending practice. The overall global financial markets became more stable compared to last year though there 1 The International Monetary Fund (IMF) revised the risk that euro area economies would enter a recession up
from 20 percent in April 2014 to 38 percent in October 2014.

4 | Financial Stability Report 2014
were some periods of volatility resulting from various factors, for example, concerns over fragilities in some economies during the beginning of the year, Argentina’s default in the middle of the year, and the Russian financial crisis which caused the ruble tumbling down towards the end of the year. These factors would need to be closely monitored in the periods ahead.
Looking ahead, downside risks to the global economy would come from (1) recovery prospect that could be dampened by slowdown in the euro area and the Japanese economies; (2) potential increase in capital flow volatility owing to investors’ responses to major economies’ policy implementation such as unsynchronized monetary policy and fiscal policy, particularly uncertainty on measures to address the U.S. public debt problem, as well as possibility of an abrupt and severe change in global liquidity conditions; (3) structural problems in China, particularly shadow banks and elevated local government debt; and (4) periodic geopolitical risks in many regions that could result in volatility of the exchange rates and commodity prices.
Key tailwind to the global economy would come from the significant drop in oil prices in recent periods which would facilitate overall global growth through lower inflation and costs, thereby raising purchasing power and promoting spending. Countries with inflationary pressure in prior periods would also face less restriction in using monetary policy to stimulate economic growth. Nevertheless, the decline in oil prices might lead to deflation in some countries while continual easing of monetary policy could result in capital flow volatility in the coming periods.

Financial Stability Report 2014 | 5
1.2 Domestic Economy The Thai economy in 2014 slowed down
from last year due to sluggish recovery in domestic demand and stagnant exports. However, economic conditions improved in the second half of the year and growth was expected to pick up in 2015 from public spending and improvement in exports, following the global economic recovery. Overall economic stability was intact.
In 2014 Q1, the economy contracted from the same period last year, owing to the political situation and the elevated household debt which in turn led to contraction in domestic spending. The tourism sector was also affected by the issuance of travel advisories against travelling to Thailand. Export recovery was slow as trading partners’ demand was yet to fully pick up while the manufacturing sector faced some production constraints as production technology was not responsive to changes in the global demand. (Chart 1.2.1)
Nevertheless, with the easing political situation towards the end of 2014 Q2, the Thai economy began to recover steadily , particularly domestic demand which benefited from resumption of normal government operations and the timely acceleration of fiscal year 2014 budget disbursement. Preparation of fiscal year 2015 budget was also completed on schedule. Private spending picked up somewhat due to improved confidence but remained sub-par, owing to the elevated household debt and a slump in agricultural prices which led households to exercise caution in spending, especially on durable goods. Meanwhile, businesses continued to postpone investment to expand production capacity in order to assess economic recovery outlook while exports faced additional impact from lower agricultural prices and the global economic slowdown towards the end of the year. In addition, the tourism sector continued to be affected by the political situation and the slowdown in euro
Chart 1.2.1 Thailand Economic Indicators
Note : *Sales index of consumer goods (Neilsen Fast Moving Consumer Goods) Source : Bank of Thailand
Index Jan 14 = 100
0
50
100
150
200
80
90
100
110
120
Jan 13 Apr 13 Jul 13 Oct 13 Jan 14 Apr 14 Jul 14 Oct 14
Exports (excluding gold) Sales of Consumer Goods index(FMCG)*
Imports of Capital goods Tourism
Use of Electricity for Manufacturing Car Sales index (RHS)

6 | Financial Stability Report 2014
area and the Russian economies. In December 2014, the Monetary Policy Committee (MPC) thus projected that Thailand’s economic growth in 2014 would register at 0.8 percent, slowing down from 2.9 percent in the previous year.
Despite the slowdown in 2014 economic performance, overall internal and external stability was well maintained. Internally, the average unemployment rate during the first 9 months of the year remained low at 0.8 percent. Inflationary pressure was soft with headline inflation for 2014 Q3 coming in at 2 percent and was expected to trend downwards in line with global oil prices which would decrease oil consumption and transportation costs. Externally, risks to stability were not yet a concern as reflected by the ratio of external debt to GDP which stood at 39 percent at the end of 2014 Q3, stabilizing from the previous year. The ratio of reserves to short-term debt continued to be high at 2.7 compared to the international benchmark of 1. The decline in global oil prices would likely benefit Thailand’s trade and current account balances while the managed float exchange rate system would help moderate risks from imbalances in the economic and financial systems.
The economic slowdown led to increased vulnerabilities in some economic sectors. However, systemic risks to overall economic and financial stability were not yet a concern as Thailand’s economic and financial fundamentals were able to absorb the shocks. Details are as follows.

Financial Stability Report 2014 | 7
Household Sector Stability of the household sector became
more fragile due to the economic slowdown and the elevated household debt. Nonetheless, risks from new debt accumulation declined as reflected by the continual downward trend in household debt.
In 2014, stability of the household sector became more fragile due to the economic slowdown. The elevated household debt worsened households’ debt servicing ability as reflected by the delinquency and NPL ratio of commercial banks' consumer loans which rose from 5.7 percent at the end of 2013 to 6.2 percent at the end of 2014 Q3. The increase was mostly due to auto loans and personal loans. (Chart 1.2.2) Note that commercial banks’ consumer loans accounted for about 42 percent of total household debt.
The slower-than-expected economic recovery led to the flattening out of non-farm income while farm income was negatively affected by the continual decline in agricultural prices. (Chart 1.2.3)
Nonetheless, household debt slowed down continually as reflected by financial institutions’ loans to households which expanded by 8.1 percent at the end of 2014 Q2, decelerating from 10.1 percent at the end of 2014 Q1 (Chart 1.2.4) as a result of households’ caution towards spending and new debt accumulation, coupled with financial institutions’ tightened credit standards.
Chart 1.2.2 Ratios of SM+NPL for Consumer Loan
Source : Bank of Thailand
0
5
10
15
200 2010 2011 2012 2013 2014
Consumer Loan Housing LoanCredit Card Loan Auto LoanPersonal Loan
%
Q1200
Q12012
Q12014
Q12010
Q12011
Q12013
Q32014
Chart 1.2.3 Household Income
Source: Office of Agricultural Economics, National Statistical Office of Thailand, calculations by Bank of Thailand
Index seasonal adjusted, 12 - month moving average (Jan 2011 = 100)
50
75
100
125
150
Jan2011
Jul Jan 2013
Jul Jan2013
Jul Jan2014
Jul
Farm Non-Farm (including OT)
OCT 14
Chart 1.2.4 Household Debt*
Note: *Loans to households from Financial institutions Banks and Non-banks) Source : Bank of Thailand
5
10
15
20
40
60
80
100Household Debt to GDPHousehold Debt Growth (RHS)
% to GDP %
Q12011
Q12012
Q12013
Q12014
Q22014

8 | Financial Stability Report 2014
Looking ahead, risks that needed to be monitored included trend in household income and debt servicing ability, especially for low-income households which had higher Debt Service Ratio (DSR) than other groups. (Chart 1.2.5) Moreover, the expansion in household debt which surpassed that of GDP caused the ratio of household debt to GDP to rise continually to 83.5 percent at the end of 2014 Q2. (Details in Chapter 2.1: Impact of household debt on Thailand’s economic and financial stability)
Corporate Sector
Listed companies in the Stock Exchange of Thailand adjusted well to the economic slowdown and continued to possess financial strength overall. Results from a stress test of an interest rate increase revealed the ability of these firms to absorb potential shocks. Corporate loans declined continually, mostly from SME loans while credit quality deteriorated slightly in line with the economic slowdown.
Overall, corporate debt growth did not accelerate much. Corporate debt to GDP edged up from 83.7 percent at the end of 2013 to 85.5 percent in 2014 Q2. (Chart 1.2.6) Most debt came in the form of borrowings, 70 percent of which was extended by depository corporations. Bond issuance also increased, mostly domestic issues.
The economic slowdown at the beginning of the year coupled with the political situation affected performance of the listed companies across many industries as reflected by the Net Profit Margin (NPM) which edged down from 4.9 percent at the end of 2013 to 4.6 percent at the end of 2014 Q3. Nonetheless, signs of improvement were noted in some sectors after the political situation eased at the end of the second quarter, for example, the construction, real estate and manufacturing sectors. (Chart 1.2.7).
Chart 1.2.6 Corporate Debt
Source : Bank of Thailand
0
20
40
60
0
100
0
2
4
6
10
12
Q1 2011 Q3 2011 Q1 2012 Q3 2012 Q1 2013 Q3 2013 Q1 2014
% to GDPTrillion THB
Domestic debt securities External debt securitiesLoans from other depository financial institutions Loans from other financial corporationsLoans from NR Corporate debt to GDP (RHS)
Q2 2014
Q12011
Q32012
Q12014
Q32011
Q12012
Q12013
Q32013
Chart 1.2.5 Debt Service Ratio Only indebted Household
Note : The lower and upper edges of bar charts show the 5
th and 95
th
percential respectively. The symbol + illustrates median value and the symbol illustrates the 75
th percentile
Source : National Statistical Office of Thailand and calculations by Bank of Thailand
Times
0.0
0.4
0.8
1.2
1.6
2.0
Group 1(Lowest Income)
Group 2 Group 3 Group 4 Group 5(Highest Income)
Average Monthly Income as of 2013 Baht Group 1
(Lowest Income Group2 Group 3 Group 4
Group 5 Highest Income
0- 000 .001-14 000 14 001-21 000 21 001-33 000 33,000
Chart 1.2.7 Net Profit Margin* (NPM) of Corporate Sector
Note: *Median Source: Stock Exchange of Thailand and calculations by Bank of Thailand
%
-20
-10
0
10
20
Q12011
Q12012
Q12013
Q12014
Overall ManufacturingConstruction Hotel and restaurantReal estate Wholesale and retail

Financial Stability Report 2014 | 9
However, during the first 9 months of the year, net profit of the construction and real estate sectors declined from the same period last year, owing to labor constraint. The transportation and hotel and restaurant sector were significantly affected by the political situation that led to the issuance of travel advisories against travelling to Thailand, along with some external factors namely political unrests and economic problems in various countries, which caused a reduction in the number of tourists especially from Russia and Europe. As a result, net profit of the hotel and restaurant sector and the transportation sector declined from the same period last year. (Chart 1.2.8)
Although corporate profitability edged down slightly during the first half of the year, ovell stability of the corporate sector was still well maintained. Debt servicing ability and liquidity conditions during the first three quarters of 2014 remained close to their long-term median levels during the last 10 years (2004 Q3 – 2014 Q3). The long-term median levels of the Interest Coverage Ratio (ICR), the Debt to Equity (D/E) ratio and the Current Ratio (CR) were 6, 0.8 and 1.5, respectively. (Chart 1.2.9)
Total corporate loans slowed down continually since the end of 2013, particularly SME loans (Chart 1.2.10) which was quite significantly affected by the economic slowdown and financial institutions’ tightened credit standards. Corporate loan quality deteriorated slightly in 2014 Q3. (Chart 1.2.11)
Looking ahead, the corporate sector would face uncertainties surrounding the global economic recovery and the potential increase in the U.S. fed funds rate. However, results from a stress test of listed companies’ interest rate shock absorption capacity2 with 2 percent interest rate increase3 as the worst case scenario revealed that most listed
2 According to the Report “Spain: Vulnerabilities of Private Sector Balance Sheets and Risks to the Financial Sector Technical Notes”, 2012, IMF Country Report No. 12/140 3 Using implied interest rate, calculated as 100*(annual interest rate expense/(total liabilities – accounts payable))
Chart 1.2. Sales and Profits Growth of Corporate Sector (January – September, 2014)
Source : Stock Exchange of Thailand and calculations by Bank of Thailand
-60
-40
-20
0
20
40
Over
all
Man
ufac
turin
g
Cons
tructi
on
Who
lesale
and r
etail
Hot
el an
d Res
taur
ant
Tran
spor
tatio
n
Real
esta
te
Sales Profits
Chart 1.2. Financial Ratio
Note : * Bar chart Shows Interquartile where lower and upper edges of bar charts are 25
th and 75
th Percentile respectively. Symbol + is Median,
** is Mean value of Q3 2004- Q3 2014 Source : Stock Exchange of Thailand and calculations by Bank of Thailand
0.0
0.5
1.0
1.5
2.0
200 200 2010 2011 2012 2013 20140.00.51.01.52.02.53.03.5
200 200 2010 2011 2012 2013 2014
Current Ratio (CR)Debt to Equity Ratio
(D/E)Times TimesMean** = 0.8 Mean** = 1.5
-100
1020304050
200 200 2010 2011 2012 2013 2014
Interest Coverage Ratio (ICR)Times
Mean** = 6.0
Q3 2014
Q3 2014
Q3 2014
Chart 1.2.10 Corporate Loan Growth
Source : Bank of Thailand
-15
-10
-5
0
5
10
15
20
3 2552
3 2553
3 2554
3 2555
3 2556
3 2557
% yoy
SME SMEs Large Corporates Corporate Loan
Q32009
Q32010
Q32011
Q32012
Q32013
Q3 2014Chart 1.2.11 Loan Quality of Corporate Sector (SM+NPL)
Source : Bank of Thailand
02468
101214
Q3 2009 Q3 2010 Q3 2011 Q3 2012 Q3 2013 Q3 2014
Corporate Loan SME Loan Large Corporate Loan
Source: Bank of Thailand
% to Corporate Loan

10 | Financial Stability Report 2014
companies had enough liquidity to absorb their debt service burden. Despite some decrease in the ICR of listed companies overall, most firms’ ICR continued to be higher than 1, with the average ICR of the lowest 25 percentile at 1.3. Furthermore, the proportions of listed companies in each ICR range under various interest rate increase scenarios were not significantly different compared to the baseline case. (Charts 1.2.12 – 1.2.13)
Factors that would warrant monitoring in the periods ahead included the continual expansion of corporate debt, particularly some large corporates, as reflected by the increase in the D/E ratio of large listed companies (Chart 1.2.14) which in part stemmed from their mergers and acquisition as well as business expansion to enhance future production capacity and competitiveness. Such high debt accumulation could lead to a build-up of imbalance, making businesses more susceptible to income shock or interest rate shock in the next periods.
Chart 1.2.14 Debt-to-Equity Ratio of listed companies (classified by size)
Source : Stock Exchange of Thailand and calculations by Bank of Thailand
0.00.20.40.60.81.01.21.41.61.8
1st(small)
2nd 3rd 4th 5th(Large)
(Times)
Quintiles (Classified by sales)
Q3 2010Q3 2014
Chart 1.2.13 % of listed companies defined by the range of ICR under different scenarios Scenario of interest rate increase
Source : Stock Exchange of Thailand and calculations by Bank of Thailand
% of overall numbers of listed companies
13
4 3
10
30
39
13
74
11
32 33
138
5
14
31 29
05
1015202530354045
Com
pani
es in
loss
posit
ion 0 - 1
1 - 1
.5
1.5 -
3
3 - 1
0
10
Com
pani
es in
loss
posit
ion 0 - 1
1 - 1
.5
1.5 -
3
3 - 1
0
10
Com
pani
es in
loss
posit
ion 0 - 1
1 - 1
.5
1.5 -
3
3 - 1
0
10
Baseline Int. +1% Int. +2%
Chart 1.2.12 Result of Stress testing using a scenario of interest rate shock
Source : Bank of Thailand
ICR
Times
Baseline Int. rate +1% Int. rate +2%
(severe case)
P25 2.1 1.6 1.3
P50 6.9 5.1 4.2
P75 22.9 15.0 10.7

Financial Stability Report 2014 | 11
Real Estate Sector Risks to stability of the real estate sector in
2014 were not yet a concern. Real estate activities slowed down in the first half of the year but started to pick up after the political situation subsided. The outlook for real estate prices edged up mostly in line with costs. Risks of real estate speculation remained low.
During 2014 H1, real estate markets in Bangkok and its vicinities tapered off after a notable acceleration in the last 1-2 years. Negative factors affecting the real estate sector included the economic slowdown, the elevated household debt and the political situation which dented both consumer and business sentiment. As a result, consumers deferred buying decisions in order to reassess the political situation as reflected by the decline in sales booking rate for real estate properties in Bangkok and its vicinities (calculated as the total number of units sold divided by the total number of new units launched) in 2014 Q1 and Q2 which stood at 18.9 and 20.4 percent, respectively, from 34.7 percent in 2013 Q4. (Chart 1.2.15), in line with the decrease in the number of new loans extended by commercial banks in Bangkok and its vicinities in the first half of the year. (Chart 1.2.16) Moreover, developers adjusted by launching smaller projects to close sales quickly and postponing some projects, particularly condominiums which were sensitive to market conditions, in order to reassess real estate outlook and consumers’ purchasing power. (Chart 1.2.17)
After the political situation subsided in the latter part of 2014 Q2, real estate markets started to register steady improvement both in terms of demand and supply despite some constraints, including uncertainty on economic recovery prospect, the elevated household debt, and tightened credit standard for mortgage loans as reflected by the increase in Debt Service Coverage
Chart 1.2.15 Sales Booking Rate for Real Estate Properties in Bangkok and Vicinity*
Note : *3-month moving average of sales booking rate for new launches Source : Agency for Real Estate Affairs AREA and calculations by Bank of Thailand
0
20
40
60
Jan13
Jul13
Jan14
Jul14
%
Oct 14
Chart 1.2.16 Commercial Banks’ New Loan Approval for Real Estate Properties in Bangkok and Vicinities
Note : * Seasonal Adjusted 3-month moving average data at October 2014 Source : Bank of Thailand
02468
1012
jan12
Jul12
Jan13
Jul13
Jan14
Jul14
Low-rise Condominiums Total
Thousand units
Oct 14
Chart 1.2.17 Number of New Properties Launched in Bangkok and Vicinities*
Note : *3-month moving average data at October 2014 Source : Agency for Real Estate Affairs AREA and calculations by Bank of Thailand
02468
10121416
Jan12
Jul12
Jan13
Jul13
Jan14
Jul14
Low-rise Condominium Total Thousand units
Oct 14

12 | Financial Stability Report 2014
Ratio (DSCR) for new approved mortgages in Bangkok and its vicinities. (Chart 1.2.18)
Although the real estate markets were affected by the political situation and the economic slowdown, prices of all property types in Bangkok and its vicinities, especially condominium, still edged up in line with cost of land and construction materials which continued to trend up. The condominium price index rose from 127.5 in 2014 Q2 to 131.5 in 2014 Q3. (Chart 1.2.19)
Furthermore, risks of real estate speculation remained low for the whole of Thailand. The proportion of mortgages for non-first homes which could in part reflect investment and speculative purchases, edged down from 2012 for all income groups. (Chart 1.2.20) A number of developers also implemented measures to curb speculation, for example, fee for change in sales booking certificate and increase in down payment.
Chart 1.2.20 Commercial Banks’ Mortgage Loan Approval Rate Classified by Number of Properties Held by Borrowers and Income*
Note : *Mortgages for new and pre-owned properties from Jan 2008 – Sept 2014, calculated using a rolling window of 3 years and then comparing the number of borrowers in the third year of each window Source : Bank of Thailand
200
-2011
2010
-2012
2011
-2013
Q4/
12-Q
3/13
200
-2011
2010
-2012
2011
-2013
Q4/
12-Q
3/13
200
-2011
2010
-2012
2011
-2013
Q4/
12-Q
3/13
200
-2011
2010
-2012
2011
-2013
Q4/
12-Q
3/13
10,000-20,000 Baht 20,000-50,000 Baht 50,000-100,000 Baht More than 100,000 Baht
1 unit 2 Units 3 units up
Monthly Income Baht
Chart 1.2.1 Housing Price Index*
Note : * Calculated by computing a Hedonic Regression using data of 3-month seasonal adjusted moving average mortgages by commercial banks (base year = 2010) Source : Bank of Thailand
80
110
140
Jan-1
0M
ay-1
0Se
p-10
Jan-1
1M
ay-1
1Se
p-11
Jan-1
2M
ay-1
2Se
p-12
Jan-1
3M
ay-1
3Se
p-13
Jan-1
4M
ay-1
4Se
p-14
Single-Detached House price indexTownhouse Price IndexCondominiums Price Index
Index 2010=100
Oct 14
Chart 1.2.1 Debt Service Coverage Ratio: DSCR
Note : (1) DSCR = monthly income/monthly debt payment (principal and interest) (2) Calculated for new mortgages in Bangkok and its vicinity (3) 50th percentile (3-month moving average) (4) Includes only debt services for new mortgages by commercial banks Source : Bank of Thailand
012345
Jan Jan Jan Jan Jan
Times Average 200 -2013 = 4.4 times
Minimum ratio used by banks
Oct 2014

Financial Stability Report 2014 | 13
1.3 Domestic Financial Markets In 2014, the Thai financial markets
encountered periods of volatility from various factors though overall volatility declined from last year. The domestic political situation and economic outlook were key factors that affected the Thai financial markets during the first half of the year. Moreover, there were global economic and financial factors, including the U.S. economic outlook and direction of the fed funds rate, concern over China’s economic slowdown and risks in the financial sector, a decline in commodity prices particularly global oil prices, and financial stability concern which stemmed from the financial crisis in Russia. Meanwhile, geopolitical risk was a short-term factor that affected financial market volatility in some periods.
At the beginning of the year, the Thai financial markets experienced capital outflows as a result of the political tension that persisted since the end of last year, concern over China’s economic slowdown and economic imbalances in some Emerging Market Economies (EMEs4). In addition, the Federal Open Market Committee (FOMC) minutes led markets to believe that the U.S. would increase the fed funds rate sooner than previously expected5. Despite a subsequent slowdown in capital outflows, the political situation which escalated and led to the change in May, caused outflows from the Thai financial markets to total as high as 91.1 billion baht in that month, exerting downward pressure on Thai financial asset prices. (Chart 1.3.1)
4 Investors were concerned about risks and tendency of a considerable depreciation in exchange rates in some EMEs, for example, India, Brazil, Turkey, Indonesia and South Africa, owing to their current account deficit problem. The concern was ignited at the end of January 2014 from the rapid depreciation of the Argentine peso and the Turkish lira. 5 On February 19, 2014, the Fed published FOMC minutes which brought up the possibility of change in forward guidance together with the first mention of an interest rate increase. One member viewed that the increase could begin before the end of 2015.
Chart 1.3.1 Capital Flow and Exchange Rate
Source : Bank of Thailand and Reuters
28 29 30 31 32 33 34 35 36 -150
-100
-50
0
50
100
150
Apr-1
2Ju
n-12
Aug-
12Oc
t-12
Dec-1
2Fe
b-13
Apr-1
3Ju
n-13
Aug-
13Oc
t-13
Dec-1
3Fe
b-14
Apr-1
4Ju
n-14
Aug-
14Oc
t-14
Dec-1
4
Stock Bond Thai BahtBillion THB THB USD
Coup d’etat (22 May ‘14)

14 | Financial Stability Report 2014
After the political uncertainty eased and economic policies gained greater clarity following formation of the new government, investor confidence and outlook on the Thai economy start to improve, prompting foreign investors to gradually return to invest in the Thai financial markets. Nonetheless, there were still external factors affecting market conditions, for example, the political tension between Russia and Ukraine and retaliation measures to the sanctions from the U.S. and the EU. As a result, investors shifted their capital to safe haven assets such as the U.S. and the Japanese government bonds in some periods. Moreover, as the deadline for QE tapering6 was near, investors began to focus on U.S. economic data, which would influence the Fed’s decision on interest rate increase. Furthermore, towards the end of the year, the global investment climate was pressured by the decrease in commodity prices, particularly oil prices, along with financial stability concern over the Russian financial crisis. These factors resulted in higher volatility in global and Thai financial markets, which, when combined with the slower-than-expected recovery in the domestic economy, led to resumption of capital outflows, especially from the Thai bond market, in August onwards. In 2014, net outflows from the bond and equity markets totaled approximately 61 billion baht. Movement of the Thai baht in 2014 began with an appreciation in the first half of the year followed by depreciation in the latter half of the year. The Thai baht moved within a range of 31.72 – 33.13 baht against the U.S. dollar, closing at 32.88 baht against the U.S. dollar on December 22, near last year’s level, with a marginal depreciation of 0.06 percent. The appreciation of the Thai baht in part stemmed from inflows from foreign direct investments associated with domestic mergers and acquisitions together with satisfactory regional 6 The Fed began QE tapering since January 2014 by reducing asset purchases by 10 billion U.S. dollars at a time and discontinued QE all together in October 2014.

Financial Stability Report 2014 | 15
economic data, particularly after the political situation gained clarity. Meanwhile, the depreciation of the Thai baht from September onwards was due to pressure on the global investment climate, the appreciation of the U.S. dollar in the second half of the year, more notable divergence in monetary policy directions of major economies, concern over Thailand’s economic slowdown, and pressure on overall financial market conditions stemming from the decline in global oil prices.
On the Thai bond market, government bond yields declined by 27 – 120 bps from the end of last year, in part due to the MPC’s decision to decrease the policy interest rate by 0.25 percent in March, reduction in government bond supply, and concern over the global and domestic economies which still exhibited signs of a potential slowdown. Foreign investors reduced holding of Thai bonds, particularly short-term bonds. On December 18, the proportion of Thai bond holdings by foreign investors amounted to approximately 10 percent, declining from 10.34 percent at the end of last year. (Charts 1.3.2 – 1.3.3)
The Stock Exchange of Thailand (SET) was driven mainly by purchases of local institutional investors, causing the SET index to climb up continually despite the impact of political and economic uncertainties during the first half of the year along with foreign investors’ periodic sell-offs. The SET index reached its annual peak of 1,600.16 points on September 26 (data as of December 22), increasing by 23.2 percent from the end of 2013 (Chart 1.3.4). The SET Price-Earnings ratio (P/E ratio) rose to its highest point of 19.05 on November 27, higher than 14.60 at the end of 2013. Moreover, the Market for Alternative Investment (mai) P/E ratio peaked above 80 in September compared with 28.32 at the end of 2013 (Chart 1.3.5), causing a concern on overheating of asset prices and speculation by retail investors, especially in small cap equities and IPOs. However, measures implemented by related regulators and the slower-than-expected recovery of the Thai economy
Chart 1.3.4 Cumulative Equity Flows and SET Index
Source : The Stock Exchange of Thailand
1,000
1,100
1,200
1,300
1,400
1,500
1,600
1,700
-80
-60
-40
-20
0
20
40
60
80
2-Ja
n-14
22-Ja
n-14
11-F
eb-1
44-
Mar
-14
24-M
ar-1
416
-Apr
-14
8-M
ay-1
429
-May
-14
18-Ju
n-14
9-Ju
l-14
30-Ju
l-14
21-A
ug-1
410
-Sep
-14
30-S
ep-1
420
-Oct-
147-
Nov-
1427
-Nov
-14
19-D
ec-1
4Local InstitutesLocal InvestorsForeign InvestorsSET Index
Bln Baht Index
Chart 1.3.3 Cumulative Non-resident Bond Flows
(since Jan 2006)
Source : Bank of Thailand
185
61
167
236
108
181 204 73
312
477
654
587 584
531 609
0
100
200
300
400
500
600
700
Jan-1
0M
ar-1
0Ju
n-10
Sep-
10De
c-10
Mar
-11
Jun-
11Se
p-11
Dec-1
1M
ar-1
2Ju
n-12
Sep-
12De
c-12
Mar
-13
May
-13
Aug-
13No
v-13
Feb-
14M
ay-1
4Au
g-14
Nov-
14
Billion THB
Long-term bonds
Short-term bondsPolitical turmoil
Coup d’etat
Concerns overQE Tapering
Chart 1.3.2 Government Bond Yields
Source : The Thai Bond Market Association (ThaiBMA)
1.82.12.42.73.03.33.63.94.24.5
27-D
ec-1
311
-Jan-
1426
-Jan-
1410
-Feb
-14
25-F
eb-1
412
-Mar
-14
27-M
ar-1
411
-Apr
-14
26-A
pr-1
411
-May
-14
26-M
ay-1
410
-Jun-
1425
-Jun-
1410
-Jul-1
425
-Jul-1
49-A
ug-1
424
-Aug
-14
8-Se
p-14
23-S
ep-1
48-
Oct-1
423
-Oct-
147-
Nov
-14
22-N
ov-1
47-
Dec-1
422
-Dec
-14
%1M 3M 6M 1Y3Y 5Y 7Y 10Y15Y TH Policy Rate US 10Y

16 | Financial Stability Report 2014
Chart 1.4.1 Commercial Bank’s Loan Growth
Source : Bank of Thailand
-5
0
5
10
15
20
25
30
Mar10
Sep Mar11
Sep Mar12
Sep Mar13
Sep Mar14
Sep
Total Loan Corporate Loan Consumer Loan
% yoy
Chart 1.3.5 P/E ratio in SET and mai markets
Source : The Stock Exchange of Thailand
20
30
40
50
60
70
80
90
12
13
14
15
16
17
18
19
20
2-Ja
n-14
18-Ja
n-14
3-Fe
b-14
19-F
eb-1
47-
Mar
-14
23-M
ar-1
48-
Apr-1
424
-Apr
-14
10-M
ay-1
426
-May
-14
11-Ju
n-14
27-Ju
n-14
13-Ju
l-14
29-Ju
l-14
14-A
ug-1
430
-Aug
-14
15-S
ep-1
41-
Oct-1
417
-Oct-
142-
Nov-
1418
-Nov
-14
4-De
c-14
20-D
ec-1
4
P/E ratio (SET) P/E ratio (mai)_RHStimestimes
Chart 1.4.2 Private Sector’s Source of Fund
Source : Bank of Thailand
Billion Baht
2011 2012 2013
month
2013 month2557
Loan Outstanding 476 637 10 701 10 350 10 25
Loan Outstanding increase 1 10 .5 1 161.5 1 063.2 712. 224.3Bond Outstanding increase 77.5 214.3 1 0.4 134. 245. New Issuance of Stock .7 1 3.4 145.5 117. 12 .7
prompted the SET index to decline gradually before dropping sharply in December, which was driven by the significant decline in global oil prices, heightened concern over the global economic outlook which exerted pressure on the global investment climate, and the downward trend in investment in EMEs by foreign investors. These factors, coupled with the profit-taking sell-offs in the SET, which had increased by more than 20 percent over the year, and the high proportion of energy stocks in the market, led to a drop of the SET to 1,478.49 points on December 15. The SET P/E ratio also decreased to 17.55 while the mai P/E ratio remained at the high level of 67.51.
1.4 Commercial Banks Overall, commercial banks were able to
expand credits to support the private sector albeit at a slower pace in line with the economic conditions. The banking system remained resilient, with profitability and high level of capital fund and loan loss provision, reflecting the ability to absorb risks from future vulnerabilities and support further credit expansion to facilitate economic recovery in the next periods.
Commercial banks’ loans remained a major source of finance for the private sector despite the increasing role of non-banks. (Details in Box 1: The role of non-banks in credit extension to the private sector) Credits continued to expand but slowed down from the same period last year, both corporate and consumer loans. At the end of 2014 Q3, credit growth recorded at 5.6 percent (Chart 1.4.1), decelerating in tandem with the economic slowdown and the elevated household debt. Moreover, during the first 9 months of 2014, large corporates increased fund raising through bond and stock issuances (Chart 1.4.2) partly to manage cost of fund under the low interest rate environment and to repay bank loans. (During the 12 months to 2014 Q3, debt repayment by large corporates that exceeded 5 billion baht amounted to 220 billion baht)

Financial Stability Report 2014 | 17
Chart 1.4.3 Corporate Loan Growth
Note : number in bracket is % to total loan Source : Bank of Thailand
-10
-5
0
5
10
15
20
25
30
11 12 13Sep14
11 12 13Sep14
11 12 13Sep14
11 12 13Sep14
11 12 13Sep14
11 12 13Sep14
%yoy
(20.0%) (16.4%) (8.8%) (7.1%) (6.8%) (6.2%)
Manufacturing Commerce Finance Business Real Estate Public Utilities Services+Construction
Chart 1.4.4 Loan Growth
Note : number in bracket is % to total loan Source : Bank of Thailand
-10-505
1015202530354045
2011
2012
2013
Sept
14 2011
2012
2013
Sept
14 2011
2012
2013
Sept
14 2011
2012
2013
Sept
14 2011
2012
2013
Sept
14
%yoy
Large corporate SME Housing Car Personal +Credit card
Consumer LoanCorporate Loan
31.2% 37.7% 14. % .0% .2%)
Chart 1.4.5 Number of Car Sales in Thailand
Source : The Federation of Thai Industries
-100 -50 0 50 100 150 200 250 300
0
100
200
300
400
500
Mar Jun
Sep
Dec
Mar Jun
Sep
Dec
Mar Jun
Sep
Dec
Mar Jun
Sep
Dec
Mar Jun
Sep
2010 2011 2012 2013 2014
%yoyBillion carsFirst Car Tax Rebate Scheme
Corporate loans (69 percent of total loans) grew by 4.5 percent, slowing down in almost all sectors (Chart 1.4.3), particularly commerce, manufacturing, and services. This development in part reflected the slowdown in domestic and external demand, sluggish recovery in the tourism sector and the increased long-term fund raising by large corporates through bond and stock issuances. Utility was the only sector that recorded high credit growth thanks to the continual investment in electrical power.
A break-down by size revealed that SME loans decelerated since the beginning of 2014 to register a growth rate of 4.7 percent at the end of 2014 Q3 compared to strong growth of 14 – 16 percent during 2011 – 2013. The slowdown in SME loans was attributed to the impact from the economic slowdown as a result of the protracted political situation from the end of 2013 to the middle of 2014. The slowdown in SME loans was experienced in all business sectors, particularly the financial sector such as leasing companies after the first car tax rebate scheme ended and the real estate sector (low-rise residential housing projects, condominiums and rental apartments) which was affected by the gradual economic recovery. Meanwhile, large corporate loans grew by 4.3 percent, decelerating only slightly.
Consumer loans (31 percent of total loans) expanded by 8.0 percent from the same period last year, slowing down continually in all categories in line with domestic demand which was impacted by the elevated household debt and commercial banks’ tightened credit standards. (Chart 1.4.4) In particular, auto loans contracted after a notable acceleration during the first car tax rebate scheme. (Chart 1.4.5) Personal loans and credit card loans also grew at a slower pace while mortgage loans stabilized as there was still real demand for low-rise residential properties.

18 | Financial Stability Report 2014
Chart 1.4.6 Loan quality of Banking system
Note : (1) NPL is loan overdue (principle or interest by more than 3 months starting from the due date (2) SM is loan overdue (principle or interest) by more than 1 month starting from the due date Source : Bank of Thailand
0.0
0.5
1.0
1.5
2.0
2.5
3.0
0
50
100
150
200
250
300
350
400
2011
2012
2013
Mar
-14
Jun-
14
Sep-
14
2011
2012
2013
Mar
-14
Jun-
14
Sep-
14
Billion THB % to total loanNon-performing loan
(NPL)Speacial-mention loan
(SM)
Chart 1.4.7 Composition of Deposit
Source : Bank of Thailand
010203040506070
Mar2010
Sep Mar2011
Sep Mar2012
Sep Mar2013
Sep Mar2014
Sep
CASA < 3 months 3-12 months > 1 year
% to total deposit
Looking ahead, should the economy recover from the government’s stimulus policies which would help to uplift investment climate and private confidence, loans would likely expand more. In this regard, there were increasing trend of corporate loan applications and long-term deposit mobilization in 2014 Q3 to support future economic activities and maintain cost of fund during the low interest rate environment.
Loan quality was intact overall (Chart 1.4.6), thanks to commercial banks’ continual risk management. However, the economic slowdown resulted in loan quality deterioration of certain groups of debtors, notably debtors with domestic consumption-related businesses, especially small business and retail debtors. (Details in Chapter 2.2)
Commercial banks continued to record profit albeit at a slower growth rate thanks to well managed interest rate expenses
Commercial banks retained satisfactory income generating ability and were able to adjust to the economic slowdown. During 2014 Q2 – Q3, commercial banks took steps to manage interest rate expenses by reducing long-term deposit products with high interest rate and focusing instead on current accounts and savings accounts (CASA) which had lower funding cost. (Chart 1.4.7) Moreover, commercial banks maintained growth of fee income, especially fees from issuance/sale of securities and bonds and insurance brokerage fees which recorded a continual increase. During the first 9 months of 2014, commercial banks recorded total net profit of 165.5 billion baht, increasing by 10.5 billion baht or 6.8 percent from the same period last year. Net Interest Margin (NIM) and Return on Asset (ROA) rose from 2.53 and 1.35 percent in the first 9 months of last year to 2.60 and 1.37 percent in the same period this year.
The continually strong income generating ability coupled with the Bank of Thailand’s policy over the last 3 years to encourage commercial banks to increase loan loss provision as a buffer against

Financial Stability Report 2014 | 19
Chart 1.4. Capital and Provision
Source : Bank of Thailand
60
100
140
180
220
0
5
10
15
2010 2011 2012 2013 Mar 14 Jun 14 Sep 14NPL Coverage Ratio (RHS)Actual/Regulatory Loan Loss Provision (RHS)BIS RatioTier-1 Ratio
% to Risky Weighted Assets %
Note: Basel III implementation started in 2013
economic uncertainty, resulting in high level of loan loss provision, with the ratio of actual loan loss provision to regulatory loan loss provision reaching 166.9 percent at the end of 2014 Q3. Meanwhile, capital increased from continual profit allocation. The capital adequacy ratio and the Tier 1 ratio stood at 17.1 percent and 13.9 percent, respectively. (Chart 1.4.8)
Summary Thailand’s overall economic and financial
stability was well maintained. Nonetheless, there were still risks that needed close monitoring, including (1) the elevated household debt which caused households to be more susceptible to shocks than in the past and could potentially affect Thailand’s financial stability and economic growth in the periods ahead; (2) deterioration of the banking sector’s loan quality due to the economic slowdown in recent periods; and (3) risk of an overheat in small equities.

20 | Financial Stability Report 2014
Chart 2 Outstanding Private Credit and It’s Proportion to GDP
Note : Starting from 2011 onwards, database perimeter has been expanded to include activities of Credit Card and Personal loan companies, leasing companies, Security companies and pawn shops Source : Bank of Thailand
8.456 .87
4.87
2.252.00 2.00
-1
0
1
2
3
4
5
-5
0
5
10
15
20
25
Q1 Q2 Q3 Q4 Q1 Q2 Q3 Q4 Q1 Q2 Q3 Q4 Q1 Q2 Q3 Q4 Q1 Q2 Q3 Q4 Q1 Q2 Q3 Q4 Q1 Q2
200 200 2010 2011 2012 2013 2014
Corporate Household Private Credit Policy Rate (RHS)
Government Stimulus Policies %
Q4/08 - Q3/0 Global Financial Crisis
Q2/10 Political Unrest
Q1 54 Tsunami JapanQ4 54 Great Flood
Q2/14 Coup d'état
Chart 1 Outstanding Private Credits
Note : Starting from 2011 onwards, database perimeter has been expanded to include activities of credit card and personal loan companies, leasing companies, security companies and pawn shops Source : Bank of Thailand
5.27 6.79
4.51
10.07
134 139 140
020406080100120140160
- 2 4 6 8
10 12 14 16 18 20 22
Q42008
Q42009
Q42010
Q42011
Q42012
Q42013
Q22014
Business Household Private Credit to GDP (RHS)
%Trillion THB
Box 1 : The Role of Non-banks in Credit Extension to the Private Sector Recently, growth in private credits
(credits that financial institutions7 extend to the business and household sectors) slowed down in line with the economy. Nonetheless, total private credits remained relatively high in part due to the acceleration in consumer loans from the end of 2009 to 2011 which owed to borrowings to finance post-flood expenses, the government’s stimulus measures (such as the first car tax rebate scheme), and the low interest rate environment. As of June 2014, outstanding private credits stood at 16.86 trillion baht, equivalent to 140 percent of GDP. (Charts 1-2)
Commercial banks continued to be the main provider of private credits with the market share of 56 percent as of June 2014. Meanwhile, non-banks, including Specialized Financial Institutions (SFIs), saving cooperatives, credit card and personal loan companies under supervision, and leasing companies started to increase their roles in private credit extension. (Charts 3-4)
7 Include commercial banks and non-banks such as SFIs, saving cooperatives, finance companies, mutual funds and other non-depository financial institutions, for example, credit card companies and personal loan companies under supervision, hire-purchase and leasing companies, securities companies and pawn shops.

Financial Stability Report 2014 | 21
Chart 4 Private Credit Growth Classified by Financial Institutions
Note : Starting from 2011 onwards, database perimeter has been expanded to include activities of Credit Card and Personal loan companies, leasing companies, Security companies and pawn shops Source : Bank of Thailand
6.684.85
9.3611.87
-15
-5
5
15
25
35
45
Q1 Q2 Q3 Q4 Q1 Q2 Q3 Q4 Q1 Q2 Q3 Q4 Q1 Q2 Q3 Q4 Q1 Q2 Q3 Q4 Q1 Q2 Q3 Q4 Q1 Q2
200 200 2010 2011 2012 2013 2014
Commercial Banks SFIs Saving Cooperatives Credit Cards and Personal Loan Companies and Leasing Companies
Government Stimulus Policies
Q4/08-Q3/0 Global Financial Crisis
Q2/10 Political Unrest
Q1 11 Tsunami JapanQ4 11 Great Flood Q2/14 Coup d’etat
%yoy
Chart 3 Private Credit Structure by Financial Institutions
Note : Starting from 2011 onwards, database perimeter has been expanded to
include activities of Credit Card and Personal loan companies, leasing companies, Security companies and pawn shops
Source : Bank of Thailand
62.69 59.60 58.69 55.02 55.06 56.34 56.24
17.34 19.94 21.59 21.46 21.46 20.60 20.457.09 8.03 8.62 8.46 8.64 8.89 9.115.42 6.53 7.55 7.6112.58 12.20 10.93 8.84 7.54 5.95 5.89
0
20
40
60
80
100
Q42008
Q42009
Q42010
Q42011
Q42012
Q4 2013
Q22014
Commercial Banks SFI
Saving Cooperatives Finance Companies
Credit Cards and Personal Loan Companies and Leasing Companies Securities Companies Pawn Shops
Others
% - The role of SFIs (Government
Savings Bank, Government Housing Bank, Bank for Agriculture and Agricultural Cooperatives, Export-Import Bank of Thailand, SME Bank and Islamic Bank of Thailand) increased significantly during 2009 – 2011 since the government used them as vehicles to implement policies to alleviate problems and stimulate the economy from the impact of the global financial crisis. SFIs were also used by the government to promote financial access,
particularly the Government Savings Bank and the Bank for Agriculture and Agricultural Cooperatives that had implemented various projects such as loans for the People Bank project, loans to resolve the problem of informal debt, and debt restructuring and debt moratorium for small farmers and the poor. However, after the Thai economy started to pick up, growth in SFI credits has returned to normal trend since 2012. As of June 2014, outstanding SFI credits stood at 3.45 trillion baht, equivalent to 20.45 percent of total private credits.
SFIs are supervised by the Ministry of Finance, while the BOT is responsible for onsite examination of the operations and risks and report findings to the Ministry of Finance. SFIs are mandated to provide financial access to those who do not have access to commercial banks’ financial services, for example, low-income individuals, farmers and small and micro business owners. Thus, SFIs receive a number of debtors with different occupations, while credit line of each debtor is quite small. This helps to diversify risks to some extent.
- Analysis of loans extended by saving cooperatives revealed that during 2008 – 2014, the proportion of saving cooperative loans to total private credits increased steadily from 7.09 percent to 9.11 percent as of June 2014. Coverage of these loans was limited to

22 | Financial Stability Report 2014
Chart 5 Connectivity between Commercial Banks and Other Financial Institutions % of Total Commercial Banking System’s Assets
Source : Bank of Thailand
Commercial banks
SFIs
Saving Cooperations
Other
Finacnial Institutions
Deposit 0.11 %
Loan 2.04 %
Loan 3.12 %
Deposit 0.06 %
Investment in Bonds 1.35 %
Investment in Equities 0.0002%
Investment in Bonds 0.06 %
Investment in Equities 0.40 %
Deposit 0.21 %
Loan 1.71 %
only members of saving cooperatives who either reside in the same community or work at the same workplace. In 2014, outstanding saving cooperative loans stood at 1.54 million baht. Cooperatives are supervised by the Ministry of Agriculture and Cooperatives and retail loans comprise the majority of loan portfolio.
- Credit card and personal loan companies, and leasing companies which are predominantly subsidiaries of commercial banks increased their role during 2012 – 2013, from credit expansion which reached as high as 32 percent due to borrowings to finance post-2011 flood spending along with government stimulus policies, for example, the first car tax rebate scheme. Nonetheless, loans from these companies decelerated markedly after the aforementioned policies ended. As of June 2014, outstanding loans of credit card and personal loan companies, and leasing companies totaled at 1.28 trillion baht (equivalent to 7.61 percent of total private credits). Credit card, personal loan companies, and leasing companies that are subsidiaries of commercial banks are supervised by the BOT under consolidated supervision. Leasing companies that are not subsidiaries of commercial banks are not yet formally supervised though they are registered with the Ministry of Commerce. Moreover, the amount of loans from such entities remained low, comprising only 3.66 percent of total private credits as of June 2014.
In addition, connectivity between these financial institutions and commercial banks was still limited. As of June 2014, connectivity in terms of borrowings and investments in bonds amounted to 6.87 percent and 1.41 percent of total commercial banking system’s assets, respectively. Meanwhile, connectivity in terms of deposits and investments in equities was merely 0.38 percent and 0.40 percent, respectively. (Chart 5)
In summary, private credits have recently slowed down in line with the economy.
Commercial banks are the key players, though non-banks have increased the role in private credit extension. Most non-banks are supervised and subjected to risk management mechanisms. Moreover, given the limited connectivity between these institutions and the commercial banking system, there was not yet a concern to the overall financial stability.

Financial Stability Report 2014 | 23
Chapter 2 : Risks to Current Financial Stability and Risk-mitigating Policy Implementation
Household debt accumulation that rose significantly during the last 2-3 years coupled with the economic slowdown resulted in fragilities in the household sector and deterioration of commercial banks’ loan quality. Nonetheless, the analysis showed that impact of risk from household debt on Thailand’s financial institutions system was still limited. However, higher debt burden could affect consumption, particularly for low-income households, which in turn could dampen economic growth, going forward. Moreover, impact of the economic slowdown on commercial banks’ loan quality was small. Meanwhile, there were signs of asset price speculation by retail investors, especially in the Market for Alternative Investment (mai).
2.1 Impact of Household Debt on Thailand’s Economic and Financial Stability Household debt (credits that financial institutions extend to households8) is important
for the economy as it is a mechanism to allocate capital to households for economic activities such as consumption, trade and investment. Thus, high growth of household debt may not be a source of concern in cases where debt accumulation is based on economic and financial fundamentals, for example, higher income or greater financial access. However, high level of household debt could cause households’ financial conditions to become susceptible to adverse factors such as an economic slowdown or an interest rate increase. During the last 2-3 years, accommodative monetary conditions following the global financial crisis led to high household debt growth in many countries, including developed countries like Australia and developing countries like Malaysia and South Korea.
For Thai households, there was continual accumulation of fragilities in recent periods both from higher debt and lower income in line with the economic slowdown, which in turn affected households’ debt servicing ability. During 2011 – 2012, household debt accelerated notably, expanding by 16.8 percent compared to an average of 12.8 percent during 2008 – 2012. The debt increase was due to (1) the government’s stimulus policies such as the first-car tax rebate scheme; (2) accommodative monetary conditions which were conducive to household debt accumulation as reflected by low interest rates; and (3) competition among financial institutions in retail lending. Since the growth of household debt during such period was much higher than the GDP growth, the ratio of household debt to GDP increased from 63 percent at
8 Household debt data used in the analysis included lending to households (resident individuals) by financial institutions, but excluding informal debt, lending from the Village Fund and lending as part of employee benefits

24 | Financial Stability Report 2014
Chart 2.1.1 Household debt
Source : Bank of Thailand
63.0
83.516.9
8.1
0
5
10
15
20
0102030405060708090
2010 2011 2012 2013 Q2 2014
Household Debt to GDPHousehold Debt Growth (RHS)
% of GDP %yoy
Chart 2.1.2 Household Debt classified by Loan types and by Institutions
Source : Bank of Thailand
By Instituions
41.6 42.4
32.0 29.1
14.8 15.2
8.0 10.93.3 2.3
0102030405060708090
100
2010 Q2 2014
Others
Leasing Companies, Credit card and Personal Loan Companiesfinance companies and credit fonciersSaving Coorperatives
SFIs
% 10.03 Trillion THB6.37 Trillion THB
0.2 0.03
Finance companies and credit fonciers
By Loan Types
29.8 26.4
13.3 17.26.1 5.819.8 16.9
14.8 15.2
12.7 16.23.3 2.3
0102030405060708090
100
2010 Q2 2014
Others
Business
Loan from Saving Coorperatives
Education and Vacation
Other Personal
Personal under Supervision+Credit Card
% 10.03 Trillion THB6.37 Trillion THB
0.10.2
the end of 2010 to 83.5 percent at the end of 2014 Q2, with household debt outstanding of 10.03 trillion baht. (Chart 2.1.1) The BOT thus monitored and assessed risks to the household sector continually at both the micro and macro levels. At the micro level, the BOT assessed the purposes of borrowings to determine whether debt accumulation would lead to an increase in assets or future income or was just personal expenditure, and whether debt accumulation would pose a risk to lending financial institutions. This micro-level study would then be linked to the macro analysis which aimed to determine if the increase in household debt would impact consumption and future economic growth.
Micro-level Risk Analysis of Household Debt
Analysis of household debt which could affect financial institutions revealed limited risk exposure because financial institutions, including commercial banks and their subsidiaries, SFIs and saving cooperatives that lent to households, were supervised by their respective authorities and subjected to internal risk management processes.
From borrowing purpose perspective, it was found that the increase in household debt was mostly for investment in assets such as housing, automobiles and business undertaking, accounting for 60 percent of total household debt, whereas debt incurred for personal expenditure accounted for 22.7 percent. Loans by saving cooperatives were granted for various purposes such as housing, automobiles, personal expenditure and business undertaking. Risks would therefore depend on the specific characteristics and markets of each type of loans, summarized as follows. (Chart 2.1.2)

Financial Stability Report 2014 | 25
Chart 2.1.3 Mortgage Loans
Source : Bank of Thailand
8.7 9.6
31.8
25.4 12.5
12.3
0
5
10
15
20
25
30
35
0200400600800
1,0001,2001,4001,6001,800
2012 2013 Q12014
Q22014
Q32014
2012 2013 Q12014
Q22014
Q32014
2012 2013 Q12014
Q22014
Q32014
%yoyBillion THB
Low-Rise Condominium Total
Mortgage Loans
2.6 2.8
1.1 1.3
2.3 2.5
1.7 1.8
0.8 0.8
1.5 1.6
0.0
0.5
1.0
1.5
2.0
2.5
3.0
3.5
0
10
20
30
40
50
60
70
80
2012 2013 Q12014
Q22014
Q32014
2012 2013 Q12014
Q22014
Q32014
2012 2013 Q12014
Q22014
Q32014
% to Total Mortgage LoansBillion THB
NPL SM
%NPL %SM
Low-rise Condominium Total
Mortgage Loan Quality
Mortgage Loans Systemic risk that could arise from mortgage loans was considered quite low as
reflected by stable loan quality since purchases were mostly from real demand for housing rather than speculation. Approximately 80 – 90 percent of mortgage loans approved by commercial banks since 2011 were for first homes. Moreover, mortgage loans are collateralized loans with an average loan-to-value ratio of 82 in 2014 and relatively stable growth overall. (Chart 2.1.3) Commercial banks’ mortgage loans for purchases of condominiums which expanded at a faster pace in recent periods were in part due to a change in consumers’ preference towards living as single families in condominiums close to mass transportation network. Nonetheless, the proportion of mortgage loans for condominium purchases accounted for only 2.2 percent of total household debt.

26 | Financial Stability Report 2014
Auto Loans Auto loans grew significantly, owing to the effect of the first-car tax rebate scheme,
causing the proportion of auto loans to total household debt to increase from 13.3 percent in 2010 to 17.2 percent in 2014 Q2. (Chart 2.1.2) However, once the scheme ended, auto loans began to slow down steadily until contracting by 6.6 percent (year-on-year) in 2014 Q3. Auto loans are collateralized loans where financial institutions could quickly reclaim the cars for debt repayment, should borrowers default on the loans. As a result, the NPL ratio for auto loans remained low in the past. However, deterioration in borrowers’ debt servicing ability particularly that of farmers, coupled with the slump in used cars caused the outstanding amount of debt to be higher than the car value. Thus, some debtors decided to forego the car and default on debt. Subsequently, the NPL ratio for auto loans edged up continually, especially for used car loans. (Chart 2.1.4)
Chart 2.1.4 Auto Loans
Note : Auto Loans extended by 10 Thai Commercial banks and their subsidiaries to retail customers Source : Bank of Thailand
(2.5)(4.7)
(13.9)(19.8)
(3.6)(8.1)
18.8 12.7
(3.0)(6.6)
-30-20-10010203040
- 200 400 600 800
1,000 1,200 1,400
Q4 Q1 Q2 Q3 Q4 Q1 Q2 Q3 Q4 Q1 Q2 Q3 Q4 Q1 Q2 Q3 Q4 Q1 Q2 Q3
%yoyBillion THBOutstanding amount and growth rate (%yoy)
New Cars First Cars Car for Cash TotalUsed Cars
2013 2013 2013 2013 20132014 2014 2014 2014 2014
1.4 1.50.7 0.8
5.35.9
1.4 1.52.3 2.5
01234567
- 5
10 15 20 25 30 35
Q4 Q1 Q2 Q3 Q4 Q1 Q2 Q3 Q4 Q1 Q2 Q3 Q4 Q1 Q2 Q3 Q4 Q1 Q2 Q3
%to Total Auto LoansBillion THBOutstanding amount and % of NPL
New Cars First Cars Car for Cash TotalUsed Cars
2013 2013 2013 2013 20132014 2014 2014 2014 2014
5.4 5.5 4.9 5.4
14.1 13.9
7.7 7.7 7.8 7.9
0246810121416
-
20
40
60
80
100
120
Q4 Q1 Q2 Q3 Q4 Q1 Q2 Q3 Q4 Q1 Q2 Q3 Q4 Q1 Q2 Q3 Q4 Q1 Q2 Q3%to Total Auto LoansBillion THB
Outstanding amount and % of SM
2013 2013 2013 2013 20132014 2014 2014 2014 2014
New Cars First Cars Car for Cash TotalUsed Cars

Financial Stability Report 2014 | 27
Chart 2.1.5 Personal Loans under Supervision and Credit Card Loans
Note : *Non-bank is financial institutions that are not under supervision of the BOT Source : Bank of Thailand
11.0 9.016.3
6.6
-15-10-50510152025
050
100150200250300350
200 2010 2011 2012 2013 Q32014
200 2010 2011 2012 2013 Q32014
Outstanding Amount and Percentage Growth YOY of Loan extended by Commercial and its subsidiaries and non-banks*
%yoy
Credit Card Loans Personal Loans Under Supervision
Billion THB
2.32.9
3.7
4.7
0.0
1.0
2.0
3.0
4.0
5.0
02468
10121416
200 2010 2011 2012 2013 Q32014
200 2010 2011 2012 2013 Q32014
NPL %NPL
Credit Card Loans Personal Loans Under Supervison
Billion THB
2.52.9
3.7 3.8
0.0
1.0
2.0
3.0
4.0
5.0
0
2
4
6
8
10
12
14
200 2010 2011 2012 2013 Q32014
200 2010 2011 2012 2013 Q32014
SM %SM
Credit Card Loans Personal Loans Under Supervision
Billion THB
Personal Loans under Supervision and Credit Card Loans Personal loans under supervision and credit card loans are uncollateralized loans
used for many purposes, for example, consumption and liquidity management. Thus, they incur relatively higher risk. Quality of these loans began to deteriorate following the economic slowdown. (Chart 2.1.5) Nonetheless, the effect on financial institutions stability was expected to be limited because these loans accounted for only 5.8 percent of total household debt.

28 | Financial Stability Report 2014
The impact of household debt on financial institutions stability was limited overall , based on the analysis result of household debt extended by commercial banks and their subsidiaries, SFIs and non-banks under supervision, which accounted for about 77 percent of total household debt. Growth of household debt already slowed down and financial institutions also tightened credit standards. Moreover, the majority of borrowings were for acquiring assets and for business undertaking. Subsequently, concern over debt servicing ability was eased to some extent. Existing consumer loans should not be significantly affected by an interest rate hike as installment amounts do not fluctuate with interest rates. However, the NPL ratio for auto loans and personal loans (including credit card loans) may increase for some periods before the economic recovery firms up.
Macro-level Risk Analysis of Household Debt The build-up of imbalance from acceleration in the household debt caused a concern
about its implication among policy makers and the general public. A macro analysis of risks from the household debt using data from the National Statistics Office’s household socio-economic survey9 revealed the followings. (1) The increase in debt affected consumption. By allowing a 10 percent increase in income for each household group, it was found that the group with increased Debt Service Ratio (DSR) in prior periods would need to allocate some of the income for debt repayment, resulting in significantly lower consumption growth compared to other groups. (Chart 2.1.6) (2) The high debt level led to stress. It was found that households with DSR of higher than 40 percent would become significantly stressed on their debt burden. (Chart 2.1.7) (3) The low-income household group would be more vulnerable than other groups due to high DSR. This could lead to a wide-spread social problem.
9 “Rising Household Debt: Implications for Macroeconomic Stability”, BOT Symposium 2014
Chart 2.1.6 Impact of 10% Increase in Income on Consumption of Indebted Household
Source: Muthitacharoen et al. (BOT Symposium 2014)
Low debt growth 3
(15%)
7.8
Medium debt growth 2
(22%)
6.7
High debt growth1
(17%)
5.4
Number in is % of household with debt allocated by level of Debt Service Ratio per household where household without debt is accounted for 46%
1 High debt growth is those households with DSR escalated by around 28% in 2011 from 20092 Medium debt growth is those Household with stable DSR in 2011 compared with 20093 Low debt growth is those Household with DSR reduced by around 23% in 2011 compared with 2009

Financial Stability Report 2014 | 29
In the short-run, the impact of household debt on the financial institutions system
was limited and the recovering economic prospect in 2015 would help improve households’ financial conditions. However, the elevated debt level could negatively affect consumption and economic growth in the next periods and cause households to become more susceptible to shocks compared to the past, particularly if households continue to face downside pressure on income from uncertain economic conditions. Thus, prevention and resolution of household debt problem required cooperation from all parties in promoting financial discipline among households as well as encouraging savings and reducing unnecessary debt accumulation. In this regard, the government should emphasize on policies that would support sustainable economic growth along with development of households’ production capacity to sufficiently increase household income. Moreover, it should promote social safety nets and access to basic insurance products for households in order to help absorb shock on household income during unemployment, illnesses or other unforeseen events.
The BOT has developed infrastructures to help manage risks from household debt, including the development of household financial data to aid financial institutions in risk assessment and to formulate appropriate policies. In this regard, the BOT has encouraged saving cooperatives to become members of the National Credit Bureau (NCB), and continually promoted financial literacy among the general public in various aspects, for example, providing knowledge on effective interest rate calculation and necessary information to help them make informed decisions, as well as carrying out saving campaigns. These efforts would help strengthen households’ ability to deal with future economic risks.
Chart 2.1.7 Household with DSR of more than 40% would become highly stressed out about their debt burden
Source : The Household Socio - Economic Survey , National Statistical Office Calculations by the Researchers of topic “Rising Household Debt: Implications for Macroeconomic Stability” in the BOT symposium 2014
21
23
24
23
25
28
29
27
33
35
37
35
32
34
35
34
34
37
38
37
20 25 30 35 40
Agricultural
Business
Salaried
Retiree
Non-Agricultural
Business
DSR<20%
DSR>=80%
20%<=DSR<40%
60%<=DSR<80%
40%<=DSR<60%
%
Insignificant Concern Significant Concern

30 | Financial Stability Report 2014
2.2 Impact of the Economic Slowdown on Commercial Banks’ Loan Quality
The domestic economy is one of the key factors that affect commercial banks’ loan quality because commercial banks are the main providers of credits for both the corporate and household sectors in the country. In general, signs of deterioration in loan quality would begin to show after the economy has slowed down for some periods, but this would also depend on debtors’ financial strength and commercial banks’ risk management, especially debtors’ income generation capacity, ability to adjust to financial conditions, and commercial banks’ efforts to monitor and assist customers. In this regard, the economic slowdown which began since the political situation at the end of 2013 had affected debt servicing ability of both the corporate and household sectors. Commercial banks’ loan quality during the first 9 months of 2014 deteriorated slightly. NPL recorded at 294.1 billion baht, rising by 28.4 billion baht or 10.7 percent from the end of 2013. The NPL ratio registered at 2.3 percent, edging up from 2.2 percent. The ratio of special mention loans stood at 2.5 percent, increasing from 2.4 percent. (Chart 2.2.1)
The impact of the economic slowdown on commercial banks’ overall loan quality remained intact due to various factors as follows.
(1) Despite the gradual economic slowdown, owing to the political problem, the situation began to improve after establishment of the National Legislative Assembly of Thailand by the Cabinet. The economy was expected to pick up next year after a slower-than-expected recovery in 2014 Q3, with the main momentum coming from public investment which would lead to crowding-in effect and exports which would improve following the global economic recovery.
Chart 2.2.1 NPL of Banking System
SM of Banking System
Source : Bank of Thailand
0
1
2
3
4
5
6
7
0
100
200
300
400
Mar10
Sep Mar11
Sep Mar12
Sep Mar13
Sep Mar14
Sep
Thousands
NPL Corporate NPL Consumer% NPL Total Loan % NPL Large Corporate% NPL SME % NPL Consumer
% to Total LoanBillion THB
0
1
2
3
4
5
6
7
0
100
200
300
400
Mar10
Sep Mar11
Sep Mar12
Sep Mar13
Sep Mar14
Sep
Thou
sand
s
SM Corporate SM Consumer % SM Total Loan % SM Large% SM SME % SM Consumer Loan
% to Total LoanBillion THB

Financial Stability Report 2014 | 31
(2) The corporate and household sectors’ ability to adjust themselves and their financial conditions was satisfactory overall. The corporate sector retained financial strength and high liquidity (average net profits and current ratio of listed companies stood at 5.2 percent and 1.5, respectively). Although some large corporates incurred more debt to undertake acquisitions and overseas business expansions. At the same time, the household sector continued to maintain assets more than two times of its debts, while the unemployment rate remained low.
(3) Commercial banks had effective risk management, focusing on debt monitoring and implementing measures to assist customers closely and continually, including debt rescheduling and restructuring for viable debtors. Moreover, commercial banks were well experienced in debt management from the 1997 financial crisis, the 2009 global financial crisis, and the 2011 severe floods. Commercial banks also maintained high level of loan loss provision.
Nevertheless, debt servicing ability of certain groups of debtors deteriorated notably, for example, debtors with domestic consumption-related businesses, particularly small businesses, and retail debtors with personal loans and used car loans. Moreover, loan quality of debtors undergone rescheduling and restructuring would need to be monitored to assess whether debt servicing ability would return to normal. Details are as follows.
1. Debtors with domestic consumption-related businesses were significantly impacted by the economic slowdown. (Chart 2.2.2) These included real estate debtors, especially those in the housing development and apartment rental businesses as some consumers postponed buying decision while others switched to buying condominiums instead of renting apartment units. Some small shopping complexes also faced difficulty in debt repayment due to inadequate
Chart 2.2.2 Corporate Loan Quality NPL
SM
Source : Bank of Thailand
0
2
4
6
8
10
12
14
Mar10
Sep Mar11
Sep Mar12
Sep Mar13
Sep Mar14
Sep
Manufacturing CommercePublic Utilities ServicesReal Estate+Construction
% to Loan
0
2
4
6
8
Mar10
Sep Mar11
Sep Mar12
Sep Mar13
Sep Mar14
Sep
Manufacturing CommercePublic Utilities ServicesReal Estate and Construction
% to Loan

32 | Financial Stability Report 2014
income as a result of consumers’ more cautious spending behavior. Commerce debtors, particularly wholesale food and beverage traders were not only affected by the economic slowdown but also a structural change involving regional network expansions of large wholesale and retail trade businesses. As a result, these businesses could reach consumers directly, thereby lessening the role of other middle men. SME businesses were affected more than large corporates due to low capital and ability to adjust to adverse economic conditions as shown by the increase in NPL ratio for SME loans from 3.3 percent to 3.4 percent, whereas NPL ratio for large corporate loans declined from 1.2 percent to 1.1 percent. Thus, commercial banks paid particular attention to monitoring of SME customers in this period.
2. The quality of retail loan deteriorated for all categories following debt accumulation in the previous periods (Chart 2.2.3), but personal loans (including credit card loans) and used car loans were affected more. NPL ratios of personal loans, credit card loans, and used car loans were high at 3.0 percent, 3.7 percent and 5.9 percent, respectively. NPL ratio of mortgage loans edged up slightly to 2.5 percent. (Reasons for deterioration of personal loans, credit card loans, and used car loans are in 2.1)
The BOT had closely supervised the banking system, focusing on credit risk and credit standards, since lending represented the main activity of the Thai commercial banks. Thematic examinations were conducted on loan portfolios with significant risk that could affect overall financial institutions system. Commercial banks were also instructed to carry out stress test to regularly prepare for potential crisis situations. For example, in 2013, commercial banks carried out stress test under a QE tapering scenario, while in 2014, a political unrest and domestic economic slowdown scenarios were used. (Details in Box 2: Stress testing framework)
Chart 2.2.3 Consumer Loan Quality NPL
SM
Source : Bank of Thailand
0
1
2
3
4
5
6
Mar10
Sep Mar11
Sep Mar12
Sep Mar13
Sep Mar14
Sep
Housing Credit Card Personal Car
% to Loan
0
2
4
6
8
10
Mar10
Sep Mar11
Sep Mar12
Sep Mar13
Sep Mar14
Sep
Housing Credit Card Personal Car
% to Loan

Financial Stability Report 2014 | 33
Chart 2.3.1 Regional Stock Indices
Source : The Stock Exchange of Thailand and Bloomberg
.0 0. .0101. 10 .0112. 11 .012 . 12 .01 4. 140.0
2 -D
ec-1
14-Ja
n-14
1-Fe
b-14
1 -F
eb-14
-M
ar-14
2 -M
ar-14
14-A
pr-14
2-M
ay-14
20-M
ay-14
-Ju
n-14
2 -Ju
n-14
1 -Ju
l-14
1-Ju
l-14
1 -A
ug-14
-Se
p-14
2 -S
ep-14
11-O
ct-14
2 -O
ct-14
1 -N
ov-14
4-De
c-14
22-D
ec-14
Thailand Indonesia MalaysiaKorea Singapore PhilippinesIndiaIndex
(2 Dec 1 =100)
Chart 2.3.2 Regional P/E Ratio
Source : The Stock Exchange of Thailand and Bloomberg
12
14
1
1
20
22
24
1-Jan
-142
-Jan-14
14-F
eb-14
-M
ar-14
0-M
ar-14
21-A
pr-14
1 -M
ay-14
4-Ju
n-14
2 -Ju
n-14
1 -Ju
l-14
-Au
g-14
1-A
ug-14
22-S
ep-14
14-O
ct-14
-No
v-14
2 -N
ov-14
1 -D
ec-14
Thailand Indonesia Malaysia
Singapore Philippines Indiatimes
Chart 2.3.1 Regional Stock Indices
Source : The Stock Exchange of Thailand and Bloomberg
.0 0. .0101. 10 .0112. 11 .012 . 12 .01 4. 140.0
2 -D
ec-1
14-Ja
n-14
1-Fe
b-14
1 -F
eb-14
-M
ar-14
2 -M
ar-14
14-A
pr-14
2-M
ay-14
20-M
ay-14
-Ju
n-14
2 -Ju
n-14
1 -Ju
l-14
1-Ju
l-14
1 -A
ug-14
-Se
p-14
2 -S
ep-14
11-O
ct-14
2 -O
ct-14
1 -N
ov-14
4-De
c-14
22-D
ec-14
Thailand Indonesia MalaysiaKorea Singapore PhilippinesIndiaIndex
(2 Dec 1 =100)
Moreover, the BOT together with the government and commercial banks pushed for implementation of measures to alleviate impact from the economic slowdown, including supporting financial access for SMEs which are the key driver of economic growth of the country. (Details in Box 3: Measures to support SMEs by the Bank of Thailand and commercial banks)
2.3 Risk from High Growth of Small Equities’ Market Capitalization Accommodative monetary policy stance
continued to be crucial to support economic recovery. However, prolonged low interest rate environment could increase investors’ appetite for risky assets in search for higher returns. In particular, signs of overheating in the stock markets began to raise a concern over investors’ risk underpricing, which could lead to a build-up of asset price bubble. Should prices decline, investors could be impacted through the wealth effect.
Assessment of the SET index showed a continual increase in the beginning of 2014 mostly from local investors’ demand. The trend was evident although Thailand periodically faced with volatility from various factors, including the domestic political situation, net sell by foreign investors, the U.S. economic and monetary policy outlook, geopolitical risk and the decline in oil prices towards the end of the year.
The increase in SET index was in tandem with higher regional stock market indices (Chart 2.3.1) and PE ratio of the SET remained close to those of regional countries. (Chart 2.3.2)
However, there were signs of increasing speculation by retail investors as reflected by the proportion of trade by retail investors that began to rise since the beginning of 2014, reaching 2/3 of total trade (SET and mai combined) in the third quarter. (Chart 2.3.3) This development in part led to an increase in the market indices. In particular,
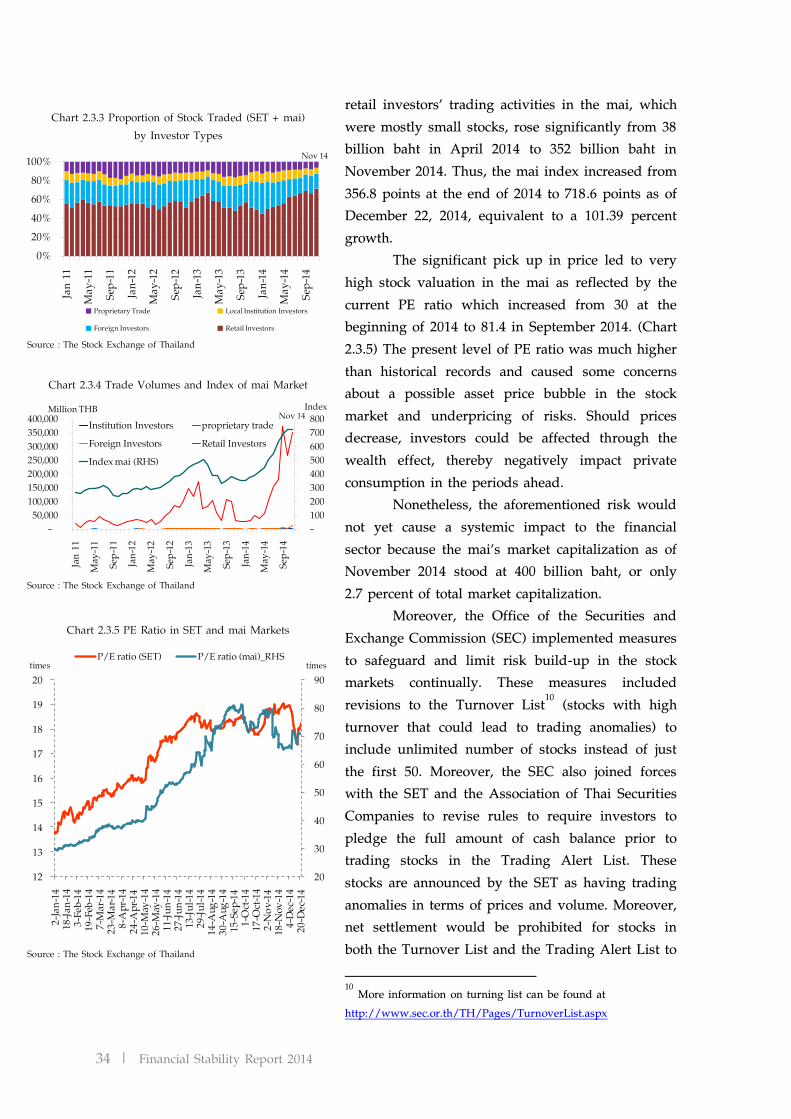
34 | Financial Stability Report 2014
Chart 2.3.3 Proportion of Stock Traded (SET + mai) by Investor Types
Source : The Stock Exchange of Thailand
0%20%40% 0% 0%100%
Jan 11
May
-11Se
p-11
Jan-12
May
-12Se
p-12
Jan-1
May
-1 Se
p-1
Jan-14
May
-14Se
p-14
Proprietary Trade Local Institution Investors
Foreign Investors Retail Investors
Nov 14
Chart 2.3.4 Trade Volumes and Index of mai Market
Source : The Stock Exchange of Thailand
- 100 200 00 400 00 00 00 00
- 0,000 100,000 1 0,000 200,000 2 0,000 00,000 0,000 400,000
Jan 11
May
-11
Sep-11
Jan-12
May
-12
Sep-12
Jan-1
May
-1
Sep-1
Jan-14
May
-14
Sep-14
Institution Investors proprietary tradeForeign Investors Retail Investors Index mai (RHS)
Million THB IndexNov 14
Chart 2.3.5 PE Ratio in SET and mai Markets
Source : The Stock Exchange of Thailand
20
0
40
0
0
0
0
0
12
1
14
1
1
1
1
1
20
2-Jan
-141
-Jan-14
-Fe
b-14
1 -F
eb-14
-M
ar-14
2 -M
ar-14
-Ap
r-14
24-A
pr-14
10-M
ay-14
2 -M
ay-14
11-Ju
n-14
2 -Ju
n-14
1 -Ju
l-14
2 -Ju
l-14
14-A
ug-14
0-A
ug-14
1 -S
ep-14
1-Oc
t-14
1 -O
ct-14
2-No
v-14
1 -N
ov-14
4-De
c-14
20-D
ec-14
P/E ratio (SET) P/E ratio (mai)_RHStimestimes
retail investors’ trading activities in the mai, which were mostly small stocks, rose significantly from 38 billion baht in April 2014 to 352 billion baht in November 2014. Thus, the mai index increased from 356.8 points at the end of 2014 to 718.6 points as of December 22, 2014, equivalent to a 101.39 percent growth.
The significant pick up in price led to very high stock valuation in the mai as reflected by the current PE ratio which increased from 30 at the beginning of 2014 to 81.4 in September 2014. (Chart 2.3.5) The present level of PE ratio was much higher than historical records and caused some concerns about a possible asset price bubble in the stock market and underpricing of risks. Should prices decrease, investors could be affected through the wealth effect, thereby negatively impact private consumption in the periods ahead.
Nonetheless, the aforementioned risk would not yet cause a systemic impact to the financial sector because the mai’s market capitalization as of November 2014 stood at 400 billion baht, or only 2.7 percent of total market capitalization.
Moreover, the Office of the Securities and Exchange Commission (SEC) implemented measures to safeguard and limit risk build-up in the stock markets continually. These measures included revisions to the Turnover List10 (stocks with high turnover that could lead to trading anomalies) to include unlimited number of stocks instead of just the first 50. Moreover, the SEC also joined forces with the SET and the Association of Thai Securities Companies to revise rules to require investors to pledge the full amount of cash balance prior to trading stocks in the Trading Alert List. These stocks are announced by the SET as having trading anomalies in terms of prices and volume. Moreover, net settlement would be prohibited for stocks in both the Turnover List and the Trading Alert List to 10 More information on turning list can be found at http://www.sec.or.th/TH/Pages/TurnoverList.aspx

Financial Stability Report 2014 | 35
prevent speculation from frequent intra-day trading without cash, effective from January 1, 2015, onwards. These measures were assessed to help contain risks associated with speculation in small stocks.
Summary Three key risks to financial stability in the
current period, included (1) elevated household debt; (2) effect of the economic slowdown on commercial banks’ loan quality; and ( ) overheating in small stocks. Nonetheless, these risks were yet to affect overall stability in the current period. Looking ahead, with more steady economic recovery, the problems of household debt and commercial banks’ loan quality should lessen accordingly. The authorities’ measures to be in effect should help cool down overheating in the mai. Nonetheless, there was a need to monitor investors’ behavior in risky assets under the low interest rate environment, which could lead to other financial imbalances in the periods ahead.

36 | Financial Stability Report 2014
Box 2 : Stress testing Framework Financial crises that occurred time again, whether the Asian crisis in 1997 or the
Hamburger crisis in the U.S. in 2007 – 2008, reflected an important lesson that preparation for potential shocks in the past may be inadequate as well as reminding policymakers of the importance in devising necessary plans to lessen the impact of potential adverse events on the Thai financial sector.
Stress test is one of the important risk management tools that help financial institutions to take into account future risks in a forward looking manner, thereby helping financial institutions to prepare for potential adverse events that could arise. The test utilizes probable adverse scenarios to assess the impact and ability of financial institutions in managing such risks. Moreover, stress test has become increasingly important for business purpose as financial institutions may use it to analyze and determine an acceptable level of risk associated with new business expansions.
International regulatory bodies utilize stress test as a means to assess stability of individual financial institutions and the financial system. For instance, the Fed used stress test to assess the U.S. financial system’s strength after the global financial crisis in 2007-2008 while the European Banking Authority (EBA) conducted EU-wide stress test to assess European banks’ financial strength.
1. Stress test in Thailand The BOT started to develop stress test as a financial institution supervisory tool in
2006 during the Financial Sector Assessment Program (FSAP), which was a collaboration between the International Monetary Fund (IMF) and the World Bank. Subsequently, the BOT have conducted stress test on key events that could affect financial institution stability, including impact analysis of the Hamburger crisis in 2007, impact analysis of foreign bank branches’ liquidity in 2009, impact analysis of reduction of deposit protection amount on financial institutions’ liquidity in 2011, impact analysis of the severe floods on SME debtors in 2011, and impact analysis of QE tapering in 2013. Moreover, the BOT instructed commercial banks to conduct stress test on banks’ key risks on an annual basis in order to assess financial strength and readiness to deal with the various risk scenarios.
In 2014, the BOT instructed Thai commercial banks to assess potential impact of the political situation and domestic economic slowdown, assuming that GDP would contract by 2 percent. Results showed that financial strength of Thai commercial banks was sound overall, enabling them to withstand potential vulnerabilities that could arise.
Other regulatory bodies in Thailand such as the SEC and the Office of Insurance Commission (OIC) also recognize the crucial benefit of stress test and utilize it as a supervisory tool for companies under supervision.

Financial Stability Report 2014 | 37
2. Stress test Implementation According to international practices, stress test is designed to assess impact of
three key risks of financial institutions, namely (1) credit risk, (2) market risk, and (3) liquidity risk. The impact from market risk and liquidity risk would chiefly depend on changes in asset prices and liquidity management, while the impact from credit risk would be subjected mainly to quality of debtors. Stress test implementation involves the following key steps.
2.1 Formulation of risk scenario. Normally, this would be in line with changes of the macro factors that could affect financial institutions’ conditions. For instance, credit risk could be referenced to the severe floods that affect GDP growth, unemployment rate or the yield curve, which could subsequently affect the quality of debtors, and resulting in repercussions on financial institutions.
2.2 Test methodology. In general, there are 2 stress test methodologies, namely (1) top down analysis which assesses impact on the overall portfolio; and (2) bottom up analysis which assesses risks on individual debtors or individual financial institutions. Selection of test methodology depends mainly on the characteristics of the portfolio. For example, for a credit risk stress test, bottom up analysis would be more appropriate for large and medium-sized corporate as it would allow assessment of potential impact on each individual debtor more clearly. For the retail portfolio such as mortgage loans, leasing, credit card loans or personal loans, the number of debtors is large and the outstanding debt amounts are quite homogenous, thus top down analysis would be more convenient and appropriate.
2.3 Measurement. Each risk scenario could affect financial institutions in various dimensions. Assessment on a particular dimension should be able to clearly address the test objectives. For example, assessment of financial institutions’ financial strength may refer to impact on profit and loss, capital adequacy, NPLs and loan loss provision. 3. Benefits of Stress test
Implementation of stress test should consider the severity level of risk scenarios and the size of potential impact. Supervisors could use stress test to assess financial institutions stability, for example, as information to support formulation of relevant policies. For financial institutions, stress test results could be used in risk management, for example, to reduce portfolio exposure, to adjust portfolio structure, to tighten credit standards, as well as to devise contingency plans to address potential adverse effects.
In summary, stress test may be a good tool to assess potential negative impact that could arise in the future. However, stress test results form only one part of information to support decision makings that would help an organization make necessary preparations. In fact, good plan formulation and effective implementation are keys to help an organization pull through any crisis and achieve sustainable growth.

38 | Financial Stability Report 2014
Box 3 : Measures to Support SMEs by the Bank of Thailand and Commercial Banks
Small and Medium Enterprises (SMEs)11 play a crucial role in driving the Thai economy. At the end of 2013, SMEs’ economic activities accounted for 37 percent share of GDP, 26 percent share of exports and 80 percent share of employment, which was equivalent to 11.4 million persons12. The government has thus included SME promotion and support as a national agenda, with the aim to reduce restrictions, problems and obstacles for SME businesses and develop capacity of SMEs to be able to compete at the domestic and regional levels. The BOT also plays a role in supporting the government policy through increasing SMEs’ access to finance from commercial banks. The effort aligns with the BOT strategies to encourage financial institutions to respond to the real sector’s needs more effectively and to facilitate businesses and individuals in accessing financial services more inclusively. 1. Challenges for SMEs
Given limited capital and resources, SMEs encounter various business problems and obstacles, notably lack of management and marketing skills, innovation, technology and financial access, which are crucial to their competitiveness, survival ability and business growth. Important causes of SMEs’ limited financial access are inadequate capital and collateral, or incomplete financial records. Commercial banks tend not to approve credits to SMEs with these problems, resulting in slow growth and lack of immunity to economic vulnerabilities, competition and trade liberalization. Therefore, rectification of these obstacles would help enhance competitiveness of Thai SMEs which are amongst the key drivers of the economy. 2. Measures to support SMEs by the BOT and commercial banks
Since 2009, the BOT in collaboration with the government and commercial banks, have implemented various measures to increase SMEs’ access to finance and help alleviate impact of the various crises on SMEs, as follows.
2.1 Short-term measures. The BOT requested collaboration from commercial banks to provide short-term support to SMEs, namely,
(1) Financial assistance, for example, debt restructuring, credit limit increase to provide additional liquidity, lowering interest rates and fees, and rescheduling payment terms to assist capable SMEs facing short-term liquidity problems from adverse events such as natural disaster and political situation.
(2) Waiving loan-related fees, for example, prepayment fee and front-end fee, until the end of 2014.
(3) Waiving fee on credit guarantee by the Thai Credit Guarantee Corporation (TCG) to help lessen burden on SMEs during the economic slowdown.
11 Definition of SMEs is in line with that stipulated in the Ministerial Regulation on employment and valuation of fixed assets of SMEs B.E. 2545 12 Source: Office of Small and Medium Enterprises Promotion (information at the end of 2013)

Financial Stability Report 2014 | 39
Table 1 : Portfolio Guarantee Scheme (PGS) by Thai Credit Guarantee Corporation (TCG)
Source : Thai Credit Guarantee Corporation
PSGTotal Credit (Million THB)
PGS 1(Mar 0 - Mar 10)
30,000
PGS 2(Apr 10 - Mar 11)
30,000
PGS 3(May 11 - Dec 11)
36,000
PGS 4(Jun 12 - Dec 12)
24,000
PGS 5 (Feb 1 - Dec 1 )
240,000Year 201 0,000Year 2014 0,000Year 201 100,000
Chart 1 SME Loan
Source : Bank of Thailand
0
1,000
2,000
3,000
4,000
5,000
2553 2554 2555 2556 . . 57
Billion THB
+14.6%+14.4%
+14.5% +4.7%
+7.4%
2010 2011 2012 2013 Sep 2014
Chart 2 Structure of SME Loan
Source : Bank of Thailand
Agriculture2%
Manufacturing2 %
Commerce(Wholesaleand retail )
1%
Financial Business1 %
Construction %
Real Estate %
Public Utilities %
Services10%
Other 1%
2.2 Long-term measures to support capable SMEs to achieve sustainable growth, including:
(1) Development of SME data. Commercial banks have been cooperating with the BOT in providing credit information on individual SMEs since October 2014. The information would be used to build SME lending database and the BOT would compile system-wide information and provide the aggregate data back to commercial banks to be used in strategy formulation, credit expansion plan and management of related risks.
(2) Promotion of risk mitigation. The BOT organized training sessions to educate and support SMEs in hedging foreign exchange risk as well as widen coverage of credit guarantee by the TCG to cover the amount that is subjected to foreign exchange risk, in addition to normal credit line.
(3) Push for enactment of the Business Security Act , which would increase the types of assets that SMEs could pledge as collateral when applying for credits. At present, the law is under review by the National Council for Peace and Order.
(4) Facilitate credit guarantee by the TCG, to support SMEs with inadequate collateral to improve access to credits. The BOT pushed for implementation of a Portfolio Guarantee Scheme (PGS) since 2009, which became very successful. To date, the TCG has already implemented five PGS programs. (Table 1)
Given the BOT’s efforts on this front along with support from financial institutions and the government, SMEs have been able to improve financial access as reflected by commercial banks’ SME loan which expanded at 14 – 15 percent per annum during 2011 – 2013 as well as the number of SME customers which edged up from 960,000 accounts in 2010 to 1.2 million accounts at present. Total SME credits amounted to 4.1 Trillion baht, the majority of which was for commerce business (31 percent) followed by manufacturing (23 percent). (Charts 1 and 2)

40 | Financial Stability Report 2014

Financial Stability Report 2014 | 41
Chart 3.1.1 Liquidity in global financial market
ที : Institute of International Finance (IIF)
Selected AE Central Bank Balance Sheet : Total Asset
Chapter 3 : Risks to Financial Stability in the Medium-term and Policy Implication
Risks to financial stability in the medium-term could stem from both the global economy and the domestic economic structure. Risk from the global economy could stem from divergence in economic recovery and monetary policy implementation of major economies that would result in volatility in Asian financial markets, including potential for capital outflows. However, given strong economic fundamentals of the Asian EMEs, it was expected that impact on the region including the Thai economy would not be severe. Meanwhile, risk could stem from the fiscal sector. Though this would not raise a concern in the short-term, fiscal risk could heighten in the long-term given the revenue collection capability that is relatively stable and could potentially decline in the future amid rising expenditure especially due to the aging population.
3.1 Recovery and Monetary Policy Divergence of Major Economies : Impact on Asian Financial Markets
Differences in the pace of economic recovery of major economies caused their respective central banks to have divergent monetary policies. In particular, the Fed and the Bank of England announced the end of asset purchase programs and were set to increase policy rates in the near-term, given steady recovery in both economies. Meanwhile, the ECB and the Bank of Japan had to ease monetary policies further as their economies remained fragile. (Chart 3.1.1)
Divergence in economic recovery and monetary policy implementation of major
economies could give rise to volatility in the Asian and Thai financial markets along with capital outflows. Although the impact is expected to be small compared to that on EMEs in other regions owing to strong economic fundamentals of the Asian EMEs including Thailand, caution must still be exercised on risks that could stem from investors’ responses to major economies’ monetary policy implementation, particularly in the U.S. Furthermore, there was possibility that a faster and more severe-than-expected change in liquidity in the global financial markets could arise.

42 | Financial Stability Report 2014
Chart 3.1.2 Economic fundamentals of emerging markets in Asia
Source : Worlds Economic Outlook Report (October 2014)
02468
10
EM Asia EM Europe EM Latin
Avg. 2011-13 2014 2015
% Inflation
0
2
4
6
8
EM Asia EM Europe EM Latin
Avg. 2011-13 2014 2015
%yoy GDP Growth
-4
-2
0
EM Asia EM Europe EM Latin
Avg. 2011-13 2014 2015
% of GDP Government Balance
-6
-4
-2
0
2
EM Asia EM Europe EM Latin
Avg. 2011-13 2014 2015% of GDP Current Account Balance
Chart 3.1.3 External Debt Classified by Region
Source : Spillover Report 2557, IMF
Banking Sector External Debt ( 2013) Corporate Sector Debt ( 2013)
Asia Latin America Europe
Asia Latin America Europe
Regional Average
External Debt in Banking Sector (201 ) Debt in Corporate Sector (201 )
Chin
aIn
dia
Indo
nesia
Mala
ysia
Phili
ppin
esTh
ailan
d
Arge
ntin
aBr
azil
Mex
icoPe
ru
Bulg
aria
Hun
gary
Polan
dRu
ssia
Turk
ey Chin
aIn
dia
Indo
nesia
Mala
ysia
phili
ppin
esTh
ailan
d
Arge
ntin
aBr
azil
Mex
icoPe
ru
Bulg
aria
Hun
gary
Polan
dRu
ssia
Turk
ey
(% to Total Asset)External DebtCapital Market’s Domestic DebtCommercial Banks’ Domestic Debt
(% to GDP)
Against the backdrop of uncertain global
economic prospect and divergence in monetary policy implementation, going forward, investors would become more selective and increase risk diversification by looking closely at economic fundamentals of investment destination countries. Thus, it was expected that financial markets in the Asian EMEs would be less impacted than those in EMEs of other regions because of the relatively stronger fundamentals the of Asian economies as reflected by (1) economic growth; (2) financial stability; and (3) fiscal and current account positions. (Chart 3.1.2)
Moreover, even with capital outflows from the Asian EMEs, the impact on the regional financial sector would not be significant because the Asian EMEs’ financial and business sectors had less reliance on foreign borrowings compared to EMEs of other regions, as reflected by the relatively lower external debt. (Chart 3.1.3) External stability of the Asian EMEs had improved compared to EMEs of other regions, as reflected by the significant increase in international reserves from 1997. At present, international reserves of the Asian EMEs stood between 2 – 7 times their short-term external debt (Chart 3.1.4), higher than the World Bank’s benchmark and enough to withstand shocks from capital outflows.
For Thailand, the economic fundamentals were not deemed to be at high risk, particularly stability of the external sector which continued to be strong13, as reflected by the ratio of international reserves to short-term external debt at 2.3, the ratio of external debt to GDP at 39 percent, and the ratio of current account to GDP at 3.0 percent (preliminary data as of September).
In addition, the Thai financial markets should be able to adjust relatively well to changes in capital flows, in part as a result of lower 13 Source: IIF October 2014

Financial Stability Report 2014 | 43
Chart 3.1.4 External sector indicators in Asia countries
Source: BIS, CEIC, Citi, IMF, World Bank and official sources
Int’l Reserves(USD bn)
Reserve over short-term debt
External Debt/GDP (%)
1996 Sep 2014 1996 Q2/2014 1996 Q2/2014
Criteria > 1 time 4 - 0%
Indonesia 19.4 111.2 n/a 2.1 49 38.3
India 22.3 318.43 n/a 3.1 23.4 22.6
Malaysia 27.9 127.3 n/a 3.2 n/a 67.9
Thailand 38.7 161.6 0.8 2.3 59.8 38.7
Philippines 11.8 79.6 22 7.4 48.1 21.5
Singapore 72.9 266.1 n/a n/a n/a n/a
SouthKorea 34.2 364.4 0.5 2.7 27.1 32.3
proportion of foreign investment compared to other countries in the region. The proportion of foreign holdings of bonds in the Thai market amounted to approximately 10 percent as of December 18. Furthermore, foreign investors had been reducing their investment in Thai financial assets since the end of 2013 due to the political situation. Meanwhile, demand from local investors should also be able to cushion some impact from the decline in foreign demand.
In summary, despite stability and relatively stronger fundamentals of Asian EMEs that would lessen impact from adverse development in capital flows and financial markets, risks from slower-than-expected global economic recovery remained, especially when the major economies still experience structural problems. There are also risks from financial market volatility stemming from diverged monetary policy, possible repricing of risks, capital outflows due to the U.S. dollar appreciation and expectation of fed funds rate increase, and faster and more severe-than-expected change in global liquidity conditions14. Therefore, the authorities should stand ready to deal with the economic impact and potentially higher financial market volatility by implementing policies aimed at striking a balance between growth and economic and financial stability, both domestically and externally, as well as keeping continual cooperation and communication with major economies in order to formulate policies appropriately.
14 Repricing of risk or risk repricing refers to an upward evaluation of risk in investors’ financial asset risk assessment, resulting in demand for higher yield for such investment. This generally occurs in times of higher financial market volatility or lower global market liquidity compared to previous periods, which could lead to adjustment in asset allocation.

44 | Financial Stability Report 2014
3.2 Fiscal Risk from Structural Problem Fiscal risk in the short-term was not yet a
concern as public debt was still well within the threshold for fiscal sustainability. However, risk in the long-term would become eminent due to structural problems on both the revenue and expenditure sides. Fiscal structural reform would thus enhance fiscal sustainability in the long-term.
In the fiscal year 2014, the fiscal deficit deepened from 2.1 percent of GDP to 2.7 percent of GDP, with the budgetary deficit accounting for 2.6 percent of GDP and non-budgetary deficit 0.1 percent of GDP. (Chart 3.2.1) The widened budgetary deficit stemmed from revenue shortfall as net revenue amounted to approximately 2 trillion baht, lower than its target at 2.3 trillion baht, owing to the greater-than-expected economic slowdown and postponement of excise tax increase for fuel.
The public debt to GDP ratio as of September 2014 stood at 47.2 percent, rising from the beginning of the fiscal year (Chart 3.2.2) but remained within the threshold for fiscal sustainability of 60 percent of GDP. The outstanding amount of public debt recorded at 5.7 trillion baht, increasing by 260 billion baht from the last fiscal year due to (1) increase in domestic debt owing to budget deficit financing and credit guarantees for SFIs’ implementation of government policies, particularly the rice pledging scheme in the production year 2013 – 2014; and (2) increase in external debt owing mainly to changes in foreign exchange rate.
Nonetheless, fiscal deficit has been increasing notably since 2008 and was likely to deteriorate further in the long-term due to the structural problems. Capacity of government revenue collection has been stable and could potentially decline in the long-term if the government continues to employ tax measures to stimulate the economy, for example, the reduction in corporate income tax rate, the extension of the reduced VAT rate of 7 percent, and other tax incentives such as personal and corporate income tax
Chart 3.2.1 Government Budget Balance
Note : Non-budget Balance includes (1) TKK Program, (2) Water
Management Plan ,and (3) Development Policy Loan DPL Source : Public Debt Management Office and Bureau of the Budget,
calculations by Bank of Thailand.
- .0-4.0- .0-2.0-1.00.01.0
2004
200
200
200
200
200
2010
2011
2012
201
2014
2
Non-budget Balance
Budget Balance
% to GDPProjection
Chart 3.2.2 Public Debt to GDP
Source : Public Debt Management Office
%
41.240.
41. 42.
4 .14 .
44. 4 .4 4 .
4 . 4 . 4 . 44.144.1
44.444. 44. 44. 44.244.
4 . 4 . 4 . 4 .
4 . 4 .24 . 4 .
4 . 4 .1
4 . 4 . 4 .2
4042444 4
Jan 2012
Apr12
Jul12
Oct12
Jan201
Apr1
Jul1
Oct1
Jan2014
Apr14
Jul14
Sep 14

Financial Stability Report 2014 | 45
exemption or reduction from the Board of Investment (BOI).
Meanwhile, government expenditure would likely to increase continually due to indispensable expenses which amounted to 50 percent of total expenditure, for example, wages and salaries and subsidies and transfers that the government needed to reimburse the government agencies for previously implemented government measures. As a result, the proportion of capital expenditure to total budget edged lower than 20 percent in recent years. Moreover, as Thailand would fully become aging society in 202015, whereby greater than 20 percent of the population would become 60 years old or older, the government would encounter a significant increase in social security expenses, including medical expenses as well as social security contributions to other programs such as senior citizen welfares.
Therefore, acceleration of the fiscal reform which was already initiated would be key to reducing risks to fiscal stability in the long-term. Plans for tax reform to increase government revenue should be expedited, for example, inheritance tax, land and building tax, VAT hike at an appropriate time, and enhancement of revenue collection efficiency and capacity. At the same time, expenditure reform should be addressed, especially non-budgetary and quasi-fiscal expenditures which would become fiscal burden in the future, for example, subsidies for SFIs for previous implementation of the government programs, as well as interest expenses from non-budgetary borrowings and credit guarantees for state enterprises. In this connection, the government should establish an audit process to review both budgetary and non-budgetary expenditures, as well as increase the proportion of capital expenditure to invest in necessary infrastructure which would help uplift the country’s future competitiveness.
15 Source: The United Nations’ data on structural changes in Thailand’s population (The 2012 revision)