financial soundness measurement and trend … · assistant professor, department of business...
TRANSCRIPT

European Journal of Business and Social Sciences, Vol. 4, No. 10, January 2016. P.P. 159 - 184 URL: http://www.ejbss.com/recent.aspx-/ ISSN: 2235 -767X
EUROPEAN JOURNAL OF BUSINESS AND SOCIAL SCIENCES
159
FINANCIAL SOUNDNESS MEASUREMENT AND TREND ANALYSIS OF COMMERCIAL
BANKS IN BANGLADESH: AN OBSERVATION OF SELECTED BANKS
Md. Abdul Kaium Masud
Assistant Professor, department of Business Administration, Noakhali Science and
Technology University, Sonapur- Noakhali, Bangladesh -3814,
Email: [email protected]
Md. Mahbubul Haq (Corresponding Author)
Lecturer, department of Business Administration, Noakhali Science and
Technology University, Sonapur- Noakhali, Bangladesh -3814,
Email: [email protected] Mobile: +88-01711063417
ABSTRACT he financial sector is one of the most significant sectors for any country, especially if a country is a developing in nature. In such an environment, banking sector plays the vital role to
strengthen the economic conditions. Economic growth and international business is increasing in Bangladesh and commercial banks especially private sectors play the major roles. Thus it becomes important to measure the financial soundness of the private banks in order to judge their respective position. The study was conducted to measure the financial soundness of selected private commercial banks of Bangladesh for the period 2006 to 2014. In this paper, an attempt was made to analyze the financial soundness and trend analysis of selected banks using different statistical tools and financial indicators. The study reveals that different financial indicators showed upward trends during the period 2006 to 2014. The study also made a rank of the selected commercial banks based on financial indicators. It was found that a bank with higher deposits, loans & advances, investments, branches, employees does not always mean that has better profitability performance. The research focused on general financial situation (Deposit, Loans & Advances, investment, income, ROA, ROE) forecasting through trend analysis of the historical data available from 2006 to 2014. The analysis also recommends measures that could be adopted by banks to ensure soundness in their operation. Key Words: Commercial Bank, financial soundness, trend analysis, growth, financial indicator, Bangladesh.
T

European Journal of Business and Social Sciences, Vol. 4, No. 10, January 2016. P.P. 159 - 184 URL: http://www.ejbss.com/recent.aspx-/ ISSN: 2235 -767X
EUROPEAN JOURNAL OF BUSINESS AND SOCIAL SCIENCES
160
1. INTRODUCTION
A bank as a matter of fact, is just like a heart in the economic structure and the Capital provided by it is like blood. Banks are the backbone of the global economy, providing capital for innovation, infrastructure, job creation and overall prosperity. Banks also play an integral role in society, affecting not only spending by individual consumers, but also the growth of entire industries. Economic development of the economy is reflected through the soundness of the banking system (Gaur et al. 2012) and its sound application. Banking is now an essential part of any economic system. Modern trade and commerce would almost be impossible without the availability of suitable banking services. First, banking promotes savings. All manner of people, from the ordinary laborers and workers to the rich land owners and businessmen, can keep their money safely in banks and saving centers. Secondly, banking promotes investments. Banks easily invest the money they get in industry, agriculture and trade. They either invest it directly or advance loans to other investors. Thirdly, it is most through banks that foreign trade is carried on. Whether we export or import, it is through banks that money is transferred from one country to another (Chodhury and Kaspia, 2010). A number of recent studies, however, indicate that the banking sector plays a more important role than it was believed earlier (World Bank, 1996; Almeyda). Financial soundness helps us to measure the results of a firm's policies and operations in monetary terms also these results are reflected in the firm's return on investment, return on assets, value added (Makkar and Singh, (2012). It also helps us to evaluate how well a bank is using its resources to make a profit. Common examples of financial performance include operating income, earnings before interest and taxes, and net asset value. It is important to note that no one measure of financial soundness should be taken on its own. Rather, a thorough assessment of a company's performance should take into account many different measures. Financial performance is a subjective measure of how well a bank can use assets from its primary mode of business and generate revenues. This term is also used as a general measure of a firm's overall financial health over a given period of time, and can be used to compare similar firms across the same industry or to compare industries or sectors in aggregation.
The health and efficiency of the financial sector are crucial to economic growth of a country because the pace of economic growth, a balanced capital market, an efficient flow of fund between savers and investors cannot be preserved without a sound financial sector (Lalarukh and Hossain, 2008). Financial sector of Bangladesh, like most poor countries, is dominated by the banking enterprises (Ahmed, 2005). As a result, the performance of the banking sector has a direct correlation with the entire financial sector and economy of our country. In every country, the banking sector is the most important mechanism for performing a lot of tasks related to deposit mobilization, credit evaluation and monitoring, providing access to a payments system and to a clearing house for transactions. It is the system by which a country’s most profitable and efficient projects are systematically and continuously funded, and thus it is the mechanism, which ensures that resources are directed to the most productive sources of the future growth. The system not only transfers funds from savers to investors, it must be able to select projects which will yield the highest returns, accumulate sufficient quantities of capital to fund the range of investment projects across economic activities, account for price risks across assets, monitor performance, and enforce contracts (Hassan, 1993). Therefore, in a country like Bangladesh, characterized by low savings rate, a large non monetized sector, lack of institutions to tap rural savings, the paramount importance of banking is well recognized (Bayes, 1987). As banks play the most major roles in the economy, it is important to evaluate the financial soundness of banks.

European Journal of Business and Social Sciences, Vol. 4, No. 10, January 2016. P.P. 159 - 184 URL: http://www.ejbss.com/recent.aspx-/ ISSN: 2235 -767X
EUROPEAN JOURNAL OF BUSINESS AND SOCIAL SCIENCES
161
2. REVIEW OF LITERATURES:
Almazari A.F (2012) has attempted to analyze the financial performance of seven selected Jordanian commercial banks and pointed out that there exists a positive correlation between financial performance and asset size, asset utilization and operational efficiency. Moreover, the study has anticipated making contributions in the field of banking and academic field.
Chodhury, T.A and Kasfia, A (2009) have analyzed the development and growth of Selected Private Commercial Banks of Bangladesh. They observed that all the selected private commercial banks are able to achieve a stable growth of branches, employees, deposits, loans and advances, net income, earnings per share during the period of 2002-2006. At last, they concluded that the prospect of private commercial banks in Bangladesh is very bright.
Lalarukh Farjana and Hossain M.Z (2008) observed performance of private and national commenrcial banks of Bangladesh for the period of 2002-2005 and they pointed out that in financial category, PCBs performed better than that of NCBs but NCBs are very much desirable from social point of view and it is very difficult to accomplish dual objectives of monetary profitability and social consideration for the NCBs at the same time.
Chowdhury and Islam (2007) stated that deposits and loan advances of Nationalized Commercial Banks (NCBs) are less sensitive to interest changes than those of Specialized Banks (SBs). So SBs should not make abrupt change in lending or deposit rates by following the NCBs. If NCBs change their lending or deposit rates, their deposits or loans and advances will be affected less than those of SBs. Moreover, deposits of NCBs have higher volume and higher volatility than those of SBs. On the other hand, loans advances of NCBs show a higher volume and higher volatility than those of SBs. However, SBs offer higher deposit rates and charge higher lending rates than NCBs. That is why the interest rate spread of SBs was higher than that of NCBs.
Jahangir, Shill and Haque (2007) stated that the traditional measure of profitability through stockholder’s equity is quite different in banking industry from any other sector of business, where loan-to-deposit ratio works as a very good indicator of banks' profitability as it depicts the status of asset-liability management of banks. But banks' risk is not only associated with this asset liability management but also related to growth opportunity. Smooth growth ensures higher future returns to holders and there lies the profitability which means not only current profits but future returns as well. So, market size and market concentration index along with return to equity and loan-to-deposit ratio grab the attention of analyzing the banks’ profitability.
X. Chen et all (2005) applies frontier analysis (X-efficiency) using DEA to examine the cost, technical and a locative efficiency of 43 Chinese banks over the period 1993 to 2000. In this paper the input used are interest expenses, non-interest expenses (which includes the price of labor), price of deposits (interest paid on deposits divided by deposits), and the price of capital (non-interest expenses are divided by fixed assets) Outputs used are loans, deposits and non-interest income. Results show that the large state-owned banks and smaller banks are more efficient than medium sized Chinese banks. In addition, technical efficiency consistently dominates the locative efficiency of Chinese banks.
Rafiqul and Farid (2004) on the study “Productivity and profitability performance of private commercial bank in Bangladesh: A case study of Pubali bank Limited” reveals that the productivity and profitability measures showed upwards trends during 1983-2001.
Chowdhury (2002) observed that the banking industry of Bangladesh is a mixed one comprising nationalized, private and foreign commercial banks. Many efforts have been made to explain the
European Journal of Business and Social Sciences, Vol. 4, No. 10, January 2016. P.P. 159 - 184 URL: http://www.ejbss.com/recent.aspx-/ ISSN: 2235 -767X
EUROPEAN JOURNAL OF BUSINESS AND SOCIAL SCIENCES
162
performance of these banks. Understanding the performance of banks requires knowledge about the profitability and the relationships between variables like market size, bank's risk and bank's market size with profitability. Indeed, the performance evaluation of commercial banks is especially important today because of the fierce competition. The banking industry is experiencing major transition for the last two decades. It is becoming imperative for banks to endure the pressure arising from both internal and external factors and prove to be profitable.
Siddique and Islam (2001) pointed out that the Commercial Banks, as a whole, are performing well and contributing to the economic development of the country. The average profitability of all Bangladeshi banks collectively was 0.09% during 1980 to 1995 which means that a profit of TK 0.09 was earned by utilizing assets of TK 100. In every aspect of profit, banking sector contributes the national economy as well as to the individual organization. Despite overall growth of the banking sector being positive, the performances of different categories of banks were not equally attractive.
Chodhury F. (2000) used some parameters for analyzing managerial effectiveness of BKB, such as deposit mobilization; loan & advance sanctioned and recovered, profitability, productivity etc. She found unsatisfactory performance. She conducted that for the quality management it is required to train-up more official at different levels of management.
Matiur (1994) on the study “Trend of Employees” Productivity in Commercial Banks in Bangladesh” reveals the productivity in private commercial Banks was much higher than in the Nationalized Commercial Banks. He observed that per employees’ deposit, advance and expenditure had almost an increasing trend in both NCBs and PCBs, but per employee profit and investments showed zigzag trend during the study period.
Raqib (1993) in a research paper named “A Decade of private Commercial Banking in Bangladesh” concluded that the performance of private banks is satisfactory excepting the quality of leading. The study suggested an implication of financial sector reform measures in the banking sector; financial discipline would revive and bring a congenial atmosphere for the healthy growth of private banks.
Shakoor (1989) pointed out “Productivity of nationalized commercial banks in Bangladesh had an increasing trend during 1972-86 that declined a little during 1983 to 1985 although there was an improvement during 1986. The major factors determining the productivity of NCBs are continuous increase in operational expenses, current expenses, establishment expenses, non-current expenses etc. Virtually spread to working fund had also a greater impact on the return on investment of the Banks. The governing factors of the increasing productivity are that there was better deposit mobilization and increasing advances in various sectors of NCBs. There was better recovery because of the effective utilization of the borrowed funds. Private Banks in Bangladesh showed better productivity by way of increasing earning through working fund, deposit mobilization and advances during 1983-86”
Abedin, et. al., (1989) in a paper entitled “A preliminary note on measurement of productivity in the commercial banks of Bangladesh” showed that the cost control measures and improvement in earnings are essential elements for increasing the level of productivity. To enhance the efficiency of the bank employees, they suggest certain degree of mechanization and computerization, manpower planning and performance budgeting. Proper management of assets and liabilities would help to reduce cost and add to banks productivity.

European Journal of Business and Social Sciences, Vol. 4, No. 10, January 2016. P.P. 159 - 184 URL: http://www.ejbss.com/recent.aspx-/ ISSN: 2235 -767X
EUROPEAN JOURNAL OF BUSINESS AND SOCIAL SCIENCES
163
3. OBJECTIVES OF THE RESEARCH:
The examination of financial soundness in banking has important public policy implications in the context of Bangladesh. The main objective of the study is to measure the financial soundness of private commercial Banks of Bangladesh. Along with the specific objective, the report also finds out the factors behind success and failure of private commercial banks of Bangladesh because determinants of financial soundness is very useful for managers in improving organizational performance and it also help the policy-making bodies. This will also focus on financial trends through trend analysis.
4. BANKING PICTURES IN BANGLADESH : After the independence, banking industry in Bangladesh started its journey with 6 nationalized commercialized banks, 2 State owned specialized banks and 3 Foreign Banks. In the 1980's banking industry achieved significant expansion with the entrance of private banks. Now, banks in Bangladesh are primarily of two types Schedule and Non Schedule.
4.1.Scheduled Banks: The banks, which get license to operate under Bank Company Act, 1991 (Amended in 2003) are termed as Scheduled Banks. There are 56 scheduled banks12 in Bangladesh who operate under full control and supervision of Bangladesh Bank which is empowered to do so through Bangladesh Bank Order, 1972 and Bank Company Act, 1991. Scheduled Banks are classified into following types.
4.1.1 State Owned Commercial Banks (SOCBs): There are 6 SOCBs which are fully or majorly owned by the Government of Bangladesh.
4.1.2. Specialized Banks (SDBs): There are 2 SDBs. Specialized Banks are now operating which were established for specific objectives like agricultural or industrial development. The Government of Bangladesh fully or majorly owns these banks.
4.1.3. Private Commercial Banks (PCBs): There are 39 PCBs, which are mainly owned by the private entities. PCBs can be categorized into two groups.
4.1.4. Conventional PCBs: 22 conventional PCBs are now operating in the industry. They perform the banking functions in conventional fashion i.e interest based operations.
4.1.5. Islami Shariah based PCBs: There are 8 Islami Shariah based PCBs in Bangladesh and they execute banking activities according to Islami Shariah based principles i.e. Profit-Loss Sharing (PLS)
4.1.6. Foreign Commercial Banks (FCBs): There are 9 FCBs are operating in Bangladesh as the branches of the banks which are incorporated in abroad.
4.2. Non-Scheduled Banks: The banks, which are established for special and definite objective and operate under the acts that are enacted for meeting up those objectives, are termed as Non-Scheduled Banks. These banks cannot perform all functions of scheduled banks. There are now 4 non-scheduled banks in Bangladesh which are: Ansar VDP Unnayan Bank, Karmashangosthan Bank, Probashi Kollyan Bank, Jubilee Bank.
4.3. Non Bank Financial Institutions (FIs) are those types of financial institutions which are regulated under Financial Institution Act, 1993 and controlled by Bangladesh Bank. Now, 31 FIs are operating in Bangladesh while the maiden one was established in 1981. Out of the total, 2 is fully government owned, 1 is the subsidiary of a SOCB, 13 were initiated by private domestic initiative and 15 were initiated by joint venture initiative. Major sources of funds of FIs are Term Deposit (at least six months tenure), Credit Facility from Banks and other FIs, Call Money as well as Bond and Securitization.
European Journal of Business and Social Sciences, Vol. 4, No. 10, January 2016. P.P. 159 - 184 URL: http://www.ejbss.com/recent.aspx-/ ISSN: 2235 -767X
EUROPEAN JOURNAL OF BUSINESS AND SOCIAL SCIENCES
164
Table 1: At a glance Banks and FIs in Bangladesh
Schedule Banks Non Schedule Banks Non Banking FIs
SOCBs 06 SOFIs 02
SDBs 02 SSOCB 01
PCBs 39 PFIs 13
FCBs 09 JVFIs 15
Total 56 04 31
Source: http://www.bangladesh-bank.org/fnansys/bankfi.php
5. AN OVERVIEW OF THE SELECTED BANKS: 5.1. BANK ASIA
Bank Asia limited is a scheduled commercial bank in the private sector established under the Banking Company Act 1991 and incorporated as a public limited Company under the Company Act 1994 to carry out banking business in Bangladesh. The bank went for first public issue of its shares ob 23 September 2003. Bank Asia Limited acquired the business of bank of Nova Scotia (incorporated in Canada); Dhaka in the year 2001 and the bank also acquired the Bangladesh Operations of Muslim Commercial Bank Limited. The bank carries its banking activities through 91 branches in the country as on 31st December, 2014. 5.2. DUTCH BANGLA BANK:
Dutch-Bangla Bank Limited (the Bank) is a scheduled commercial bank. The Bank was established under the Bank Companies Act 1991 and incorporated as a public limited company under the Companies Act 1994 in Bangladesh with the primary objective to carry on all kinds of banking business in Bangladesh. The Bank is listed with Dhaka Stock
Exchange Limited and Chittagong Stock Exchange Limited. DBBL a Bangladesh- European private joint venture scheduled commercial bank commenced formal operation from June 3, 1996. DBBL is the largest technological bank in Bangladesh. It has largest ATM network around the county. It provides online banking, SMS banking, mobile banking and many new features of modern banking. Now it has 145 branches (annual report 2014) and 2705 ATM booths. As well as modern bank it is also called social bank of the county.
5.3. MERCANTILE BANK :
Mercantile Bank Limited emerged as a new commercial bank to provide efficient banking services and to contribute socio-economic development of the country. The Bank commenced its operation on June 2, 1999. The Bank provides a broad range of financial services to its customers and corporate clients. The Board of Directors consists of eminent personalities from the realm of commerce and industries of the country. The strategic objectives of the bank is to achieve positive Economic Value Added (EVA) each year, to be market leader in product innovation, to be one of the top three Financial Institutions in Bangladesh in terms of cost efficiency, to be one of the top five Financial Institutions in Bangladesh in terms of market share in all significant market segments we serve. From the starting to now it has 100 branches (as on 31.12.2014) around the county.
5.4. PRIME BANK LTD:
Prime Bank Ltd. was created and commencement of business started on 17th April 1995. The sponsors are reputed personalities in the field of trade and commerce and their stake ranges from shipping to textile and

European Journal of Business and Social Sciences, Vol. 4, No. 10, January 2016. P.P. 159 - 184 URL: http://www.ejbss.com/recent.aspx-/ ISSN: 2235 -767X
EUROPEAN JOURNAL OF BUSINESS AND SOCIAL SCIENCES
165
finance to energy etc. Prime Bank Ltd. has already made significant progress within a very short period of its existence. The bank has been graded as a top class bank in the country through internationally accepted Capital adequacy, asset quality, management, earnings, liquidity, and sensitivity to market risk (CAMELS) rating. The bank has already occupied an enviable position among its competitors after achieving success in all areas of business operation. Prime Bank Ltd., since its beginning has attached more importance in technology integration. In order to retain competitive edge, investment in technology is always a top agenda and under constant focus. It’s a rapidly growing bank in Bangladesh. Now prime bank has 122 branches (as on 31.12.2014) around the county.
5.5. BRAC BANK:
“Building profitable and socially responsible financial institution focused on Market and business with growth potential, thereby assisting BRAC and stakeholders to build a just, enlightened, healthy democratic and poverty free Bangladesh” this is the vision of the bank. The bank has started its journey in 2001. Brac bank is one of the growing banks in Bangladesh. The bank provides all kinds of commercial banking activities. It distributes highest SME loan in the county. Now it has 97 branches around the county and 458 SME unit office. The bank is guided under the leadership of prominent Fazle Hasan Abed.
6. METHODOLOGY AND DATA COLLECTION:
In order to achieve the specific objectives of the study secondary sources of data have been used. These data have been collected mainly from the annual reports of Bank Asia, Prime Bank, Mercantile Bank, Dutch Bangla Bank and Brac Bank ltd. The study covered a period starting from 2006 to 2014. In addition, data was gathered from books, papers, articles, specialized international journals, the web sites, and relevant previous studies. This study uses a descriptive financial analysis to describe, measure, compare, and classify the financial situations of the selected commercial banks. In measuring the financial soundness of selected Banks, the output has been defined as gross income, deposit, loans and advances, of the Bank. On the other hand employees, branches and various expenditures have been treated as input. In this study some soundness indicators are analyzed to measure the financial soundness of various parties such as deposit per employee, loan and advances per employee, investment per employee, income per branches, return on Assets, return on Equity, total assets etc (Almazari 2012). The descriptive statistics have been applied here for the purpose of making the report informative and representative. The following framework (Table. 2) (Lalarukh and Hossain 2008) was taken into consideration to observe the financial soundness and trend analysis of selected private commercial banks.
European Journal of Business and Social Sciences, Vol. 4, No. 10, January 2016. P.P. 159 - 184 URL: http://www.ejbss.com/recent.aspx-/ ISSN: 2235 -767X
EUROPEAN JOURNAL OF BUSINESS AND SOCIAL SCIENCES
166
Table 2: Framework of Soundness Measurement
S.L
Criteria Formula
1 Branch Expansion No. of Branches growth 2 Employment Generation No. of Employees growth 3 Deposit turnover:
a) Deposit turnover-employees b) Deposit turnover-branch
Total deposit/ No. of employees Total deposit/ No. of branches
4 Investment turnover: a) Investment turnover -employees b) Investment turnover –branch
Total investment/ No. of employees Total investment/ No. of branches
5 Loan & Advances turnover: a) Loan & Advances turnover-
employees b) Loan & Advances turnover –branch
Total Loan & Advances / No. of employees Total Loan & Advances / No. of branches
6 Income turnover a) Income turnover-employees b) Income t turnover-branch
Total Income / No. of employees Total Income /No. of branches
7 Return on Assets Net Income/Average Assets 8 Return on Equity Net Income/Average Equity
7. FINANCIAL SOUNDNESS MEASURMENT:
7.1. Growth of Branches of selected Banks:
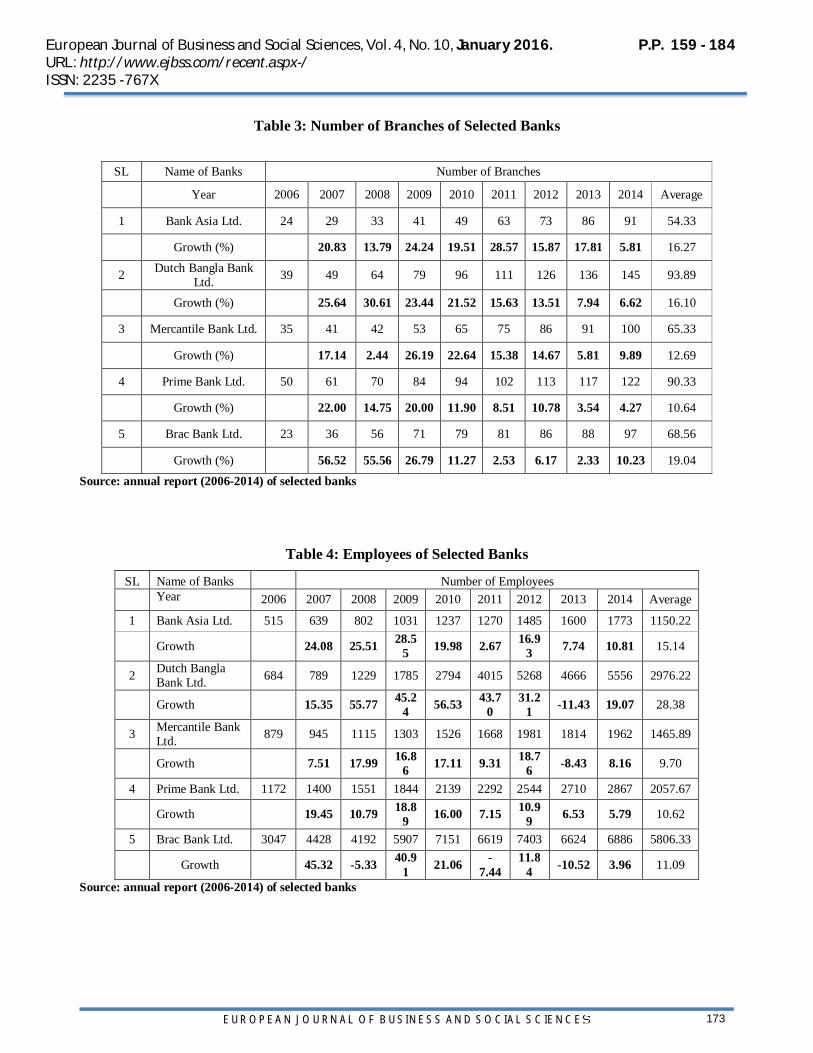
Table 3, shows the growth pattern of number of branches of selected banks for the year 2006 to 2014. The growth of branches is highest Brac Bank 10.23% (in 2014) in comparison to 2013. However, DBBL has highest number of branches in the year 2014 (145). The lower growth percentage is for Brac Bank approximately 4.27%. The average highest growth rate pertains to Brac Bank 19.04% and average highest number of branches is for prime bank 90.33. To rank the banks based on their average growth rate, Brac bank is considered to be number one, Bank Asia is number two, Dutch Bangla Bank is in number three, Mercantile Bank and Prime Bank are in number four and five respectively.
7.2. Growth of Employees of five Banks:
Table 4, shows the growth pattern of employees of selected banks for the year 2006 to 2014. The growth of employees is highest, Dutch Bangla Bank 19.7% in comparison with 2013. Moreover, Brac Bank has highest number of employees in the year 2014 (6886). The lower growth percentage is Mercantile Bank 9.70% in comparing with 2013. The average highest growth rate goes to Dutch Bangla Bank 28.38% but average highest employees are in Brac Bank 5806 in 2014. To rank the banks based on their average growth rate, Dutch Bangla Bank is considered to be number one, Bank Asia is in number two, and Brac Bank is in number three, Prime Bank and Mercantile Bank are in fourth and fifth position respectively.
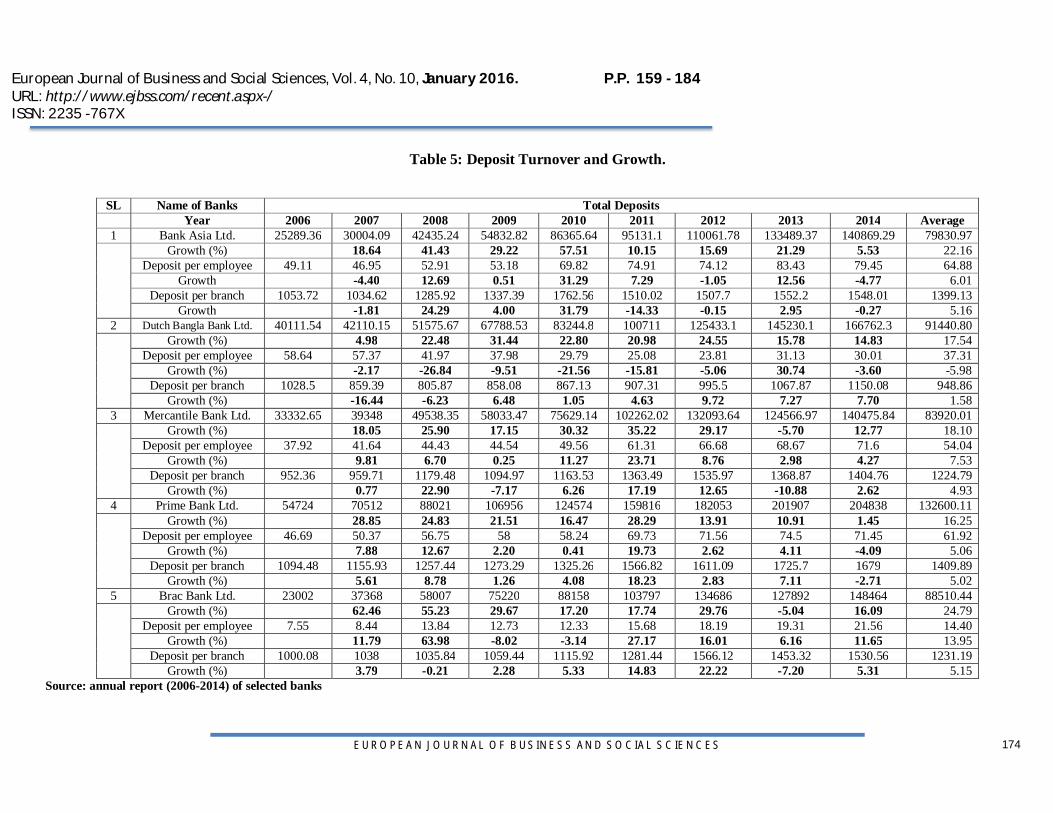
7.3. Growth of Deposit of Selected Banks:
Table 5, shows total deposits for all the selected Private commercial banks of Bangladesh throughout years 2006-2014, and provides the growth rate of deposits. The average of total deposits for Bank Asia is 79830.97 Million Taka with growth rate 5.53% in year 2014 comparing with year 2013. On the other hand,

European Journal of Business and Social Sciences, Vol. 4, No. 10, January 2016. P.P. 159 - 184 URL: http://www.ejbss.com/recent.aspx-/ ISSN: 2235 -767X
EUROPEAN JOURNAL OF BUSINESS AND SOCIAL SCIENCES
167
average growth of deposit per employee and deposit per branch of Bank Asia are 6.01% and 5.16% respectively. The table indicates highest average deposited Bank is Prime Bank with 132600.11 million Taka, highest average deposit growth rate Bank is Brac Bank 24.79%, highest average growth rate of deposit per employees bank is Brac Bank is 13.95% and average highest growth rate of deposit per branch bank is Bank Asia 5.16%. Dutch Bangla Bank is very poor position in average growth rate of deposit per employee and deposit per branch -5.98% and 1.58 % respectively. The table results that as much as Banks are increased Branches and Employees but failed to collect deposit. To rank the banks based on their average deposit turnover, Prime Bank is considered to be number one, Dutch Bangla Bank is in number two, Brac Bank and Mercantile Bank are in third and fourth position and Bank Asia is in number five.
7.4. Loans and Advances Turnover and Growth of Selected Banks:
Table 6, results total loans and advances for all the selected Private commercial banks of Bangladesh through years 2006-2014, and provide the growth rate of loans and advances along with growth rate of loan and advances per employees and branches. It is clear from the table that Prime bank is the highest average of total loan and advances 109316.89 million Taka, and Mercantile bank is the lowest one 67241.31million Taka. Average highest growth rate is Brac Bank 25.81% and lowest one is Prime Bank 14.91%. On the other hand, highest average growth of loan and advances per employees and branch is Brac Bank 16.87% and Bank Asia 5.53% respectively and lowest one is Dutch Bangla Bank -6.35% and 1.66% respectively. The table found that, banks are in good position for providing loan and advances in relation with deposit collection. To rank the banks based on their average loan and advances turnover, Prime Bank is considered to be number one, Brac Bank is in number two and DBBL is in number three, Bank Asia and Mercantile Bank are in number four and five respectively.
7.5. Growth of Net Income of Selected Banks:
Table 7, results net income turnover and growth of all the selected private commercial banks of Bangladesh through years 2006-2014, along with growth rate of income per branch and employees. It is clear from the table that Prime bank is the highest average of net income 2236.22 Million Taka, and Mercantile bank is the lowest one 1129.59 million Taka. Average highest growth rate belongs to Brac Bank 35.95% and lowest one is Mercantile Bank 15.06%. On the other hand, highest average income per branch belongs to Prime Bank 24.72 and highest average income per employees belongs to Bank Asia 1.12% . Lowest average income per branch goes to Dutch Bangla Bank 14.99% and lowest average income per employee pertains to Brac Bank 0.20%. The table shown that, comparatively banks net income is not in a stable position. To rank the banks based on their average net income turnover , Prime Bank is considered to be number one, Dutch Bangla Bank is in number two, Bank Asia is in number three, Brac Bank and Mercantile Bank are in number four and five respectively.
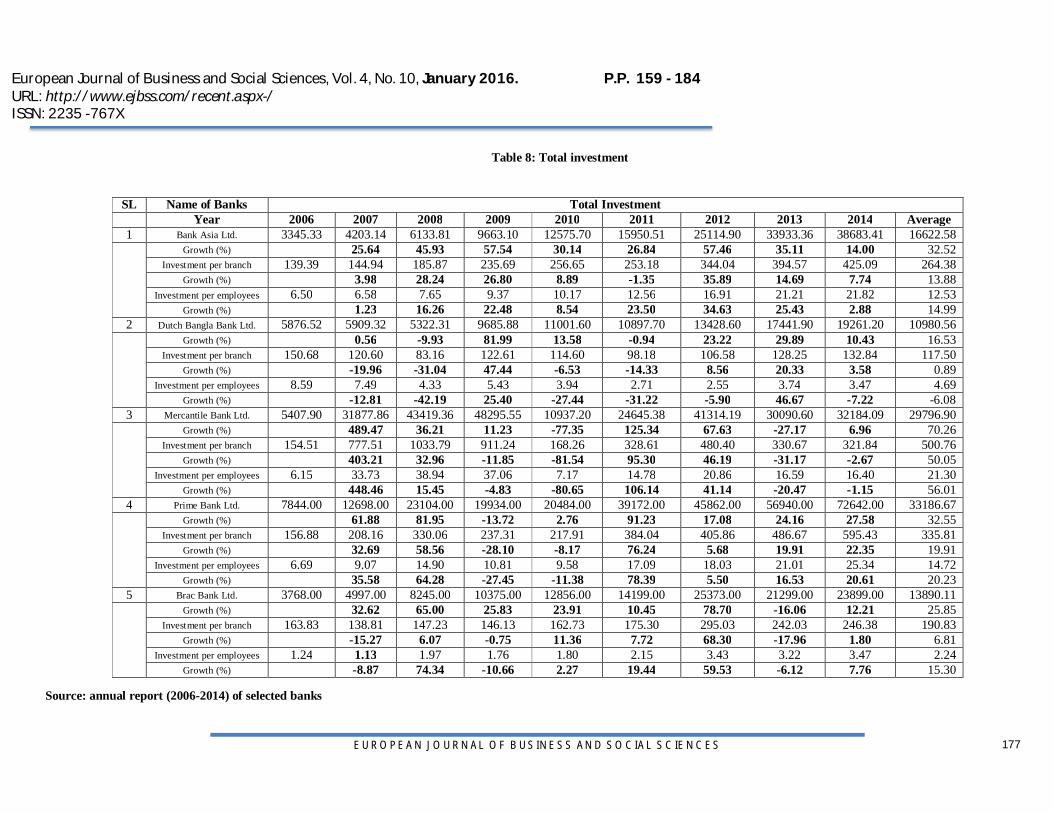
7.6. Growth of Investment of Selected Banks:
Table 8, results investment turnover and growth of all the selected Private commercial banks of Bangladesh through years 2006-2014, along with growth rate of investment per branch and employees. It can be noted from the table that Prime bank is the highest average of investment 33,186.67 million taka, and Dutch Bangla Bank is the lowest one which is 10,980.56 million taka. Average highest growth rate is Mercantile Bank 70.26% and lowest one is Dutch Bangla Bank 16.53%. On the other hand, highest average investment per branch and employees belongs to Mercantile Bank which are 500.76% and 21.30% respectively and lowest for average investment per branch is Dutch Bangla Bank is 117.50% and lowest for average investment per employee is Brac Bank which is 2.24%. The table finds out that banks investment turnover is
European Journal of Business and Social Sciences, Vol. 4, No. 10, January 2016. P.P. 159 - 184 URL: http://www.ejbss.com/recent.aspx-/ ISSN: 2235 -767X
EUROPEAN JOURNAL OF BUSINESS AND SOCIAL SCIENCES
168
increasing year-by-year but not as much as increasing branches and employees. To rank the banks based on their average investment turnover , Prime Bank is considered to be number one, Mercantile Bank is in number two and Bank Asia is in number three, Brac Bank and Dutch Bangla Bank are in number four and five respectively. 7.7. Return on Assets of Selected Banks:
Return on assets indicates an overall profitability of Assets. Table 9, shows return on assets of all the selected Private commercial banks of Bangladesh through years 2006-2014. It is clear from the table that Prime Bank achieved the highest average return on assets which is 1.66 and Brac Bank is in the highest average growth of return on assets which is 7.39% during the period 2006 to 2014. On the other hand, Brac Bank was lowest at average return on asset which is 1.27 and Prime Bank was lowest at average growth of return on assets which is equal to -2.35%.
7.8. Return on Equity of Selected Banks:
Return on equity indicates an overall profitability of Equity. Table 10, shows return on equity of all the selected Private commercial banks of Bangladesh through years 2006-2014. It is clear from the table that Dutch Bangla Bank is securing the highest average return on equity which is 25.24 and Brac Bank is maintaining the highest growth of return on equity 3.44% during the period 2006 to 2014. On the other hand, Brac Bank is the lowest at average return on equity which is 17.71% and Prime Bank is the lowest at average growth of return on equity which is equal to -8.29%.
7.9. Ranks of the Selected Commercial Banks Based on Financial Indicators:
In order to summarize the classification of the banks based on their rank of activities and profitability ratios( table.11), contains ranks of the positions for these banks. As it is shown in this table, rank of Prime Bank is in the first position in considering average deposit, average deposit per branch, average loans and advances, average investment, average income, average income per branches and average ROA. Moreover, Prime Bank in consideration of every criterion it never placed below third place compared to other banks. Similarly Bank Asia ranked first in consideration of deposit per employees, loans & advance per employees, loans & advance per branch and income per employees but positioned last by measuring average number of branch, average number of employees and average deposit. Dutch Bangla Bank ranked first in considering number of branch and return on equity but ranked last regarding deposit per branch, loans & advance per branch, average investment, average investment per branch and income per branch. Mercantile Bank positioned first in deliberation of investment per branch and investment per employees but positioned last considering average loans & advance and average income. In this contrast, Brac Bank placed first position only considering average number of employees but obtained last position in deliberation of six criteria (deposit per employees, average loans & advance per employees, average investment per employees, average income per employees, ROA and ROE). Among the five banks which are ranked, Prime Bank is in good position in all indicators. It showed continuous commitment in every financial indicator performance compared to other banks during the period from 2006 to 2014.
European Journal of Business and Social Sciences, Vol. 4, No. 10, January 2016. P.P. 159 - 184 URL: http://www.ejbss.com/recent.aspx-/ ISSN: 2235 -767X
EUROPEAN JOURNAL OF BUSINESS AND SOCIAL SCIENCES
169
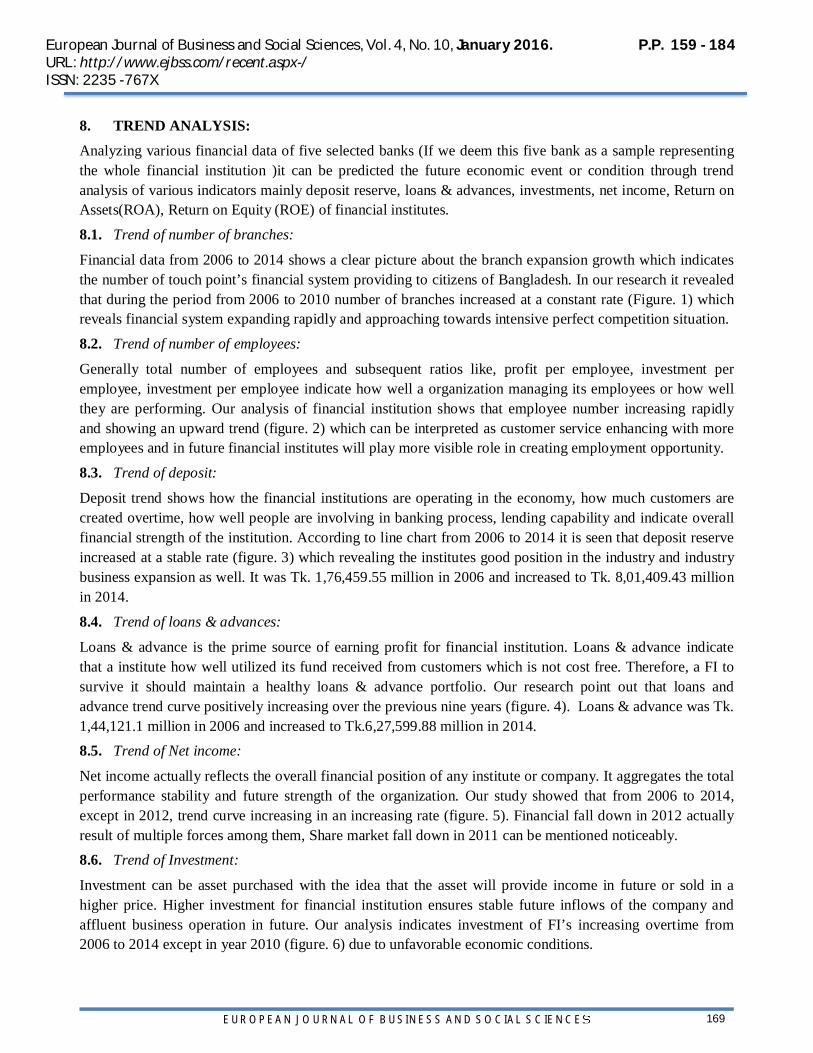
8. TREND ANALYSIS:
Analyzing various financial data of five selected banks (If we deem this five bank as a sample representing the whole financial institution )it can be predicted the future economic event or condition through trend analysis of various indicators mainly deposit reserve, loans & advances, investments, net income, Return on Assets(ROA), Return on Equity (ROE) of financial institutes.
8.1. Trend of number of branches:
Financial data from 2006 to 2014 shows a clear picture about the branch expansion growth which indicates the number of touch point’s financial system providing to citizens of Bangladesh. In our research it revealed that during the period from 2006 to 2010 number of branches increased at a constant rate (Figure. 1) which reveals financial system expanding rapidly and approaching towards intensive perfect competition situation.
8.2. Trend of number of employees:
Generally total number of employees and subsequent ratios like, profit per employee, investment per employee, investment per employee indicate how well a organization managing its employees or how well they are performing. Our analysis of financial institution shows that employee number increasing rapidly and showing an upward trend (figure. 2) which can be interpreted as customer service enhancing with more employees and in future financial institutes will play more visible role in creating employment opportunity.
8.3. Trend of deposit:
Deposit trend shows how the financial institutions are operating in the economy, how much customers are created overtime, how well people are involving in banking process, lending capability and indicate overall financial strength of the institution. According to line chart from 2006 to 2014 it is seen that deposit reserve increased at a stable rate (figure. 3) which revealing the institutes good position in the industry and industry business expansion as well. It was Tk. 1,76,459.55 million in 2006 and increased to Tk. 8,01,409.43 million in 2014.
8.4. Trend of loans & advances:
Loans & advance is the prime source of earning profit for financial institution. Loans & advance indicate that a institute how well utilized its fund received from customers which is not cost free. Therefore, a FI to survive it should maintain a healthy loans & advance portfolio. Our research point out that loans and advance trend curve positively increasing over the previous nine years (figure. 4). Loans & advance was Tk. 1,44,121.1 million in 2006 and increased to Tk.6,27,599.88 million in 2014. 8.5. Trend of Net income:
Net income actually reflects the overall financial position of any institute or company. It aggregates the total performance stability and future strength of the organization. Our study showed that from 2006 to 2014, except in 2012, trend curve increasing in an increasing rate (figure. 5). Financial fall down in 2012 actually result of multiple forces among them, Share market fall down in 2011 can be mentioned noticeably. 8.6. Trend of Investment:
Investment can be asset purchased with the idea that the asset will provide income in future or sold in a higher price. Higher investment for financial institution ensures stable future inflows of the company and affluent business operation in future. Our analysis indicates investment of FI’s increasing overtime from 2006 to 2014 except in year 2010 (figure. 6) due to unfavorable economic conditions.

European Journal of Business and Social Sciences, Vol. 4, No. 10, January 2016. P.P. 159 - 184 URL: http://www.ejbss.com/recent.aspx-/ ISSN: 2235 -767X
EUROPEAN JOURNAL OF BUSINESS AND SOCIAL SCIENCES
170
8.7. Trend of ROA:
Return on asset indicates how well a company managing its assets to generate income for the company. Our study points out average ROA increased from 2006 to 2010, the start to slow down upto 2012 and in year 2013 & 2014 it remains stable (figure. 7).
8.8. Trend of ROE:
Return on equity reveals the company performance against the capital invested by the shareholders. It measures how well a company utilizing its shareholders investment. The research described the ROE trend of banks during the period from 2006 to 2014 which was increasing from 2008 to 2010 but started to fall from 2010 to 2012 and remained somewhat stable afterwards (figure. 8).
9. SUMMARY OF THE STUDY:
During the period 2006-2014 all selected bank have proven the positive position of branch expansion and employment opportunities. All selected banks are increasing branch expansion and job creation. It proves the social commitment and profitability of PCBs because the social profitability of banking industry can be measured by branch expansion and employment generation (Lalarukh Farjana and Hossain M.Z (2008).
The results of the ranking of the selected banks based on the computed financial indicators revealed that, Prime Bank is in the first position in average deposits and overall position considering 16 (sixteen) criteria (no. of branches, no. of employees, average deposit, average deposit per employee and branch, average loans & advance, average loans & advance per employee and per branch, average investment, average investment per employee and per branch, average income, average income per employee & per branch, ROA and ROE) is also positioned first through obtaining total weight 27 (adding rank values) which is lowest among five banks. Bank asia positioned second measuring total weight is 43 which implies sound performance over the last nine years of operation in Bangladesh. Dutch Bangla Bank and Mercantile bank securing a moderate position obtaining weight 55 considering all the sixteen financial performance criteria. Among the five banks Brac Bank’s performance is not satisfactory as it positioned last in six indicators out of sixteen indicators.
10. RECOMMENDATIONS:
Prime bank showed strong commitment in deposit, loans & advances, investment, net income or profit and return on asset implies it has sound reserve for lending, utilizing the fund efficiently and subsequently high growth of profit means it ensuring sound return on investment. Prime bank should also concentrate on enough human resource and return on assets. Bank Asia’s strength is its deposit per employee, average loans & advance per employee & per branch average income per employees indicating it’s shortage of human resources and scarcity of branches to serve customers. Bank asia need to concentrate on deposit and loans & advance because a substantial amount of fund raising and utilizing those funds through lending ensure a sustainable return to compete in the market. It should adopt promotional activity to increase deposit and should increase branches to operate widely. Dutch Bangla bank perform well at number of branches and ROE but performed poor at average deposit per branches, average loans & advance per branches, average investment per branch and average income per branch. It indicate that DBBL has more than average employees and branches for efficient operation , now it should concentrate on various strategies to utilize the human resources and need the bank to invest more in productive fields through properly selecting borrowers. Mercantile Bank investment position is satisfactory but others indicators implies that in case of deposit , number of branches & employees, loans & advances, net income or profit, ROA and ROE performance is not satisfactory. It need to concentrate on more low cost fund, more efficient human resource, proper

European Journal of Business and Social Sciences, Vol. 4, No. 10, January 2016. P.P. 159 - 184 URL: http://www.ejbss.com/recent.aspx-/ ISSN: 2235 -767X
EUROPEAN JOURNAL OF BUSINESS AND SOCIAL SCIENCES
171
investment of funds and the bank require to overall consider the policies and strategies (marketing mix) to be more competitive. Average loans and advance of Brac Bank is somewhat satisfactory but other indicators show poor position in financial performance. Brac bank with its huge network of branches and employees has a good chance to expand business through proper formulation of policies, adopting competitive marketing strategies, marketing mix and establishing R & D to deliver innovative customer services.
This study provide a clear picture of our banking sector that can be a source of help to bank managers to improve their financial performance and formulate policies that will promote effective financial system. The study also recommends that banks could be adopted any corrective measures to ensure soundness in their operations and financial growth. Most of the selected banks are in financially sound position. That is satisfactory and can be said they are healthy bank. Also all banks should introduce different financial packages and sophisticated technology to increase deposit collections and expand their business to the mass people the country.
11. CONCLUSION:
It can be concluded that our private commercial banks are playing a major role in our economic growth and stability and their financial health is sound. Financial institutions of Bangladesh are playing a momentous role in circulation of money market, assisting export and import, fulfilling Foreign exchange reserve requirement and in gross assisting in total economic development. This research will be a useful tool for academicians, bankers, policy makers, students and financial analysts for useful analysis of present and future financial & economic condition of Bangladesh.

European Journal of Business and Social Sciences, Vol. 4, No. 10, January 2016. P.P. 159 - 184 URL: http://www.ejbss.com/recent.aspx-/ ISSN: 2235 -767X
EUROPEAN JOURNAL OF BUSINESS AND SOCIAL SCIENCES
172
REFERENCES:
1. Almazari, A. (2012). Financial Performance Analysis of the Jordanian Arab Bank by Using the DuPont System of Financial Analysis. International Journal Of Economics And Finance, 4(4). http://dx.doi.org/10.5539/ijef.v4n4p86
2. Bank Asia Ltd.,. (2006-2014). Annual Report. Bangladesh: Bank Asia Ltd. Retrieved from http://www.bankasia-bd.com/annual_reports/
3. Brac Bank Ltd.,. (2006-2014). Annual Report. Bangladesh: Brac Bank Ltd. Retrieved from http://www.bracbank.com/reports.php
4. CHEN, X., SKULLY, M., & BROWN, K. (2005). Banking efficiency in China: Application of DEA to pre- and post-deregulation eras: 1993–2000. China Economic Review, 16(3), 229-245. http://dx.doi.org/10.1016/j.chieco.2005.02.001
5. Chowdhury, A. (2002). Politics, society and financial sector reform in Bangladesh. International Journal Of Social Economics, 29(12), 963-988. http://dx.doi.org/10.1108/03068290210447003
6. Chowdhury, F. (2010). Managerial Effectiveness: A Case Study of Bangladesh Krishi Bank, Bank Parikrama. bdresearch.org. Retrieved 20 October 2015, from http://www.bdresearch.org/home/attachments/article/521/BP_Managerial_Efectivenes.pdf
7. Dutch Bangla Bank Ltd.,. (2006-2014). Annual Report 2006. Bangladesh: Dutch Bangla Bank Ltd. Retrieved from http://www.dutchbanglabank.com/investor-relations/financial-statements.html
8. Lalarukh Farjana and Hossain M.Z. (2008). A Comparative Study of the PCBSs & NCBs of Bangladesh: A Closer Look into the NCBs. The Cost And Management, March-April.
9. Mercantile Bank Ltd.,. (2006-2014). Annual Report 2006. Bangladesh: Mercantile Bank Ltd. Retrieved from http://www.mblbd.com/home/annual_reports
10. Misir, M., & Afsar, A. (2001). Comparative performance Evaluation of Pubali Bank Ltd and Islami Bank Bangladesh Ltd. Journal Of Institute Of Bangladesh Studies, 24.
11. Prime Bank Ltd.,. (2006-2014). Annual Report 2006. Bangladesh: Prime Bank Ltd. Retrieved from https://www.primebank.com.bd/index.php/home/financial_reports
12. Rafiq, M., & Farid, M. (2004). and performance of Private commercial Bank in Bangladesh. Journal Of Rajshahi University Studies, 27.
13. Rahman, M. (1994). Trend of Employee’s Productivity in Commercial Bank in Bangladesh. Journal Of Rajshahi University Studies, 2.
14. Rahman, M. (2001). Productivity performance Evaluation of Investment Corporation of Bangladesh. Journal Of Rajshahi University Studies, 9.
15. Shakoor, S. (1989). Measurement of productivity in the commercial Bank of Bangladesh. Bank Parikrama,14.
16. Siddique, S., & Islam, A. (2001). Banking Sector in Bangladesh: Its Contribution and Performance. Journal Of Business Research, Jahangirnagar University, 3.
17. Chowdhury, T. A., & Ahmed, K. (2009). Performance evaluation of selected private commercial banks in Bangladesh. International journal of business and management, 4(4), p86.
18. Chowdhury, A., & Islam, S. (2007). Interest Rate Sensitivity of Loans and Advances: A Comparative Study between Nationalized Commercial Banks and Specialized Banks. ASA University Review, 1, 86-97. Jahangir, N., Shill, S., & Haque, M. A. J. (2007). Examination of profitability in the context of Bangladesh banking industry. ABAC Journal, 27(2).
19. Makkar, A., & Singh, S. (2012, June). Evaluating the Financial Soundness of Indian Commercial Banks: An Application of Bankometer. In Proceedings of the National Conference on Emerging Challenges for Sustainable Business conducted at IIT Rurkee, Haridwar, India (pp. 118-132).
European Journal of Business and Social Sciences, Vol. 4, No. 10, January 2016. P.P. 159 - 184 URL: http://www.ejbss.com/recent.aspx-/ ISSN: 2235 -767X
EUROPEAN JOURNAL OF BUSINESS AND SOCIAL SCIENCES
173
Table 3: Number of Branches of Selected Banks
SL Name of Banks Number of Branches
Year 2006 2007 2008 2009 2010 2011 2012 2013 2014 Average
1 Bank Asia Ltd. 24 29 33 41 49 63 73 86 91 54.33
Growth (%) 20.83 13.79 24.24 19.51 28.57 15.87 17.81 5.81 16.27
2 Dutch Bangla Bank Ltd. 39 49 64 79 96 111 126 136 145 93.89
Growth (%) 25.64 30.61 23.44 21.52 15.63 13.51 7.94 6.62 16.10
3 Mercantile Bank Ltd. 35 41 42 53 65 75 86 91 100 65.33
Growth (%) 17.14 2.44 26.19 22.64 15.38 14.67 5.81 9.89 12.69
4 Prime Bank Ltd. 50 61 70 84 94 102 113 117 122 90.33
Growth (%) 22.00 14.75 20.00 11.90 8.51 10.78 3.54 4.27 10.64
5 Brac Bank Ltd. 23 36 56 71 79 81 86 88 97 68.56
Growth (%) 56.52 55.56 26.79 11.27 2.53 6.17 2.33 10.23 19.04 Source: annual report (2006-2014) of selected banks
Table 4: Employees of Selected Banks
SL Name of Banks Number of Employees Year 2006 2007 2008 2009 2010 2011 2012 2013 2014 Average
1 Bank Asia Ltd. 515 639 802 1031 1237 1270 1485 1600 1773 1150.22 Growth 24.08 25.51 28.5
5 19.98 2.67 16.93 7.74 10.81 15.14
2 Dutch Bangla Bank Ltd. 684 789 1229 1785 2794 4015 5268 4666 5556 2976.22
Growth 15.35 55.77 45.24 56.53 43.7
0 31.2
1 -11.43 19.07 28.38
3 Mercantile Bank Ltd. 879 945 1115 1303 1526 1668 1981 1814 1962 1465.89
Growth 7.51 17.99 16.86 17.11 9.31 18.7
6 -8.43 8.16 9.70
4 Prime Bank Ltd. 1172 1400 1551 1844 2139 2292 2544 2710 2867 2057.67 Growth 19.45 10.79 18.8
9 16.00 7.15 10.99 6.53 5.79 10.62
5 Brac Bank Ltd. 3047 4428 4192 5907 7151 6619 7403 6624 6886 5806.33 Growth 45.32 -5.33 40.9
1 21.06 -7.44
11.84 -10.52 3.96 11.09
Source: annual report (2006-2014) of selected banks
European Journal of Business and Social Sciences, Vol. 4, No. 10, January 2016. P.P. 159 - 184 URL: http://www.ejbss.com/recent.aspx-/ ISSN: 2235 -767X
EUROPEAN JOURNAL OF BUSINESS AND SOCIAL SCIENCES
174
Table 5: Deposit Turnover and Growth.
SL Name of Banks Total Deposits Year 2006 2007 2008 2009 2010 2011 2012 2013 2014 Average
1 Bank Asia Ltd. 25289.36 30004.09 42435.24 54832.82 86365.64 95131.1 110061.78 133489.37 140869.29 79830.97
Growth (%) 18.64 41.43 29.22 57.51 10.15 15.69 21.29 5.53 22.16 Deposit per employee 49.11 46.95 52.91 53.18 69.82 74.91 74.12 83.43 79.45 64.88
Growth -4.40 12.69 0.51 31.29 7.29 -1.05 12.56 -4.77 6.01 Deposit per branch 1053.72 1034.62 1285.92 1337.39 1762.56 1510.02 1507.7 1552.2 1548.01 1399.13
Growth -1.81 24.29 4.00 31.79 -14.33 -0.15 2.95 -0.27 5.16 2 Dutch Bangla Bank Ltd. 40111.54 42110.15 51575.67 67788.53 83244.8 100711 125433.1 145230.1 166762.3 91440.80
Growth (%) 4.98 22.48 31.44 22.80 20.98 24.55 15.78 14.83 17.54 Deposit per employee 58.64 57.37 41.97 37.98 29.79 25.08 23.81 31.13 30.01 37.31
Growth (%) -2.17 -26.84 -9.51 -21.56 -15.81 -5.06 30.74 -3.60 -5.98 Deposit per branch 1028.5 859.39 805.87 858.08 867.13 907.31 995.5 1067.87 1150.08 948.86
Growth (%) -16.44 -6.23 6.48 1.05 4.63 9.72 7.27 7.70 1.58 3 Mercantile Bank Ltd. 33332.65 39348 49538.35 58033.47 75629.14 102262.02 132093.64 124566.97 140475.84 83920.01
Growth (%) 18.05 25.90 17.15 30.32 35.22 29.17 -5.70 12.77 18.10 Deposit per employee 37.92 41.64 44.43 44.54 49.56 61.31 66.68 68.67 71.6 54.04
Growth (%) 9.81 6.70 0.25 11.27 23.71 8.76 2.98 4.27 7.53 Deposit per branch 952.36 959.71 1179.48 1094.97 1163.53 1363.49 1535.97 1368.87 1404.76 1224.79
Growth (%) 0.77 22.90 -7.17 6.26 17.19 12.65 -10.88 2.62 4.93 4 Prime Bank Ltd. 54724 70512 88021 106956 124574 159816 182053 201907 204838 132600.11
Growth (%) 28.85 24.83 21.51 16.47 28.29 13.91 10.91 1.45 16.25 Deposit per employee 46.69 50.37 56.75 58 58.24 69.73 71.56 74.5 71.45 61.92
Growth (%) 7.88 12.67 2.20 0.41 19.73 2.62 4.11 -4.09 5.06 Deposit per branch 1094.48 1155.93 1257.44 1273.29 1325.26 1566.82 1611.09 1725.7 1679 1409.89
Growth (%) 5.61 8.78 1.26 4.08 18.23 2.83 7.11 -2.71 5.02 5 Brac Bank Ltd. 23002 37368 58007 75220 88158 103797 134686 127892 148464 88510.44
Growth (%) 62.46 55.23 29.67 17.20 17.74 29.76 -5.04 16.09 24.79 Deposit per employee 7.55 8.44 13.84 12.73 12.33 15.68 18.19 19.31 21.56 14.40
Growth (%) 11.79 63.98 -8.02 -3.14 27.17 16.01 6.16 11.65 13.95 Deposit per branch 1000.08 1038 1035.84 1059.44 1115.92 1281.44 1566.12 1453.32 1530.56 1231.19
Growth (%) 3.79 -0.21 2.28 5.33 14.83 22.22 -7.20 5.31 5.15 Source: annual report (2006-2014) of selected banks

European Journal of Business and Social Sciences, Vol. 4, No. 10, January 2016. P.P. 159 - 184 URL: http://www.ejbss.com/recent.aspx-/ ISSN: 2235 -767X
EUROPEAN JOURNAL OF BUSINESS AND SOCIAL SCIENCES
175
Table 6: Total Loans & Advances Turnover and Growth (In Million Taka) SL Name of Banks Total Loans & Advances
Year 2006 2007 2008 2009 2010 2011 2012 2013 2014 Average 1 Bank Asia Ltd. 22255.64 28456.94 39975 50267.92 79504.23 82819.97 92328.82 104911.26 116808.85 68592.07 Growth (%) 27.86 40.48 25.75 58.16 4.17 11.48 13.63 11.34 21.43
L & A per employee 43.21 44.53 49.84 48.76 64.27 65.21 62.17 65.57 65.88 56.60
Growth (%) 3.05 11.92 -2.17 31.81 1.46 -4.66 5.47 0.47 5.26 L & A per branch 927.32 981.27 1211.36 1226.05 1622.54 1314.6 1264.78 1219.9 1283.61 1227.94
Growth (%) 5.82 23.45 1.21 32.34 -18.98 -3.79 -3.55 5.22 4.64 2 Dutch Bangla Bank
Ltd. 30456.32 29403.12 41698.32 48410.99 67657.7 79660.7 91648.9 106422.8 124423 68864.65 Growth (%) -3.46 41.82 16.10 39.76 17.74 15.05 16.12 16.91 17.78
L & A per employee 44.53 37.27 33.93 27.12 24.22 19.84 17.4 22.81 22.39 27.72
Growth (%) -16.30 -8.96 -20.07 -10.69 -18.08 -12.30 31.09 -1.84 -6.35 L & A per branch 780.93 600.01 651.54 612.78 704.77 717.66 727.37 782.52 858.09 715.07
Growth (%) -23.17 8.59 -5.95 15.01 1.83 1.35 7.58 9.66 1.66 3 Mercantile Bank
Ltd. 26842.14 31877.86 43419.36 48295.55 66377.7 79999.8 93610.87 97688.5 117060.03 67241.31 Growth (%) 18.76 36.21 11.23 37.44 20.52 17.01 4.36 19.83 18.37
L & A per employee 30.54 33.73 38.94 37.06 43.5 47.96 47.25 53.85 59.66 43.61
Growth (%) 10.45 15.45 -4.83 17.38 10.25 -1.48 13.97 10.79 8.00 L & A per branch 766.92 777.51 1033.79 911.24 1021.2 1066.66 1088.5 1073.5 1170.6 989.99
Growth (%) 1.38 32.96 -11.85 12.07 4.45 2.05 -1.38 9.05 5.41 4 Prime Bank Ltd. 45010 57683 75156 89252 116057 138848 160890 153589 147367 109316.89 Growth (%) 28.16 30.29 18.76 30.03 19.64 15.87 -4.54 -4.05 14.91
L & A per employee 38.4 41.2 48.46 48.4 54.26 60.58 63.24 56.67 51.4 51.40
Growth (%) 7.29 17.62 -0.12 12.11 11.65 4.39 -10.39 -9.30 3.69 L & A per branch 900.2 945.62 1073.66 1062.52 1234.65 1361.25 1423.81 1312.73 1207.93 1169.15
Growth (%) 5.05 13.54 -1.04 16.20 10.25 4.60 -7.80 -7.98 3.65 5 Brac Bank Ltd. 19557 24610 52677 64151 84303 95167 111875 117111 121941 76821.33 Growth (%) 25.84 114.05 21.78 31.41 12.89 17.56 4.68 4.12 25.81
L & A per employee 6.42 5.56 12.57 10.86 11.79 14.38 15.11 17.68 17.71 12.45
Growth (%) -13.40 126.08 -13.60 8.56 21.97 5.08 17.01 0.17 16.87 L & A per branch 850.3 683.36 940.66 903.54 1067.13 1174.9 1300.87 1330.81 1257.12 1056.52
Growth (%) -19.63 37.65 -3.95 18.11 10.10 10.72 2.30 -5.54 5.53 Source: annual report (2006-2014) of selected banks

European Journal of Business and Social Sciences, Vol. 4, No. 10, January 2016. P.P. 159 - 184 URL: http://www.ejbss.com/recent.aspx-/ ISSN: 2235 -767X
EUROPEAN JOURNAL OF BUSINESS AND SOCIAL SCIENCES
176
Table 7: Net Income Turnover and Growth
SL Name of Banks Net Income Year 2006 2007 2008 2009 2010 2011 2012 2013 2014 Average
1 Bank Asia Ltd. 475.76 725.64 686.7 1,327.18 1929.58 1916.21 908 1459.82 2218.69 1294.18
Growth (%) 52.52 -5.37 93.27 45.39 -0.69 -52.61 60.77 51.98 27.25 Income per Branch 19.82 25.02 20.81 32.37 39.38 30.42 12.44 16.97 24.38 24.62
Growth (%) 26.24 -16.83 55.55 21.66 -22.75 -59.11 36.41 43.67 9.43 Income per employees 0.92 1.14 0.86 1.29 1.56 1.51 0.61 0.91 1.25 1.12
Growth (%) 23.91 -24.56 50.00 20.93 -3.21 -59.60 49.18 37.36 10.45 2 Dutch Bangla Bank
Ltd. 362.18 479.81 821.67 1137.7 2002.3 2154.9 2314.1 2000.8 2206.6 1497.78
Growth (%) 32.48 71.25 38.46 76.00 7.62 7.39 -13.54 10.29 25.55 Income per Branch 9.28 9.79 12.84 14.4 20.86 19.41 18.37 14.71 15.22 14.99
Growth (%) 5.50 31.15 12.15 44.86 -6.95 -5.36 -19.92 3.47 7.21 Income per employees 0.53 0.61 0.67 0.64 0.72 0.54 0.44 0.43 0.4 0.55
Growth (%) 15.09 9.84 -4.48 12.50 -25.00 -18.52 -2.27 -6.98 -2.20 3 Mercantile Bank Ltd. 494.22 540.5 615.88 807.52 1425.34 1734.18 1381.45 1978.7 1188.51 1129.59
Growth (%) 9.36 13.95 31.12 76.51 21.67 -20.34 43.23 -39.93 15.06 Income per Branch 14.12 13.18 14.66 15.23 21.93 23.12 16.06 21.74 11.89 16.88
Growth (%) -6.66 11.23 3.89 43.99 5.43 -30.54 35.37 -45.31 1.93 Income per employees 0.56 0.57 0.55 0.62 0.93 1.04 0.7 1.09 0.61 0.74
Growth (%) 1.79 -3.51 12.73 50.00 11.83 -32.69 55.71 -44.04 5.76 4 Prime Bank Ltd. 1052 1401 1232 2784 3102 3634 2699 1829 2393 2236.22
Growth (%) 33.17 -12.06 125.97 11.42 17.15 -25.73 -32.23 30.84 16.50 Income per Branch 21.04 22.97 17.6 33.14 33 35.63 23.88 15.63 19.61 24.72
Growth (%) 9.17 -23.38 88.30 -0.42 7.97 -32.98 -34.55 25.46 4.40 Income per employees 0.89 1 0.79 1.51 1.45 1.59 1.06 0.67 0.83 1.09
Growth (%) 12.36 -21.00 91.14 -3.97 9.66 -33.33 -36.79 23.88 4.66 5 Brac Bank Ltd. 334 618 973 1304 1664 1781 612 1397 2092 1197.22
Growth (%) 85.03 57.44 34.02 27.61 7.03 -65.64 128.27 49.75 35.95 Income per Branch 14.52 17.17 17.38 18.37 21.06 21.99 7.12 15.88 21.57 17.23
Growth (%) 18.25 1.22 5.70 14.64 4.42 -67.62 123.03 35.83 15.05 Income per employees 0.11 0.14 0.23 0.22 0.23 0.27 0.08 0.21 0.3 0.20
Growth (%) 27.27 64.29 -4.35 4.55 17.39 -70.37 162.50 42.86 27.13 Source: annual report (2006-2014) of selected banks
European Journal of Business and Social Sciences, Vol. 4, No. 10, January 2016. P.P. 159 - 184 URL: http://www.ejbss.com/recent.aspx-/ ISSN: 2235 -767X
EUROPEAN JOURNAL OF BUSINESS AND SOCIAL SCIENCES
177
Table 8: Total investment
Source: annual report (2006-2014) of selected banks
SL Name of Banks Total Investment Year 2006 2007 2008 2009 2010 2011 2012 2013 2014 Average 1 Bank Asia Ltd. 3345.33 4203.14 6133.81 9663.10 12575.70 15950.51 25114.90 33933.36 38683.41 16622.58
Growth (%) 25.64 45.93 57.54 30.14 26.84 57.46 35.11 14.00 32.52 Investment per branch 139.39 144.94 185.87 235.69 256.65 253.18 344.04 394.57 425.09 264.38
Growth (%) 3.98 28.24 26.80 8.89 -1.35 35.89 14.69 7.74 13.88 Investment per employees 6.50 6.58 7.65 9.37 10.17 12.56 16.91 21.21 21.82 12.53
Growth (%) 1.23 16.26 22.48 8.54 23.50 34.63 25.43 2.88 14.99 2 Dutch Bangla Bank Ltd. 5876.52 5909.32 5322.31 9685.88 11001.60 10897.70 13428.60 17441.90 19261.20 10980.56
Growth (%) 0.56 -9.93 81.99 13.58 -0.94 23.22 29.89 10.43 16.53 Investment per branch 150.68 120.60 83.16 122.61 114.60 98.18 106.58 128.25 132.84 117.50
Growth (%) -19.96 -31.04 47.44 -6.53 -14.33 8.56 20.33 3.58 0.89 Investment per employees 8.59 7.49 4.33 5.43 3.94 2.71 2.55 3.74 3.47 4.69
Growth (%) -12.81 -42.19 25.40 -27.44 -31.22 -5.90 46.67 -7.22 -6.08 3 Mercantile Bank Ltd. 5407.90 31877.86 43419.36 48295.55 10937.20 24645.38 41314.19 30090.60 32184.09 29796.90
Growth (%) 489.47 36.21 11.23 -77.35 125.34 67.63 -27.17 6.96 70.26 Investment per branch 154.51 777.51 1033.79 911.24 168.26 328.61 480.40 330.67 321.84 500.76
Growth (%) 403.21 32.96 -11.85 -81.54 95.30 46.19 -31.17 -2.67 50.05 Investment per employees 6.15 33.73 38.94 37.06 7.17 14.78 20.86 16.59 16.40 21.30
Growth (%) 448.46 15.45 -4.83 -80.65 106.14 41.14 -20.47 -1.15 56.01 4 Prime Bank Ltd. 7844.00 12698.00 23104.00 19934.00 20484.00 39172.00 45862.00 56940.00 72642.00 33186.67
Growth (%) 61.88 81.95 -13.72 2.76 91.23 17.08 24.16 27.58 32.55 Investment per branch 156.88 208.16 330.06 237.31 217.91 384.04 405.86 486.67 595.43 335.81
Growth (%) 32.69 58.56 -28.10 -8.17 76.24 5.68 19.91 22.35 19.91 Investment per employees 6.69 9.07 14.90 10.81 9.58 17.09 18.03 21.01 25.34 14.72
Growth (%) 35.58 64.28 -27.45 -11.38 78.39 5.50 16.53 20.61 20.23 5 Brac Bank Ltd. 3768.00 4997.00 8245.00 10375.00 12856.00 14199.00 25373.00 21299.00 23899.00 13890.11
Growth (%) 32.62 65.00 25.83 23.91 10.45 78.70 -16.06 12.21 25.85 Investment per branch 163.83 138.81 147.23 146.13 162.73 175.30 295.03 242.03 246.38 190.83
Growth (%) -15.27 6.07 -0.75 11.36 7.72 68.30 -17.96 1.80 6.81 Investment per employees 1.24 1.13 1.97 1.76 1.80 2.15 3.43 3.22 3.47 2.24
Growth (%) -8.87 74.34 -10.66 2.27 19.44 59.53 -6.12 7.76 15.30
European Journal of Business and Social Sciences, Vol. 4, No. 10, January 2016. P.P. 159 - 184 URL: http://www.ejbss.com/recent.aspx-/ ISSN: 2235 -767X
EUROPEAN JOURNAL OF BUSINESS AND SOCIAL SCIENCES
178
Table 9: Return on Assets (ROA) SL Name of Banks Return on Assets
Year 2006 2007 2008 2009 2010 2011 2012 2013 2014 Average
1 Bank Asia Ltd. 1.77 2.11 1.87 2.18 2.22 1.72 0.7 0.96 1.28 1.65
Growth 19.21 -11.37 16.58 1.83 -22.52 -59.30 37.14 33.33 1.66
2 Dutch Bangla Bank Ltd. 0.93 1.01 1.49 1.6 2.2 1.9 1.7 1.2 1.1 1.46
Growth 8.60 47.52 7.38 37.50 -13.64 -10.53 -29.41 -8.33 4.34
3 Mercantile Bank Ltd. 1.33 1.2 1.1 1.22 1.86 1.7 1.03 1.33 0.76 1.28
Growth -9.77 -8.33 10.91 52.46 -8.60 -39.41 29.13 -42.86 -1.83
4 Prime Bank Ltd. 2.05 1.99 1.3 2.37 2.22 2.05 1.24 0.76 0.96 1.66
Growth -2.93 -34.67 82.31 -6.33 -7.66 -39.51 -38.71 26.32 -2.35
5 Brac Bank Ltd. 1.43 1.62 1.64 1.56 1.56 1.39 0.39 0.78 1.09 1.27
Growth 13.29 1.23 -4.88 0.00 -10.90 -71.94 100.00 39.74 7.39
Source: annual report (2006-2014) of selected banks

European Journal of Business and Social Sciences, Vol. 4, No. 10, January 2016. P.P. 159 - 184 URL: http://www.ejbss.com/recent.aspx-/ ISSN: 2235 -767X
EUROPEAN JOURNAL OF BUSINESS AND SOCIAL SCIENCES
179
Table 10: Return on Equity SL Name of Banks Return on Equity
Year 2006 2007 2008 2009 2010 2011 2012 2013 2014 Average
1 Bank Asia Ltd. 27.06 31.63 23 32.03 32.12 19.61 7.11 10.55 14.09 21.91
Growth 16.89 -27.28 39.26 0.28 -38.95 -63.74 48.38 33.55 0.93
2 Dutch Bangla Bank Ltd. 24.07 24.02 29.89 30.28 35.3 27 23.4 17 16.2 25.24
Growth -0.21 24.44 1.30 16.58 -23.51 -13.33 -27.35 -4.71 -2.98
3 Mercantile Bank Ltd. 21.94 18.45 17.75 18.8 24.83 20.59 13.42 16.84 9.11 17.97
Growth -15.91 -3.79 5.92 32.07 -17.08 -34.82 25.48 -45.90 -6.00
4 Prime Bank Ltd. 31.55 30.68 20.58 30.19 21.65 20.19 13.53 8.35 10.08 20.76
Growth -2.76 -32.92 46.70 -28.29 -6.74 -32.99 -38.29 20.72 -8.29
5 Brac Bank Ltd. 23.04 23.83 22.88 19.19 18.95 18.66 6.13 12.6 14.11 17.71
Growth 3.43 -3.99 -16.13 -1.25 -1.53 -67.15 105.55 11.98 3.44
Source: annual report (2006-2014) of selected banks

European Journal of Business and Social Sciences, Vol. 4, No. 10, January 2016. P.P. 159 - 184 URL: http://www.ejbss.com/recent.aspx-/ ISSN: 2235 -767X
EUROPEAN JOURNAL OF BUSINESS AND SOCIAL SCIENCES
180
Table 11: Ranks of Selected banks
Banks/Indicators Bank
Asia Dutch Bangla Bank
Mercantile
Bank
Prime
Bank
Brac
Bank
Branch 5 1 4 2 3
Employees 5 2 4 3 1
Deposit:
Average Deposit
Per Employees
Per Branches
5
1
2
2
4
5
4
3
4
1
2
1
3
5
3
Loans & Advances:
Average Loans & Advances
Per Employees
Per Branches
4
1
1
3
4
5
5
3
4
1
2
2
2
5
3
Investment:
Average Investment
Per Employees
Per Branches
3
3
3
5
4
5
2
1
1
1
2
2
4
5
4
Income:
Average Income
Per Employees
Per Branches
3
1
2
2
4
5
5
3
4
1
2
1
4
5
3
Return on Assets (ROA) 2 3 4 1 5
Return on Equity (ROE) 2 1 4 3 5

European Journal of Business and Social Sciences, Vol. 4, No. 10, January 2016. P.P. 159 - 184 URL: http://www.ejbss.com/recent.aspx-/ ISSN: 2235 -767X
EUROPEAN JOURNAL OF BUSINESS AND SOCIAL SCIENCES
181
Figure 1: Trend of number of branches
Data Source: annual reports (2006-2014) of selected banks
Figure 2: Trend of number of employees
Data Source: annual reports (2006-2014) of selected banks
171216
265
328383
432484
518555
0
100
200
300
400
500
600
No.
of B
ranc
h
Trend of number of branches
Bank Asia Ltd.
Dutch Bangla Bank Ltd.
Mercantile Bank Ltd.
Prime Bank Ltd.
Brac Bank Ltd.
Total
62978201 8889
11870
1484715864
1868117414
19044
0
2000
4000
6000
8000
10000
1200014000
16000
18000
20000
No.
of e
mpl
oyee
s
Trend of number of employees
Bank Asia Ltd.
Dutch Bangla Bank Ltd.
Mercantile Bank Ltd.
Prime Bank Ltd.
Brac Bank Ltd.
Total Employees
European Journal of Business and Social Sciences, Vol. 4, No. 10, January 2016. P.P. 159 - 184 URL: http://www.ejbss.com/recent.aspx-/ ISSN: 2235 -767X
EUROPEAN JOURNAL OF BUSINESS AND SOCIAL SCIENCES
182
Figure 3: Trend of deposits
Data Source: annual reports (2006-2014) of selected banks
Figure 4: Trend of Loans & Advance
Data Source: annual reports (2006-2014) of selected banks
176459.55219342.24
289577.26362830.82
457971.58
561717.12
684327.52733085.44
801409.43
0
100000
200000
300000
400000
500000
600000
700000
800000
900000
Taka
(in M
illio
n)
Trend of deposits
Bank Asia Ltd.
Dutch Bangla Bank Ltd.
Mercantile Bank Ltd.
Prime Bank Ltd.
Brac Bank Ltd.
Total deposit
144121.1172030.92
252925.68300377.46
413899.63
476495.47
550353.59579722.56
627599.88
0
100000
200000
300000
400000
500000
600000
700000
Loan
s & A
dvan
ce (
In m
illio
n Ta
ka)
Trend of Loans & Advance
Bank Asia Ltd.
Dutch Bangla Bank Ltd.
Mercantile Bank Ltd.
Prime Bank Ltd.
Brac Bank Ltd.
Total Loans & Adv.

European Journal of Business and Social Sciences, Vol. 4, No. 10, January 2016. P.P. 159 - 184 URL: http://www.ejbss.com/recent.aspx-/ ISSN: 2235 -767X
EUROPEAN JOURNAL OF BUSINESS AND SOCIAL SCIENCES
183
Figure 5: Trend of Net income
Data Source: annual reports (2006-2014) of selected banks
Figure 6: Trend of investment
Data Source: annual reports (2006-2014) of selected banks
2718.163764.95
4329.25
7360.4
10123.22
11220.29
7914.558665.32
10098.8
0
2000
4000
6000
8000
10000
12000
Net
Inco
me
(In m
illio
n Ta
ka)
Trend of Net income
Bank Asia Ltd.
Dutch Bangla Bank Ltd.
Mercantile Bank Ltd.
Prime Bank Ltd.
Brac Bank Ltd.
Total net income
26241.75
59685.32
86224.4897953.53
67854.5
104864.59
151092.69159704.86
186669.7
0
20000
40000
60000
80000
100000
120000
140000
160000
180000
200000
Inve
stm
ent (
In m
illio
n Ta
ka)
Trend of investment
Bank Asia Ltd.
Dutch Bangla Bank Ltd.
Mercantile Bank Ltd.
Prime Bank Ltd.
Brac Bank Ltd.
Total Investment
European Journal of Business and Social Sciences, Vol. 4, No. 10, January 2016. P.P. 159 - 184 URL: http://www.ejbss.com/recent.aspx-/ ISSN: 2235 -767X
EUROPEAN JOURNAL OF BUSINESS AND SOCIAL SCIENCES
184
Figure 7: Trend of ROA
Data Source: annual reports (2006-2014) of selected banks
Figure 8: Trend of ROE
Data Source: annual reports (2006-2014) of selected banks
1.501.59
1.48
1.79
2.01
1.75
1.01 1.01 1.04
0
0.5
1
1.5
2
2.5
Aver
age
ROA
(rat
io)
Trend of ROA
Bank Asia Ltd.
Dutch Bangla Bank Ltd.
Mercantile Bank Ltd.
Prime Bank Ltd.
Brac Bank Ltd.
Average ROA
25.53 25.7222.82
26.10 26.57
21.21
12.72 13.07 12.72
0
5
10
15
20
25
30
35
40
Aver
age
ROE
(rat
io)
Trend of ROE
Bank Asia Ltd.
Dutch Bangla Bank Ltd.
Mercantile Bank Ltd.
Prime Bank Ltd.
Brac Bank Ltd.
Average ROE