financial services & wealth management...financial services & wealth management david clarke...
TRANSCRIPT
ST
RA
TE
GY
BR
IEF
ING
, S
TR
AT
EG
Y B
RIE
FIN
G, A
ugust 2001A
ugust 2001
0
Financial Services &Wealth Management
David ClarkeGroup Executive
13 August 2001
ST
RA
TE
GY
BR
IEF
ING
, S
TR
AT
EG
Y B
RIE
FIN
G, A
ugust 2001A
ugust 2001
1
DisclaimerDisclaimer
The material contained in the following presentation isintended to be general background information on WestpacBanking Corporation and its activities as at 13 August 2001.
The information is supplied in summary form and is thereforenot necessarily complete. Also, it is not intended that it berelied upon as advice to investors or potential investors, whoshould consider seeking independent professional advicedepending upon their specific investment objectives, financialsituation or particular needs.
ST
RA
TE
GY
BR
IEF
ING
, S
TR
AT
EG
Y B
RIE
FIN
G, A
ugust 2001A
ugust 2001
•• Current SituationCurrent Situation•• StrategyStrategy

ST
RA
TE
GY
BR
IEF
ING
, S
TR
AT
EG
Y B
RIE
FIN
G, A
ugust 2001A
ugust 2001
3
High return and high growthHigh return and high growthwealth management businesswealth management business
90 101
148
254
149
1997 1998 1999 2000 1H 2001
NPAT $m
Source: Westpac Financial Services Group Statutory Accounts
29% CAGR*195
Embedded value uplift * Excluding accounting impacts

ST
RA
TE
GY
BR
IEF
ING
, S
TR
AT
EG
Y B
RIE
FIN
G, A
ugust 2001A
ugust 2001
4
42.830.5 24.8
17.2 13.8
CB
A(C
olo
nia
l)
NA
B(M
LC
)
AM
P
BT
Wes
tpac
But not top tier in FUMBut not top tier in FUM
$bn $bn
Source: ASSIRT as at March 2001
94.6
72.4
47.135.9 33.3
21.6
CB
A(C
olo
nia
l)
AM
P
NA
B
(MLC
)
BT
DB
Wes
tpac
Total Funds Under Management Retail Funds Under Management
1. 2. 3. 4. 5. 8. 1. 2. 3. 4. 5.
ST
RA
TE
GY
BR
IEF
ING
, S
TR
AT
EG
Y B
RIE
FIN
G, A
ugust 2001A
ugust 2001
5
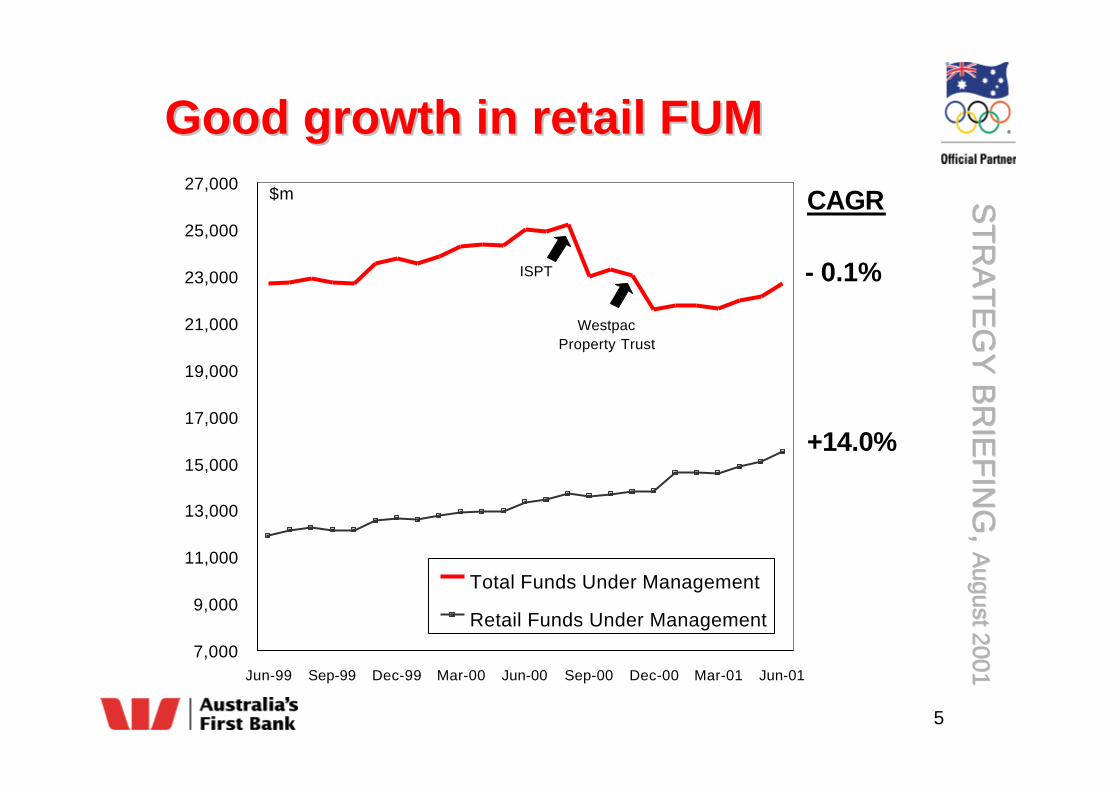
Good growth in retail FUMGood growth in retail FUM
7,000
9,000
11,000
13,000
15,000
17,000
19,000
21,000
23,000
25,000
27,000
Jun-99 Sep-99 Dec-99 Mar-00 Jun-00 Sep-00 Dec-00 Mar-01 Jun-01
Total Funds Under Management
Retail Funds Under Management
ISPT
WestpacProperty Trust
$m
+14.0%
- 0.1%
CAGR

ST
RA
TE
GY
BR
IEF
ING
, S
TR
AT
EG
Y B
RIE
FIN
G, A
ugust 2001A
ugust 2001
6
Sound foundations for growthSound foundations for growth
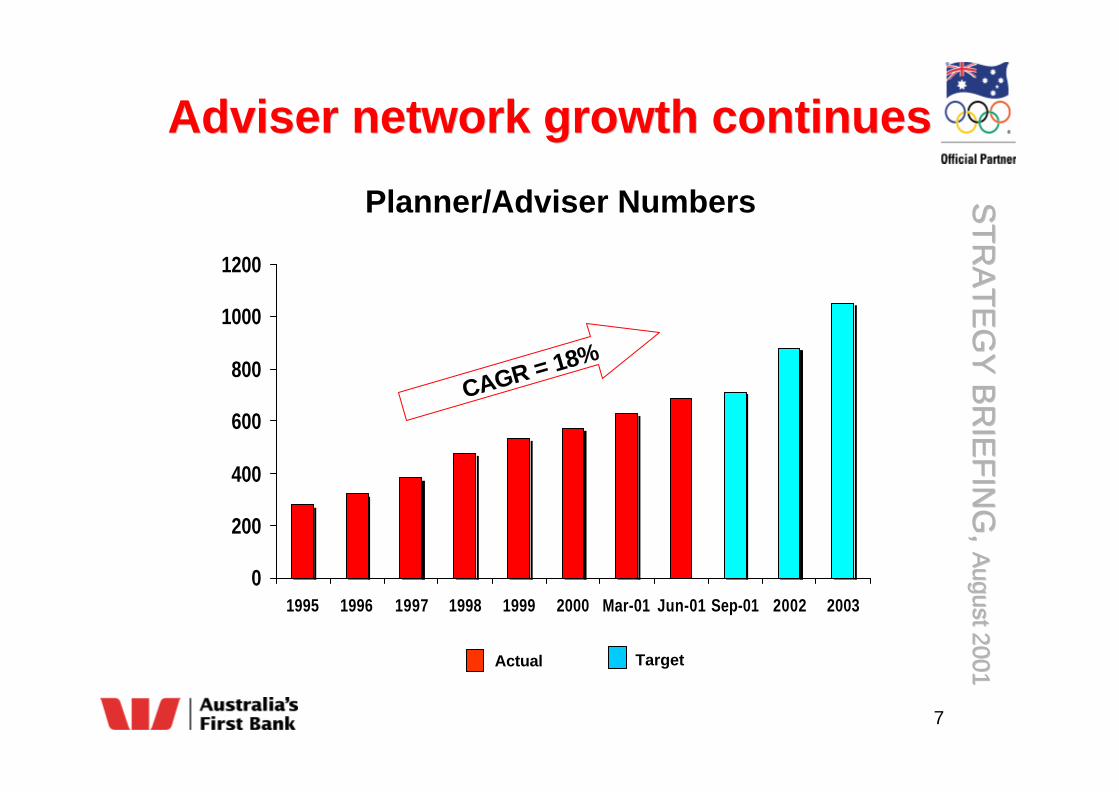
• Growth in adviser network
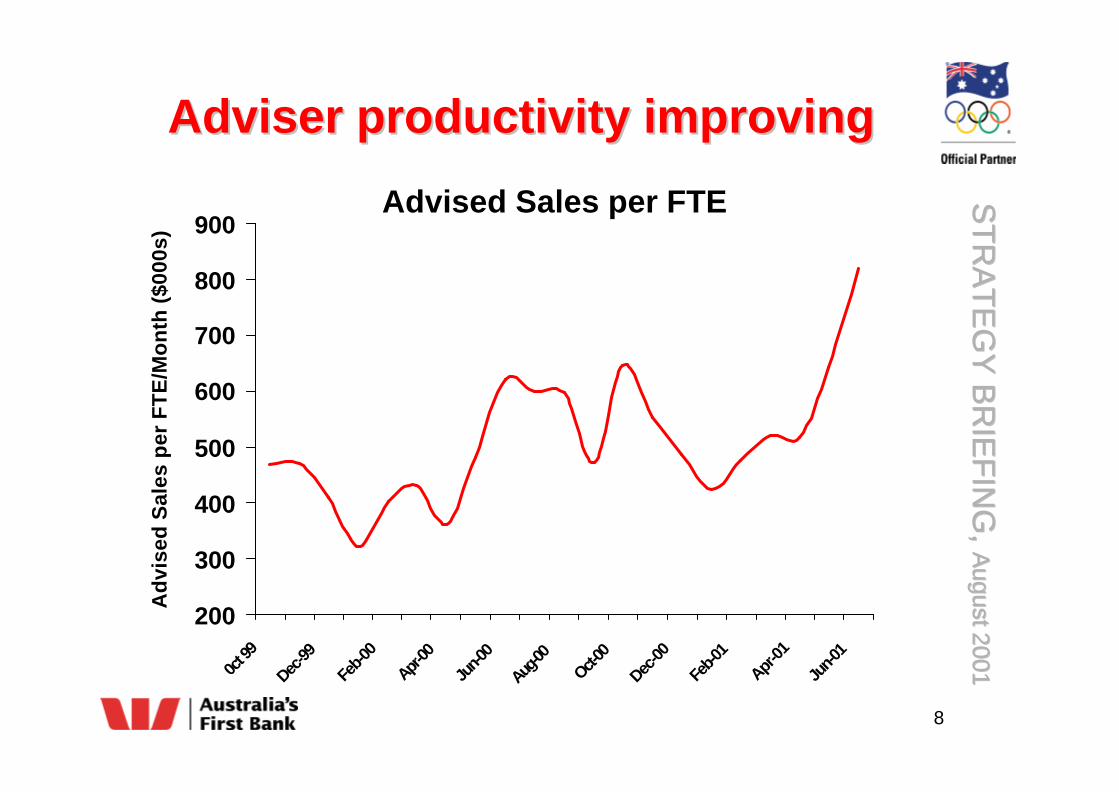
• Adviser productivity improving
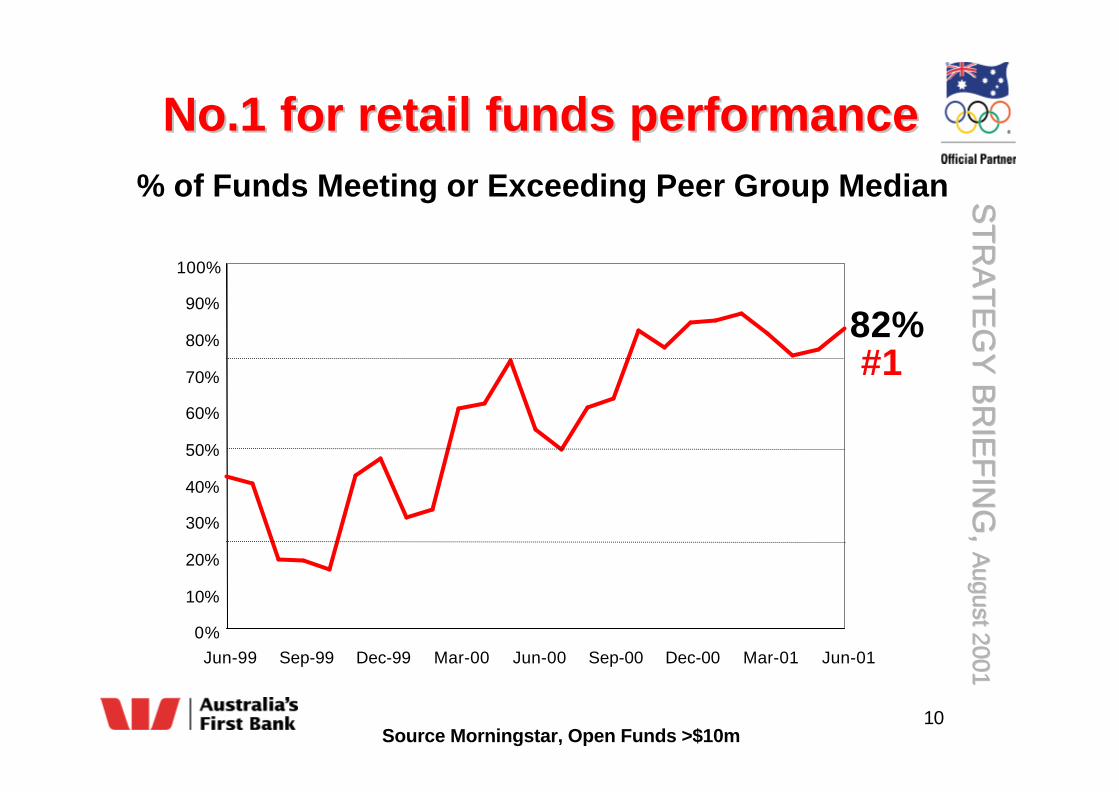
• Fund performance - No.1 over 1 year
ST
RA
TE
GY
BR
IEF
ING
, S
TR
AT
EG
Y B
RIE
FIN
G, A
ugust 2001A
ugust 2001
7
0
200
400
600
800
1000
1200
1995 1996 1997 1998 1999 2000 Mar-01 Jun-01 Sep-01 2002 2003
Adviser network growth continuesAdviser network growth continues
Planner/Adviser Numbers
Actual Target
CAGR = 18%
ST
RA
TE
GY
BR
IEF
ING
, S
TR
AT
EG
Y B
RIE
FIN
G, A
ugust 2001A
ugust 2001
8
200
300
400
500
600
700
800
900
0ct 9
9
Dec-99
Feb-0
0
Apr-00
Jun-0
0
Aug-00
Oct-00
Dec-00
Feb-0
1
Apr-01
Jun-0
1
Adviser productivity improvingAdviser productivity improving
Advised Sales per FTEA
dvi
sed
Sal
es p
er F
TE
/Mo
nth
($0
00s)
ST
RA
TE
GY
BR
IEF
ING
, S
TR
AT
EG
Y B
RIE
FIN
G, A
ugust 2001A
ugust 2001
9
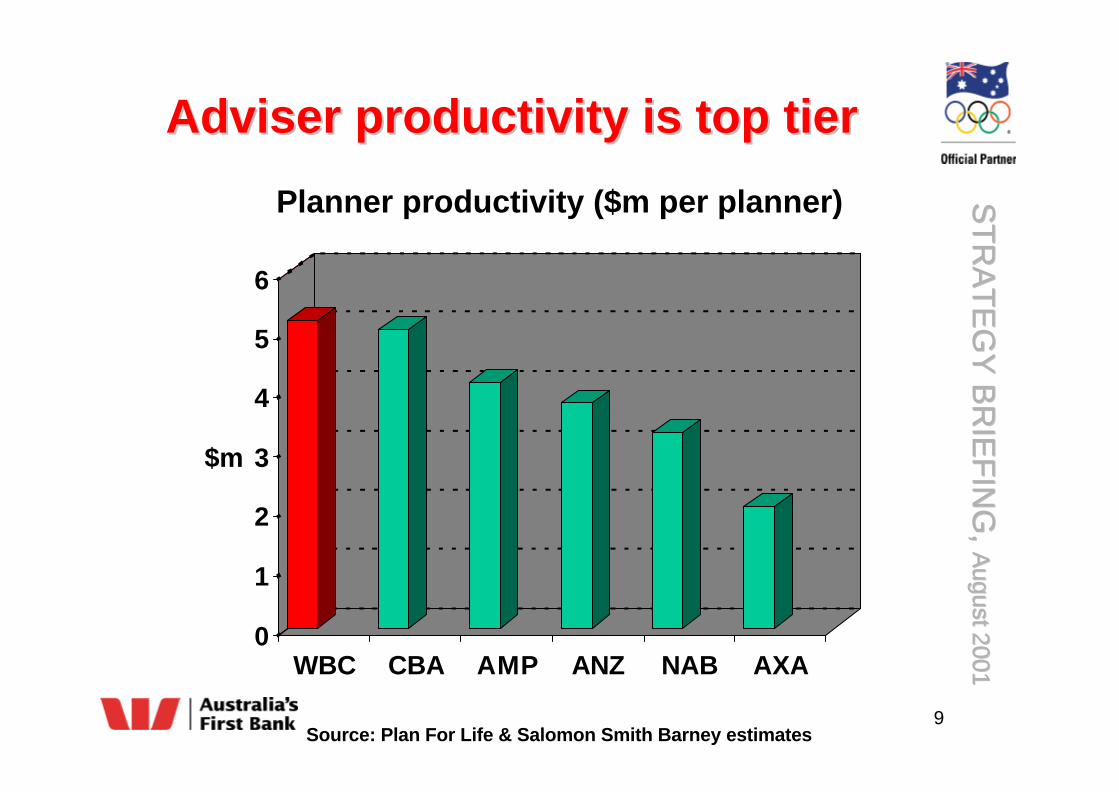
Adviser productivity is top tierAdviser productivity is top tier
Planner productivity ($m per planner)
0
1
2
3
4
5
6
WBC CBA AMP ANZ NAB AXA
$m
Source: Plan For Life & Salomon Smith Barney estimates
ST
RA
TE
GY
BR
IEF
ING
, S
TR
AT
EG
Y B
RIE
FIN
G, A
ugust 2001A
ugust 2001
10Source Morningstar, Open Funds >$10m
No.1 for retail funds performanceNo.1 for retail funds performance% of Funds Meeting or Exceeding Peer Group Median
0%
10%
20%
30%
40%
50%
60%
70%
80%
90%
100%
Jun-99 Sep-99 Dec-99 Mar-00 Jun-00 Sep-00 Dec-00 Mar-01 Jun-01
82%#1
ST
RA
TE
GY
BR
IEF
ING
, S
TR
AT
EG
Y B
RIE
FIN
G, A
ugust 2001A
ugust 2001
11
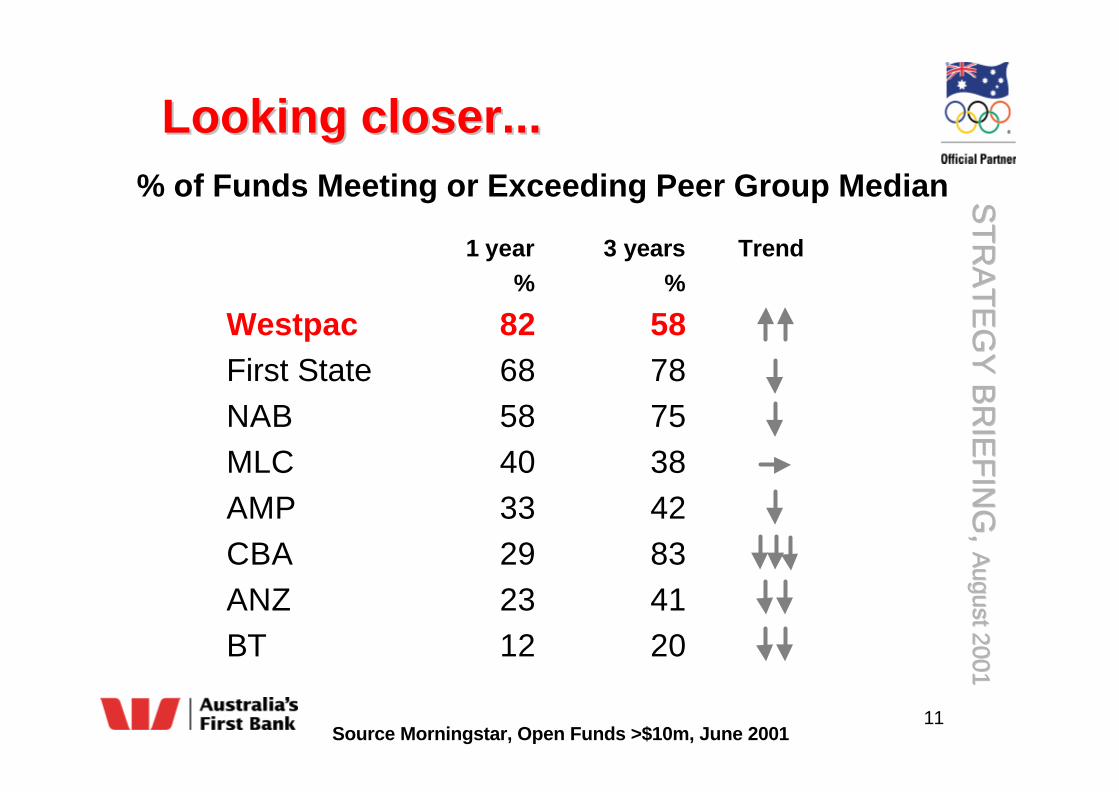
Looking closer...Looking closer...
1 year 3 years Trend% %
Westpac 82 58First State 68 78NAB 58 75MLC 40 38AMP 33 42CBA 29 83ANZ 23 41BT 12 20
Source Morningstar, Open Funds >$10m, June 2001
% of Funds Meeting or Exceeding Peer Group Median
ST
RA
TE
GY
BR
IEF
ING
, S
TR
AT
EG
Y B
RIE
FIN
G, A
ugust 2001A
ugust 2001
12
Westpac Investment ManagementWestpac Investment Management
• Focused on core competencies:
• Australian shares
• Australian fixed interest
• Tactical asset allocation
• Low cost, scalable operation
• Delivering investmentperformance
• Best of breed product strategy

ST
RA
TE
GY
BR
IEF
ING
, S
TR
AT
EG
Y B
RIE
FIN
G, A
ugust 2001A
ugust 2001
13
0
100
200
300
400
500
600
Quarterly Retail Inflow Trend
Retail inflows improving stronglyRetail inflows improving strongly
Mar`99 Jun`99 Sep`99 Dec`99 Mar`00 Jun`00 Sep`00 Dec`00 Mar`01 Jun`01
$m
ST
RA
TE
GY
BR
IEF
ING
, S
TR
AT
EG
Y B
RIE
FIN
G, A
ugust 2001A
ugust 2001
•• Current SituationCurrent Situation•• StrategyStrategy
ST
RA
TE
GY
BR
IEF
ING
, S
TR
AT
EG
Y B
RIE
FIN
G, A
ugust 2001A
ugust 2001
15
AcquisitionsAcquisitions
• Not interested in profitless growth
• Must add shareholder value
• Watching brief
• Our strategy is not dependent onacquisitions
ST
RA
TE
GY
BR
IEF
ING
, S
TR
AT
EG
Y B
RIE
FIN
G, A
ugust 2001A
ugust 2001
16
Our wealth management strategyOur wealth management strategy
• Leveraging our comparative advantage
– large customer base, warm leads andreduced search costs
• Expanding distribution size andcapability
• Accessing & integrating ‘best of breed’products
• Balancing growth and profitable returns

ST
RA
TE
GY
BR
IEF
ING
, S
TR
AT
EG
Y B
RIE
FIN
G, A
ugust 2001A
ugust 2001
17
The opportunity is large...The opportunity is large...
• 81% of Priority Customers don’t hold a
Westpac wealth management product
• 94% of Business Customers have their
super with another financial institution
– 39% of these have their super with
another Bank
ST
RA
TE
GY
BR
IEF
ING
, S
TR
AT
EG
Y B
RIE
FIN
G, A
ugust 2001A
ugust 2001
18
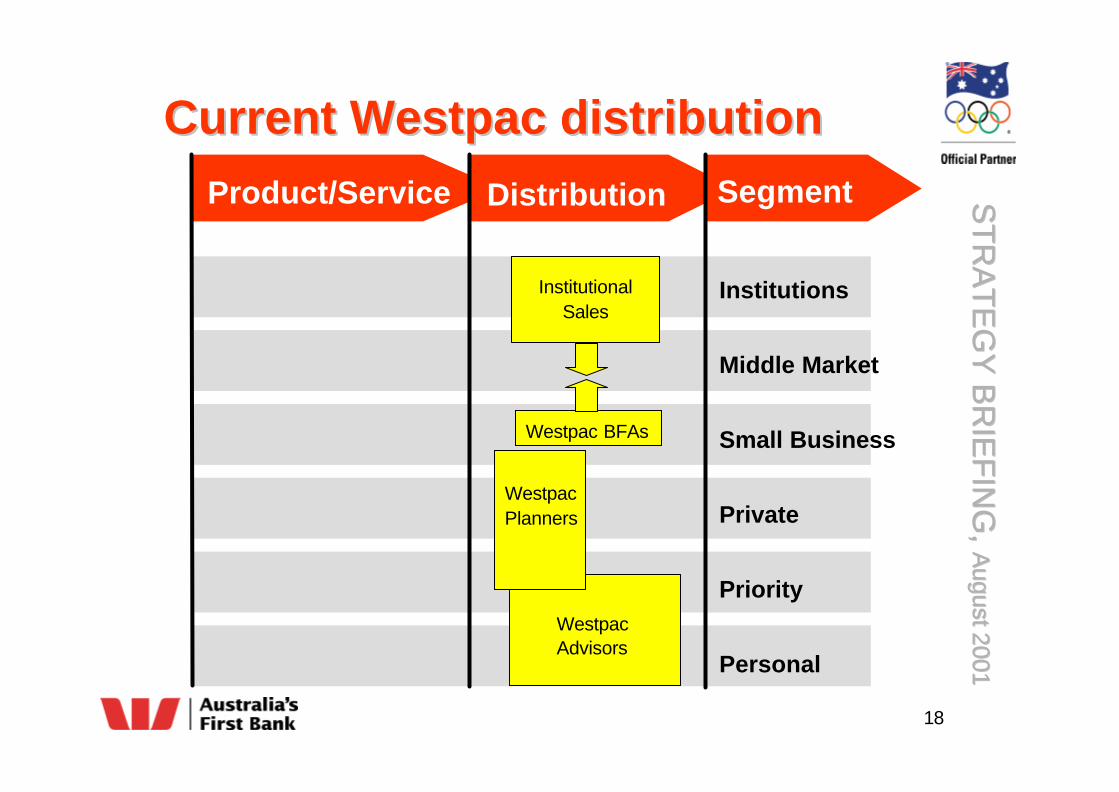
Current Westpac distributionCurrent Westpac distribution
Institutions
Middle Market
Small Business
Private
Priority
Personal
InstitutionalSales
Westpac BFAs
WestpacAdvisors
WestpacPlanners
Product/Service Distribution Segment

ST
RA
TE
GY
BR
IEF
ING
, S
TR
AT
EG
Y B
RIE
FIN
G, A
ugust 2001A
ugust 2001
19
Distribution opportunitiesDistribution opportunities
InstitutionalSales
Westpac BFAs
WestpacAdvisors
WestpacPlanners
Product/Service Distribution Segment
IFAs
HPJDV
Institutions
Middle Market
Small Business
Private
Priority
Personal
ST
RA
TE
GY
BR
IEF
ING
, S
TR
AT
EG
Y B
RIE
FIN
G, A
ugust 2001A
ugust 2001
20
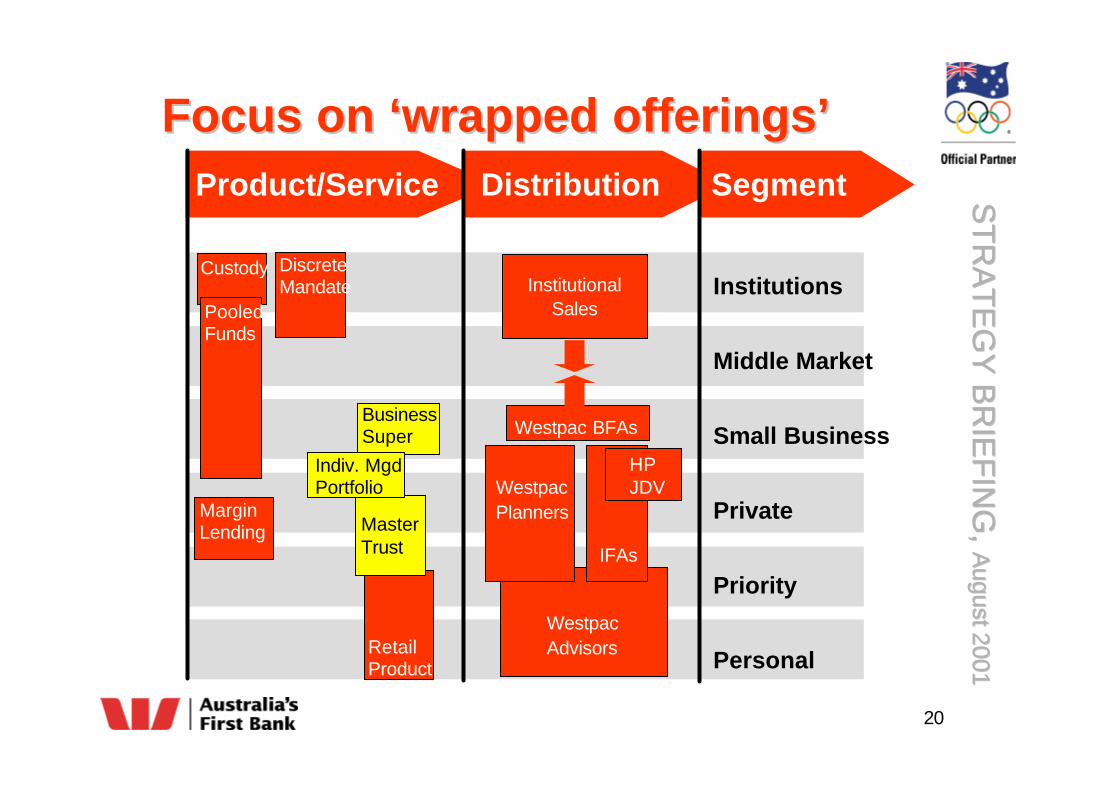
Focus on ‘wrapped offerings’Focus on ‘wrapped offerings’
Institutions
Middle Market
Small Business
Private
Priority
Personal
DiscreteMandate
BusinessSuper
RetailProduct
MasterTrust
MarginLending
Custody
PooledFunds
Product/Service Distribution Segment
Indiv. MgdPortfolio
InstitutionalSales
Westpac BFAs
WestpacAdvisors
WestpacPlanners
IFAs
HPJDV
ST
RA
TE
GY
BR
IEF
ING
, S
TR
AT
EG
Y B
RIE
FIN
G, A
ugust 2001A
ugust 2001
21
In summary...In summary...
• High growth and high return business
• Leveraging our comparative advantages
• Expanding distribution size and
capability
• Providing best of breed products

ST
RA
TE
GY
BR
IEF
ING
, S
TR
AT
EG
Y B
RIE
FIN
G, A
ugust 2001A
ugust 2001
22