financial sector deepening and economic growth: evidence ...meea.sites.luc.edu/volume9/pdfs/damar...
TRANSCRIPT

Financial Sector Deepening and Economic Growth:
Evidence From Turkey
Oya Pınar Ardıc∗ H. Evren Damar†
November 2006
Abstract
This paper analyzes the effects of financial sector deepening on economic growthusing a province-level data set for 1996-2001 on Turkey. This period is associated witha weakly regulated and relatively unsupervised expansion of the banking sector whichled to the 2001 financial crisis. Contrary to findings in the previous literature, our resultsindicate a strong negative relationship between financial deepening—both public andprivate—and economic growth. In light of the developments in the period of analysis,this result is not surprising, as the main function of the banking sector at that timewas to provide financing for the Turkish Treasury, which channeled these funds to thegovernment—albeit mainly for rent distribution purposes. However, it is important tonote that the growth of private banking sector needs yet to be examined separately,as government ownership of banks may distort the development of the banking sectoras a whole. Yet, it is possible to conclude that financial development may not alwayscontribute to economic growth, and the conditions under which such a contributiontakes place should be investigated further.
Keywords: Financial sector; Economic growth; Panel data; GMM; TurkeyJEL Classification: G21; O16; O40
∗Bogazici University, Department of Economics, Bebek 34342, Istanbul, Turkey. Phone: +90(212)359-7650 Fax: +90(212)287-2453 e-mail: [email protected] URL: http://www.econ.boun.edu.tr/ardic
†Pacific Lutheran University, Department of Economics, Tacoma, WA 98447, USA. Phone: +1 (253) 5317144, Fax: +1 (253) 535 8305. [email protected] URL: http://www.plu.edu/∼damaree
1
Topics in Middle Eastern and African Economies Vol. 9, September 2007

1 Introduction
The link between financial development and economic growth (the “finance-growth nexus”)
has long received significant attention in economics. This attention is well-justified, since a
better understanding of how the financial sector contributes to economic growth has impor-
tant regulatory implications. Within the finance-growth nexus literature, some have argued
that financial intermediaries mobilize, pool and channel domestic savings into productive
capital, and by doing so they contribute to economic growth. If this view is to be accepted,
then a competitive and well-developed banking sector must be an important contributor to
(regional or national) economic growth. In a competitive banking sector, borrowing rates
are higher and lending rates are lower, so the transformation of household savings into
productive capital investment is faster (Valverde et al., 2003). On the other side of this
debate is an argument that financial development is a consequence, and not a cause, of eco-
nomic growth. In this view, economic growth increases demand for sophisticated financial
instruments, which in turn leads to growth in the financial sector.1
Over the years, there have been a number of empirical attempts to investigate the link
between financial development and economic growth. These studies have dealt with the
issue of the direction of causality between financial deepening and economic growth by
using instrumental variables. In this strand of literature, the practice is to model economic
growth as being dependent on financial sector deepening, and at the same time, taking into
account the possibility of bi-directional causality by finding other variables that are thought
to affect financial deepening but not economic growth as instruments.
Although most of these studies have found that financial development contributes to
economic growth, they have not ended the debate on the direction of causality between
economic growth and financial development. This is due to the fact that most studies in
this literature have used cross-country data sets. Since legal structures, cultural and eco-
nomic histories differ between countries, the possibility of omitted variable bias has often
1For a comprehensive review of arguments for and against the contribution of financial development toeconomic growth, please see Levine (2005).
2
Topics in Middle Eastern and African Economies Vol. 9, September 2007
been raised when discussing the results of cross-country studies. Therefore, the more recent
studies, such as Levine et al. (2000), have used methods that are less susceptible to bi-
ases caused by simultaneity, omitted variables and unobserved country-specific effects. For
instance, Levine et al. (2000) employ instrumental variables, while controlling for the dif-
ferences in institutions across countries to partially overcome the unobserved heterogeneity
due to omitted variables bias. They find that better legal systems provide a more suitable
environment for financial sector development, and financial sector development, in turn,
leads to higher economic growth. Despite such substantial improvements in the empirical
methods used, the issues of causality and omitted variable bias in cross-country studies are
not fully resolved and the debate continues.
A potential solution to the omitted variables and unobserved country-specific effects
problem is to look at growth within different the regions of a country. Although the homo-
geneity of institutions and culture within a country possibly reduces the omitted variable
bias, the impact of financial growth on regional growth remains relatively uninvestigated
in the literature. There exist some studies that have concluded that banking sector devel-
opment following deregulation has lead to state level economic growth in the U.S. (Clarke,
2002 and Jayaratne and Strahan, 1996).2 However, differences between the institutional
and legal structures among the states still raise the possibility of omitted variable bias.
Valverde et al. (2003), have investigated the issue of causality between financial develop-
ment and regional economic growth in Spain and this appears to be only study of its kind
looking at a country other than the U.S. Interestingly, Valverde et. al. (2003) find that
increased competition in the banking sector (which leads to higher deposit and lower loan
rates) has not Granger-caused economic growth in Spanish provinces. Their conclusion is
that the positive link between financial development and economic growth in cross-country
studies may be due to an unobserved third factor.
In light of these developments in the literature, the goal of this study is to investigate the
2In an earlier study, Samolyk (1994) looks at the link between credit conditions and regional economicactivity in different states of the U.S. She concludes that loan quality of local banks has a direct impact onregional economic performance, but not the other way around.
3
Topics in Middle Eastern and African Economies Vol. 9, September 2007

link between financial sector development and economic growth in Turkey at the province
level, for the period 1996-2001. The use of provincial level data reduces unobserved hetero-
geneity at the cross-section level, since legal environment, institutions and culture across
the provinces within a country are much more similar than those across different countries.
Moreover, in order to take into account the bi-directional causality between financial deep-
ening and economic growth, instrumental variables approach is utilized, following the recent
developments in the literature.
The specific focus of this paper is on the size of the financial sector, or “financial depth”,
defined as commercial bank deposits divided by GDP. Such a definition of financial inter-
mediary development is very much in line with the traditional view that the financial sector
can contribute to economic activity by mobilizing savings and channeling them towards
productive capital investment. However, the traditional view implicitly assumes reasonably
well-functioning financial intermediaries. The very limited amount of available evidence
suggests that the link between financial development and economic growth may be different
under adverse financial sector conditions compared to a case of well-functioning financial
intermediaries. For example, Samolyk (1994) finds that compared to good credit conditions,
low bank loan quality has a greater impact on real income growth in U.S. states.
In this sense, the case of Turkey during 1996-2001 is a perfect test of how the traditional
finance-growth nexus theories fare when faced by an inefficient banking sector. Since it
is widely agreed that the unregulated and unsustainable expansion of the banking sector
during the late 1990s has contributed to the financial crisis of 2001, the link between financial
deepening and economic activity in Turkish provinces may not be as straight-forward as
implied by traditional views of financial intermediation.
In fact, the results of the study reveal a strongly negative relationship between financial
deepening—measured in terms of both public and private banking sector—and growth in
real GDP per capita in Turkish provinces. Furthermore, the result appears to be robust
to a number of different econometric specifications commonly used in the empirical growth
literature. Although this finding contradicts most of the studies discussed above, it is
4
Topics in Middle Eastern and African Economies Vol. 9, September 2007

not very surprising. When one considers that the main function of the Turkish banking
sector during the late 1990s was to channel deposits into the Treasury (Denizer et al.,
2000), it becomes clear why an increase in financial depth may lead to a slowdown in
Real GDP per capita as those funds had mainly been used for rent distribution purposes
by the governments. In that sense, this study shows that financial development does not
always lead to economic growth and the conditions under which financial deepening occurs
are crucially important when contributions of financial intermediaries to economic activity
are discussed. It is likely that the somewhat dominant role of state banks in the banking
sector during the 1990s differentiate Turkey from other countries that have been studied in
the literature (such as Spain or the U.S.). A possible divergence in the effects of private
banking sector vs. public banking sector development on economic growth still remains to
be investigated, as government ownership of banks may distort the incentives in the banking
sector.
It should be noted here that the goal of this study is to investigate the link between
financial deepening and short-term economic activity (“short-run economic growth”). The
relatively short time-span of the data set (necessitated by data availability), implies that
limited conclusions can be reached concerning the link between financial development and
long-run economic growth.3 Nevertheless, the impact of financial development on day-to-
day economic activity at a regional level is an understudied topic and this is where the main
contributions of this study lie.
The rest of the study is as follows: Section 2 presents a brief overview of the Turkish
Banking Sector and explains the features of the financial deepening that took place during
the 1990s. Section 3 introduces the data set and the empirical methodology used. The
results of the empirical analysis and robustness tests are discussed in Section 4. Finally,
Section 5 concludes.
3Although the data set covers a significantly shorter time-span compared to the cross-country studies, itstime horizon is somewhat more comparable to the few existing studies of financial development and regionalgrowth. Perhaps due to similar issues, data sets used by Valverde et. al. (2003) and Samolyk (1994) onlycover the periods 1986-1998 and 1983-1990 respectively.
5
Topics in Middle Eastern and African Economies Vol. 9, September 2007

2 Financial Development in Turkey during the 1990s
The roots of the developments in the Turkish banking sector between 1996 and 2001 can
be traced back to the financial liberalization program initiated in the early 1980s. Prior
to 1980, banks in Turkey was repressed and highly regulated. Almost one-third of banks
were state-owned and there were ceilings on both deposit and lending rates. In order to
create a more market-based system, the government initiated a liberalization program in
1980, which continued throughout the 1980s.
The late 1980s and the 1990s also witnessed persistently high inflation along with a
large and rapidly growing budget deficit. Unable to bring the deficit under control, the
Turkish Treasury started to increasingly rely on selling securities to commercial banks.
With high net interest margins (NIMs) between borrowing and lending rates, banks favored
purchasing government securities over engaging in traditional banking activities. During
the 1980s and early 1990s, banks preferred to borrow funds from abroad and lend them
to the government. However, in the immediate aftermath of the crisis in 1994, in which
the currency was devalued and interest rates shot up, banks found it increasingly difficult
to borrow funds from international markets. This made them turn to mobilizing domestic
savings in order to raise funds to be lent to the government, although they had reverted
back to their previous strategy of borrowing in foreign currency and lending to the Treasury
(Damar, 2004).4
These developments can clearly be seen in the figures given in Table 1. Along with
the number of banks and bank branches, Table 1 also displays three traditional measures
of financial deepening for the period 1990-2001. DEPTH represents total deposits divided
by GDP and CREDIT is total loans given out by the banking sector divided by GDP.5
BANK-CB is the ratio of commercial bank assets to commercial bank plus central bank
4See Akcay et al. (2001), Alper (2001), Alper et al. (2001), and Alper and Onis (2004) for more detailson the development of the Turkish banking sector in the late 1990s and the early 2000s.
5In the financial development literature, the preferred measure is “Lending to Private Sector” divided byGDP, however, under the Turkish accounting standards of the 1990s, it is impossible to separate loans byrecipients.
6
Topics in Middle Eastern and African Economies Vol. 9, September 2007

assets. All three of these financial depth statistics measure the ability of commercial banks
to mobilize savings in the economy (Levine, et al., 2000).
The financial depth statistics confirm the attention paid by banks to mobilizing domestic
savings after 1994. During the post-1994 period, both DEPTH and BANK-CB started to
increase, along with the number of branches. The increase in branches probably reflects
increased competition for domestic deposits, following the reduction in the availability of
foreign funds. On the other hand, it is not clear how much of these savings were turned
into loans, since CREDIT remains fairly stable throughout the 1990s.
The figures in Table 1 reveal the main motivation behind this study. According to four
out of five measures, the 1990s were a period of financial development in Turkey. Most
of the existing evidence in the literature would then suggest that such a level of financial
deepening will have a positive impact on economic growth. However, this period of banking
sector growth was followed by an economic crisis in 2001. Although the crisis was triggered
by a political row between the Prime Minister and the President in February 2001, most
observers agree that it was actually caused by structural weaknesses in the financial sector.6
The result of the crisis was a devaluation of the currency, failure of a number of banks and
a severe contraction in output.
In light of these developments, it becomes very important to establish the link between
financial deepening and short-term economic performance. Specifically, the question that
needs to be answered is whether the crisis was caused by the rapid growth in the financial
sector during the 1990s or if it happened in spite of the level of financial development
that occurred prior to 2001. The answer to this question will make contributions to the
financial development - economic growth literature by starting to differentiate between
“good financial development” vs. “potentially harmful financial deepening.”
6See Ardıc and Yuzereroglu (2006) and the references therein for an overview of the crisis.
7
Topics in Middle Eastern and African Economies Vol. 9, September 2007

3 Data and Methodology
3.1 Methodology
Empirical growth literature has been subject to serious criticisms (see, for example, Brock
and Durlauf, 2001). The major questions raised against the literature can be summarized
in three parts. First, due to the open-endedness of the theories of growth underlying the
empirical literature, a consensus on the potential explanatory variables has not been reached.
Second, the majority of the studies in the literature treat countries (or cross-section units)
that have intrinsic differences as homogeneous units, using the same regression model for
all the cross-section units in the sample. Third, endogeneity is a crucial issue for growth
regressions, as the dependent variable and the explanatory variables may indeed have a
two-way relationship.
The purpose of this paper is to provide an analysis of the contribution of the develop-
ments in the Turkish banking sector to regional economic growth in Turkey. In order to do
so, it uses an empirical model that addresses the issues mentioned above, at least partly.
Note, however, that in order to account for all these issues, one can use Bayesian techniques
proposed by, for example, Brock and Durlauf (2001), Doppelhofer et al. (2000), etc. but
GMM estimation of a dynamic panel data set was chosen over this alternative.
The reasons for this choice are two-fold. First, this has become a standard practice in
analyses of financial deepening and economic growth (see, for example, Levine et al., 2000
and Beck et al., 2000, and Levine, 2005). Second, given the issues on data availability, a
dynamic-panel GMM estimation is better suited to meet the particular needs of this study.
As described in the next subsection, the data set consists of 81 provinces over a 6-year pe-
riod. Reliable data at the provincial level is only available for a small number of potential
explanatory variables. Thus, even though the open-endedness of growth theories is a criti-
cism of the finance-growth nexus literature in general, this data set contains only a limited
number of control variables. Because of this inevitable omission of potential explanatory
variables, and because of the concern that the cross-section units may not be homogeneous
8
Topics in Middle Eastern and African Economies Vol. 9, September 2007
regardless, the issue of unobserved heterogeneity arises. The use of fixed effects in a panel
setting partially accounts for this, by making it possible to model unobserved heterogeneity.
In addition, as this study has a cross-province (as opposed to a cross-country) focus, one
would expect that the degree of heterogeneity is not as high. In addition, the endogeneity
problem is taken care of by the use of lagged differences of explanatory variables and data
on banks’ costs and revenues as instruments.
Hence, the rest of this section conforms with the standard practice in the empirical
growth literature to develop the model to be used in this paper by first introducing a
standard cross-section empirical growth model, and then developing a dynamic panel data
model for cross-province growth.
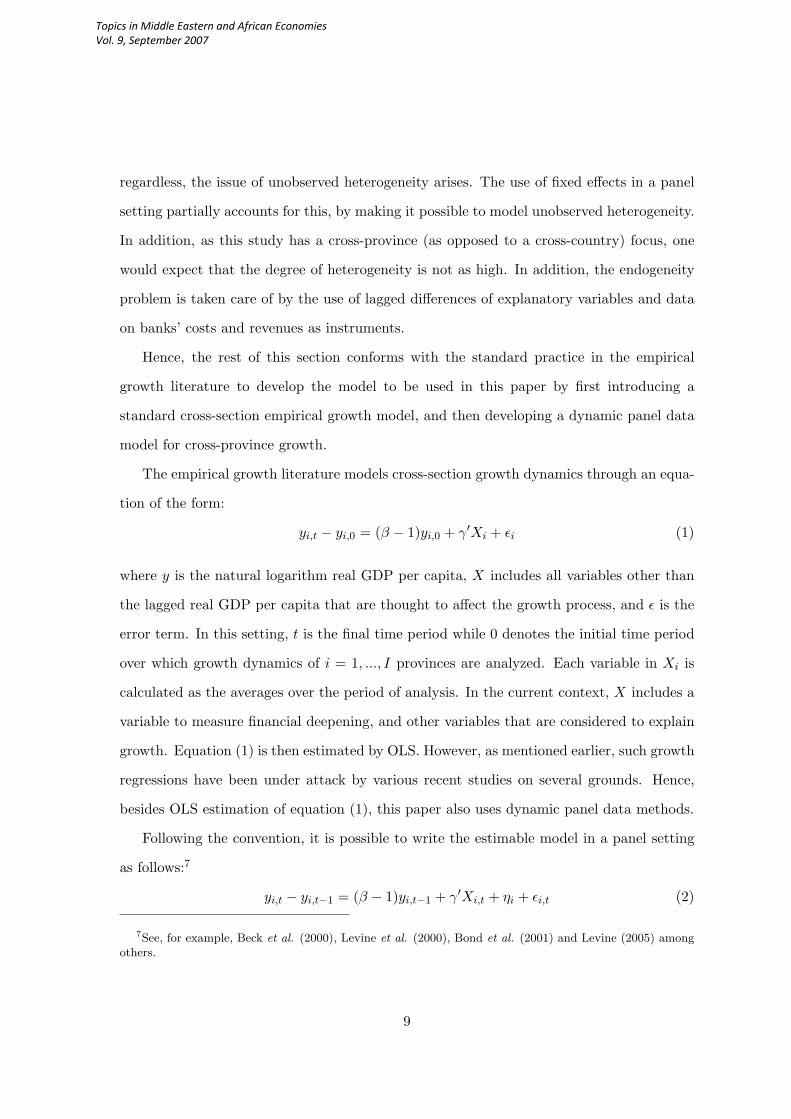
The empirical growth literature models cross-section growth dynamics through an equa-
tion of the form:
yi,t − yi,0 = (β − 1)yi,0 + γ′Xi + εi (1)
where y is the natural logarithm real GDP per capita, X includes all variables other than
the lagged real GDP per capita that are thought to affect the growth process, and ε is the
error term. In this setting, t is the final time period while 0 denotes the initial time period
over which growth dynamics of i = 1, ..., I provinces are analyzed. Each variable in Xi is
calculated as the averages over the period of analysis. In the current context, X includes a
variable to measure financial deepening, and other variables that are considered to explain
growth. Equation (1) is then estimated by OLS. However, as mentioned earlier, such growth
regressions have been under attack by various recent studies on several grounds. Hence,
besides OLS estimation of equation (1), this paper also uses dynamic panel data methods.
Following the convention, it is possible to write the estimable model in a panel setting
as follows:7
yi,t − yi,t−1 = (β − 1)yi,t−1 + γ′Xi,t + ηi + εi,t (2)
7See, for example, Beck et al. (2000), Levine et al. (2000), Bond et al. (2001) and Levine (2005) amongothers.
9
Topics in Middle Eastern and African Economies Vol. 9, September 2007

where η is an unobserved effect specific to each province i, ε is the error term, and the
subscript t denotes the time period. The regressors might include period dummies to
capture the time-specific effects.
To eliminate the unobserved province-specific effect, the following two-steps are neces-
sary. First, rewrite equation (2) by adding yi,t−1 to both sides as:
yi,t = βyi,t−1 + γ′Xi,t + ηi + εi,t (3)
and second, take the first differences of equation (3) to get:
∆yi,t = β∆yi,t−1 + γ′∆Xi,t + ∆εi,t (4)
where ∆xt = xt − xt−1 denotes the first difference of a variable x.
In the context of empirical growth models, the endogeneity of the regressors is a crucial
issue. In addition, once the model is transformed as above so that the unobserved province-
specific effect is eliminated, one induces a correlation between the first-differenced error
term and the lagged dependent variable in equation (4). Hence, the estimation of such a
model by the GMM dynamic panel estimator requires the following moment conditions:
E[yi,t−s∆εi,t] = 0 for s ≥ 2, t = 3, ..., T (5)
E[Xi,t−s∆εi,t] = 0 for s ≥ 2, t = 3, ..., T (6)
which basically require that the error term is not serially correlated and the regressors are
assumed not to be correlated with the future values of the error term. See Arellano and
Bond (1991), and Arellano and Bover (1995) for details.
As shown in Arellano and Bover (1995), and Blundell and Bond (1998), the GMM esti-
mator discussed above has a potential bias attributable to lagged values of the explanatory
variables being weak instruments in (4) if the explanatory variables are persistent over
time. The solution is to combine (3) with (4) to form a system. Then, for equation (3), the
10
Topics in Middle Eastern and African Economies Vol. 9, September 2007

relevant instruments would be the lagged differences of the explanatory variables of that
equation itself while for equation (4) the instruments are unchanged, i.e. the lagged values
of Xi,t and yi,t−1. This is possible under the following additional moment conditions:
E[∆yi,t−1(ηi + εi,t)] = 0 (7)
E[∆Xi,t−1(ηi + εi,t)] = 0 (8)
which simply require that the explanatory variables in differences are uncorrelated with the
unobserved individual effect.
Thus, combining equations (3) and (4) together with the moment conditions (5), (6), (7)
and (8), one can form a GMM estimator that is consistent and efficient. At this point, it is
important to note that instrument validity is essential. This is addressed by the use of two
tests, which have become a standard practice since put forth by Arellano and Bond (1991),
Arellano and Bover (1995) and Blundell and Bond (1998). One is the Sargan test which
tests the validity of the set of instruments with the null hypothesis that the instruments
are not correlated with the residuals, and the other is a test for the presence of a second
order autocorrelation in the error term. First order autocorrelation is not tested for, as the
derivation of the model makes this inherent in the errors.
In order to account for financial deepening and its effects on economic growth during the
period 1996-2001 in Turkey, a model of the form (2) - (4) is estimated where the explanatory
variables, Xi,t include a measure of financial depth, DEPTH, along with the conventional
variables in the empirical growth literature such as population growth (n), a measure of
openness of each province (OPEN = (Exports + Imports)/GDP ), and two measures of
human capital: education, EDU , and health, Health. Period dummies are also included
to capture any time-specific effects. Besides the cross-section OLS and the dynamic panel
GMM methods outlined above, other simple -benchmark- estimatiors such as pooled OLS
and within group estimators, which fail to address one or more of the criticisms mentioned
at the beginning of this section, are employed as well.
11
Topics in Middle Eastern and African Economies Vol. 9, September 2007
3.2 Data
The data set includes 81 provinces of Turkey between 1996-2001. Some of these provinces
were formed during the period of analysis, and hence, the data set is an unbalanced panel.
The dependent variable is the growth rate of real per capita GDP, denoted as gy, cal-
culated as the first difference of the natural logarithm of per capita real GDP.8
The explanatory variables include the lagged value of the real GDP per capita, in natural
logarithms (y). Other variables that are thought to affect growth are population growth (n),
education (EDU), health (Health), and openness (OPEN). Annual provincial population
growth is calculated using mid-year population estimates. Education measure is constructed
using teacher-to-student ratio in each province for each year. Number of hospital beds per
100,000 in each province for each year is used as a proxy for health. Openness measure
is the standard one used in the empirical growth literature: it is the ratio of the sum of
exports and imports of each province to the GDP of each. Education and health measures
are included to control for the effects of human capital on growth. It is expected that
the higher values of these two measures imply a larger per capita income growth rate
for the province. In addition, it is expected that per capita income growth and population
growth are negatively related, as implied by theory. Population growth enters in the growth
regression as POPN = ln(n + g + δ) where g is the rate of technological progress and δ
is the rate of depreciation, and g + δ = 0.05 following the convention in the literature.9
Further, openness measure and per capita income growth are expected to have a positive
relationship.10 The data for these explanatory variables at the province level came from
the Turkish Institute of Statistics (TURKSTAT).
The level of financial depth in a province is captured by DEPTH, which is total bank
8Real GDP per capita at the provincial level is constructed using the production approach to GDP. Asproduction and income in a province may be different at certain instances - for example, the province ofKocaeli is very close to Istanbul and is a center of production activity, while income earners from thatproduction activity mostly live in Istanbul - this may indicate a potential mismeasurement.
9This is indicated by the Solow model. See, for example, Mankiw et al. (1992) for details.
10Due to data unavailability, it was not possible to include a measure of savings at the provincial level.
12
Topics in Middle Eastern and African Economies Vol. 9, September 2007

deposits divided by GDP. A few different measures of financial development are used in
the finance-growth nexus literature, but the deposits-to-GDP ratio is the obvious choice
for this study. Although there is some province-level loan data available for Turkey, it is
not possible to separate out loans by state banks (especially to local governments and state
owned enterprises) from the overall lending figures. Since such lending is not generally
considered as financial development in the existing literature, using the credits-to-GDP
ratio (CREDIT in Table 1) was impractical. Similarly, the commercial bank assets divided
by commercial bank and central bank assets ratio (BANK − CB in Table 1) can not be
calculated at a province level. This leaves DEPTH as the only possible measure of financial
depth that can be used at a province level. Furthermore, using this variable as a measure
of financial depth can also help answer the question of whether banks mobilizing savings
in the provinces but lending them to the government (instead of local firms) will have a
negative impact on regional economic development or not.
As discussed above, lagged values of dependent variables (and their differences) are com-
monly used as instruments during the GMM estimation. However, it is also possible to use
bank level cost and revenue data to construct valid instruments that take into consideration
banks’ preference towards collecting deposits in low cost, high revenue areas. In order to
explore this opportunity, a number of such instruments were constructed and included in
the analysis along with the lagged dependent variables. Using individual bank balance sheet
data, ratios of interest expense to total deposits, non-interest expense to total deposits, in-
terest revenue to total deposits and non-interest revenue to total deposits were calculated for
each bank. Then, the market share of each bank in each province was calculated using the
distribution of bank branches within provinces. Finally, a market share weighted average of
banks’ interest and non-interest costs per $1 of deposits was calculated for each province.
These provide an estimate of interest and non-interest costs of collecting $1 of deposits in
a given province. These two variables are referred to as the “micro-cost instruments.” The
same process was also repeated for the interest and non-interest revenue ratios in order to
calculate the estimated average revenue from collecting $1 of deposits in a province. These
13
Topics in Middle Eastern and African Economies Vol. 9, September 2007

two variables were then called the “micro-revenue instruments.” Bank balance sheet data
required for the construction of these instruments was obtained from Banks Association of
Turkey (BAT).
Table 2 summarizes the descriptive statistics of the dependent and explanatory variables,
and Table 3 summarizes the descriptive statistics for the micro-cost (IE/D for interest and
N − IE/D for non-interest costs) and micro-revenue (IR/D for interest and N − IR/D for
non-interest revenue) instruments. Table 4 provides the correlation matrix of the data.
4 Empirical Analysis
As mentioned above, the analysis in this paper is done using two different methods: cross-
section analysis and dynamic panel data analysis. The findings of each are reported below.
Table 5 displays the results of OLS estimation of equation (1). It is observed that the
financial depth variable has a negative coefficient which is significant at 1%, i.e. financial
deepening and economic growth are negatively related at the provincial level during the
period of analysis. This indicates that when total bank deposits-to-GDP ratio increases by
one percentage point, the provincial growth rate declines by approximately eight percentage
points. Although this result may seem counterintuitive initially, it is important to reiterate
that the period of analysis coincides with the pre-crisis period in Turkey in which the
financial sector experienced a somewhat unregulated growth. Hence, this finding supports
the claims that the crisis of 2001 was mainly due to the vulnerabilities in the banking sector
as a result of this unregulated growth.
In addition to this finding, the rest of the estimation results demonstrate the following.
As expected, the initial value of real per capita income, yt−1, has a negative estimated
coefficient, significant at 1%. Hence, this is indicative of the existence of diminishing returns
over the five-year period. Moreover, the coefficient of population growth is negative and
significant at 1%, indicating that provinces with higher population growth tend to have
slower growth in terms of real income per capita, confirming expectations. The measures
14
Topics in Middle Eastern and African Economies Vol. 9, September 2007

of education and health are not significant in explaining the growth rate of real per capita
income in the context of this cross-section growth analysis. Finally, provinces that trade
largely with the rest of the world are likely to experience higher real per capita income
growth.11
The second part of empirical analysis adopts the dynamic panel data analysis. This is
done in three ways: estimating equation (3) via GMM using optimally lagged instruments,
estimating equation (4) via GMM using optimally lagged instruments, and estimating a
system of equations (3) and (4) via GMM using optimally lagged instruments.12 This set
of three estimations are performed for different instrument sets: one including only the
relevant lags of the explanatory variables, and others including the relevant lags of the
different combinations microcost and microrevenue variables along with the relevant lags of
the explanatory variables.
Tables 6 and 7 summarize the results.13 Table 6 reports the summary results for the
financial depth variable only. As including different combinations of microcost and mi-
crorevenue variables among the instruments did not alter the results, only the estimates
using the relevant lags of non-interest expense for a $1 of deposits (N − IE/D) as addi-
tional instruments are presented. As can be observed from Table 6, financial deepening and
growth are significantly and negatively related over the period of analysis, confirming the
findings of the cross-section analysis.
Table 7 presents the full estimation for results of the system estimators using the rel-
evant lags of explanatory variables as instruments, labeled in the table as [1], and the
11In cross-section estimation, explanatory variables, except the lagged value of real per capita income, areconstructed by calculating the averages of each variable for each province over the entire period of analysis.As indicated above, the data set includes 81 provinces, however, some of these provinces were establishedduring the period of analysis and thus have shorter data. In the panel setting, the data set is an unbalancedpanel, however, in the cross-section setting, those provinces with shorter data span were left out of theestimation, and hence, the number of included observations is 76.
12Although the first estimation is not relevant for growth, as it is used in forming the system estimator ofthe third, it is performed for comparison purposes.
13The dynamic panel GMM estimations are performed using Arellano and Bond’s DPD98 procedure forGauss. Full estimation results are not reported for space considerations. They are available from the authors.
15
Topics in Middle Eastern and African Economies Vol. 9, September 2007

relevant lags of the microcost variable as additional instruments, labeled in the table as
[2].14 As before, since the estimation results using the relevant lags of different combina-
tions of microcost and microrevenue instruments produce similar outcomes, only those with
non-interest expense for a $1 of deposits are presented. The results indicate that openness
indicator is significantly and positively related to economic growth, as expected. In ad-
dition, when the microcost variable is added as an additional instrument, health becomes
positively significant as well. Population growth and education are insignificant as deter-
minants of provincial growth. Furthermore, it is possible to note that years 1999 and 2001
have significant negative effects on real per capita provincial income growth while the year
2000 has a significant and positive impact. As 1999 corresponds to a relative slowdown in
the economy as a whole, 2000 is when there is a slight recovery and 2001 corresponds to
the year in the aftermath of the crisis, such time dummy effects are expected.
Since Table 7 reports the estimation results for equations (3) and (4), the coefficient
estimate of yt−1 is the estimate of β. One would expect, in the presence of diminishing
returns, that initial real per capita income and the growth rate of real per capita income
to be negatively related, as in equation (2). Hence, β − 1 would give us this relation, as
estimates of β are between 0 and 1. In fact, the convergence coefficient implied by [1]
and [2] are 6.30% and 3.88% annually, indicating that there exists positive convergence
among the provinces in terms of real per capita income during the period of analysis.15
Since the empirical model includes control variables other than the lagged value of the real
per capita income, these results are evidence for the existence of conditional convergence.
Other studies that find evidence for conditional convergence in the Turkish context include
Filiztekin (1998), and Dogruel and Dogruel (2003).
The system GMM estimates satisfy the specification tests. Table 7 reports the results
14For system estimators, one-step estimates are reported as two-step estimates have downward biasedstandard errors. See Blundell and Bond (1998) or Bond et al. (2001). The standard errors of one-stepestimates are also asymptotically robust to heteroskedasticity.
15The convergence coefficient implied by the cross-section analysis above is 3.08%. For more on thederivation of the convergence coefficient see Mankiw et al. (1992) which is the pioneering work on theempirical applications of the Solow growth model.
16
Topics in Middle Eastern and African Economies Vol. 9, September 2007

of five tests: Wald test for the joint significance of coefficients, Wald test for the joint
significance of time dummies, Sargan test, and second order autocorrelation tests. Since
the model is first differenced, it is natural to have first order serial correlation in the errors,
however, one would like to have no second order serial correlation. As can be observed from
the results, the null hypothesis of no second order serial correlation cannot be rejected at
any conventional significance levels. Moreover, the findings also indicate that the coefficients
and the time dummies are jointly significant. Sargan test is a test for the validity of the
instruments. The null hypothesis is that the instruments used are not correlated with
the error terms. According to our results, this null hypothesis cannot be rejected at any
conventional significance levels either.
The relationship between financial deepening an growth in the data set is further inves-
tigated using pooled OLS and within groups estimators. These methods ignore the issue
of endogeneity. In addition, pooled OLS also dispenses with the unobserved heterogeneity
dimension. Nevertheless, the estimation of such models is done as a benchmark for com-
parison purposes. The findings indicate that the negative relationship between financial
deepening and economic growth prevails using these methods as well.16
5 Concluding Remarks
This study looked at the link between financial development and economic growth in the
provinces of Turkey. Using both traditional OLS and dynamic panel GMM techniques, it
was shown that financial deepening (i.e. an increase in the total deposits to GDP ratio) has
a direct and robust impact on the growth rate of real GDP per capita. However, unlike most
of the cross-country studies in this literature, the findings suggest that financial development
has a negative relationship to economic growth. Although this conclusion may be puzzling
upon first glance, it does fit rather well with the state of the Turkish economy and banking
sector during the late 1990s. Unlike the traditional theories of financial intermediation, the
16The estimation results of these models are not reported for space considerations. They are availablefrom the authors upon request.
17
Topics in Middle Eastern and African Economies Vol. 9, September 2007

Turkish banking sector during this period was not mobilizing and pooling domestic savings
in order to invest in productive capital. Instead, the sector was engaged in channeling
domestic resources to the government, which used the funds to cover its budget deficit.
This is a much different situation compared to the U.S. (studied by Jayaratne and Strahan,
1996 and Clarke, 2004) or Spain (Valverde, et al., 2003) during the 1980s and the 1990s.
When one considers what happened in Turkey during 1996-2001, it becomes clear that
the findings of this study are not directly contrary to the existing studies in the literature.
This study confirms the very important link between financial development and growth, but
also sounds a note of caution that not all types of financial deepening is beneficial for the
economy. In the case of Turkey, financial deepening meant that savings left the provinces,
depriving the real industry of credit needed for investment projects. As such, it may not
be hard to imagine that if the banking sector was functioning efficiently during this period,
then financial deepening may have contributed to economic growth in the provinces, as
opposed to taking them into a serious crisis.
At this point, it is important to note that financial deepening is measured in terms of the
growth of both the public and the private banks. As is well-documented in the literature,
government ownership of banks may distort incentives leading to an underdevelopment of
the banking sector.17 Therefore, financial sector deepening in terms of the public and private
banks could be analyzed separately before making firm conclusions about the negative
relationship between financial growth and economic growth.
There are a number of other remaining issues that require attention from future studies.
The unavailability of data has forced this study to concentrate on the impact of financial
development to short-term economic fluctuations. A similar dynamic panel analysis with a
longer horizon is undoubtedly necessary. Also, an inclusion of additional variables, in order
to account for economic and cultural variations between different provinces (however small
these may be) can also improve the reliability of the results.
17See, for example, La Porta et al. 2002. Although there are major differences between state and privatebanks, it appears that lending to the government was equally important for both groups. During 1996-2001the average Securities to Total Assets ratio was 14.58% for private banks and 10.10% for state banks.
18
Topics in Middle Eastern and African Economies Vol. 9, September 2007

References
[1] Akcay, O.C., R. Erzan and R. Yolalan (2001) “An Overview of the Turkish Banking
Sector,” Bogazici Journal, 15, 13-23.
[2] Alper, C.E. (2001) “The Turkish Liquidity Crisis of 2000: What Went Wrong?”
Russian and Eastern European Finance and Trade, 37, 51-71.
[3] Alper, C.E., M.H. Berument and N.K. Malatyalı (2001) “The Impact of the Disinfla-
tion Program on the Structure of the Turkish Banking Sector,” Russian and Eastern
European Finance and Trade, 37, 72-84.
[4] Alper, C.E. and Z. Onis (2004) “The Turkish Banking System, Financial Crises and the
IMF in the Age of Capital Account Liberalization: A Political Economy Perspective,”
New Perspectives on Turkey, 30, 25-54.
[5] Ardıc, O.P. and U. Yuzereroglu (2006) “A Multinomial Logit Model of Bank Choice:
An Application to Turkey ,” Bogazici Univeristy Working Paper, No: 06-02.
[6] Arellano, M. and S. Bond (1991), “Some Tests of Specification for Panel Data: Monte
Carlo Evidence and an Application to Employment Equations,” Review of Economic
Studies, 58, 277-297.
[7] Arellano, M. and O. Bover (1995), “Another Look at the Instrumental Variable Esti-
mation of Error-Components Models,” Journal of Econometrics, 68, 29-51.
[8] Beck, T., R. Levine, and N. Loayaza (2000), “Finance and the Sources of Growth,”
Journal of Financial Economics, 58, 261-300.
[9] Blundell, R. and S. Bond (1998) “Initial Conditions and Moment Conditions in Dy-
namic Panel Data Models,” Journal of Econometrics, 87, 115-143.
[10] Bond, S., A. Hoeffler, and J. Temple (2001), “GMM Estimation of Empirical Growth
Models,” CEPR Discussion Paper Series, International Macroeconomics, No: 3048.
19
Topics in Middle Eastern and African Economies Vol. 9, September 2007

[11] Brock, W. and S. Durlauf (2001) “Growth Empirics and Reality,” World Bank Eco-
nomic Review, 15, 229-272.
[12] Carbo Valverde, S., D.B. Humphrey, and F. Rodriguez Fernandez (2003), “Deregula-
tion, Bank Competition and Regional Growth,” Regional Studies, 37, 227-237.
[13] Clarke, M. Z. (2004), “Geographic Deregulation of Banking and Economic Growth,”
Journal of Money Credit and Banking, 36, 929-942.
[14] Damar, H. E. (2004) “The Turkish Banking Sector in the 1980s, 1990s and Beyond,”
Unpublished Manuscript.
[15] Denizer, C. A., N. Gultekin, and N. B. Gultekin (2000) “Distorted Incentives and
Financial Development in Turkey,” World Bank Financial Structure and Economic
Development Conference Papers.
[16] Dogruel, F. and S. Dogruel (2003), “Regional Income Differences in Turkey and
Growth,” (in Turkish) in A. Kose, F. Senses and E. Yeldan (eds.) Iktisat Uzerine
Yazılar I: Kuresel Duzen, Birikim, Devlet ve Sınıflar - Korkut Boratav’a Armagan,
Istanbul: Iletisim, 287-318.
[17] Doppelhofer, G., R. Miller, and X. Sala-i Martin (2000) “Determinants of Long-Term
Growth: A Bayesian Averaging of Classical Estimates (BACE) Approach,” NBER
Working Paper, No: 7750.
[18] Filiztekin, A. (1998), “Convergence among the Provinces in Turkey,” (in Turkish) in
M. Aytac, E. Isıgıcok, and F. Acar (eds.) Proceedings of the 3rd National Econometrics
and Statistics Symposium, Bursa: Uludag University Publications.
[19] Jayaratne J., and P. E. Strahan (1996), “The Finance-Growth Nexus: Evidence from
Bank Branch Deregulation,” Quarterly Journal of Economics, 111, 639-670.
[20] La Porta, R., F. Lopez-de-Silanes, and A. Schleifer (2002) “Government Ownership of
Banks,” Journal of Finance, 57, 265-301.
20
Topics in Middle Eastern and African Economies Vol. 9, September 2007
[21] Levine, R. (2005), “Finance and Growth: Theory and Evidence” in P. Aghion and S. N.
Durlauf (eds.), Handbook of Economic Growth, Vol. 1A, North-Holland, Amsterdam,
865-934.
[22] Levine, R., N. Loayaza, and T. Beck (2000), “Financial Intermediation and Growth:
Causality and Causes,” Journal of Monetary Economics, 58, 31-77.
[23] Mankiw, G., D. Romer, D. Weil (1992), “A Contribution to the Empirics of Economic
Growth,” Quarterly Journal of Economics, 107, 407-437.
[24] Samolyk, K. A. (1994), “Banking Conditions and Regional Economic Performance:
Evidence of a Regional Credit Channel,” Journal of Monetary Economics, 34, 259-278.
21
Topics in Middle Eastern and African Economies Vol. 9, September 2007

Year Banks Branches DEPTH CREDIT BANK-CB
1990 64 5549 0.2420 0.1411 0.73501991 63 6162 0.2639 0.1666 0.75311992 69 6323 0.2794 0.1945 0.75751993 70 6324 0.2749 0.2191 0.78571994 67 6235 0.3296 0.2049 0.74441995 68 6383 0.3433 0.1950 0.74281996 69 6618 0.4160 0.2208 0.76921997 72 7064 0.4350 0.2249 0.80471998 75 7574 0.4630 0.4157 0.84251999 81 7909 0.6234 0.1824 0.84702000 79 8078 0.5493 0.2342 0.86052001 61 7178 0.6538 0.2078 0.7379
Table 1: Financial Development measures in Turkey for the period 1990-2001. DEPTH is givenby “Total Deposits/GDP”, CREDIT is “Total Loans/GDP” and BANK-CB is “Commercial BankAssets/(Commercial Bank + Central Bank Assets)”
gy yt yt−1 DEPTH POPN EDU Health OPEN
Mean 0.0262 8.4446 8.4185 -1.7855 -2.8632 -3.2054 5.1382 0.0917Median 0.0269 8.4899 8.4636 -1.7482 -2.8154 -3.1615 5.1761 0.0470Maximum 0.6983 9.7763 9.7707 0.1754 -2.3799 -2.6340 6.4520 0.8245Minimum -0.2496 7.2034 7.1929 -3.2180 -4.2434 -4.1359 3.7842 0.0000Std. Dev. 0.1112 0.4752 0.4821 0.5822 0.2924 0.2596 0.5143 0.1265
Table 2: Descriptive Statistics. Dependent and Explanatory Variables. Variables in naturallogarithms, except for growth rates which are log differences. gy denotes growth rate of real percapita income, y is real per capita income, DEPTH and POPN are financial depth and populationgrowth, respectively. Education indicator, EDU, is student-to-teacher ratio, Health indicator isnumber of hospital beds per 100,000, and openness indicator, OPEN, is exports plus imports-to-GDP.
IE/D N-IE/D IR/D N-IR/D
Mean 0.3182 0.0747 0.4210 0.0092Median 0.3093 0.0738 0.4023 0.0169Maximum 0.5450 0.1254 0.7919 0.0596Minimum 0.1956 0.0460 0.2708 -0.0768Std. Dev. 0.0738 0.0138 0.1100 0.0308
Table 3: Descriptive Statistics. Potential Instruments. IE/D and N-E/D are the estimated interestand non-interest costs of collecting a $1 of deposits in a province, respectively. IR/D and N-IR/Dare interest and non-interest revenues earned from collecting $1 in deposits in a province.
22
Topics in Middle Eastern and African Economies Vol. 9, September 2007

gy
yt
yt−
1D
EPT
HPO
PN
ED
UH
e alth
OPEN
IE/D
N-I
E/D
IR/D
N-I
R/D
gy
1y
t0.0
546
1y
t−1
-0.1
769
0.9
731
1FD
-0.2
049
0.3
559
0.3
981
1PO
PN
-0.0
154
0.0
556
0.0
584
-0.1
682
1ED
U0.0
054
0.4
215
0.4
142
0.3
879
-0.4
208
1H
e alth
-0.0
132
0.5
342
0.5
296
0.4
888
-0.2
190
0.5
291
1O
PEN
-0.0
445
0.4
393
0.4
433
0.4
478
0.3
064
-0.1
960
0.2
358
1IE
/D
-0.4
292
-0.2
349
-0.1
325
-0.0
104
-0.1
991
0.0
257
-0.0
324
-0.2
356
1N
-IE/D
-0.1
757
0.2
205
0.2
579
0.3
053
0.0
399
-0.0
093
0.1
288
0.2
499
-0.0
109
1IR
/D
-0.4
542
-0.1
459
-0.0
390
0.0
744
-0.1
598
0.0
013
0.0
017
-0.1
072
0.9
472
0.2
031
1N
-IR
/D
0.3
850
0.0
497
-0.0
399
-0.1
535
0.1
247
0.0
386
-0.0
469
-0.0
053
-0.6
954
-0.4
493
-0.8
437
1
Tab
le4:
Corr
elati
on
Matr
ix.
The
vari
able
defi
nit
ions
are
pro
vid
edin
the
note
sfo
rTable
s2
and
3.
23
Topics in Middle Eastern and African Economies Vol. 9, September 2007

Constant 0.1632 (0.9891)yt−1 -0.1400* (0.0542)DEPTH -0.0798* (0.0343)n -0.1495* (0.0682)EDU 0.0088 (0.1176)Health 0.0978 (0.0703)OPEN 0.3533*** (0.2093)S.E.E. 0.1276R2 0.1806No. Obs. 76
Table 5: Financial deepening and growth: cross-sectional OLS estimation of equation (1). Stan-dard errors are in parentheses. *, **, and *** show that the coefficient estimate is significant at 1%,5% and 10%, respectively.
[1] [2]
Levels -0.0116* -0.0123*(0.0009) (0.0010)
First Differences -0.1250* -0.1289*(0.0057) (0.0059)
System -0.1255* -0.1247*(0.0229) (0.0205)
Table 6: Financial deepening and growth: summary of dynamic panel analysis. Levels correspondto equation (3), first differences correspond to equation (4) and system corresponds to a system ofthese two equations. Model [1] uses optimally lagged first differences of the explanatory variablesas instruments while model [2] has optimally lagged values of the microcost variable non-interestexpenses-to-deposits ratio as well. Standard errors are in parentheses. *, **, and *** show that thecoefficient estimate is significant at 1%, 5% and 10%, respectively.
24
Topics in Middle Eastern and African Economies Vol. 9, September 2007

[1] [2]
Constant 2.0028** 0.7812(0.8730) (0.8509)
yt−1 0.7299* 0.8238*(0.0551) (0.0496)
DEPTH -0.1255* -0.1247*(0.0229) (0.0205)
n 0.0322 0.0259(0.0563) (0.0617)
EDU 0.1668 0.0985(0.1233) (0.1214)
Health 0.1082 0.1493**(0.0687) (0.0655)
OPEN 0.7493* 0.6642*(0.2087) (0.1871)
t: 1998 0.0070 -0.0022(0.0141) (0.0146)
t: 1999 -0.0939* -0.1107*(0.0189) (0.0191)
t: 2000 0.0240 0.0093(0.0210) (0.0219)
t: 2001 -0.2064* -0.2239*(0.0189) (0.0206)
1st order test stat -3.4180 -3.5210serial df 76 76correlation p value 0.0010 0.00002nd order test stat 0.7230 0.6590serial df 76 76correlation p value 0.4700 0.5100Wald Test test stat 428.2198 1001.4208Joint df 6 6Significance p value 0.0000 0.0000Wald Test test stat 161.5901 177.7577Time Dummy df 4 4Joint Sig. p value 0.0000 0.0000Sargan Test test stat 70.7944 68.6798
df 97 115p value 0.9790 1.0000
Table 7: Financial deepening and growth: results of dynamic panel analysis - system GMM.(The system of two equations (3) and (4). Model [1] uses optimally lagged first differences of theexplanatory variables as instruments while model [2] has optimally lagged values of the microcostvariable non-interest expenses-to-deposits ratio as well. Standard errors are in parentheses. *, **,and *** show that the coefficient estimate is significant at 1%, 5% and 10%, respectively.
25
Topics in Middle Eastern and African Economies Vol. 9, September 2007