financial results report for the december 2003 term ... · financial results report for the...
TRANSCRIPT

Financial Results Report
for the December 2003 Term (Consolidated) February 13, 2004
McDonald’s Holdings Company (Japan), Ltd. Company code number: 2702 (URL http://www.mcd-holdings.co.jp/) Shares traded: JASDAQ Location of headquarters: Tokyo Please address all communications to: Tadashi Ishida, Executive Director Corporate accounting/treasury, investor relations
Phone: (03) 3345-8223 Date of Board of Directors’ meeting for approval
of financial results: February 13, 2004 Adoption of U.S. accounting standards: None
1. Consolidated operating results (From January 1, 2003 to December 31, 2003)
(1) Consolidated financial results (In millions of yen, with fractional amounts discarded)(The number with parenthesis shows negative figure)
Net sales Operating income Ordinary income (Millions of yen) % (Millions of yen) % (Millions of yen) %
December 31, 2003 299,823 (6.5) 2,842 (27.9) 1,896 (7.5)
December 31, 2002 320,713 - 3,944 - 2,050 -
Net loss Net loss per
share
Net loss per share, fully
diluted
Return on shareholders'
equity
Ratio of ordinary
income to total assets
Ratio of ordinary
income to net sales
(Millions of yen) % (Yen) (Yen) % % %
December 31, 2003 7,121 - 53.57 - (4.9) 0.9 0.6
December 31, 2002 2,335 - 17.57 - (1.5) 0.9 0.6
(Notes) 1. Gains or losses on investments through equity method accounting:
December 2003 term: (593) million yen December 2002 term: (140) million yen 2. Average number of outstanding shares during term (consolidated):
December 2003 term: 132,959,902 shares December 2002 term: 132,959,973 shares 3. Changes in accounting methods: None 4. The percentages shown next to net sales, operating income, ordinary profit and net loss represent year-on-year changes 5. The Company compiled its first set of consolidated financial statements for the year ended December 2002. Accordingly, no
year-on-year percentage changes are provided for that year.

(2) Consolidated financial position
Total assets Shareholders’ equity Equity ratio Shareholders' equity
per share (Millions of yen) (Millions of yen) % (Yen)
December 31, 2003 208,130 141,017 67.8 1,060.60
December 31, 2002 213,312 150,868 70.7 1,134.69
(Note) Number of outstanding shares at end of term:
December 2003 term: 132,959,902 shares December 2002 term: 132,959,902 shares
(3) Consolidated cash flow statement
Net cash provided by operating activities
Net cash used in investing activities
Net cash used in financing activities
Cash and cash equivalents at end of term
(Millions of yen) (Millions of yen) (Millions of yen) (Millions of yen)
December 31, 2003 11,567 (3,577) (5,432) 15,789
December 31, 2002 3,652 (11,128) (27,739) 13,231
(4) Scope of consolidation and application of the equity method Consolidated subsidiaries: 2
Nonconsolidated subsidiary accounted for under equity method: ―
Affiliated companies accounted for under equity method: 3
(5) Changes in scope of consolidation and in application of the equity method
Consolidation (new): 1 (elimination): ―
Equity method (new): 2 (elimination): 1
2. Consolidated forecasts for December 2004 term (From January 1, 2004 to December 31, 2004)
Net sales Ordinary income Net income (Millions of yen) (Millions of yen) (Millions of yen)
Interim period 149,459 1,211 151Annual 305,064 6,505 2,870
(N.b.) Estimated earnings per share (annual): 21.58yen
The forecasts shown above are predicated upon information that is available as of the day of the announcement of this report; they incorporate assumptions, made as of the day of the announcement of this report, regarding a number of uncertain factors that may affect future performance. Actual financial performance, therefore, may differ considerably from these forecasts due to a variety of factors hereafter.

1. Group organization
(1) Description of the group’s business
(Businesses of McDonald’s Holdings Company (Japan) Ltd.)
McDonald’s Holdings Company (Japan) Ltd. (“the Company”) acts as the holding company for McDonald’s Company (Japan) Ltd. and EveryD Mc, Inc. The Company is responsible for the formulation and execution of consolidated management strategies covering the entire group, and also manages real estate businesses.
(Businesses of affiliated companies)
McDonald’s Company (Japan) Ltd. (“McDonald’s Japan”) directly operates company-operated hamburger restaurants and develops restaurants through franchisees. McDonald’s Japan pays royalties to McDonald’s Corporation for the use of licenses for management services rendered. McDonald’s Japan receives royalty payments from franchisees who operate franchised stores in Japan, in exchange for operating know-how and the granting of sub-licenses for the use of trademarks, etc. Effective December 31, 2003, the Management Services Agreement that McDonald’s Japan had with Fujita & Co., Ltd. was canceled. As a result, the associated service fee will not arise from the fiscal year ending December 2004.
EveryD Mc, Inc., a wholly owned subsidiary of the Company, is an advertising agency that uses McDonald’s restaurants as its principal medium. It is currently expanding its business into planning and other corporate services.
The Company established Pret A Manger (Japan), Inc. in June 2002 as a 50-50 joint venture with Pret A Manger (Europe) Limited. (Head Office: London). In the year ended December 2003, the Company decided to withdraw from this business to concentrate resources on its principal operations in the McDonald’s hamburger restaurant business. Procedures to wind up Pret A Manger operations in Japan were initiated in November 2003.
California Family Restaurants, Inc. was established as a 100% subsidiary of the Company in August 1978 for the purpose of providing information to the Company and McDonald’s Japan based on information collected in the U.S. restaurant market. As part of those information-gathering activities, this subsidiary operates two hamburger restaurants in the U.S.
The Company established two anonymous associations (as of December 31, 2003) with some McDonald's franchisees in Japan to operate hamburger restaurants business and has 50 % share of equity in the anonymous association.
Capital and business relationships between the Company and these affiliates for the fiscal year ended December 2003 are summarized in the diagram below:

[Group Relationship Diagram]
The business relationships described above for the fiscal year ended December 2003 are shown in diagram form below.
(Note) 1. Effective December 31, 2003, the Management Services Agreement with Fujita & Co., Ltd. was canceled by mutual agreement. 2. The Company resolved to withdraw from the sandwich retailing business operated by Pret A Manger (Japan), Inc. and startedproceeding in November 2003.
(Management services)
(Advertisingagency)
Franchisee
(Merchandise )
(Leasing of fixedassets, etc.)
Capital relationship Flow of merchandise and services
*1 Consolidated subsidiary *2 Affiliates accounted for by the equity method*3 Nonconsolidated subsidiary, equity method not applied
McDonald’s Corporation
Anonymous associationswith someMcDonald’sfranchisees inJapan
(Sub-licensing contract )
Customers and clients
(Licensing contract)
(Management services)
McDonald’sRestaurants ofCanada, Ltd.
McDonald’sHoldings Company (Japan), Ltd.
(Merchandise )
(Merchandise )
*1 McDonald’ s Company (Japan), Ltd.*2 Pret A
Manger (Japan), Inc.
(Importing operations for Ingredients )
Fujita & Co., Ltd.
Den Fujita & Co., Ltd.
*3 CaliforniaFamilyRestaurants, Inc.
*1 EveryD Mc,
Inc.
(Merchandise ) (Merchandise )
(Advertisingagency;planning andotherservices)
McDonald’sRestaurantOperations Inc.

2. Affiliated companies
December 31, 2003 Millions of yen Address Capital Type of business
% of voting rights held (held by others) Relationship Remarks
Parent company McDonald's Corporation Illinois,
U.S.A. US$16,600,000 Hamburger
restaurant chainOwned: Indirect 50.0
Concurrent directors
Affiliated companies McDonald's Restaurant
Operations, Inc. Delaware,
U.S.A. US$3,000 Holding company Owned:
Direct 29.4 Subsidiary of
McDonald’s CorporationBorrowings of funds
McDonald's Restaurants of Canada, Ltd.
Ontario, Canada
C$944,600,000 Hamburger restaurant chain
Owned: Direct 20.6
Subsidiary of McDonald’s Corporation
Consolidated subsidiary McDonald’s Company
(Japan), Ltd. Shinjuku-ku,
Tokyo 500 Hamburger
restaurant chainOwning: Direct 100.0
Concurrent directors Investing and financingRent of stores and fixed assets
Note 1Note 5
EveryD Mc, Inc. Minato-ku, Tokyo
255 Advertising agency, planning and other services
Owning: Direct 100.0
Concurrent directors Note 2
Affiliates consolidated under the equity method Pret A Manger (Japan),
Inc. Minato-ku,
Tokyo 100 Sandwich
restaurant chainOwning: Direct 50.0
Provides management services Investing and financingConcurrent directors
Note 3
Two anonymous associations with some McDonald’s franchisees in Japan
Ryugasaki, Ibaragi and others
213 Hamburger restaurant chain
Owning: Direct 50.0
- Note 4
(Notes) 1. McDonald’s Company (Japan), Ltd. is a designated subsidiary.
2. EveryD Mc, Inc. became a wholly owned subsidiary in the fiscal year ended December 2003 following acquisition of its shares by the Company.
3. The Company decided to withdraw from the business owned and managed by Pret A Manger (Japan), Inc.
4. One of the anonymous association was established on this fiscal year.
5. The net sales of McDonald’s Company (Japan), Ltd. is greater than the 10 percent of the consolidated net sales in the group.
Financial highlights of McDonald’s Japan. 1). Net sales 299,247 million yen
2). Ordinary income 1,576 million yen
3). Net loss 5,146 million yen
4). Shareholders' equity (4,985) million yen
5). Total assets 60,983 million yen

2. Management policy (1) Fundamental Management Policy The Company operates as a holding company to achieve stable long-term business growth of the McDonald’s Japan group through the effective utilization of resources cultivated in the hamburger business. To achieve the end, the Company aims at increasing corporate value through more efficient management and increased flexibility.
(2) Fundamental policy with regard to the distribution of profits Taking into consideration the overall balance between business results, dividend payout ratios, and cash flows, the Company strives to return profits based on the continuous payment of a stable dividend, while maintaining financial indicators like capital ratio and return on equity at appropriate levels.
(3) Medium-term management strategy The role of the Company, which presides over the McDonald’s group in Japan, is to implement organizational rearrangement as required to maximize group efficiency, and to provide operational support to group companies. In the near term, the Company views the core McDonald’s hamburger restaurant operations as its foremost priority, and it is devoting its resources entirely to this area.
(McDonald’s Company (Japan), Ltd.) The Company’s principal subsidiary, McDonald’s Company (Japan), Ltd., focuses on developing its business activities directed at enhancing customer satisfaction with a vision of providing the best restaurant experience to our customers.
We formulated business policies for the year ended December 2003 that aimed to restore the business performance at stores within the existing network of restaurants, developed long-term strategy, and made restructures in organization and resources.
From the fiscal year ending December 2004, we will strive to create a new growth era based on the foundation we laid in the year 2003.
(EveryD Mc, Inc.) Having become a 100% subsidiary of the Company, EveryD Mc is now able to focus on operations at McDonald’s Japan restaurants. While continuing its previous peripheral businesses, activities include an advertising business that uses McDonald’s restaurants as a media outlet, with a view toward conducting business with companies outside the McDonald’s Japan group in the future.

(4) Issues facing the Company We regard restoration of businesses at existing stores as the most urgent task facing the Company in our principal hamburger restaurant operations. We plan to concentrate resources on this business as we move forward. Planned companywide activities toward this end at the group level, center on rebuilding the McDonald’s brand in Japan through a variety of marketing activities, including in-store emphasis on the highest levels of QSC+V (Quality, Service, Cleanliness and Value) and the i’m lovin’ it™ campaign. Plans also call for organizational restructuring and a major review of administrative processes in all the headquarters-based business groups to enhance the administrative efficiency of our central organization. It is vital for us to establish a sound business model for the hamburger restaurant business through reform of both the operations (restaurant) and central divisions of the McDonald’ Japan group.
(5) Basic Corporate Governance Policies and Status To the date, the Company has adopted the executive corporate officer system to ensure responsive decision-making by a small number of directors. This system achieved a clear separation of board-level responsibilities and also enhanced operational functions. Through executive corporate officer meeting, the corporate executive officers participate in decision-making related to business strategy and operational management. In the fiscal year ended December 2003, a new “Executive Management Team” was also formed, comprising the chairman, president, executive vice-president, and the deputy chairman. The role of this group is to determine the overall direction of the business.
The Company works to ensure all staff are suitably informed about matters of corporate ethics. Besides the use of manuals and internal regulations based on a corporate credo, the Company also operates a counseling/advice system for all its employees. Following the various episodes of corporate malfeasance that hit the Japanese food industry recently, the Company established a new compliance system to upgrade risk management and to raise internal observance of corporate ethics standards to a higher level. The newly formed Compliance Committee began promoting the required organizational changes. In January 2003, the Company instituted a new Compliance Program, which establishes standards of corporate behavior to ensure the prevention of any problems in future. A Compliance Hotline was also set up to provide a secure channel for reporting any information related to non-compliance and receiving counseling. The hotline service is designed not only for employees and directors, but also for all part-time employees, supplier personnel, staff family members and anyone else connected to the McDonald’s group in Japan.

3. Operating results and financial position (1) Operating results
(Operating results of the Company)
The Company’s principal business is the investment and real estate business to its subsidiaries and its principal source of revenue is rental income from its 100 % subsidiary, McDonald’s Company (Japan), Ltd. For the year ended December 2003, the Company recognized the rental income of 53,154 million yen and the ordinary income of 558 million yen. As stated in “Other businesses”, however, the Company incurred extraordinary loss derived from the withdrawal of sandwich retailing business operated by Pret A Manger (Japan), Inc. and McVision operations. Consequently, the Company’s net loss for the year was 2,318 million yen.
(Operating results of the McDonald’s group)
Buoyed by improving corporate profitability amid strong economic growth in the United States, the Japanese economy showed signs of having entered a recovery trend in the second half of the consolidated fiscal year ended December 31, 2003. Conditions did not warrant sustained optimism, however, due to various concerns, such as the impact of Iraq-related tensions on the U.S. economy and persistently high unemployment levels. As a result, consumer spending remained flat during the year. One reason for this issue is that the recovery in corporate earnings in Japan has been due in part to the cost-cutting effects of personnel reductions and other restructuring measures, which means that there is no simple direct link between rising profits and a recovery in spending by consumers.
McDonald’s Holdings Company (Japan), Ltd. (“the Company”) responded to these conditions by focusing its resources on engineering a recovery in sales and profits at its principal subsidiary, McDonald’s Company (Japan), Ltd. Despite these efforts, the Company’s consolidated net sales of 299,823 million yen for the year to December 2003 fell short of the target.
To restore its principal business, the hamburger restaurant operation operated by McDonald’s Company (Japan), the Company underwent several restructures in organization and its resources. As a result of the restructures, the Company recorded the extraordinary losses related to the followings: (1) the implementation of a voluntary early retirement program of 3,553 million yen, (2) the cancellation of a management services contract with Fujita & Co., Ltd. of 6,249 million yen, (3) the closure of Pret A Manger (Japan), Inc. of 2,461 million yen, and (4) the closure of McVision operation of 1,221 million yen. These factors caused the Company to report a consolidated net loss of 7,121 million yen.
(Overview of hamburger restaurant operations) In the fiscal year ending December 31, 2003, McDonald’s Company (Japan), Ltd., got down to form the foundation for restoration and new growth.
In the first-half year, the Company concentrated resources on hamburger restaurant business to restore sales and profit margins. The activity was related to “products”, “restaurants development”, and “services”. In terms of “product”, we introduced the “New Tastes Menu” and offered new sandwiches every 6 to 8weeks period in turn. On the store development front, we cut back new store openings and continued to close unprofitable restaurants and implemented “remodeling and relocation” at existing outlets. Service-related initiatives included the “Challenge! 60 Seconds Service Campaign,” which ran in August at all restaurants. This aimed to raise customer satisfaction

with smooth, speedy service by challenging staff to deliver products to customers within 60 seconds after receiving their order.
However, these activities did not bring the recovery in sales, so the Company established following three directions toward new growth in the second-half year. The directions are “concentration of resources on the principal business”, “transition from short-term strategy to long-term strategy”, and “restructure of organization and resources”.
On the “concentration of resources on the principal business” direction, we continued to cut back new store openings and pursued the closing unprofitable restaurants, and implemented “remodeling and relocation” at existing outlets. As a result of these, activities, We opened a total of 64 new outlets, including 19 traditional restaurants and 45 satellite restaurants (small-scale outlets offering limited menus), during the year ended December 2003. Restaurant closures totaled 182 (64 traditional and 118 satellite restaurants). As a result, the number of restaurants in operation stood at 3,773 as of the end of December 2003, a net decrease of 118 from the year before. Among the restaurant closures undertaken in 2003, 142 were based on a demonstrated lack of outlet profitability in the year ended December 2002. The Company recorded a disposition of 4,284 million yen in loss reserves associated with these closures. Capital investments in restaurant facilities during the year ended December 2003 included the remodeling and/or relocation of 373 outlets, comprising 291 traditional restaurants and 82 satellite restaurants.
We also continued to roll out the “Made For You” cooking system (serving fresh, made-to-order items without requiring additional preparation time) as a means of providing an even tastier range of foods. As of the end of December 2003, the Made For You system was operating at 2,159 restaurants, and the Company is going to install the system to all restaurants by the end of year 2005.
On the “transition from short-term strategy to long-term strategy” direction, the i’m lovin’ it™ campaign, the new globally unified branding strategy for the McDonald’s brand, commenced in more than 110 countries around the globe on September 22, 2003. This marked the first large-scale globally integrated international brand campaign to appeal the “unified brand message” around the globe. It is scheduled to last two years and we will develop our advertising and promotion based on the campaign. We started the “Smart Saving” program in July 2003 as a “Value-menu” program. The program featured a sandwich that changed on a monthly basis and was designed to meet the different needs of customers visiting our restaurants by being offered either on its own or as a set, both at “reasonable prices.”
As a result of these activities, the sales in the fourth quarter achieved comparable sales (increase in sales compared to the last fourth quarter).
On the “restructure of organization and resources” direction, we implemented a voluntary early retirement program, and canceled a management services contract with Fujita & Co., Ltd. Extraordinary losses related to these actions comprised costs of 3,553 million yen for a special retirement benefit and outplacement support program and contract cancellation fee of 6,249 million yen.
As a result of those activities, Systemwide sales (total sales at both company-operated and franchised restaurants) for the year to December 2003 were 386,703 million yen.

(Other businesses) Pret A Manger (Japan), Inc. commenced operations in Japan on September 25, 2002, eventually opening a network of 14 outlets, located mainly in central Tokyo. Having decided to concentrate resources on the core hamburger restaurant operations in order to ensure a recovery in financial performance, the Company resolved to withdraw from the sandwich retailing business at the earliest possible juncture. We recorded an extraordinary loss of 2,461 million yen related to the closure of this business.
Based on the same rationale, we also decided to close McVision operations (an advertising business managed by McDonald’s Company (Japan), Ltd. employing large-screen plasma displays installed in McDonald’s restaurants in Japan), effective December 31, 2003. We recorded a related extraordinary loss of 1,221 million yen.
EveryD Mc, Inc., a 100% subsidiary of the Company, operates an advertising business that uses McDonald’s restaurants as a media outlet. EveryD Mc, Inc. recognized net sales of 887 million yen and ordinary profit of 294 million yen for this year. EveryD Mc, Inc. was established through a corporate split with McDonald’s Company (Japan) Ltd. on April 1, 2003. This corporate-split resulted in the transfer to EveryD Mc, Inc. of 77 million yen worth of assets and26 million yen worth of liabilities.

(2) Financial condition
Cash Flow Summary Cash and cash equivalents (cash) outstanding as of the end of the term totaled 15,789 million yen.
Cash flows for the term are as follows:
(Net cash provided by operating activities)
Operating activities during the term provided net cash in the amount of 11,567 million yen. This was due to the significant shortfall from plan in income before taxes and the payment of management services cancellation fee and the payment of additional retirement allowances for early retirees would be carried out in the year 2004.
(Net cash used in investing activities) Net cash used in investing activities during the term to 3,577 million yen. This was primarily for the acquisition of restaurant equipment, etc.
(Net cash used in financing activities) Financing activities during the term resulted in a net cash outflow of 5,432 million yen. This was principally attributable to long-term debt repayments totaling 8,000 million yen and the payment of 3,932 million yen in dividends, which together more than offset the receipt of loans of 6,500 million yen.
Trends in cash flow-related indices for the corporate group are shown below. December 31, 2002 December 31, 2003Equity ratio 70.7% 67.8%
Equity ratio based on market prices 115.9% 130.3%
Years required to redeem liabilities 2.3 years 0.6 years
Interest-coverage ratio 7.1 times 47.6 times
Equity ratio: Shareholders’ equity/total assets Equity ratio based on market prices: Market capitalization/total assets Years required to redeem liabilities: Interest-bearing liabilities/operating cash flow Interest-coverage ratio: Operating cash flow/interest payments
* Each of the foregoing ratios is calculated on the basis of consolidated financial data.
* Interest-bearing debt refers to all liabilities on the consolidated balance sheet on which interest is paid.
* Operating cash flow and debt-service payments are calculated using the respective figures for cash flow from operating activities and interest expenses, as listed on the consolidated statement of cash flows.

(3) Forecasts for the year to December 2004
The Japanese economy is forecast to continue recovering in 2004, led by a revival in the corporate sector. Nevertheless, based on projections that personal consumption is set to remain flat, the Company believes that the operating environment will still not warrant any undue optimism.
Under such conditions, the Company plans to concentrate its resources on engineering a recovery in sales and profits at the principal group subsidiary, McDonald’s Company (Japan), Ltd. The core objective is to generate a recovery in same-store sales growth through a focus on the following: (1) ensuring that best practices within the existing store network are reflected across all operations; (2) rebuilding the McDonald’s brand by means of the i’m lovin’ it™ campaign; and (3) optimizing outlet locations within all commercial districts in Japan.
The Company forecasts consolidated sales for the fiscal year ending December 2004 of 305,064 million yen. Projected levels of ordinary and net incomes are 6,505million yen and 2,870 million yen, respectively.

4. Plan for the use of funds from the capital increase through a public offering of market value shares, and appropriation of funds The plan for the use of funds from the 49.4 billion yen proceeds of the capital increase through public offering with payment date of July 25, 2001, and the results of the appropriation of funds, are summarized below.
(1). Plan for the use of funds The Company intended to use the procured funds for investments for store development and infrastructure maintenance (renovation of store facilities, including information technology equipment).
(2). Results of the appropriation of funds (From January 1, 2001 to December 31, 2001) Of the funds procured, 24.7 billion yen was appropriated for investments in store and information technology development.
(From January 1, 2002 to December 31, 2002) Of the funds procured, 18.1 billion yen was appropriated for investments in store, information technology, and investments and financing for new businesses.
(From January 1, 2003 to December 31, 2003) Capital investments totaling 6.6 billion yen were primarily directed at the existing store network.

5. Consolidated financial statements (1). Consolidated balance sheet
Millions of yen December 31, 2002 % December 31, 2003 % Year-on-year
changeCurrent assets Cash and deposits 13,241 15,799 Accounts receivable - trade 9,087 7,796 Negotiable securities 460 - Inventories 2,855 2,701 Deferred tax assets 2,098 2,867 Others 7,246 4,784 Allowance for doubtful accounts (170) (105) 34,818 16.3 33,843 16.3 (975)Fixed assets Tangible fixed assets Buildings and structures 93,568 89,521 Accumulated depreciation 51,169 49,392 42,398 40,129 Machinery and transportation equipment 17,442 17,262 Accumulated depreciation 7,429 7,957 10,012 9,305 Tools, appliances and fixtures 22,446 21,077 Accumulated depreciation 14,310 14,539 8,136 6,538 Land 16,569 16,840 Construction in progress 135 25 77,254 36.3 72,838 35.0 (4,415)Intangible fixed assets Goodwill 779 1,018 Others 4,636 4,519 5,416 2.5 5,537 2.6 121 Investments and other assets Investments in securities 6,589 8,808 Long-term loans 763 94 Deferred tax assets 54 4,027 Deferred tax assets due to revaluation 1,992 1,926 Leasing and guarantee deposits 83,890 77,284 Others 5,120 5,695 Allowance for doubtful accounts (2,586) (1,927) 95,823 44.9 95,910 46.1 87 Total fixed assets 178,493 83.7 174,287 83.7 (4,206)Total assets 213,312 100.0 208,130 100.0 (5,181)

Millions of yen December 31, 2002 % December 31, 2003 %
Year-on-yearchange
Current liabilities Notes and accounts payable 16,028 16,647 Current portion of long-term debt 8,000 5,000 Accounts payable-other 13,322 22,867 Accrued expenses payable 6,912 6,532 Income taxes payable 189 207 Allowance for bonuses 684 860 Allowance for losses on restaurant closings 4,931 646 Allowance for losses from the liquidation of affiliates
- 800
Others 5,503 8,564 55,571 26.1 62,126 29.8 6,554Long-term liabilities Long-term debt 250 1,750 Deferred tax liabilities 1,249 - Allowance for employees' retirement benefits 654 1,001 Allowance for directors' retirement 2,490 42 Deposits received 2,226 2,193 6,871 3.2 4,986 2.4 (1,885)Total liabilities 62,443 29.3 67,113 32.2 4,669Shareholders' equity Common stock 24,113 11.3 - - (24,113)Additional paid-in capital 42,124 19.7 - - (42,124)Revaluation account for land (2,745) (1.3) - - 2,745 Retained earnings 84,182 39.5 - - (84,182)Unrecognized holding gain on other securities 3,193 1.5 - - (3,193)Treasury stock (0) (0.0) - - 0 Total shareholders’ equity 150,868 70.7 - - (150,868) Common stock - - 24,113 11.6 24,113 Capital reserves - - 42,124 20.2 42,124 Retained earnings - - 73,070 35.1 73,070 Revaluation account for land - - (2,808) (1.3) (2,808)Unrecognized holding gain on other securities - - 4,518 2.2 4,518 Treasury stock - - (0) (0.0) (0)Total shareholders’ equity - - 141,017 67.8 141,017Total liabilities and shareholders' equity 213,312 100.0 208,130 100.0 (5,181)

(2). Consolidated statement of income
Millions of yen Year ended
December 31, 2002 %Year ended
December 31, 2003 % Year-on-year
changeSales 320,713 100.0 299,823 100.0 (20,890)Cost of sales 281,402 87.7 261,876 87.3 (19,525)Gross profit on sales 39,311 12.3 37,946 12.7 (1,364)Selling, general and administrative expenses 35,366 11.1 35,104 11.8 (262)Operating income 3,944 1.2 2,842 0.9 (1,102)Nonoperating income Interest income 98 105 Closure-related compensation - 230 Revenue from unredeemed gift certificates 521 141 Others 1,118 1,002 1,737 0.5 1,479 0.5 (258)Nonoperating expenses Interest expenses 462 110 Equity in loss of affiliated companies 140 593 Provision for allowance for doubtful accounts 776 79 Loss on disposal of fixed assets at stores 1,597 1,311 Others 655 329 3,632 1.1 2,424 0.8 (1,207)Ordinary income 2,050 0.6 1,896 0.6 (153)Extraordinary gains Gain on revision of earnings from previous term - 309 Gain on reversal of allowance for restaurant closures - 880
Gain on reversal of allowance for doubtful accounts 111 66
Gain on reversal of allowance for bonuses 240 - Gain on sales of fixed assets - 17 Gain on sale of investment securities - 55 Revenue from unredeemed gift certificates in previous years
929 -
Compensation for relocation of stores 160 136 Others 32 - 1,474 0.5 1,465 0.5 (8)Extraordinary losses Loss on revision of earnings from previous term - 44 One-time write-off of remaining value of fully-depreciated tangible fixed assets
606 -
Loss on sale of land 187 - Loss on disposal of fixed assets 491 975 Valuation loss on investment securities 55 - Loss on transfer of directors' insurance reserve - 121 Additional increase in voluntary retirement allowances - 3,553
Management services contract cancellation fee - 6,249 Losses from the liquidation of affiliates 311 2,461 Provision for allowance for restaurant closures 4,931 - Loss on withdrawal from McVision business - 1,221 Costs of BSE countermeasures 160 Loss on disposal of welfare facilities - 299 Others 159 322 6,742 2.1 15,408 5.1 8,666

Millions of yen
Year endedDecember 31, 2002 %
Year endedDecember 31, 2003 %
Year-on-yearchange
Loss before income taxes 3,217 (1.0) 12,046 (4.0) (8,828)Income taxes 1,328 1,618 Deferred taxes (2,209) (6,542) (881) (0.3) (4,924) (1.6) (4,042)Net loss 2,335 (0.7) 7,121 (2.4) (4,786)

(3). Consolidated appropriation of retained earnings
Millions of yen December 31, 2002 December 31, 2003 Year-on-year
changeConsolidated statement of retained earnings 90,548 - (90,548)Reduction in retained earnings Dividends 3,988 - Disposition of revaluation account for land 41 -
4,029 - (4,029)Net loss 2,335 - (2,335)Retained earnings, end of term 84,182 - (84,182) Capital reserves Capital reserves, beginning of term Additional paid-in capital, beginning of term - 42,124 42,124 Capital reserves, end of term - 42,124 42,124 Retained earnings Retained earnings, beginning of term - 84,182 84,182 Increase in retained earnings - - -Reduction in retained earnings Dividends - 3,988 Net loss - 7,121 Disposition of revaluation account for land - 1 - 11,112 11,112 Retained earnings, end of term - 73,070 73,070

(4). Consolidated statement of cash flows
Millions of yen Year ended
December 31, 2002Year ended
December 31, 2003Year-on-year
changeNet cash provided by operating activities
Net loss before income taxes (3,217) (12,046)Depreciation 8,859 8,679 Increase (decrease) in allowances 836 (1,912)Increase (decrease) in allowances for losses on restaurant closings
4,931 (1,855)
Unredeemed gift certificates in current and previous years (1,450) (141)Interest and dividend income (134) (206)Interest expenses 462 110 Equity in losses (earnings) of unconsolidated companies 140 593 Losses from the liquidation of affiliates 311 2,461 Additional increase in voluntary retirement allowances - 3,553Management services contract cancellation fee - 6,249Loss on withdrawal from Mc-Vision business - 1,221Loss on disposal of fixed assets 1,616 1,974 Decrease (increase) in accounts receivable - trade 1,207 1,290 Decrease (increase) in inventories 404 154
Decrease (increase) in goodwill from acquisition of franchise stores
70 (324)
Decrease (increase) in other assets 24 (2,218)Increase (decrease) in accounts payable (695) (631)Increase (decrease) in notes payable (2,000) 1,251 Increase (decrease) in accrued expenses payable (173) (247)Increase (decrease) in other current liabilities 64 1,658Others 388 327 11,645 9,940 (1,705)Interest and dividend income received 81 139 Interest expenses paid (517) (242)Income tax refund - 3,541Income tax and paid (7,556) (1,810) 3,652 11,567 7,915
Net cash used in investment activitiesRefunds of time deposits with tenors exceeding 3 months 110 -Payments for purchase of restaurant equipment (13,491) (7,809)Proceeds from sales of restaurant equipment 1,524 1,296 Payments for investment securities (28) -Proceeds from sales of investment securities - 55Income from redemption of investment securities at maturity - 460
Payments for acquisition of affiliated company (100) (105)Payments for rent deposits and guarantees (2,420) (745)Proceeds from returned rent deposits and guarantees 5,318 6,217 Payments for loans and advances (126) (68)Proceeds from collection of loans and advances 246 207 Outlays for loans to affiliates (1,060) (1,700)Payments for development of information systems (987) (1,371)Others (114) (13) (11,128) (3,577) 7,550

Millions of yen
Year endedDecember 31, 2002
Year endedDecember 31, 2003
Year-on-year change
Net cash used in financing activitiesIncome from long-term borrowings - 6,000 Payments of long-term debt (23,750) (8,000)Income from long-term borrowings by affiliates - 500Dividend payments (3,988) (3,932)Payments for purchase of treasury stock (0) - (27,739) (5,432) 22,306 Effect of exchange rate changes on cash and cash equivalents
0 - (0)
Increase (decrease) in cash and cash equivalents (35,214) 2,557 37,772 Cash and cash equivalents at beginning of term 48,446 13,231 35,214 Cash and cash equivalents at end of term 13,231 15,789 2,557

Assumptions underlying preparation of consolidated financial statements Item December 31, 2002 December 31, 2003
1. (1) Number of consolidated subsidiary: 1 (1)Number of consolidated subsidiaries: 2
Item relating to scope of consolidation
Name of consolidated subsidiary: Name of consolidated subsidiaries: McDonald’s Company (Japan), Ltd.
McDonald's Company (Japan), Ltd., is a subsidiary that was newly established through a corporate split on July 1, 2002, and assumed the Company's hamburger restaurant operations.
McDonald’s Company (Japan), Ltd. EveryD Mc, Inc. EveryD Mc, Inc. was included in the scope of consolidation from this fiscal year following acquisition of its shares by the Company.
(2) Number of nonconsolidated subsidiary: 1 (2)Number of nonconsolidated subsidiary: Name of nonconsolidated subsidiary: California
Family Restaurants, Inc. Same as December 31, 2002
(Reason for exclusion from consolidation) This nonconsolidated subsidiary is excluded because of its minimal impact on consolidated net income and consolidated retained earnings and its lack of materiality.
2. (1) Number of affiliates accounted for by the equity method: 2
(1)Number of affiliates accounted for by the equity method: 3
Item relating to application of the equity method Pret A Manger (Japan), Inc. Pret A Manger (Japan), Inc. EveryD Mc, Inc. 2 anonymous associations These companies were newly established
during the period under review. As a result of no longer being considered
immaterial, these anonymous associations became equity-method affiliates as of this fiscal year. EveryD Mc, Inc. was excluded from equity-method accounting from this fiscal year following acquisition of its shares by the Company.
(2) The Company did not apply the equity method to its nonconsolidated subsidiary (California Family Restaurants, Inc.) because of its minimal impact on consolidated net income and consolidated retained earnings and its lack of materiality.
(2) Same as December 31, 2002
3. Item relating to the fiscal years etc. of consolidated subsidiaries
All consolidated subsidiaries end their fiscal years on the same day as the date of closing of consolidated accounts.
Same as December 31, 2002
4. Items related to accounting standards
(1) I. Marketable and investment securities I.Marketable and investment securities (a) Bonds held to maturity:
cost amortization method (straight line) (a) Bonds held to maturity:
Same as December 31, 2002
Standards and methods of valuation for important assets (b) Other securities: (b) Other securities:
Quoted securities: market price method based on closing prices on the date of the closing of accounts (all differences are credited or debited directly to the shareholders' equity account; sales prices are calculated on the basis of average cost)
Same as December 31, 2002
Unquoted securities: valued at cost using the periodic average method
ii. Derivatives: market price method ii.Derivatives: market price method Hedge instruments are not valued at market
prices when other applicable special valuation criteria are satisfied.
Same as December 31, 2002

Item December 31, 2002 December 31, 2003
iii. Inventories: iii. Inventories: Food materials and supplies: valued at cost,
computed on a periodic average basis Same as December 31, 2002
(2) i. Tangible fixed assets: straight-line method i.Tangible fixed assets: straight-line method
Major depreciable assets and methods of depreciation
Years of useful life for principal assets: Buildings and structures: 2 - 50 years Machinery and transportation equipment: 2 - 15 years Tools, appliances and fixtures: 2 - 20 years
Same as December 31, 2002
ii. Intangible fixed assets: straight-line method ii. Intangible fixed assets: straight-line method For software used internally, the straight-line
method is applied based on the period of expected use by the Company (5 years).
Same as December 31, 2002
iii. Long-term prepaid expenses: iii.Long-term prepaid expenses: Straight-line method Same as December 31, 2002 (3) i. Allowance for doubtful accounts i.Allowance for doubtful accounts
Standards for important allowances
To provide for potential losses from doubtful accounts, the Company recognizes an amount calculated on the basis of a statutory deduction ratio for general accounts receivable plus an amount for specific accounts for which collection appears doubtful.
Same as December 31, 2002
ii. Reserve for bonuses ii.Reserve for bonuses In order to prepare for the payment of
bonuses to employees, an allowance is made for the estimated amount to be paid as of the end of the fiscal year.
Same as December 31, 2002
iii. Employees' retirement benefits iii.Employees' retirement benefits To provide for employees’ retirement benefits,
the Company recognizes an amount based on retirement benefit liabilities and estimated pension assets as of the end of the term to December 2002.
Same as December 31, 2002
Differences arising in the course of mathematical calculations are proportionally divided using the straight-line method over a fixed number of years not exceeding the average number of remaining years of service of employees in each term (13), and are treated as expenses from the year following the year in which they occur.
iv. Reserve for directors' retirement allowances iv.Reserve for directors' retirement allowances Recognition of full amount of liability at fiscal
year end based on employment regulations. Same as December 31, 2002
v. Allowance for losses on restaurant closings v.Allowance for losses on restaurant closings The Company expects losses to arise
hereafter from restaurant closures decided upon during the year to December 2002 for the purpose of radically improving its structure of profitability. It will recognize as losses amounts arrived at through reasonable means of estimation.
The Company expects losses to arise hereafter from restaurant closures decided upon during the year to December 2002 for the purpose of radically improving its structure of profitability. It will recognize as losses amounts arrived at through reasonable means of estimation.
vi.Reserve for losses on liquidation of affiliate This reserve recognizes losses, based on
reasonable estimations, expected to arise hereafter in connection with the Company’s withdrawal from the sandwich retailing business formerly operated by Pret A Manger (Japan), Inc.
(4)Accounting for significant lease transactions
Financing leases, which exclude leased assets for which title is recognized as being conveyed to lessees, are treated as ordinary rental transactions.
Same as December 31, 2002

Item December 31, 2002 December 31, 2003
(5) (1) Accounting method: (1)Accounting method: Important hedge accounting methods
Special valuation criteria are applied for interest rate swaps.
Same as December 31, 2002
(2) Hedging methods and items hedged: (2)Hedging methods and items hedged: Hedging methods: interest swap Same as December 31, 2002 Items hedged: loans payable (3) Policy related to hedging: (3)Policy related to hedging: Hedging is conducted to manage the risk of
market fluctuation of interest rates for interest on loans payable.
Same as December 31, 2002
(4) Method of evaluating the effectiveness of hedging:
(4)Method of evaluating the effectiveness of hedging:
The details of the determination of hedge effectiveness are omitted since special valuation criteria are applied.
Same as December 31, 2002
(6) (1) Accounting for consumption taxes and local consumption taxes:
(1) Accounting for consumption taxes and local consumption taxes:
Amounts shown are exclusive of consumption taxes.
Same as December 31, 2002
(2)Accounting standards for treasury stock and disposition of the legal reserve
Other significant items associated with the preparation of financial statements - The accounting standard governing treasury
stock and disposition of the legal reserve (Corporate Accounting Standard No. 1) became effective in Japan on April 1, 2002, and was adopted in full by the Company from this fiscal year. Due to revisions of the rules relating to preparation of consolidated financial statements, the Company altered the shareholders’ equity section of its consolidated balance sheet and its consolidated appropriation of retained earnings.
(3)Net income per share - The accounting standard governing net income
per share (Corporate Accounting Standard No. 2) and the related guidelines for the application of this accounting standard (Corporate Accounting Standard Application Guidelines No. 4) became effective in Japan on April 1, 2002, and were adopted in full by the Company from this fiscal year.
5. Consolidated appropriation of retained earnings
The consolidated appropriation of retained earnings shown is determined during this fiscal year.
Same as December 31, 2002
6. Scope of funds in the consolidated statement of cash flow
“Funds” (cash and cash equivalents) in the context of the consolidated cash flow statement comprise cash on hand, freely withdrawable deposits, and short-term investments maturing in less than three months from the date of their acquisition, which must also be easily converted to cash and subject to minimal risk of price fluctuations.
Same as December 31, 2002
Changes in the method of presentation December 31, 2002 December 31, 2003
“Closure-related compensation” was presented in “Others” in the Non-operating income section of consolidated statement of income until last fiscal year. However, the amount of the account is more than one-tenth of total Non-operating income this year. Therefore, the account is designated in the statement. The amount for the last fiscal year is 119 million yen.

Notes (Consolidated balance sheet - related) Millions of yen December 31, 2002 December 31, 20031. Amounts at nonconsolidated subsidiaries and affiliates are as
follows 1. Amounts at nonconsolidated subsidiaries and affiliates are as
follows Investment securities 228 Investment securities 341 Long-term loans 707 Investments in anonymous associations 173
2. Securities in the amount of 460 million yen and investment securities in the amount of 669 million yen are provided as guarantee deposits for the issuing of gift certificates (McCard), as per the relevant laws regulating prepaid gift certificates. Liabilities collateralized by these securities are advance receipts from customers in the amount of 323 million yen.
2. Investment securities in the amount of 668 million yen and “other” assets in investments and other assets in the amount of 510 million yen are provided as guarantee deposits for the issuing of gift certificates (McCard), as per the relevant laws regulating prepaid gift certificates. Liabilities collateralized by these securities are advance receipts from customers in the amount of 476 million yen.
3. Contingent liabilities 3. Contingent liabilities (1) Guarantees provided for borrowings from financial
institutions by parties in which the Company has an equity stake:
(1) Guarantees provided for borrowings from financial institutions by parties in which the Company has an equity stake:
Toys"R"Us-Japan, Ltd. 3,832 Toys"R"Us-Japan, Ltd. 3,656 (2) Guarantees provided for employees’
mortgages from banks: 140 (2) Guarantees provided for employees’
mortgages from banks: 86
(3) Guarantees of obligations for lease contracts of third-party companies:
-
Music Bird Co., Ltd. 1,144 4. Reductions of tangible fixed assets from gains on insurance
claims were 173 million yen, and reductions of tangible fixed assets from expropriation were 110 million yen.
4. Reductions of tangible fixed assets from gains on insurance claims were 133 million yen, and reductions of tangible fixed assets from expropriation were 110 million yen.
5. Notes maturing on final day of the fiscal year 5. Notes maturing on final day of the fiscal year
Notes are settled on the basis of date of clearing. Because the final day of the fiscal year was a banking holiday, however, the following notes maturing on the final day of the fiscal year are included in term-end balances.
Notes are settled on the basis of date of clearing. Because the final day of the fiscal year was a banking holiday, however, the following notes maturing on the final day of the fiscal year are included in term-end balances.
Notes payable 1,639 Notes payable 2,436 Notes payable - plant and equipment 560 Notes payable - plant and equipment 486
6. - 6. The number of outstanding shares is common stock of 132,960,000.
7. - 7. The Company has 98 shares of its common stock as a treasury stock.
8. Revaluation of land 8. Revaluation of land
As per the Law Regarding the Revaluation of Land (Public Law No. 34, March 31, 1998), land used for business purposes is revalued and any valuation differential is recorded under shareholders’ equity.
As per the Law Regarding the Revaluation of Land (Public Law No. 34, March 31, 1998), land used for business purposes is revalued and any valuation differential is recorded under shareholders’ equity.
Revaluation method: Revaluation method:
As per Article 2-3 of the Implementation Order for the Revaluation of Land (Public Ordinance No. 119, March 31, 1998), the calculation was carried out using a rational adjustment based on the valuation amount for property tax.
As per Article 2-3 of the Implementation Order for the Revaluation of Land (Public Ordinance No. 119, March 31, 1998), the calculation was carried out using a rational adjustment based on the valuation amount for property tax.
Date of revaluation: December 31, 2001 Date of revaluation: December 31, 2001
Differential between book value and post-revaluation market value of revalued land at end of term
(1,422) Differential between book value and post-revaluation market value of revalued land at end of term
(2,677)

(Consolidated statement of income - related) Millions of yen December 31, 2002 December 31, 20031. Primary items and amounts included under selling, general and
administrative expenses 1. Primary items and amounts included under selling, general and
administrative expenses (1)Advertising expenses 10,845 (1)Advertising expenses 10,535 (2)Sales promotion expenses 4,292 (2)Sales promotion expenses 5,029 (3)Salaries 5,243 (3)Salaries 5,317 (4)Bonuses 1,911 (4)Bonuses 1,992 (5)Provision for bonuses 178 (5)Provision for bonuses 216 (6)Employees' retirement benefits 1,517 (6)Employees' retirement benefits 1,526 (7)Provision for directors' retirement
allowances 144 (7)Provision for directors' retirement
allowances 46
(8)Rent on real estate 1,290 (8)Rent on real estate 1,303 (9)Depreciation expenses 1,695 (9)Depreciation expenses 1,783 (10)Subcontracting expenses 1,672 (10)Subcontracting expenses 2,002 (11)Investigation and research expenses 1,281 (11)Investigation and research expenses 913 (12)Provision for doubtful accounts 4
2. - 2. Breakdown of gain on sale s of fixed assets Land 8 Vehicle 8 Total 17
3. Breakdown of losses from disposal of fixed assets 3. Breakdown of losses from disposal of fixed assets Buildings and structures 328 Buildings and structures 373 Machinery and transportation equipment 13 Machinery and transportation equipment 53 Tools, appliances and fixtures 95 Tools, appliances and fixtures 218 Software 53 Software 329 491 Total 975
4. “Others” as shown under extraordinary losses consists of cancellation fees on lease contracts for kitchen equipment made obsolete by the introduction of the “Made for You” order-made cooking system.
4. “Others” as shown under extraordinary losses consists of cancellation fees on lease contracts for kitchen equipment made obsolete by the introduction of the “Made for You” order-made cooking system of 124 million yen and the payment of 131 million yen to franchisees as compensation fees for store closing.
5. - 5. Breakdown of cost of BSE countermeasures are as follows Loss on disposal of food inventories 82 Loss on disposal of sales promotion
material 78
6. R&D expenses in selling, general and administrative expenses
388 6. R&D expenses in selling, general and administrative expenses
387
(Consolidated statement of cash flow - related) 1). Relationship between balance of cash and cash equivalents as of term end and balance sheet items.
Millions of yen December 31, 2002 December 31, 2003 Cash and deposit accounts 13,241 15,799
Time deposits with tenors exceeding 3 months (10) (10)
Cash and cash equivalents 13,231 15,789
2). Matters regarding non-cash transaction
The Company has investments in affiliates companies of 176 million yen derived from investment of fixed tangible assets to the anonymous association.

(Lease related) Financing leases, which exclude leased assets whose titles are recognized as being conveyed to lessees.
Lessee (1) Equivalent acquisition costs, equivalent accumulated depreciation and equivalent book value at
year end
Millions of yen December 31, 2002 December 31, 2003 Buildings and structures Acquisition cost 5 5
Accumulated depreciation 2 4
Net leased property 2 1 Machinery and transportation equipment Acquisition cost 16,079 13,620
Accumulated depreciation 8,225 7,383
Net leased property 7,853 6,237 Tools, appliances and fixtures Acquisition cost 3,402 3,435
Accumulated depreciation 1,428 1,605
Net leased property 1,973 1,830 Total Acquisition cost 19,486 17,062
Accumulated depreciation 9,657 8,993
Net leased property 9,829 8,068
(2) Equivalent amount of unearned lease payments
Millions of yen December 31, 2002 December 31, 2003 Due within one year 3,473 2,907
Due after one year 6,545 5,185
10,019 8,093
(3) Lease rents, equivalent depreciation and equivalent amount of interest paid
Millions of yen December 31, 2002 December 31, 2003 Lease rents 3,987 3,856
Equivalent depreciation 3,284 3,093
Equivalent amount of interest paid 248 220
(4) Method of calculating equivalent depreciation
The Company uses straight-line depreciation, assuming that lease periods are equal to estimated economic life and that residual values are zero.
(5) Calculation method for equivalent amount of interest
The equivalent amount of interest is the difference between the total amount of lease fees and the equivalent of the acquisition value of the leased property, with the interest method used for the allocation to each term.

(Marketable and investment securities) 1. Quoted bonds which are being held to maturity
December 31, 2002 December 31, 2003
Millions of yen Current
value Book valueUnrealized gain (loss)
Current value Book value
Unrealized gain (loss)
Bonds whose market values exceed amounts recognized on the consolidated balance sheet
JGB 1,129 1,133 3 668 670 1
1,129 1,133 3 668 670 1
2. Other quoted securities
December 31, 2002 December 31, 2003
Millions of yen Cost of
acquisition Book valueUnrealized gain (loss)
Cost of acquisition Book value
Unrealized gain (loss)
Securities valued on the consolidated balance sheet at amounts greater than purchase cost
Shares 111 5,623 5,512 107 7,725 7,617Securities for which valuations on the consolidated balance sheet do not exceed purchase cost Shares 10 10 0 16 16 0
122 5,633 5,511 124 7,742 7,617
3. Other marketable securities that were sold during the year ended December 31, 2002 and 2003
Millions of yen Amount sold Total gains on sales Total losses on salesDecember 31, 2003
55 55 -December 31, 2002 0 0 -
4. Major investment securities without market prices
Millions of yen December 31, 2002 December 31, 2003Other securities
Unlisted stocks (excluding OTC stocks) 56 56

5. Scheduled redemptions of bonds with maturity dates and bonds being held to maturity
Millions of yen Up to 1 yearGreater than 1 and
up to 5 yearsGreater than 5 and
up to 10 years Greater than
10 yearsDecember 31, 2003 JGB - 668 - -
- 668 - -December 31, 2002 JGB - 669 - -
Others 460 - - -
460 669 - -
(Note)
December 2002 term
Write-downs on securities during the year were 55 million yen (55 million yen on other securities for which a market value is not available). When the market value of a security at the fiscal year-end has fallen to less than 50% of the acquisition price, a valuation write-off is made for the full amount of the differential. When the market price has fallen by 30%-50% of the acquisition price, an amount deemed necessary is written off, taking into consideration the actual amount in question and the possibility of recovery.

(Derivatives) I. Items related to the status of transactions 1. Transaction details
Derivative transactions used by the Company consist of forward foreign exchange contracts and interest rate swap transactions. Forward foreign exchange contracts are carried out based on the Company’s decision, by requesting importers to conclude forward foreign exchange contracts.
The effect of these forward foreign exchange contracts is reflected in the price of transactions with shipping companies that purchase ingredients from the importer and deliver them to McDonald’s Company (Japan), Ltd. or its franchisees.
2. Policy regarding transactions
The Company’s derivative transactions are undertaken for the purpose of avoiding risk from future movements in foreign exchange and interest rates, taking into consideration the amount of expected future imports. The Company does not enter into derivative transactions for speculative purposes.
3. Purpose of transactions
Forward foreign exchange contracts are undertaken for the purpose of maintaining stable purchase prices for food ingredients at McDonald’s Company (Japan), Ltd. and franchisees. Interest rate swap transactions are undertaken to avoid the risk of upward interest rate movements on the Company’s borrowings due to market fluctuations.
4. Transaction risks
Forward foreign exchange contracts are recognized as having almost no risk from exchange rate fluctuations.
Because the counterparties to the forward foreign exchange contracts undertaken by importers are major domestic banks, the risk of the counterparty’s nonfulfillment of contract (credit risk) is considered to be negligible.
Interest rate swap transactions are recognized as having almost no risk from market fluctuations in interest rates.
Counterparties to the Company’s derivative transactions are all banks of high credit quality, therefore credit risk caused by the counterparty’s nonfulfillment of contract is recognized as being negligible.
5. Risk management system for transactions
The execution and management of derivative transactions is carried out as per McDonald’s Company (Japan), Ltd.’s internal rules and procedures. The policy for forward foreign exchange contracts is determined by the responsible director, and the request to the importer for the execution of a full or partial contract is made based on the decision of the general manager of the purchasing department. The execution of the contract is confirmed upon receipt of a written report or a copy of the confirmation from the importer for each contract.
Interest rate swaps are undertaken upon a decision by the department responsible for funding and the approval of the responsible individual.

6. Supplementary explanation of items related to the market value of contracts
With regard to the market value of contracts, the contract amount is strictly that of the derivative contract, and in and of itself does not represent the amount of risk inherent in the derivative transaction.
In addition, the contract amounts, market values and valuation profits and losses include portions that will be returned to McDonald’s Company (Japan) Ltd. and its franchisees.
II. Market value of transactions Contract amount, market value, and valuation profit or loss of derivative transactions Currency-related Millions of yen December 31, 2002 December 31, 2003
Amount of contract etc. Amount of contract etc.Category and type Over one year
Market value
Unrealizedgain (loss) Over one year
Market value
Unrealizedgain (loss)
Transactions other than market transactions
Exchange contract transactions
Buying contracts
U.S. Dollar 13,895 7,010 14,149 254 25,952 9,676 24,255 (1,696)
13,895 7,010 14,149 254 25,952 9,676 24,255 (1,696)
(Note) Market value calculation method The end-of-term market value is calculated using prices in the futures market.
(Retirement benefits)
1. Outline of retirement benefit system
Consolidated subsidiary has adopted a qualified pension plan as a defined benefit plan for employees of mandatory retirement age. This is in addition to the internal reserve for lump-sum retirement payments as per its retirement regulations.
In addition to this system of retirement benefits, consolidated subsidiary participates in the Yogashi Employees Pension Fund, and this pension plan is treated as an exception under Article 33 of the Implementation Policy for Retirement Benefit Accounting. Consolidated subsidiary’s portion of this pension fund’s outstanding assets at the end of the term under review, based on the consolidated subsidiary’s contributions (number of participants), was 12,866 million yen.
2. Matters relating to retirement benefit liabilities
Millions of yen December 31, 2002 December 31, 2003 Retirement benefit liabilities (23,284) (19,398)
Pension assets 17,731 20,851
Unaccrued pension benefit liabilities (5,553) 1,452
Unrecognized actuarial gains or losses 6,617 252
Net amount shown on consolidated balance sheet 1,064 1,704
Prepaid pension expenses 1,719 2,706
Allowance for retirement benefits (654) (1,001)

3. Matters relating to retirement benefit expenses
Millions of yen December 31, 2002 December 31, 2003 Current service costs 2,000 1,973
Interest expense 604 605
Expected earnings on pension fund assets (410) (408)
Expensing of differences based on actuarial calculations
443 543
Subtotal 2,637 2,713
Additional retirement funds 443 3,831
Total retirement benefit expenses 3,024 6,544
Note: The amount of additional retirement funds above includes the additional increase in voluntary retirement
of 3,553 million yen.
4. Assumptions underlying the calculation of retirement benefit liabilities
December 31, 2002 December 31, 2003Discount rate 2.6% 2.6%Expected rate of return 2.5% 2.5%Method of allocating prospective retirement benefits to each period
Straight-line method Straight-line method
Amortization period for actuarial gains or losses 13 years 13 years

(Deferred taxes) 1. Breakdown of primary causes of deferred tax assets and liabilities
Millions of yen December 31, 2002 December 31, 2003 Deferred tax assets Enterprise taxes payable 61 75
Excess over limit of allowance for bonuses 202 299
Allowance for directors' retirement 1,047 16
Excess over limit of allowance for doubtful accounts 1,136 820
Excess over limit of allowance for retirement benefits 778 655
Allowance for losses on restaurant closings 2,073 271
Allowance for losses from the liquidation of affiliates - 1,324
Valuation loss on food products and supplies 158 475
Depreciation expenses 237 270
Loss carried forward - 7,303
Others 230 617
5,925 12,182 Deferred tax liabilities Uncollected enterprise tax refunds (243) -
Unrealized gains or losses on other securities (2,317) (3,099)
Gain from establishment of pension plan assets (1,635) (1,582)
Gift Card miscellaneous income (136) (87)
Reserve for special depreciation (542) (420)
Recognized loss on labor insurance premiums (112) -
Others (33) (96)
(5,021) (5,287)
Total deferred tax assets – net 903 6,895
2. Causes of differences between legal effective tax rates and actual corporate tax rate after the application of tax-effect accounting
December 31, 2002 December 31, 2003 Since the Company recorded loss before taxes and other adjustment in this fiscal year, the detailed information is not stated.
Since the Company recorded loss before taxes and other adjustment in this fiscal year, the detailed information is not stated.
Legal effective tax rate 42.05% Legal effective tax rate 42.05%
3. In line with the promulgation on March 31, 2003 of amendments to Japanese regional tax legislation (2003 Law No. 9), the tax rate applied to calculations of deferred tax assets and liabilities as of the end of the fiscal year under review (limited to those items with projected dissolution dates on or after January 1, 2004) was changed to 40.69%, from a rate of 42.05% used in the previous fiscal year. This change resulted in a decrease in deferred tax assets equivalent to 199 million yen, as well as increases in corporate taxes and other adjustments applied to the fiscal year under review, valuation differences from other marketable securities, and revaluation differences, of 238 million yen, 103 million yen, and 64 million yen, respectively.

(Segment information)
Business segment information
For the year ended December 2002 (January 1 – December 31, 2002) and 2003 (January 1 – December 31, 2003), sales, operating income and assets corresponding to hamburger restaurant operations accounted for more than 90% of the group’s total sales, operating income and assets for all business segments. Accordingly, business segment information is omitted.
Geographical segment information
For the year ended December 2002 (January 1 – December 31, 2002) and 2003 (January 1 – December 31, 2003), the Company had no consolidated subsidiaries domiciled outside Japan. Accordingly, there is no geographical segment information.
Overseas sales
For the year ended December 2002 (January 1 – December 31, 2002) and 2003 (January 1 – December 31, 2003), the Company had no sales outside Japan, therefore this section is omitted.

(Transaction with related parties)
December 2002 term
(1) Parent company and primary institutional shareholders % of voting Relationship
December 31; Millions of yen Address Capital
Type of business or occupation
rights held(held by others)
Shareholder and director
Business relationship
Type of transaction
Value of transactions
Accounting classification
Balance at term
end
Parent company of other affiliated companies McDonald's
Corporation Illinois,
U.S.A. US$ 16,600,000
Hamburger restaurant chain
Owned: Indirect 50.0
6 Licensing consent based on a licensing contract
Royalties and others
5,030 - -
(2) Directors and major individual shareholders, etc. % of voting Relationship
December 31; Millions of yen Address Capital
Type of business or occupation
rights held(held by others)
Shareholder and director
Business relationship
Type of transaction
Value of transactions
Accounting classification
Balance at term
end
Companies in which directors or their close relatives own majority voting rights Fujita & Co.,
Ltd. Minato-ku,
Tokyo 70 Owned:
Direct 0.02 Management
fees, etc. 991 - -
Rental fees for stores
3 Prepaid expenses
0
Wages for seconded employees
4 - -
Importing of luxury goods and clothing from the U.S. and Europe
Services provided as per management contract
Rent for company housing
2 Prepaid expenses
0
Den Fujita Co., Ltd.
Minato-ku, Tokyo
50 Trading 2 Importing of food ingredients
8,544 - -
100% directly owned by Fujita & Co., Ltd. Ownership:Direct 0.0
Importing of food ingredients and building materials for stores
Importing of materials for stores
3,055 - -
Den Fujita Kosan Co., Ltd.
Minato-ku, Tokyo
187 Real estate 2 Deposits and guarantees for buildings
- Leasing andguarantee deposits
84
Rental fees for offices
45 Prepaid expenses
3
100% directly owned by director Den Fujita
Leasing of stores and offices
Advances for utilities, etc.
4 - -
Directors and their close relatives Den Fujita, Representative Director
- - Chairman and Representative Director
Owned: Direct 11.2
- - Joint and several guarantees for store lease contracts, for Tokyo Station store and 27 others
- - -
Gen Fujita, Representative Director
- - Director Owned: Direct 5.8
- - Rent for company housing
2 Prepaid expenses
0
Etsuko Fujita, Spouse of representative director Den Fujita
- - Director, Fujita & Co., Ltd.
None - - Rent for company housing
1 Prepaid expenses
0
(Note)
No amount is shown in the “transaction amount” for joint and several guarantees from Den Fujita for the Company’s store lease contracts because there were no outstanding obligations at the end of the term. The monthly lease fees are 33 million yen (excluding consumption tax).

(3) Subsidiaries % of voting Relationship
December 31; Millions of yen Address Capital
Type of business or occupation
rights held(held by others)
Shareholder and director
Business relationship
Type of transaction
Value of transactions
Accounting classification
Balance at term
end Affiliated company Pret A Manger
(Japan), Inc. Minato-ku,
Tokyo 100 Sandwich
chain Owning: Direct 50.0
2 Services provided as per management contract
Lending of funds
600 Long-term loans
509
EveryD Mc, Inc. Shinjuku-ku, Tokyo
100 Electronic commerce
Owning: Direct 50.0
2 - Lending of funds
460 Long-term loans
198

(Transaction with related parties)
December 2003 term
(1) Parent company and primary institutional shareholders Relationship
December 31; Millions of yen
Address Capital
Type of business or occupation
% of voting rights held(held by others)
Shareholder and director
Business relationship
Type of transaction
Value of transactions
Accounting classification
Balance at term
endOther affiliated company McDonald's
Restaurant Operations Inc.
Delaware, U.S.A.
US$ 3,000
Holding company
Owned: Direct 29.4
- -Borrowings of funds
500 Long-term Borrowings
500
(2) Directors and major individual shareholders, etc. Relationship
December 31; Millions of yen
Address Capital
Type of business or occupation
% of voting rights held(held by others)
Shareholder and director
Business relationship
Type of transaction
Value of transactions
Accounting classification
Balance at term
end
Companies with majority of voting rights owned by major individual shareholders or close relatives of major individual shareholder
70
-
Rental fees and deposits and guarantees for stores
7 Prepaid expenses
1
Fujita & Co., Ltd.
Minato-ku, Tokyo
Importing of luxury goods and clothing from the U.S. and Europe
-
Rental of stores and offices
Loss on transfer of insurance reserve
498 - -
187 - Deposits and guarantees for buildings
- Rental and guarantee deposits
84
Den Fujita Kosan Co., Ltd.
Minato-ku, Tokyo
Real estate -
Rental of stores and offices
Rental fees for stores
45 Prepaid expenses
3
Major individual shareholders and close relatives of major individual shareholders Gen Fujita, Eldest son of major individual shareholder Den Fujita
- - Director, Fujita & Co., Ltd.
Owned: Direct 5.8
- - Rent for company housing, etc.
2 Prepaid expenses
0
Etsuko Fujita, Spouse of major individual shareholder Den Fujita
- - Director, Fujita & Co., Ltd.
- - - Rent for company housing
1 Prepaid expenses
0
(3)Subsidiaries % of voting Relationship
December 31; Millions of yen
Address Capital
Type of business or occupation
rights held(held by others)
Shareholder and director
Business relationship
Type of transaction
Value of transactions
Accounting classification
Balance at term
end
Affiliated company
Pret A Manger (Japan), Inc.
Minato-ku, Tokyo
100 Sandwich chain
Owning: Direct 50.0
3 Lending of funds
1,700 Long-term loans
2,300
Services provided as per management contract Rent for
stores, etc. 67 Others
(current assets)
3
Note The allowance for doubtful account is set on the long-term loans to Pret A Manger (Japan), Inc. for whole balance.

Reference (Transaction with related parties)
December 2003 term Transactions between parties affiliated with both the Company and its consolidated subsidiary, McDonald’s Company (Japan), Ltd. (affiliated party relationships on a consolidated basis) are as follows:
(1) Parent company and primary institutional shareholders Relationship
December 31; Millions of yen Address Capital
Type of business or occupation
% of voting rights held(held by others)
Shareholder and director
Business relationship
Type of transaction
Value of transaction
s Accounting classification
Balance at term
end
Parent company McDonald's
Corporation Illinois,
U.S.A. US$
16,600,000 Hamburger restaurant chain
Owned: Indirect 50.0
4 Royalties and others
10,215 Accounts payable - other
5,340
Licensing consent based on a licensing contract
Receipt of retail license fee and others
58 Others (current assets)r
32
Other affiliated company McDonald's
Restaurant Operations Inc.
Delaware, U.S.A.
US$ 3,000
Holding company
Owned: Direct 29.4
- - Borrowings of funds
500 Long-tem borrowings
500
(2) Directors and major individual shareholders, etc. Relationship
December 31; Millions of yen
Address Capital
Type of business or occupation
% of voting rights held(held by others)
Shareholder and director
Business relationship
Type of transaction
Value of transactions
Accounting classification
Balance at term
end
Companies with majority of voting rights owned by major individual shareholders or their close relative
70
- Management fees, etc.
1,939 Accounts payable-other
1,041
Leasing fees for stores
7 Prepaid expenses
1
Loss on transfer of insurance reserve
512 Others (current assets)
2
Fujita & Co., Ltd.
Minato-ku, Tokyo
Importing of luxury goods and clothing from the U.S. and Europe
-
Services provided as per management contract
Management services contract cancellation fee
6,249 Accounts payable-other
6,249
Importing of food ingredients
12,661 - -Den Fujita Co., Ltd.
Minato-ku, Tokyo
50
Trading - - Importing of food ingredients and building materials for stores
Import of materials for stores
7,254 Accounts payable - other
759
187 - Deposits and guarantees for buildings
- Rental and guarantee deposits
84
Office leases 45 Prepaid expenses
3
Den Fujita Kosan Co., Ltd.
Minato-ku, Tokyo
Real estate -
Leasing of stores and offices
Advances for utilities, etc.
9 - -
Close relatives of major individual shareholders Gen Fujita, Son of major individual shareholder Den Fujita
- - Director, Fujita & Co., Ltd.
Owned: Direct 5.8
- - Rent for company housing, etc.
2 Prepaid expenses
0
Etsuko Fujita, Spouse of major individual shareholder Den Fujita
- - Director, Fujita & Co., Ltd.
- - - Rent for company housing
1 Prepaid expenses
0

(3) Subsidiaries
Relationship
Balanceat term
endDecember 31; Millions of yen
Address Capital
Type of business or occupation
% of voting rights held(held by others)
Shareholder and director
Business relationship
Type of transaction
Value of transactions
Accounting classification
Affiliated company
Pret A Manger (Japan), Inc.
Minato-ku, Tokyo
100 Sandwich chain
3 Lending of funds
1,700 Long-term loans
-
Rent for stores, etc.
67 Others (current assets)
3
Owning: Direct 50.0
Services provided as per management contract
Advances for employees' salaries
124 Others (current assets)
8
Note As a result of application of equity method, the long-term loan to Pret A Manger (Japan), Inc. is zero balance on the consolidated balance sheet.
Policies regarding transaction conditions
1. Consumption tax is included in the year-end balances but not in the transaction amounts listed in (1)–(3) above.
2. McDonald’s Company (Japan), Ltd., the Company’s consolidated subsidiary, has concluded an enforcement and consent contract with McDonald’s Corporation, under which royalties are paid in the amount of 2.5% of systemwide sales (total sales of company-operated and franchised stores).
3. McDonald’s Company (Japan), Ltd., the Company’s consolidated subsidiary, has concluded the Management Services Agreement with Fujita & Co., Ltd., under which a management fee is paid in the amount 0.5% of systemwide sales (total sales of company-operated and franchised stores), but cancelled the Agreement effective at the end of December 2003.
4. The amount of lease payments for stores and offices, and residential rental payments paid to Fujita & Co., Ltd. and Den Fujita Kosan are determined by referring to corresponding rents in the geographic vicinity.
5. The Company ’s imported food ingredients are purchased through Fuji Echo Co., Ltd. Because the Company’s direct counterparty is Fuji Echo, the end-of-term outstanding amount of imported food ingredients with the importer Den Fujita Co., Ltd. is nil. The transaction amounts shown above are the amounts of purchases through Fuji Echo.
Den Fujita Co., Ltd. charges Fuji Echo an import handling fee of 2.5% of the yen settlement amount of the foreign currency price of the imported goods, including shipping. Fuji Echo takes this handling fee into account when setting the transaction prices for food ingredients purchased by the Company. Accordingly, this import handling fee is included in the above transaction amounts.
The rate of the import handling fee is periodically reviewed with reference to market rates, and approved by the board of directors.
The Company, based on its own judgment, requests the importer Den Fujita Co., Ltd. to enter into forward foreign exchange contracts for the importing of food ingredients.
6. The interest rate applied in the loan to Pret A Manger (Japan), Inc. is calculated based on the market rate of interest.
7. The interest rate applied in the borrowings from McDonald's Restaurant Operations Inc. is based on the market rate of interest.

(Per share-related financial information)
Yen December 31, 2002 December 31, 2003Shareholders' equity per share 1,134.69 Shareholders' equity per share 1,160.60
Net loss per share 17.57 Net loss per share 53.57
No amounts for fully diluted earnings per share have been shown because the Company had neither bonds with warrants nor convertible bonds outstanding in the year to December 2002.
No amounts for fully diluted earnings per share have been shown because the Company had no latent stock in the form of bonds with attached equity subscription rights outstanding in the year to December 2003. The accounting standard governing net income per share (Corporate Accounting Standard No. 2) and the related guidelines for the application of this accounting standard (Corporate Accounting Standard Application Guidelines No. 4) are adopted full by the Company from this fiscal year. There is no impact on per share-related information even the new standards were adopted fully in last fiscal year.
(Note) Net loss per share is calculated based on the following information.
Millions of yen December 31, 2002 December 31, 2003 Net loss - 7,121
Income not available to common stockholders - -
Loss available to common stockholders - 7,121
Average number of common shares outstanding (thousands shares) - 132,959
(Important matters occurring subsequent to report period)
Not applicable

6. Sales McDonald’s Company (Japan) Ltd., the Company’s consolidated subsidiary derives its revenue from the development of company-operated McDonald’s hamburger restaurants and from royalties paid by franchised stores. The Composition of sales, sales of company-operated stores by geographic region, and number of company-operated stores are shown below.
Sales (1) Sales results by division
December 31, 2002 December 31, 2003
Millions of yen AmountPercentage of
total (%) Amount Percentage of
total (%)Company-operated store sales Sandwiches 116,537 36.3 113,154 37.8
Desserts 73,390 22.9 61,296 20.5
Drinks 85,097 26.5 79,830 26.7
Breakfasts 4,783 1.5 4,347 1.5
Breakfast desserts 5,346 1.7 4,844 1.6
Others 7,760 2.4 7,311 2.4
292,916 91.3 270,785 90.5
Franchise revenue 25,971 8.1 27,621 9.2
Others 1,826 0.6 840 0.3
320,713 100.0 299,247 100.0
(Notes) 1. The above does not include consumption taxes.
2. The portion of sales from franchised restaurants is not included in the amounts shown as company-operated store sales.
3. Sales amounts shown under franchise revenue include royalties, rental fees, sales promotion expenses, and proceeds from the sale of stores.
4. Sandwiches consists of burgers including hamburgers, cheeseburgers, Big Mac®, Filet-O-Fish, Chicken Tatsuta, etc.
5. “Others” sales consists of revenue from service fees, advertising, and consignment sales operations.

(2) Company-operated store sales and number of stores by geographic region.
December 31, 2002 December 31, 2003
Millions of yen No. of stores AmountPercentage of
total (%) No. of stores Amount Percentage of
total (%)Hokkaido 75 6,365 2.2 67 5,694 2.1 Aomori 13 1,192 0.4 10 950 0.4 Iwate 14 1,216 0.4 15 1,158 0.4 Miyagi 39 4,242 1.4 42 4,172 1.5 Akita 15 1,115 0.4 14 1,056 0.4 Yamagata 16 1,113 0.4 18 1,205 0.4 Fukushima 25 2,092 0.7 23 1,908 0.7 Ibaraki 94 9,241 3.2 77 7,477 2.8 Tochigi 49 3,967 1.4 49 3,936 1.5 Gunma 51 4,185 1.4 49 3,840 1.4 Saitama 143 14,680 5.0 133 12,528 4.6 Chiba 143 15,175 5.2 126 14,001 5.2 Tokyo 400 55,189 18.9 386 51,372 19.0 Kanagawa 224 27,202 9.3 217 25,581 9.4 Niigata 28 2,494 0.9 24 2,206 0.8 Toyama 27 2,078 0.7 23 1,972 0.7 Ishikawa 19 1,939 0.7 17 1,574 0.6 Fukui 11 935 0.3 14 1,138 0.4 Yamanashi 31 2,652 0.9 27 2,314 0.9 Nagano 54 3,806 1.3 52 3,487 1.3 Gifu 53 4,735 1.6 51 4,156 1.5 Shizuoka 80 6,946 2.4 69 6,188 2.3 Aichi 206 18,626 6.4 196 17,974 6.6 Mie 45 3,623 1.2 43 3,418 1.3 Shiga 47 4,037 1.4 46 3,900 1.4 Kyoto 87 8,635 2.9 74 7,590 2.8 Osaka 243 28,295 9.7 243 26,911 9.9 Hyogo 120 12,306 4.2 108 11,105 4.1 Nara 37 3,455 1.2 32 2,995 1.1 Wakayama 22 1,888 0.6 18 1,546 0.6 Tottori - - - 2 69 0.0 Shimane 2 220 0.1 2 113 0.0 Okayama 30 3,015 1.0 27 2,846 1.1 Hiroshima 44 4,589 1.6 43 4,446 1.6 Yamaguchi 21 1,782 0.6 18 1,509 0.6 Tokushima 14 1,758 0.6 12 1,511 0.6 Kagawa 20 2,077 0.7 20 1,929 0.7 Ehime 28 2,149 0.7 28 2,155 0.8 Kochi 8 716 0.2 5 631 0.2 Fukuoka 85 8,492 2.9 82 7,877 2.9 Saga 12 1,007 0.3 12 902 0.3 Nagasaki 13 1,260 0.4 13 1,206 0.4 Kumamoto 31 3,154 1.1 30 3,006 1.1 Oita 19 2,171 0.7 18 2,091 0.8 Miyazaki 15 1,202 0.4 15 1,211 0.4 Kagoshima 19 1,900 0.6 18 1,852 0.7 Okinawa 29 3,979 1.4 29 4,056 1.5 2,801 292,916 100.0 2,637 270,785 100.0
(Notes) 1. The number of stores shown above is the number of stores as of the final day of the term under review. 2. The above does not include consumption taxes. 3. The number of stores and sales amounts shown above do not include the franchised stores’ portion.

Financial Results Report
for the December 2003 Term (Nonconsolidated) February 13, 2004
McDonald’s Holdings Company (Japan), Ltd. Company code number: 2702 (URL http://www.mcd-holdings.co.jp/) Shares traded: JASDAQ Location of headquarters: Tokyo Please address all communications to: Tadashi Ishida, Executive Director Corporate accounting/treasury, investor relations Phone: (03) 3345-8223 Date of Board of Directors’ meeting for approval
of financial results: February 13, 2004 Date of regular general meeting of shareholders: March 30, 2004 Adoption of system of interim dividends: Yes Application of unit trading system: Yes (100 shares per unit)
1. Nonconsolidated operating results (From January 1, 2003 to December 31, 2003)
(1) Nonconsolidated financial results (In millions of yen, with fractional amounts discarded)(The number with parenthesis shows negative figure)
Net sales Operating income Ordinary income (Millions of yen) % (Millions of yen) % (Millions of yen) %
December 31, 2003 53,154 (71.6) 1,088 (69.8) 558 (68.0)
December 31, 2002 186,900 (48.3) 3,601 (81.3) 1,745 (90.8)
Net loss Net loss per
share
Net loss per share, fully
diluted
Return on shareholders'
equity
Ratio of ordinary
income to total assets
Ratio of ordinary
income to net sales
(Millions of yen) % (Yen) (Yen) % % %
December 31, 2003 2,318 - 17.44 - (1.6) 0.3 1.1
December 31, 2002 1,375 - 10.34 - (0.9) 0.8 0.9
(Notes) 1. Average number of outstanding shares during term:
December 2003 term: 132,959,902 shares December 2002 term: 132,959,973 shares 2. Changes in accounting methods: None 3. The percentages shown next to net sales, operating income, ordinary profit and net loss represent year-on-year changes 4. The Company was engaged in hamburger restaurant operations until June 30, 2002. However, on July 1, 2002, the Company
became a holding company renamed as McDonald’s Holdings Company (Japan), Ltd., and transferred its business division engaged in hamburger restaurant operations to the newly established McDonald’s Company (Japan), Ltd., which was established as a subsidiary through a corporate split on the same date. Accordingly, the performance data for the latest fiscal year reflect substantial changes in the nature of the Company, while the figures for the fiscal year ended December 2002 include hamburger restaurant operations.

(2) Dividends Annual dividends per share Interim period Term end
Dividend payment
Dividend payout ratio
The ratio of dividend to shareholders'
equity (Yen) (Yen) (Yen) (Millions of yen) % %
December 31, 2003 30.00 - 30.00 3,988 - 2.7
December 31, 2002 30.00 - 30.00 3,988 - 2.6
(3) Nonconsolidated financial position
Total assets Shareholders’ equity Equity ratio Shareholders' equity
per share (Millions of yen) (Millions of yen) % (Yen)
December 31, 2003 161,595 146,781 90.8 1,103.95
December 31, 2002 170,586 151,829 89.0 1,141.92
(Notes) Number of outstanding shares at end of term:
December 2003 term: 132,959,902 shares December 2002 term: 132,959,902 shares
Number of treasury stock at end of term: December 2003 term: 98 shares December 2002 term: 98 shares
2. Nonconsolidated forecasts for December 2004 term (From January 1, 2004 to December 31, 2004)
Annual dividends per share Net sales Ordinary income Net income Interim period Term end
(Millions of yen) (Millions of yen) (Millions of yen) (Yen) (Yen) (Yen)
Interim period 26,600 257 226 0 - -
Annual 53,200 751 531 - 30 30
(N.b.) Estimated earnings per share (annual): 3.99yen
The forecasts shown above are predicated upon information that is available as of the day of the announcement of this report; they incorporate assumptions, made as of the day of the announcement of this report, regarding a number of uncertain factors that may affect future performance. Actual financial performance, therefore, may differ considerably from these forecasts due to a variety of factors hereafter.

7. Nonconsolidated financial statements (1) Nonconsolidated balance sheet
Millions of yen December 31, 2002 % December 31, 2003 % Year-on-year
changeCurrent assets Cash and deposits 1,712 4,484 Accounts receivable - trade 4,930 3,383 Negotiable securities 460 - Prepaid expenses 2,390 2,234 Deferred tax assets 1,343 1,470 Short-term loans - 5,000 Income taxes refunds receivable 3,354 - Others 675 128 14,866 8.7 16,702 10.3 1,836 Fixed assets Tangible fixed assets Buildings 82,089 73,757 Accumulated depreciation 46,281 44,145 35,808 29,612 Structures 8,268 7,748 Accumulated depreciation 4,823 4,756 3,445 2,991 Vehicles and delivery equipment 21 - Accumulated depreciation 12 - 8 - Tools, appliances and fixtures 127 126 Accumulated depreciation 109 114 18 11 Land 16,569 16,840 55,850 32.8 49,456 30.6 (6,393)Intangible fixed assets Leaseholds 729 729 Software 3,808 3,688 Telephone subscription rights 98 98 4,636 2.7 4,516 2.8 (120)Investments and other assets Investments in securities 6,360 8,467 Shares of affiliated companies 1,049 1,572 Investments in affiliated companies 22 213 Long-term loans 11 46 Long-term loans to affiliates 1,060 2,300
Deferred tax assets due to revaluation 1,992 1,926
Claims in bankruptcy and substantial bankruptcy 1,463 911 Long-term prepaid expenses 1,102 999 Deferred tax assets 54 739
Leasing and guarantee deposits 83,890 77,284 Others 812 683 Allowance for doubtful accounts (2,586) (4,227) 95,232 55.8 90,919 56.3 (4,313)Total fixed assets 155,720 91.3 144,892 89.7 (10,827)Total assets 170,586 100.0 161,595 100.0 (8,991)

Millions of yen December 31, 2002 % December 31, 2003 % Year-on-year
changeCurrent liabilities Accounts payable - trade 835 706 Current portion of long-term debt 4,000 5,000 Accounts payable - other 6,523 5,365 Accounts expenses payable 52 7
86 Allowance for bonuses 0
460
7.9
Income taxes payable - 70 Consumption taxes payable 110 23 Advances receipt 247
1 Allowance for losses on restaurant closings 3,989 Allowance for losses from the liquidation of affiliates
- 800
Others - 224 15,759 9.2 12,745 (3,014)
Long-term liabilities Long-term debt
Guarantee deposits received 1.3 (929)
250 1,750 Allowance for directors' retirement 2,466 26
280 291 2,997 1.8 2,068 Total liabilities 18,757 11.0 14,813 9.2 (3,943)Shareholders' equity
- - Additional paid-in capital 24.7 Legal income reserves 0.1 -
(1.6)Retained earnings Voluntary reserves - Reserve for special depreciation Unappropriated retained earnings, end of term - 84,890
Common stock 24,113 14.1 (24,113)42,124 - - (42,124)
253 - (253)Revaluation account for land (2,745) - - 2,745
895 (895)83,994 (83,994)
49.8 - (84,890)Unrecognized holding gain on other securities 3,193 1.9 (3,193)
-
- - Treasury stock (0) (0.0) - - 0Total shareholders’ equity 151,829 89.0 - (151,829) Common stock
Additional paid-in capital 42,124 -
- - 24,113 14.9 24,113 Capital reserves
-- 42,124 26.1 42,124
Retained earnings Legal income reserves 253 Unappropriated retained earnings, end of term 78,581 48.7
- 253 - 78,581 - - 78,834 78,834
Revaluation account for land (2,808)
-Total shareholders’ equity - 146,781 90.8
- - (1.7) (2,808)Unrecognized holding gain on other securities - - 4,518 2.8 4,518 Treasury stock - (0) (0.0) (0)
- 146,781 Total liabilities and shareholders' equity 100.0 (8,991)170,586 161,595 100.0

(2) Nonconsolidated statement of income
Millions of yen Year ended
December 31, 2002 %Year ended
December 31, 2003 % Year-on-year
changeSales 186,900 100.0 53,154 100.0 (133,745)Cost of sales 163,871 93.1 Gross profit on sales 23,028 6.9
87.7 49,512 (114,358)12.3 3,641 (19,387)
Selling, general and administrative expenses 19,4273,601
10.4 2,552 4.9 (16,874)Operating income 1.9 1,088 2.0 (2,512)Nonoperating income
Revenue from unredeemed gift certificates 279
1,344 (404)
Interest income 97 188 Dividend income - 101 Closure-related compensation - 230
521 141 Others 725 0.7 940 1.8 Nonoperating expenses
423
Interest expenses 102 Provision for allowance for doubtful accounts 776 79 Loss on disposal of fixed assets at stores 1,440 1,018 Others 560
271
3,200 1.7 1,471 2.7 (1,729)Ordinary income 1,745 0.9 558 1.1 (1,187)Extraordinary income Gain on revision of earnings from previous term - 116 Gain on reversal of allowance for doubtful accounts 281 -
Gain on reversal of allowance for bonuses 240 - Gain on reversal of allowance for restaurant closures - 487
Revenue from unredeemed gift certificates in previous years
929 -
Gain on sales of fixed assets - 17 Gain on sale of investment securities - 55 Compensation for relocation of stores 160 136 Others 3 - 1,615 0.9 813 1.5 (802)Extraordinary losses
44
2.9
Loss on revision of earnings from previous term - One-time write-off of remaining value of fully-depreciated tangible fixed assets
606 -
Loss on sale of land 187 - Loss on disposal of fixed assets 431 542 Valuation loss on investment securities 55 - Loss on withdrawal from McVision business - 1,221 Losses from the liquidation of affiliates - 3,150 Valuation loss on shares in affiliates 50 - Provision for allowance for restaurant closures 3,989 - Loss on transfer of directors' insurance reserve - 121 Loss on disposal of welfare facilities - 299 Others 29 3 5,348 5,382 10.1 33

% Millions of yen
Year endedDecember 31, 2002 %
Year endedDecember 31, 2003
Year-on-yearchange
Loss before income taxes 1,987 (1.1) 4,011 (7.5) (2,023)Income taxes
(612)
1,138 84 Deferred taxes (1,750) (1,776) (0.4) (1,692) (3.1) (1,080)Net loss 1,375 (0.7) 2,318 (4.4) (943)Retained earnings carried forward from previous term
(4,509)
(1)
85,411 80,901
Disposition of revaluation account for land (41) 39 Unappropriated retained earnings, end of term 83,994 78,581 (5,413)

(3) Proposal for appropriation of retained earnings
Millions of yen December 31, 2002 December 31, 2003 Year-on-year
changeUnappropriated retained earnings, end of term 83,994 78,581 (5,413)Disposition of voluntary reserves Disposition of reserve for special depreciation 895 - (895) 84,890 78,581 (6,308)Appropriation of retained earnings Dividends 3,988 3,988 -Retained earnings carried forward to next term 80,901 74,592 (6,308)
(Notes) 1. The disposition of the special depreciation reserve at last fiscal year corresponds to the portion of the reserve no longer required
following the transfer of equipment, tools and utensils to McDonald’s Company (Japan), Ltd. as per the corporate split.
2. Dividends to shareholders are based on the exclusion of 98 shares of treasury stock in both 2002 and 2003 terms.

Significant accounting policies Item December 31, 2002 December 31, 2003
1. (1) Bonds held to maturity: (1) Bonds held to maturity:
Cost amortization method (straight line) Same as December 31, 2002 (2) Shares in subsidiaries and affiliates: (2) Shares in subsidiaries and affiliates:
(3) Other securities: (3)
Valued at cost using the periodic average method
Same as December 31, 2002
Other securities:
Quoted securities: market price method based on closing prices on the date of the closing of accounts (all differences are credited or debited directly to the shareholders' equity account; sales prices are calculated on the basis of average cost)
Same as December 31, 2002
Standards and methods of valuation for marketable and investment securities
Unquoted securities: valued at cost using the periodic average method
2. Market price method
Standards and methods of valuation for derivatives
Hedge instruments are not valued at market prices when other applicable special valuation criteria are satisfied.
-

Item December 31, 2002 December 31, 2003
3. (1) Tangible fixed assets: straight-line method Tangible fixed assets: straight-line method (1) depreciable Major
assets and methods of depreciation
Years of useful life for principal assets: Buildings and structures: 2 – 50 years Machinery and transportation equipment:
This change was made for two reasons. First, in preparing for corporate separation in the year to December 2002, the Company closely analyzed expenses and revenues arising in conjunction with restaurant openings. It found that revenues were realized steadily and evenly over long periods of time following restaurant openings and that repair and other maintenance costs were also accrued steadily over long periods. It discovered further that at the time of asset removal such assets contained no residual value. This led the Company to conclude that the straight-line method was the more reasonable one for matching revenues and expenses. Secondly, with the restaurant operation being spun off to a subsidiary during the year to December 2002, it was felt that, from the standpoint of appropriate reporting of periodic revenues and expenses, the straight-line method would create a more uniform recognition of equipment expenses by the subsidiary.
2 - 15 years Tools, appliances and fixtures: 2 - 20 years
Same as December 31, 2002
(Changes in accounting policies) (Changes in accounting policies) It has been the Company’s practice to use the
fixed-percentage-of-declining-balance method to depreciate all of its tangible fixed assets (with the exception of buildings {excluding equipment appurtenant to such buildings} acquired after April 1, 1998, which it depreciates using the straight-line method). In the year to December 2002, however, the Company altered this practice and adopted the straight-line method for such depreciation (with this new practice entailing that, after depreciation has been carried out in accordance with provisions of the Corporation Tax Law, assets be depreciated until book value has been reduced to actual residual value).
-
This change in accounting policy has resulted in residual values for tangible fixed assets, which had been depreciated in past years only up to the limits allowed under the Corporation Tax Law. The Company has thus recognized as an extraordinary expense a one-time depreciation of these residual values amounting to 606 million yen. As a result, depreciation expenses for the term were 2,528 million yen less than would have been the case under the previous accounting treatment. Accordingly, both operating income and ordinary profit were 2,528 million yen greater, and net income (loss) before taxes and other adjustments was 1,921 less than would have been the case under the previous accounting treatment.
These numbers do not include the effects of the transfer of tangible fixed assets to McDonald’s Company (Japan), Ltd. pursuant to the corporate separation.

Item December 31, 2002 December 31, 2003
(2) Intangible fixed assets: straight-line method (2) Intangible fixed assets: straight-line method For software used internally, the straight-line
method is applied based on the period of expected use by the Company (5 years).
Same as December 31, 2002
(3) Long-term prepaid expenses: (3) Long-term prepaid expenses: Straight-line method Same as December 31, 2002
4. (1) Allowance for doubtful accounts (1) Allowance for doubtful accounts
Standards for important allowances To provide for potential losses from doubtful
accounts, the Company recognizes an amount calculated on the basis of a statutory deduction ratio for general accounts receivable plus an amount for specific accounts for which collection appears doubtful.
Same as December 31, 2002
(2) Reserve for bonuses (2) Reserve for bonuses
(3) Reserve for directors' retirement allowances
To provide for payments of bonuses to employees, the Company estimates amounts that will have to be paid and recognizes these required amounts.
Same as December 31, 2002
(3) Reserve for directors' retirement allowances Recognition of full amount of liability at third
quarter term end based on employment regulations.
Same as December 31, 2002
Allowance for losses on restaurant closings (4) Allowance for losses on restaurant closings (4) The Company expects losses to arise
hereafter from restaurant closures decided upon during the year to December 2002 for the purpose of radically improving its structure of profitability. It will recognize as losses amounts arrived at through reasonable means of estimation.
The Company expects losses to arise hereafter from restaurant closures decided upon during the year to December 2002 for the purpose of radically improving its structure of profitability. It will recognize as losses amounts arrived at through reasonable means of estimation.
(5) Reserve for losses on liquidation of affiliate (5) Reserve for losses on liquidation of affiliate
5
- This reserve recognizes losses, based on reasonable estimations, expected to arise hereafter in connection with the Company’s withdrawal from the sandwich retailing business formerly operated by Pret A Manger (Japan), Inc.
. Accounting for significant lease transactions
Financing leases, which exclude leased assets for which title is recognized as being conveyed to lessees, are treated as ordinary rental transactions.
-
6. (1) Accounting method: (1) Accounting method: Hedge accounting methods
Special valuation criteria are applied for interest rate swaps.
Same as December 31, 2002
(2) Hedging methods and items hedged: (2) Hedging methods and items hedged: Hedging methods: interest swap Same as December 31, 2002 Items hedged: loans payable (3) Policy related to hedging: (3) Policy related to hedging: Hedging is conducted to manage the risk of
market fluctuation of interest rates for interest on loans payable.
Hedging is conducted to manage the risk of market fluctuation of interest rates for interest on loans payable.
(4) Method of evaluating the effectiveness of hedging:
Method of evaluating the effectiveness of hedging:
(4)
The details of the determination of hedge effectiveness are omitted since special valuation criteria are applied.
Same as December 31, 2002

Item December 31, 2002 December 31, 2003
7. (1) Accounting for consumption taxes: (1) Accounting for consumption taxes:
Amounts shown are exclusive of consumption taxes.
Same as December 31, 2002
(2) (2) Accounting standards for treasury stock and disposition of the legal reserve
Due to revisions of the rules relating to preparation of financial statements, the shareholders’ equity section of balance sheet is based on the new standard.
- The accounting standard governing treasury stock and disposition of the legal reserve (Corporate Accounting Standard No. 1) became effective in Japan on April 1, 2002, and was adopted in full by the Company from this fiscal year.
(3) (3) Net income per share -
Other significant items associated with the statements preparation of financial
The accounting standard governing net income per share (Corporate Accounting Standard No. 2) and the related guidelines for the application of this accounting standard (Corporate Accounting Standard Application Guidelines No. 4) became effective in Japan on April 1, 2002, and were adopted in full by the Company from this fiscal year.

Changes in accounting policies December 2002 term (Change in method of presentation of selling, general and administrative expenses and cost of sales.)
The Company has reclassified as cost of sales a number of expenses previously recognized as SG&A expenses. These are expenses that had been incurred at company-operated restaurants during the period prior to the corporate split when the Company operated hamburger restaurants.
This change was made in the interest of providing a more suitable picture of the earnings being generated by sales activities. In anticipation of the corporate split in the year to December 2002, the Company instituted the change by reassessing the way in which it reported the expenses accruing at restaurants and by clearly indicating the way in which net sales related to cost of sales.
However, marketing for hamburger restaurants was not transferred to McDonald’s Company (Japan) Ltd. as part of the Company’s conversion to a holding company as per the July 1 corporate split..
(Change in method of presentation of nonoperating income and sales)
It has also been the Company’s practice to report the net amounts of revenues and expenses for rendered services at advertising companies, consignment sales companies, and investment companies as non-operating income. Beginning in the year to December 2002, it will report these revenues and expenses as a part of net sales and cost of sales, respectively.
This change was made to account for the growing importance of such activities and to bring greater clarity to revenue and expense-related classifications on the basis of the Company’s operating activities. The change will require that the Company’s Articles of Incorporation be revised and that these activities be newly recognized as major business activities.
However, advertising businesses, consignment sales businesses, and services provided to investing companies were not transferred to McDonald’s Company (Japan) Ltd. following the corporate split.
As a result of these changes, sales and the cost of sales for the term were 911 million yen and 6,254 million yen greater, respectively, and selling, general and administrative expenses and nonoperating income were 5,959 million yen and 615 million yen less, respectively, than would have been the case under the previous accounting treatment.
Changes in the method of presentation Millions of yen December 31, 2002 December 31, 2003
“Dividend income” and “Closure-related compensation” were presented in “Others” in the Non-operating income section of consolidated statement of income until last fiscal year. However, the both accounts are more than one-tenth of total Non-operating income this year and, therefore, accounts are designated in the statement. The amounts for the last fiscal year are as follows: Dividend income 38 Closure-related compensation 119

Additional information
The Company acquired treasury stock during the term as the result of repurchases of shares constituting less than one round lot. As per the “Ministerial Ordinance Partially Revising the Regulations for Financial Statements of Kabushikigaisha (Ministry of Justice Ordinance No. 66; September 12, 2001),” treasury stock is listed as a new item separate and excluded from shareholders’ equity.
December 2002 term (Accounting treatment for unused prepaid cards (McCards))
During the period ended December 2002, the Company surveyed the usage of its prepaid McCards and found that when cards had gone unused for more than two years from the date of sale, they were virtually certain to remain unused thereafter under current conditions. Consequently, although it had previously recognized all unused prepaid cards as “advances received,” it decided to reclassify such amounts as non-operating income. Accordingly, 521 million yen was recorded as nonoperating revenue during the term.
As of the end of the year to December 2002, there was 929 million yen worth of cards that had passed this two-year threshold in periods prior to that year. The Company thus recognized this entire amount as extraordinary income for the year to December 2002.
As a result of this change, the Company recognized 521 million yen more in ordinary profit and 1,450 million yen more in net loss before taxes than would have been the case had the change had not been made.
Following the corporate split on July 1, all sales and collection operations relating to McCards were transferred to McDonald’s Company (Japan), Ltd.
(Change in presentation items for accrued employee bonuses)
The amount expected to be paid as employee bonuses corresponding to the term under review (989 million yen as of the end of the previous term) was previously included under “accrued expenses payable,” but as per the “Research Center Deliberation Report No. 15 (The Japanese Institute of Certified Public Accountants; February 14, 2001),” this amount is shown as “allowance for bonuses” from the term under review.
(Additional reporting items under sales and cost of sales)
The Company was engaged in the operation of hamburger restaurants until June 30, 2002. These operations were assumed by the subsidiary McDonald’s Company (Japan) Ltd. as part of a corporate split carried out on July 1, 2002, from which time the Company became a holding company. This created a significant change in the Company’s business, and the following presentation items were changed as a result.
Following the corporate split, the Company’s primary business became the leasing of real estate to subsidiaries and affiliates. Accordingly, following the corporate split, the item “rental income” from the real estate leasing business was added to sales, in addition to “sales” and “cost of sales” from hamburger restaurant operations, and “cost of rental income” was added as the cost of sales corresponding to “rental income.”
Accordingly, “accounts receivable - trade” represents lease revenue receivables from subsidiaries and affiliates, and “accounts payable - trade ” represents accrued leasing fees for leased assets provided by subsidiaries and affiliates.
(Treasury stock)

Notes (Nonconsolidated balance sheet - related) Millions of yen December 31, 2002 December 31, 2003
1. Securities in the amount of 460 million yen and investment securities in the amount of 669 million yen are provided as guarantee deposits for the issuing of gift certificates, as per the relevant laws regulating prepaid gift certificates. Liabilities collateralized by these securities are advance receipts from customers in the amount of 227 million yen. In addition, securities are deposited as collateral for liabilities of McDonald’s Company (Japan) Ltd.
1. Investment securities in the amount of 668 million yen and “other” assets in investments and other assets in the amount of 510 million yen are provided as guarantee deposits for the issuing of gift certificates (McCard), as per the relevant laws regulating prepaid gift certificates. Liabilities collateralized by these securities are advance receipts from customers in the amount of 86 million yen. In addition, securities are deposited as collateral for liabilities of McDonald’s Company (Japan) Ltd.
2. Number of shares authorized to be issued and outstanding shares
standing shares
2.Number of shares authorized to be issued and out
Number of shares authorized to be issued 480,840,000 shares
Number of shares authorized to be issued
480,840,000shares of
common stock Number of outstanding shares 132,960,000
sharesNumber of outstanding shares
132,960,000 shares of
common stock3. - 3.The Company has 98 shares of its common stock as a treasury
stock. 4. Contingent liabilities 4.Contingent liabilities
(1) Guarantees provided for borrowings from financial institutions by parties in which the Company has an equity stake:
(1) Guarantees provided for borrowings from financial institutions by parties in which the Company has an equity stake:
McDonald's Company (Japan), Ltd. 4,000 Toys"R"Us-Japan, Ltd. 3,832 Toys"R"Us-Japan, Ltd. 3,656 (2) Guarantees provided for employees’
mortgages from banks: 140 (2) Guarantees provided for employees’
mortgages from banks: 86
(3) Guarantees of obligations for lease contracts of third-party companies:
(3) -
Music Bird Co., Ltd. 1,144 (4) Liabilities (security deposits held)
assumed by McDonald’s Company (Japan), Ltd. at the time of corporate separation:
1,802 (4) Liabilities (security deposits held) assumed by McDonald’s Company (Japan), Ltd. at the time of corporate separation:
1,638
5. Reductions of tangible fixed assets from gains on insurance
claims were 173 million yen, and reductions of tangible fixed assets from expropriation were 110 million yen.
5.Reductions of tangible fixed assets from gains on insurance claims were 133 million yen, and reductions of tangible fixed assets from expropriation were 110 million yen.
6. Note to affiliated companies 6.Note to affiliated companies Assets and liabilities at affiliated companies included in other items
Assets and liabilities at affiliated companies included in other items
Accounts receivable 4,923 Accounts receivable 3,380 Accounts payable - other 6,506 Short-term loans 5,000 Accounts payable - other 5,345
7. Dividend restrictions 7.Dividend restrictions Net assets increased by 3,193 million yen due to the market valuation of securities. As stipulated in Article 290-1-6 of the Commercial Code, the use of this amount for dividends is restricted.
Net assets increased by 4,518 million yen due to the market valuation of securities. As stipulated in Article 124-3 of the Commercial Code, the use of this amount for dividends is restricted.
8. Revaluation of land 8.Revaluation of land
As per the Law Regarding the Revaluation of Land (Public Law No. 34, March 31, 1998), land used for business purposes is revalued and any valuation differential is recorded under shareholders’ equity.
As per the Law Regarding the Revaluation of Land (Public Law No. 34, March 31, 1998), land used for business purposes is revalued and any valuation differential is recorded under shareholders’ equity.
Revaluation method: Revaluation method:
As per Article 2-3 of the Implementation Order for the Revaluation of Land (Public Ordinance No. 119, March 31, 1998), the calculation was carried out using a rational adjustment based on the valuation amount for property tax.
As per Article 2-3 of the Implementation Order for the Revaluation of Land (Public Ordinance No. 119, March 31, 1998), the calculation was carried out using a rational adjustment based on the valuation amount for property tax.
Date of revaluation: December 31, 2001 Date of revaluation: December 31, 2001 Differential between book value and
post-revaluation market value of revalued land at end of term
(1,422) Differential between book value and post-revaluation market value of revalued land at end of term
(2,677)

(Nonconsolidated statement of income - related) Millions of yen December 31, 2002 December 31, 20031. The proportion of selling expenses is about 39 % and the
general and administrative expense is about 61 %. Primary items and amounts included under selling, general and administrative expenses are as follows:
1. There is no selling expense for the year. Primary items and amounts included under general and administrative expenses are as follows:
(1)Advertising expenses 5,518 (1)Directors' salaries 139 (2)Sales promotion expenses 2,051 (2)Provision for bonuses 0 (3)Salaries 2,664 (3)Provision for directors' retirement
allowances 18
(4)Bonuses 1,033 (4)Expenses for subcontracted operations 1,063 (5)Provision for bonuses 1 (5)Securities listing maintenance
expenses 323
(6)Provision for directors' retirement allowances
119 (6)Cost of preferential treatment to the shareholders
598
(7)Depreciation expenses 835 (8)Subcontracting expenses 662 (9)Provision for doubtful accounts 4
2. Breakdown of losses from removal of fixed assets
2. Breakdown of losses from removal of fixed assets
Buildings 313 Buildings 207 Structures 9 Structures 5 Machinery and equipment 3 Machinery and equipment - Tools, appliances and fixtures 51 Tools, appliances and fixtures 0 Software 53 Software 329 431 542
3. “Others” as shown under extraordinary losses consists of cancellation fees on lease contracts for kitchen equipment made obsolete by the introduction of the “Made for You” order-made cooking system.
3. -
4. R&D expenses in selling, general and administrative expenses 4. - 5. 5. Transactions with affiliated companies include the following. - Sales to affiliates 52,930
6. 6. Losses from the liquidation of affiliates
- This loss arose due to the withdrawal from the business owned and managed by Pret A Manger (Japan), Inc. Breakdown is as follows:
Capital investment in PAMJ 50 Bad debt losses due to loans and
advances made by PAMJ 2,300
Estimated losses due to withdrawal of other operations
800
3,150Breakdown of gain on sales of fixed assets are as follows: Land 8
Vehicles 8
7. 7.
17
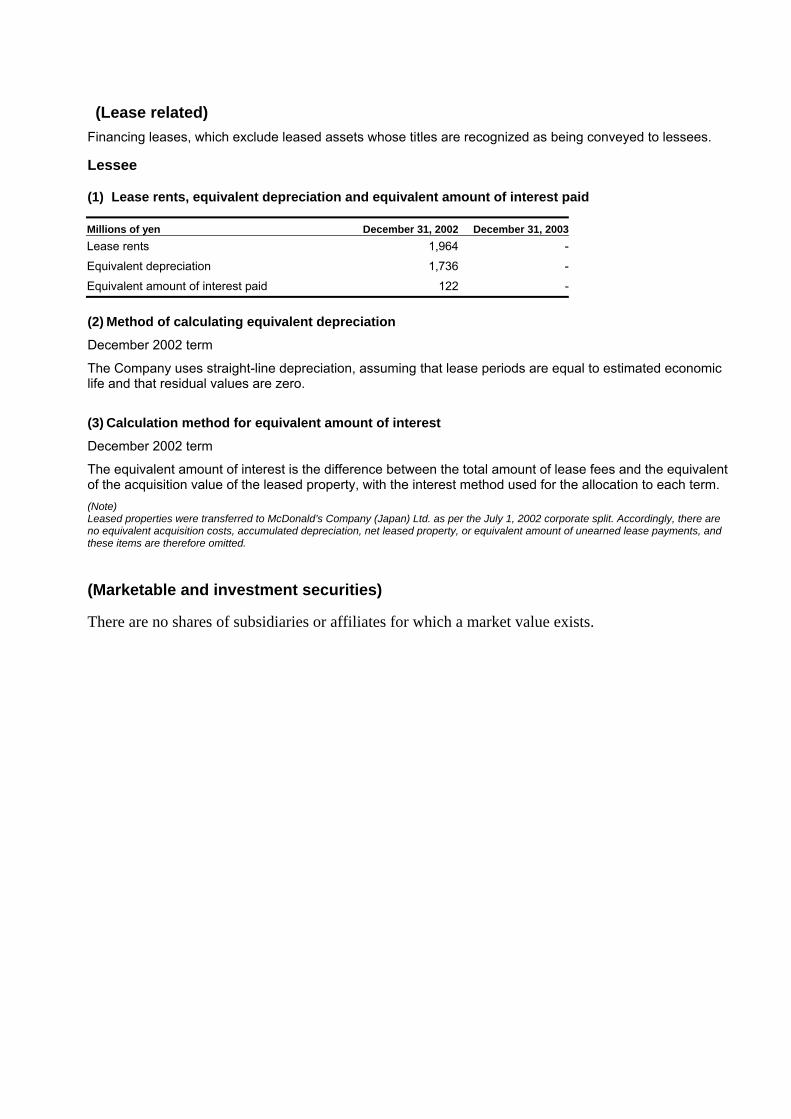
(Lease related) Financing leases, which exclude leased assets whose titles are recognized as being conveyed to lessees.
Lessee
(1) Lease rents, equivalent depreciation and equivalent amount of interest paid
Millions of yen December 31, 2002 December 31, 2003 Lease rents 1,964 -
Equivalent depreciation 1,736 -
Equivalent amount of interest paid 122 -
(2) Method of calculating equivalent depreciation
December 2002 term
The Company uses straight-line depreciation, assuming that lease periods are equal to estimated economic life and that residual values are zero.
(3) Calculation method for equivalent amount of interest
December 2002 term
The equivalent amount of interest is the difference between the total amount of lease fees and the equivalent of the acquisition value of the leased property, with the interest method used for the allocation to each term. (Note) Leased properties were transferred to McDonald’s Company (Japan) Ltd. as per the July 1, 2002 corporate split. Accordingly, there are no equivalent acquisition costs, accumulated depreciation, net leased property, or equivalent amount of unearned lease payments, and these items are therefore omitted.
(Marketable and investment securities)
There are no shares of subsidiaries or affiliates for which a market value exists.

(Deferred taxes) 1. Breakdown of primary causes of deferred tax assets and liabilities
Millions of yen December 31, 2002 December 31, 2003Deferred tax assets
Excess over limit of allowance for bonuses 0 0
Additional prepaid Gift Card receipts 458 516
Amount denied as special retirement allowances for directors
1,037 10
Excess over limit of allowance for doubtful accounts 1,064 777
Allowance for losses on restaurant closings 1,677 193
Allowance for losses the liquidation of affiliates - 1,324
Depreciation expenses 169 137
Loss carried forward - 2,697
Others 191 416
4,598 6,075
Deferred tax liabilities
Uncollected enterprise taxes refunds (243) -
Unrealized gains or losses on other securities (2,317) (3,099)
McCard miscellaneous income (610) (669)
Others (29) (95)
(3,200) (3,865)
Total deferred tax assets – net 1,397 2,210
2. Causes of differences between legal effective tax rates and actual corporate tax rate after the application of tax-effect accounting
December 31, 2002 December 31, 2003 Since the Company recorded loss before taxes and other adjustment in this fiscal year, the detailed information is not stated.
Since the Company recorded loss before taxes and other adjustment in this fiscal year, the detailed information is not stated.
Legal effective tax rate 42.05% Legal effective tax rate 42.05%
3. In line with the promulgation on March 31, 2003 of amendments to Japanese regional tax legislation (2003 Law No. 9), the tax rate applied to calculations of deferred tax assets and liabilities as of the end of the fiscal year under review (limited to those items with projected dissolution dates on or after January 1, 2004) was changed to 40.69%, from a rate of 42.05% used in the previous fiscal year. This change resulted in a decrease in deferred tax assets equivalent to 89 million yen, as well as increases in corporate taxes and other adjustments applied to the fiscal year under review, valuation differences from other marketable securities, and revaluation differences, of 128 million yen, 103 million yen, and 64 million yen, respectively.

(Per share-related financial information) Yen December 31, 2002 December 31, 2003Shareholders' equity per share 1,141.92 Shareholders' equity per share 1,103.95
Net loss per share 10.34 Net loss per share 17.44 No amounts for fully diluted earnings per share have been shown because the Company had neither bonds with warrants nor convertible bonds outstanding in the year to December 2002.
No amounts for fully diluted earnings per share have been shown because the Company had neither bonds with warrants nor convertible bonds outstanding in the year to December 2003. The accounting standard governing net income per share (Corporate Accounting Standard No. 2) and the related guidelines for the application of this accounting standard (Corporate Accounting Standard Application Guidelines No. 4) are adopted full by the Company from this fiscal year. There is no impact on per share-related information even the new standards were adopted fully in last fiscal year.
(Note) Net loss per share is calculated based on the following information.
Millions of yen December 31, 2002 December 31, 2003 Net loss - 2,318
Income not available to common stockholders - -
Income available to common stockholders - 2,318
Average number of common shares outstanding (thousands shares) - 132,959
(Important matters occurring subsequent to report period) Not applicable

8. Changes in the board of directors Newly-appointed Directors (pending shareholder approval)
Eikoh Harada (current Vice Chairman and Representative Director, Chief Executive Officer, McDonald’s Company (Japan), Ltd.)
Peter B. Beresford (current Executive Vice President and Representative Director, McDonald’s Company (Japan), Ltd.)
James A. Skinner (current Director, McDonald’s Company (Japan), Ltd.) Among the directors James A. Skinner is an external director as per Article 188-2-7-2 of the Commercial Code.
Newly-appointed Auditors (pending shareholder approval) Masao Asuke (current Full-time Auditor, McDonald’s Company
(Japan), Ltd.) Yoshio Mataichi (current Auditor) David M. Pojman (current Auditor) Kenji Yoshino (current Auditor)