financial results - euronet worldwide, inc
TRANSCRIPT

FINANCIAL RESULTS FIRST QUARTER 2019
PRESENTERS:
MICHAEL J. BROWN, CHAIRMAN, CEO & PRESIDENT
RICK L. WELLER, EVP & CFO
JEFFREY B. NEWMAN, EVP & GENERAL COUNSEL
KEVIN J. CAPONECCHI, EVP & CEO EPAY, EFT ASIA PACIFIC & SOFTWARE

Forward Looking StatementsStatements contained in this presentation that concern Euronet’s or its management’s intentions, expectations, or predictions of future performance, are forward-looking statements. Euronet’s actual results may vary materially from those anticipated in such forward-looking statements, as a result of a number of factors, including: conditions in world financial markets and general economic conditions, including the effects in Europe of the U.K.'s departure from the E.U. and economic conditions in specific countries and regions; the effects of demonetization in India; technological developments affecting the market for our products and services; our ability to successfully introduce new products and services; foreign currency exchange rate fluctuations; the effects of any breach of our computer systems or those of our customers or vendors, including our financial processing networks or those of other third parties; interruptions in any of our systems or those of our vendors or other third parties; our ability to renew existing contracts at profitable rates; changes in fees payable for transactions performed for cards bearing international logos or over switching networks such as card transactions on ATMs; Visa's announced rule change to allow our ATMs to provide DCC beginning mid-April 2019; our ability to comply with increasingly stringent regulatory requirements, including anti-money laundering, anti-terrorism, anti-bribery, consumer and data protection and GDPR or PSD2 requirements; changes in laws and regulations affecting our business, including tax and immigration laws and any laws regulating payments, including DCC transactions, changes in our relationships with, or in fees charged by, our business partners; competition; the outcome of claims and other loss contingencies affecting Euronet. These risks and other risks are described in the Company’s filings with the Securities and Exchange Commission, including our Annual Report on Form 10-K, Quarterly Reports on Form 10-Q and Current Reports on Form 8-K. Copies of these filings may be obtained via the SEC’s Edgar website or by contacting the Company or the SEC. Any forward-looking statements made in this presentation speak only as of the date of this presentation. Except as may be required by law, Euronet does not intend to update these forward-looking statements and undertakes no duty to any person to provide any such update under any circumstances. The Company regularly posts important information to the investor relations section of its website.
2

Defined Terms
Unless specifically noted otherwise within this presentation, the following terms are hereby defined as follows:
Constant currency measures are computed as if foreign currency exchange rates did not change from the prior period. This information is provided to illustrate the impact of changes in foreign currency exchange rates on the Company's results when compared to the prior period.
Adjusted EBITDA is defined as net income excluding interest, income tax expense, depreciation, amortization, share-based compensation expenses, and other non-operating or non-recurring items that are considered expenses or income under U.S. GAAP. Adjusted EBITDA represents a performance measure and is not intended to represent a liquidity measure.
Adjusted earnings per share (Adjusted EPS) is defined as diluted U.S. GAAP earnings per share excluding, to the extent incurred in the period, the tax-effected impacts of: a) foreign currency exchange gains or losses, b) goodwill or intangible asset impairment charges, c) gains or losses from the early retirement of debt, d) share-based compensation, e) acquired intangible asset amortization, f) non-cash interest expense, g) non-cash income tax expense, and h) other non-operating or non-recurring items. Adjusted earnings per share represents a performance measure and is not intended to represent a liquidity measure.
The reconciliation of non-GAAP items is included in the attached supplemental data.
The Company does not provide a reconciliation of its forward-looking non-GAAP measures to GAAP due to the inherent difficulty in forecasting and quantifying certain amounts that are necessary for GAAP and the related GAAP to non-GAAP reconciliation, including adjustments that could be made for currency exchange rate fluctuations and other charges reflected in the Company's reconciliation of historic numbers, the amount of which, based on historical experience, could be significant.
3

4
FINANCIAL HIGHLIGHTSFIRST QUARTER 2019

Q1 2019 Financial ReportQuarterly Financial Highlights
• Revenue - $577.5 million
• 5% increase from $550.5 million for Q1 2018
• 11% increase on a constant currency basis
• Operating income - $56.1 million
• 23% increase from $45.5 million for Q1 2018
• 31% increase on a constant currency basis
• Adjusted EBITDA - $87.2 million
• 15% increase from $75.5 million for Q1 2018
• 23% increase on a constant currency basis
• Adjusted EPS - $0.85
• 16% increase from $0.73 for Q1 2018
5

Q1 2019 Financial ReportThree Year Transaction Trend
6
• EFT transactions grew 11%• Growth in Europe and India
• epay transactions grew 31%• With growth across Europe and significant
contributions from India which include a large volume of low-margin transactions
• Money Transfer transactions grew 10%• Increases from growth across most sectors

Q1 2019 Business Segment ResultsSame Quarter Prior Year Comparison
7
USD (in millions)
Q1 2018 Q1 2019 Q1 2018 Q1 2019 Q1 2018 Q1 2019
EFT Processing 135.7$ 145.7$ 11.5$ 16.8$ 27.7$ 33.4$
% Change 7% 46% 21%
epay 176.8 176.1 16.9 18.0 18.8 19.8
% Change 0% 7% 5%
Money Transfer 238.9 256.6 26.5 30.7 34.4 38.8
% Change 7% 16% 13%
Subtotal 551.4 578.4 54.9 65.5 80.9 92.0
% Change 5% 19% 14%
Corporate, Eliminations
& Other(0.9) (0.9) (9.4) (9.4) (5.4) (4.8)
Consolidated Total 550.5$ 577.5$ 45.5$ 56.1$ 75.5$ 87.2$
% Change 5% 23% 15%
Operating Income
(Expense)
Adjusted
EBITDA Revenue

Q1 2019 Business Segment ResultsSame Quarter Prior Year Comparison – Constant Currency*
8
USD (in millions)Revenue
Operating Income
(Expense)
Adjusted
EBITDA
Q1 2018 Q1 2019* Q1 2018 Q1 2019* Q1 2018 Q1 2019*
EFT Processing 135.7$ 157.4$ 11.5$ 17.7$ 27.7$ 35.8$
% Change 16% 54% 29%
epay 176.8 187.9 16.9 19.4 18.8 21.3
% Change 6% 15% 13%
Money Transfer 238.9 265.8 26.5 32.2 34.4 40.6
% Change 11% 22% 18%
Subtotal 551.4 611.1 54.9 69.3 80.9 97.7
% Change 11% 26% 21%
Corporate, Eliminations
& Other(0.9) (0.9) (9.4) (9.7) (5.4) (4.9)
Consolidated Total 550.5$ 610.2$ 45.5$ 59.6$ 75.5$ 92.8$
% Change 11% 31% 23%

Q1 2019 Financial ReportBalance Sheet Overview
9
USD (in millions) 12/31/2018 3/31/2019
Unrestricted Cash 1,054.4$ 1,216.3$
Total Assets 3,321.2 3,814.1
Total Debt 641.5 786.9
Total Debt to Trailing Twelve Month
Adjusted EBITDA Multiple 1.3x 1.6x
Net Debt to Trailing Twelve Month
Adjusted EBITDA Multiple NM NM
*NM - Not Meaningful

10
BUSINESS OVERVIEWFIRST QUARTER 2019

Assets Leveraging the Global Payments Infrastructure
11
Digital Integrated Payments Cloud
Common Digital Characteristics Across the Three Business Segments:Money Transfer Payout QR and Bar code payments Digital Money Transfer KYCCardless Transactions Digital Codes Biometric payments Open APIs
Common Technology Supporting the Three Business Segments
Physical Assets Geographic Assets Digital Assets
44,554 ATMs
1.0 million POS
Terminals
377,000 MT Locations
Network Reaches 165
Countries
77 millionApp
Downloads
265 millionUnique Digital
Users
SAAS Assets
134,000 SAAS ATMs
Digital Connections to Leading
Global Brands
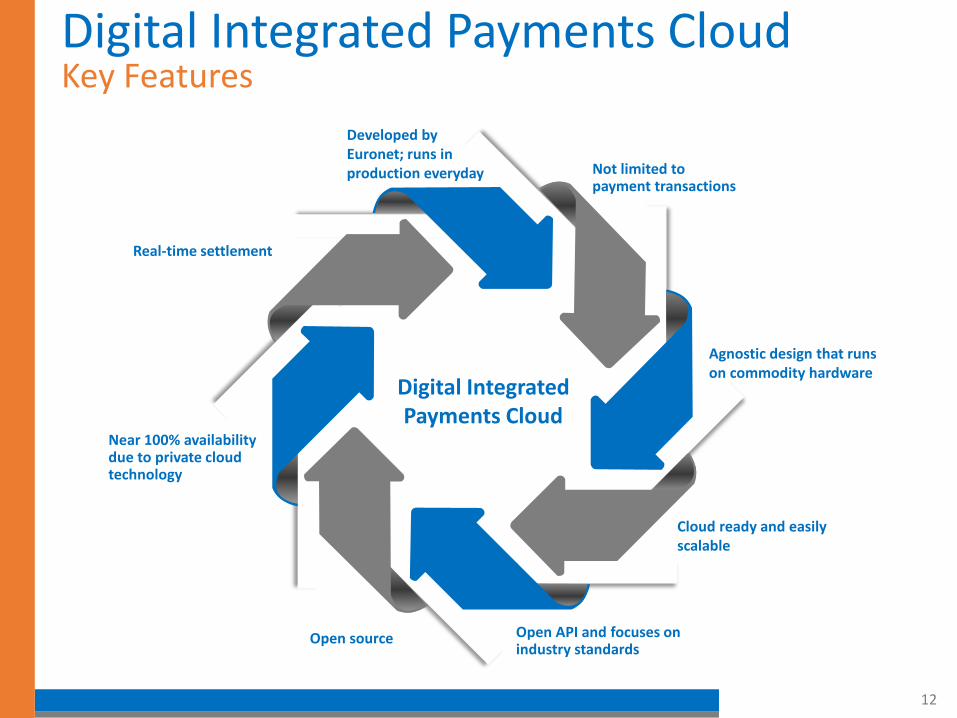
Digital Integrated Payments CloudKey Features
12
Real-time settlement
Near 100% availability due to private cloud technology
Developed by Euronet; runs in production everyday
Agnostic design that runs on commodity hardware
Not limited to payment transactions
Cloud ready and easily scalable
Open API and focuses on industry standards
Open source
Digital Integrated Payments Cloud

13
EFT SEGMENTFIRST QUARTER 2019
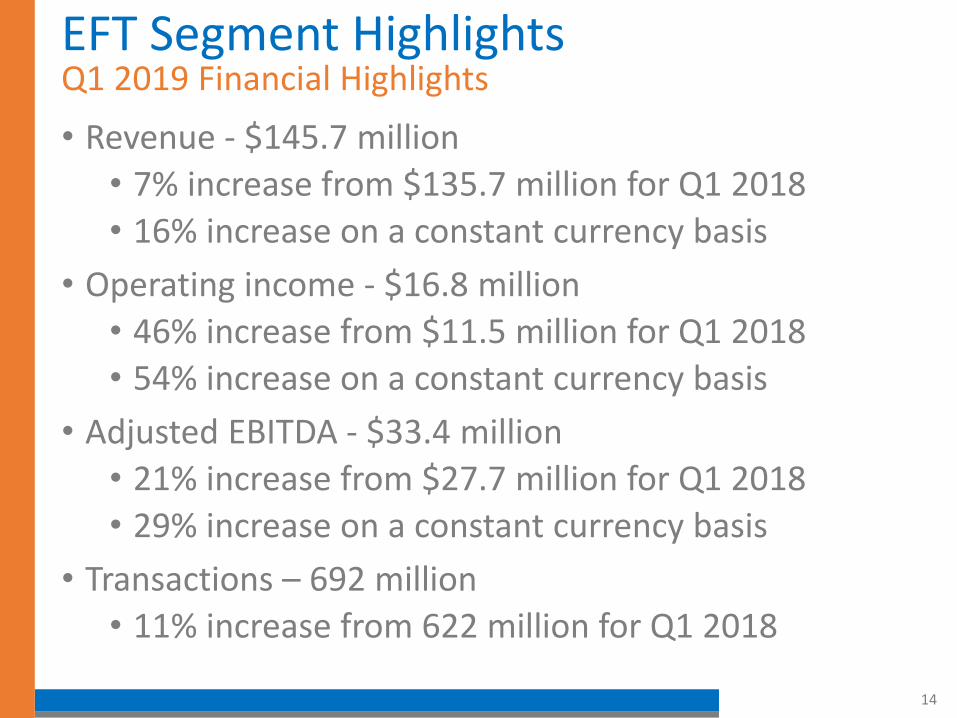
EFT Segment HighlightsQ1 2019 Financial Highlights
• Revenue - $145.7 million
• 7% increase from $135.7 million for Q1 2018
• 16% increase on a constant currency basis
• Operating income - $16.8 million
• 46% increase from $11.5 million for Q1 2018
• 54% increase on a constant currency basis
• Adjusted EBITDA - $33.4 million
• 21% increase from $27.7 million for Q1 2018
• 29% increase on a constant currency basis
• Transactions – 692 million
• 11% increase from 622 million for Q1 2018
14

EFT Segment HighlightsQ1 2019 Growth Drivers
• New Countries Entered:• Launched independent ATM network in Norway
• Launched:• ATM driving agreement with Catholic Syrian Bank in India• ATM driving and debit card management agreement with Faysal Bank in
Pakistan
• Signed:• Network participation agreement with ING Bank in Spain• ATM Outsourcing agreement with more SKOK credit unions in Poland
• Renewals/extensions:• ATM, POS and Card Outsourcing renewal with Leumi Bank in Romania
and Komercijalna Bank in Serbia• ATM network participation renewal with Blom Bank in Romania• ATM and ADT network participation renewal with Bank Pocztowy in
Poland• ATM and POS driving and debit card management agreement with
Muslim Commercial Bank in Pakistan
15
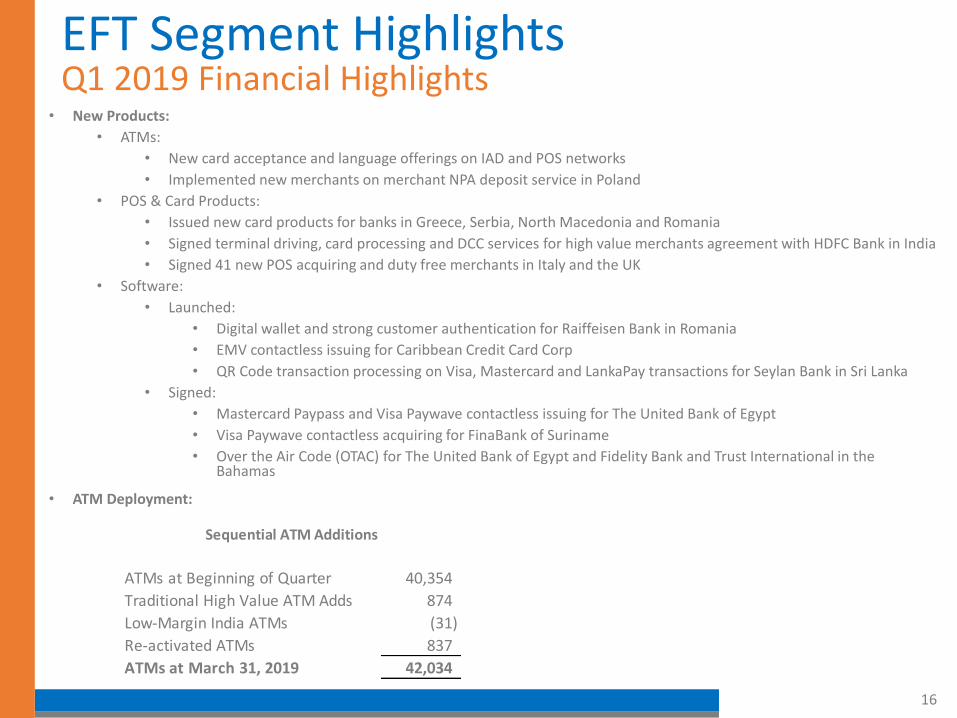
EFT Segment HighlightsQ1 2019 Financial Highlights
• New Products:
• ATMs:
• New card acceptance and language offerings on IAD and POS networks
• Implemented new merchants on merchant NPA deposit service in Poland
• POS & Card Products:
• Issued new card products for banks in Greece, Serbia, North Macedonia and Romania
• Signed terminal driving, card processing and DCC services for high value merchants agreement with HDFC Bank in India
• Signed 41 new POS acquiring and duty free merchants in Italy and the UK
• Software:
• Launched:
• Digital wallet and strong customer authentication for Raiffeisen Bank in Romania
• EMV contactless issuing for Caribbean Credit Card Corp
• QR Code transaction processing on Visa, Mastercard and LankaPay transactions for Seylan Bank in Sri Lanka
• Signed:
• Mastercard Paypass and Visa Paywave contactless issuing for The United Bank of Egypt
• Visa Paywave contactless acquiring for FinaBank of Suriname
• Over the Air Code (OTAC) for The United Bank of Egypt and Fidelity Bank and Trust International in the Bahamas
• ATM Deployment:
16
ATMs at Beginning of Quarter 40,354
Traditional High Value ATM Adds 874
Low-Margin India ATMs (31)
Re-activated ATMs 837
ATMs at March 31, 2019 42,034
Sequential ATM Additions

17
EPAY SEGMENTFIRST QUARTER 2019

epay Segment HighlightsQ1 2019 Financial Highlights
• Revenue - $176.1 million
• Immaterial change from $176.8 million for Q1 2018
• 6% increase on a constant currency basis
• Operating income - $18.0 million
• 7% increase from $16.9 million for Q1 2018
• 15% increase on a constant currency basis
• Adjusted EBITDA - $19.8 million
• 5% increase from $18.8 million for Q1 2018
• 13% increase on a constant currency basis
• Transactions – 338 million
• 31% increase from 258 million for Q1 2018
18

epay Segment HighlightsQ1 2019 Growth Drivers
• Launched:• Germany Several new products through REWE including Adidas, Ikea, About You, Douglas, and
others
• Germany Amazon and Amazon Cash through Lekkerland
• Austria Digital media distribution through Pagro and Libro, office supply retailers
• Slovakia Sony and Blizzard through Billa, a large grocery retailer
• Russia Launched Xbox and EA to PlayKey, an online gaming retailer
• Russia Launched iTunes, Xbox/Office, Eset and EA into electronics chain, TechnoPark
• Italy Nintendo and Microsoft/antivirus bundles at Euronics, a large electronics retailer
• Italy Gaming, software, antivirus, PayTV and other content to a new electronics retailer, Trony Bellanti
• Spain Launched HBO in Game, an electronics retailer
• Spain/Portugal Expanded H&M distribution to these two countries
• Portugal Expanded Sony into SIBS payment switch with connections to 12k ATMs
• Australia Launched Alipay at Tiffany & Co., GM Cabs, and in other tourism channels
• Norway Microsoft Xbox distribution in COOP, a large grocery retailer
• Saudi Arabia Launched Google Play and McAfee using PIN on receipt
• UAE Launched McAfee using PIN on receipt products
19

epay Segment HighlightsQ1 2019 Growth Drivers
20
• Signed:• Singapore Microsoft Xbox and Office 365 distribution rights
• UK Prom Pay Solutions to validate 3rd party coupons
• Italy SIA to expand distribution for all products
• Italy Product expansion through new retailers SMA Franchising, CRAI Sardegna, and Arimondo
• Portugal/Spain Digital product expansion through new retailers Miquel Alimentacio and Meo Stores
• UAE Agreement to distribute Google Play via PIN on receipt
• Australia Renewal for distribution of Kaspersky software
• Australia Renewal for distribution of Symantec software
• Croatia Digital media distribution at Muller, a large pharmacy retailer

21
MONEY TRANSFER SEGMENTFIRST QUARTER 2019

Money Transfer Segment HighlightsQ1 2019 Financial Highlights
• Revenue - $256.6 million
• 7% increase from $238.9 million for Q1 2018
• 11% increase on a constant currency basis
• Operating income - $30.7 million
• 16% increase from $26.5 million for Q1 2018
• 22% increase on a constant currency basis
• Adjusted EBITDA - $38.8 million
• 13% increase from $34.4 million for Q1 2018
• 18% increase on a constant currency basis
• Transactions – 26.6 million
• 10% increase from 24.3 million for Q1 2018
22

Money Transfer Segment HighlightsQ1 2019 Growth Drivers• Growth in Send & Payout Network, Correspondents & Locations:
• Our network reaches: • 155 countries• 377,000 total network locations, an 8% increase vs. 1Q 2018
• Correspondent Expansion:• Launched 15 new correspondents in 13 countries• Signed 14 new correspondent agreements across 13 countries
• Signed with Inpay, which provides access to the Bulgarian Post network
• Other Business:• Signed an agreement with Walmart to allow domestic payout of Ria
transactions in Walmart stores across the United States• Enabled Remitly customers to pick up cash at over 73,000 of Ria’s locations
across 20 countries• Partnered with Turbus, the primary transportation service in Chile, to offer
send and payout services in its network of more than 400 offices across Chile• Signed an agreement to join Ripple’s RippleNet network to power global
payments using blockchain technology
23

Summary & Outlook• First quarter Adjusted EPS of $0.85 – a 16% year-over-year
increase
• EFT delivered exceptional double-digit growth rates while continuing to invest in ATM network expansion
• epay’s double-digit earnings growth resulted from continued digital media growth and network expansion
• Money transfer continued to deliver strong earnings growth from expansion in both the physical and digital channels
• Successfully issued a new $525 million, 0.75% interest convertible bond
• The generation of free cash contributes to our strong balance sheet
• We expect second quarter Adjusted EPS to be approximately $1.69, assuming consistent foreign exchange rates and share price
24

25
APPENDIXFIRST QUARTER 2019

EFT Addressable Market
26
The number of ATMs installed globally could more than double before reaching full saturation. Euronet currently only owns and operates 43,000 of those machines
leaving plenty of runway for additional ATM deployments.
5.4
3.1
4.2
Euronet Addressable ATM Market(in millions of ATMs)
ATMs to be installed inEuronet InterestedMarkets
Current ATMs in EuronetInterested Markets
ATMs in Markets whereEuronet is not Interested
$2.0
$9.0
Outsourcing Revenue Opportunity(in billions)
Installed ATMs in US
ATMs Currently Installedoutside US
$30
$55
$40
Global Revenue Addressable Market(in Billions)
Revenue from CurrentlyInstalled ATMs in EuronetInterested Markets
Revenue from ATMs to beInstalled in EuronetInterested Markets
Revenue in markets whereEuronet is not interested
35%
65%
Global ATM Market = ~ 13 million machines
ATMs Currently installedGlobally
ATMs to be installed toreach U.S. penetrationlevels
Source: World Bank and Company Estimates

epay Addressable Market
27Source: PWC Global Entertainment & Media Outlook 2018 – 2022, Tech Crunch Consumer Spend on Apps and Company Estimates
This is a $1.0 trillion market which is undergoing transformation and epay’s superior technology capabilities position them to capture more and more
market share.
Global Spend = ~1.0 trillion
Music/Radio/Podcasts
Software
Gaming
TV/Home Video/Streaming
Apps
Euronet Markets
Music/Radio/Podcasts
Software
Gaming
TV/Home Video/Streaming
Apps

Money Transfer Addressable Market
28Source: Juniper Research Digital Money Transfer and Remittances 2018-2022, World Bank and Company Estimates
Two-thirds of the global remittance market remains unaddressed by key players and Euronet is well-positioned to capture those money transfers
93%
7%
Digital Initiated Transactions as % of Total Remittance Market
Non-digital
Digital
12%
6.4%
5.2%
4.8%
5.0%66.6%
Global Money Transfer Market Breakdown
Western Union
UAE Exchange
MoneyGram
Ria
Other digital-only players
Others

29
SUPPLEMENTAL DATAFIRST QUARTER 2019

Supplemental DataIn addition to the results presented in accordance with U.S. GAAP, the Company presents non-GAAP financial measures, such as constant currency, adjusted operating income, adjusted EBITDA and adjusted earnings per share. These measures should be used in addition to, and not a substitute for, revenues, net income, operating income and earnings per share computed in accordance with U.S. GAAP. We believe that these non-GAAP measures provide useful information to investors regarding the Company's performance and overall results of operations. These non-GAAP measures are also an integral part of the Company's internal reporting and performance assessment for executives and senior management. The non-GAAP measures used by the Company may not be comparable to similarly titled non-GAAP measures used by other companies. The attached schedules provide a full reconciliation of these non-GAAP financial measures to their most directly comparable U.S. GAAP financial measure.
30
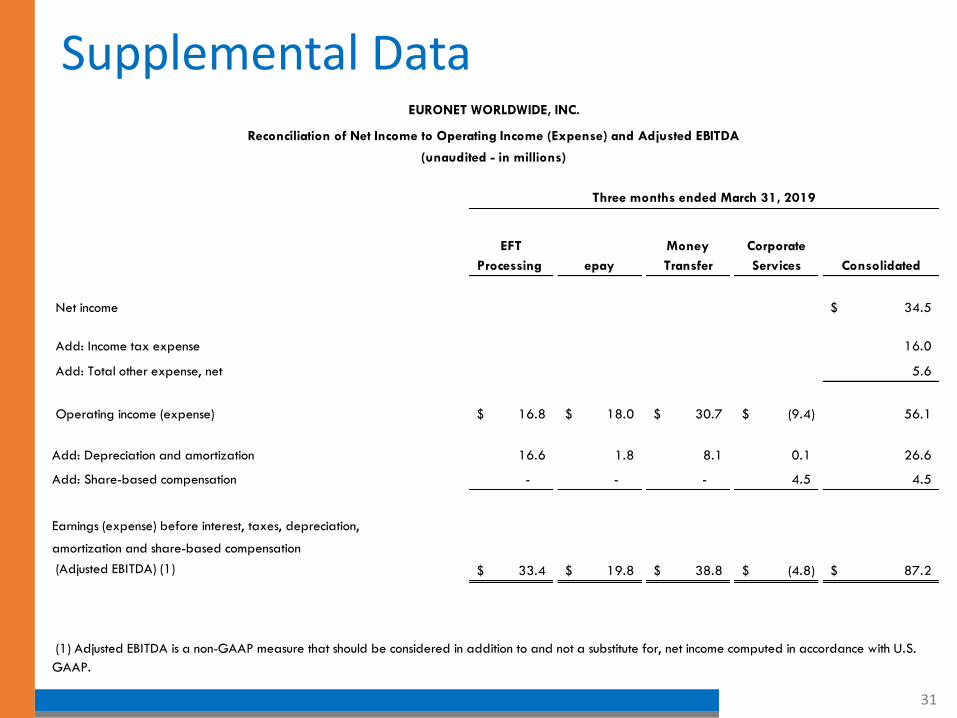
Supplemental Data
31
EFT Money Corporate
Processing epay Transfer Services Consolidated
Net income 34.5$
Add: Income tax expense 16.0
Add: Total other expense, net 5.6
Operating income (expense) 16.8$ 18.0$ 30.7$ (9.4)$ 56.1
Add: Depreciation and amortization 16.6 1.8 8.1 0.1 26.6
Add: Share-based compensation - - - 4.5 4.5
Earnings (expense) before interest, taxes, depreciation,
amortization and share-based compensation
(Adjusted EBITDA) (1) 33.4$ 19.8$ 38.8$ (4.8)$ 87.2$
EURONET WORLDWIDE, INC.
Reconciliation of Net Income to Operating Income (Expense) and Adjusted EBITDA
(unaudited - in millions)
(1) Adjusted EBITDA is a non-GAAP measure that should be considered in addition to and not a substitute for, net income computed in accordance with U.S.
GAAP.
Three months ended March 31, 2019

Supplemental Data
32
EFT Money Corporate
Processing epay Transfer Services Consolidated
Net income 26.3$
Add: Income tax expense 13.7
Add: Total other expense, net 5.5
Operating income (expense) 11.5$ 16.9$ 26.5$ (9.4)$ 45.5$
Add: Depreciation and amortization 16.2 1.9 7.9 - 26.0
Add: Share-based compensation - - - 4.0 4.0
Earnings (expense) before interest, taxes, depreciation,
amortization, proposed transaction expenses
and share-based compensation
(Adjusted EBITDA) (1) 27.7$ 18.8$ 34.4$ (5.4)$ 75.5$
(1) Adjusted EBITDA is a non-GAAP measure that should be considered in addition to and not a substitute for, net income computed in accordance with U.S.
GAAP.
(unaudited - in millions)
Three months ended March 31, 2018
EURONET WORLDWIDE, INC.
Reconciliation of Net Income to Operating Income (Expense) and Adjusted EBITDA

Supplemental Data
33
Three months ended ended March 31, 2019
EFT Money Corporate
Processing epay Transfer Services Consolidated
Revenue 145.7$ 176.1$ 256.6$ (0.9)$ 577.5$
Add: Estimated foreign currency impact * 11.7 11.8 9.2 - 32.7
Revenue - Constant Currency 157.4$ 187.9$ 265.8$ (0.9)$ 610.2$
Operating income (expense) 16.8$ 18.0$ 30.7$ (9.4)$ 56.1$
Add: Estimated foreign currency impact * 0.9 1.4 1.5 (0.3) 3.5
Operating income (expense) - Constant Currency 17.7$ 19.4$ 32.2$ (9.7)$ 59.6$
Adjusted EBITDA (reconciled on previous schedule) 33.4$ 19.8$ 38.8$ (4.8)$ 87.2$
Add: Estimated foreign currency impact * 2.4 1.5 1.8 (0.1) 5.6
Adjusted EBITDA - Constant Currency 35.8$ 21.3$ 40.6$ (4.9)$ 92.8$
EURONET WORLDWIDE, INC.
Reconciliation of Revenue, Operating Income (Expense) and Adjusted EBITDA to Constant Currency Amounts by Segment
(unaudited - in millions)

Supplemental Data
34
2019 2018
Net income attributable to Euronet Worldwide, Inc. 34.5$ 26.4$
Foreign currency exchange gain (3.2) (1.9)
Intangible asset amortization 5.2 5.9
Share-based compensation 4.5 4.0
Non-cash interest accretion 3.4 2.8
Income tax effect of above adjustments (0.2) (0.1)
Loss on early retirement of debt 0.9 -
Non-cash GAAP tax expense 2.3 2.5
Adjusted earnings (1) 47.4$ 39.6$
Adjusted earnings per share - diluted (1) 0.85$ 0.73$
Diluted weighted average shares outstanding (GAAP) 55,576,867 53,953,246
Effect of unrecognized share-based compensation on diluted shares outstanding 261,765 280,727
Adjusted diluted weighted average shares outstanding 55,838,632 54,233,973
(1) Adjusted earnings and adjusted earnings per share are non-GAAP measures that should be considered in addition to,
and not as a substitute for, net income and earnings per share computed in accordance with U.S. GAAP.
To see how these adjustments correlate to the income statement please see the first quarter 2019 earnings press release.
EURONET WORLDWIDE, INC.
Reconciliation of Adjusted Earnings per Share
(unaudited - in millions, except share and per share data)
Three Months Ended
March 31,