first quarter 2021 financial results - euronet worldwide, inc
TRANSCRIPT

28 April 2021 | Slide 1
First Quarter 2021 Financial Results PRESENTERS:
MICHAEL J. BROWN, CHAIRMAN & CEO
RICK L. WELLER, EVP AND CFO
KEVIN J. CAPONECCHI, EVP & CEO EPAY, EFT ASIA PACIFIC & SOFTWARE
SCOTT CLAASSEN, GENERAL COUNSEL

28 April 2021 | Slide 2
Statements contained in this presentation that concern Euronet's or its management's intentions, expectations, orpredictions of future performance, are forward-looking statements. Euronet's actual results may vary materiallyfrom those anticipated in such forward-looking statements as a result of a number of factors, including: changesin world financial markets and general economic conditions, including impacts from COVID-19; the effects inEurope of the U.K.'s departure from the E.U. and economic conditions in specific countries and regions;technological developments affecting the market for our products and services; our ability to successfullyintroduce new products and services; foreign currency exchange rate fluctuations; the effects of any breach of ourcomputer systems or those of our customers or vendors, including our financial processing networks or those ofother third parties; interruptions in any of our systems or those of our vendors or other third parties; our ability torenew existing contracts at profitable rates; changes in fees payable for transactions performed for cards bearinginternational logos or over switching networks such as card transactions on ATMs; our ability to comply withincreasingly stringent regulatory requirements, including anti-money laundering, anti-terrorism, anti-bribery,consumer and data protection and the European Union's General Data Privacy Regulation and Revised PaymentService Directive requirements; changes in laws and regulations affecting our business, including tax andimmigration laws and any laws regulating payments, including dynamic currency conversion transactions;changes in our relationships with, or in fees charged by, our business partners; competition; the outcome ofclaims and other loss contingencies affecting Euronet; the cost of borrowing, availability of credit and terms ofand compliance with debt covenants; and renewal of sources of funding as they expire and the availability ofreplacement funding. These risks and other risks are described in the Company's filings with the Securities andExchange Commission, including our Annual Report on Form 10-K, Quarterly Reports on Form 10-Q and CurrentReports on Form 8-K. Copies of these filings may be obtained via the SEC's Edgar website or by contacting theCompany. Any forward-looking statements made in this presentation speak only as of the date of this release.Except as may be required by law, Euronet does not intend to update these forward-looking statements andundertakes no duty to any person to provide any such update under any circumstances. The Company regularlyposts important information to the investor relations section of its website.
Forward Looking Statements

28 April 2021 | Slide 3
Business UpdateMICHAEL J. BROWN, CHAIRMAN & CEO

28 April 2021 | Slide 4
Unless specifically noted otherwise within this presentation, the following terms are hereby defined as follows:
Constant currency measures are computed as if foreign currency exchange rates did not change from the priorperiod. This information is provided to illustrate the impact of changes in foreign currency exchange rates onthe Company's results when compared to the prior period.
Adjusted EBITDA is defined as net (loss) income excluding, to the extent incurred in the period, interest, incometax expense, depreciation, amortization, share-based compensation expenses, and other non-operating or non-recurring items that are considered expenses or income under U.S. GAAP. Adjusted EBITDA represents aperformance measure and is not intended to represent a liquidity measure.
Adjusted earnings per share (Adjusted EPS) is defined as diluted U.S. GAAP earnings (loss) per share excluding,to the extent incurred in the period, the tax-effected impacts of: a) foreign currency exchange gains or losses b)share-based compensation, c) acquired intangible asset amortization, d) non-cash interest expense, e) non-cashincome tax expense, and f) other non-operating or non-recurring items. Adjusted earnings per share representsa performance measure and is not intended to represent a liquidity measure.
The reconciliation of non-GAAP items is included in the attached supplemental data.
The Company does not provide a reconciliation of its forward-looking non-GAAP measures to GAAP due to theinherent difficulty in forecasting and quantifying certain amounts that are necessary for GAAP and the relatedGAAP to non-GAAP reconciliation, including adjustments that could be made for currency exchange ratefluctuations and other charges reflected in the Company's reconciliation of historic numbers, the amount ofwhich, based on historical experience, could be significant.
Defined Terms

28 April 2021 | Slide 5
‣ Momentum continued into 2021:
‣ Strong balance sheet continues to support digital expansion and enabled the pending acquisition of Piraeus Bank’s Merchant Acquiring Business
‣ Two of the three segments reported exceptional double-digit earnings growth
‣ Business Highlights:
‣ EFT transactions began to trend towards positive year-over-year growth at the end of the first quarter as we began to lap the initial COVID lockdowns
‣ epay posted its third consecutive quarter of double-digit adjusted EBITDA growth as a result of continued strength in sales of digital media content and mobile top-up in both physical and digital channels
‣ Money transfer also posted its third consecutive quarter of double-digit adjusted EBITDA growth as a result of continued network expansion and triple-digit growth in digital transactions
Current State of Business

28 April 2021 | Slide 6
‣ European travel indicators show actual travel is ahead of January forecasted levels through March
‣ According to the UN World Tourism Organization, there was a spike in actual air reservations and
hotel bookings in February and March 2021
‣ According to the European Travel Commission, 56% of respondents plan to take a trip by the end
of August 2021 – with about half of the respondents planning to travel outside of their home
country
EFT European Travel Indicators

28 April 2021 | Slide 7
‣ Expanded Distribution:
‣ Agreed to purchase Piraeus Bank Merchant Acquiring business in Greece
‣ Signed agreement with Bank of Philippine Islands (BPI) to convert 300 existing bank-branded ATMs to Euronet ATMs
‣ Signed ATM network participation agreements with four additional banks in Spain
‣ Signed ATM recycler outsourcing agreement with mBank in Poland
‣ Renewals & Extensions:
‣ Renewed ATM network participation agreement with Unicredit Romania
‣ ATM Rollforward:
EFT Quarterly Highlights
Active ATM Rollforward Sequential Installed ATM Rollforward Sequential
ATMs at Beginning of Quarter/Year 37,729 ATMs at Beginning of Quarter/Year 45,485
Traditional High Value ATM Adds Traditional High Value ATM Adds
Independently Deployed ATMs 339 Independently Deployed ATMs 339
Outsourcing ATMs (346) Outsourcing ATMs (346)
Low-Margin India ATMs 19 Low-Margin India ATMs 19
Seasonally Re-activated / (De-activated) ATMs (964) ATMs at March 31, 2021 45,497
ATMs at March 31, 2021 36,777

28 April 2021 | Slide 8
‣ Launched:
‣ Microsoft end user fulfillment platform as a service in 50 countries worldwide
‣ Fame Hype, a white label platform for gaming influencers, via digital channels in 14 countries
‣ DAZN streaming sporting event subscriptions in Brazil, Japan & the U.S.
‣ Google Play recharge code distribution through Flipkart, India’s largest e-commerce platform
‣ Netflix distribution through Shopee, a large online marketplace in Southeast Asia, and TouchPay a kiosk outlet with 2,500 POS, both in Philippines
‣ Signed:
‣ Microsoft 365 distribution agreement through Apple Stores in 26 countries
‣ Exclusive technical processing and product distribution agreement with Lidl across Europe
‣ Extension of payment processing contract with Drogeriemarket Müller payment processing contract
‣ Microsoft 365 distribution agreement in India
‣ Mobile recharge and Google Play recharge code service for Jio Payments Bank
‣ Supplier agreement with Netflix in Philippines
‣ Digital channel distribution agreement with State Bank of India, India’s leading public sector bank
‣ Anghami distribution agreement in the United Arab Emirates and the Kingdom of Saudi Arabia
‣ Sony distribution agreement with Gamefinity in South Africa
epay Quarterly Highlights

28 April 2021 | Slide 9
‣ Network Growth:
‣ Our network reaches:
‣ 475,000 total retail network locations, an 18% increase vs. 1Q 2020
‣ 159 countries
‣ 3.6 billion bank accounts and 200 million wallet accounts
‣ Correspondent Expansion:
‣ Launched 13 new correspondents in 13 countries
‣ Launched service with Petnet in the Philippines, with over 200 branches
‣ Increased presence in Israel by launching Ria service at Wic Worldcom
‣ Signed 17 new correspondent agreements across 15 countries
‣ Signed with People’s Bank to offer send and payout services in Sri Lanka at its over 700 branches
‣ Other Business:‣ Launched partnership with Bred Banque in France to pay pensions to French expats
‣ Launched Ria app in Lithuania
‣ Digital transactions grew more than 125% year-over-year
‣ Bank deposit transactions grew 48% and deposit volume grew 57% year-over-year
Money Transfer Quarterly Highlights

28 April 2021 | Slide 10
‣ Signed agreement with Standard
Chartered Bank to launch “Nexus”, a
new banking as a service solution in
Indonesia
‣ REN is helping SCB connect to leading e-commerce marketplaces in the country to offer financial products and payment solutions
‣ Signed REN Connect agreement with
BPI Bank in the Philippines
‣ Allows BPI to connect to Instapay, the real time payments scheme in Philippines
‣ BPI can offer both person-to-person and person-to-merchant payments
Euronet Technology Success Update

28 April 2021 | Slide 11
Financial Highlights
First Quarter 2021 RICK L. WELLER, EVP & CFO
28 April 2021 | Slide 12
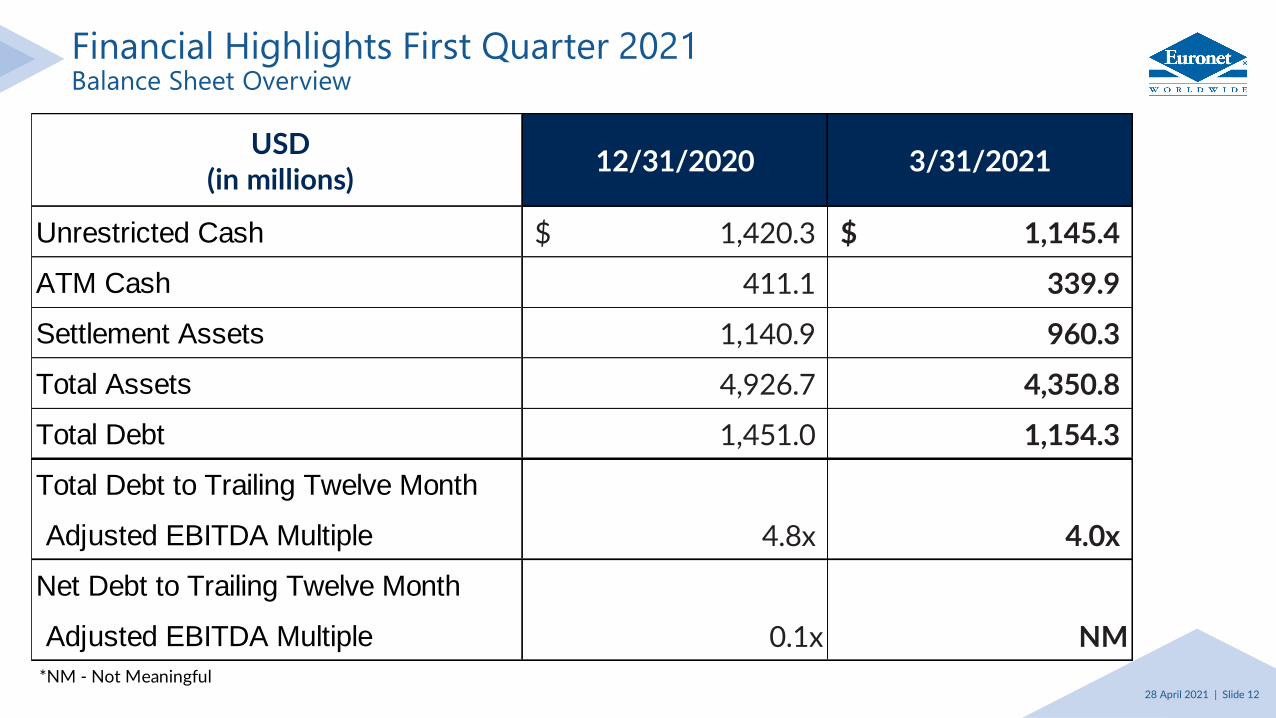
Financial Highlights First Quarter 2021Balance Sheet Overview
USD (in millions)
12/31/2020 3/31/2021
Unrestricted Cash 1,420.3$ 1,145.4$
ATM Cash 411.1 339.9
Settlement Assets 1,140.9 960.3
Total Assets 4,926.7 4,350.8
Total Debt 1,451.0 1,154.3
Total Debt to Trailing Twelve Month
Adjusted EBITDA Multiple 4.8x 4.0x
Net Debt to Trailing Twelve Month
Adjusted EBITDA Multiple 0.1x NM*NM - Not Meaningful

28 April 2021 | Slide 13
‣ Revenue - $652.7 million
‣ 12% increase from $583.9 million for Q1 2020
‣ 7% increase on a constant currency basis
‣ Operating Income - $10.4 million
‣ 67% decrease from $31.6 million for Q1 2020
‣ 70% decrease on a constant currency basis
‣ Adjusted EBITDA - $52.2 million
‣ 24% decrease from $68.7 million for Q1 2020
‣ 28% decrease on a constant currency basis
‣ Adjusted EPS $0.23
‣ 58% decrease from $0.55 for Q1 2020
Financial Highlights First Quarter 2021

28 April 2021 | Slide 14
Financial Highlights First Quarter 2021Three Year Transaction Trend

28 April 2021 | Slide 15
Financial Highlights First Quarter 2021Same Quarter Prior Year Comparison
USD (in millions)
Q1 2020 Q1 2021 Q1 2020 Q1 2021 Q1 2020 Q1 2021
EFT Processing 145.8$ 87.1$ 4.9$ (40.1)$ 25.2$ (18.1)$
% Change -40% -918% -172%
epay 172.9 242.3 16.5 29.2 18.3 31.3
% Change 40% 77% 71%
Money Transfer 266.3 324.9 22.3 35.3 30.9 44.4
% Change 22% 58% 44%
Subtotal 585.0 654.3 43.7 24.4 74.4 57.6
% Change 12% -44% -23%
Corporate, Eliminations &
Other(1.1) (1.6) (12.1) (14.0) (5.7) (5.4)
Consolidated Total 583.9$ 652.7$ 31.6$ 10.4$ 68.7$ 52.2$
% Change 12% -67% -24%
Revenue Operating Income Adjusted EBITDA

28 April 2021 | Slide 16
Financial Highlights First Quarter 2021Same Quarter Prior Year Comparison – Constant Currency
USD (in millions) Revenue Adjusted EBITDA
Q1 2020 Q1 2021* Q1 2020 Q1 2021* Q1 2020 Q1 2021*
EFT Processing 145.8$ 83.8$ 4.9$ (36.8)$ 25.2$ (16.0)$
% Change -43% -851% -163%
epay 172.9 229.4 16.5 27.5 18.3 29.5
% Change 33% 67% 61%
Money Transfer 266.3 310.6 22.3 32.7 30.9 41.3
% Change 17% 47% 34%
Subtotal 585.0 623.8 43.7 23.4 74.4 54.8
% Change 7% -46% -26%
Corporate, Eliminations &
Other(1.1) (1.6) (12.1) (13.9) (5.7) (5.3)
Consolidated Total 583.9$ 622.2$ 31.6$ 9.5$ 68.7$ 49.5$
% Change 7% -70% -28%
Operating Income

28 April 2021 | Slide 17
Closing RemarksMICHAEL J. BROWN, CHAIRMAN & CEO

28 April 2021 | Slide 18
Supplemental Data

28 April 2021 | Slide 19
Supplemental Data
EFT Money Corporate
Processing epay Transfer Services Consolidated
Net loss (8.7)$
Add: Income tax expense 6.1 Add: Total other expense, net 13.0
Operating (loss) income (40.1)$ 29.2$ 35.3$ (14.0)$ 10.4
Add: Depreciation and amortization 22.0 2.1 9.1 0.1 33.3 Add: Share-based compensation - - - 8.5 8.5
(Loss) Earnings before interest, taxes, depreciation,amortization, share-based compensation and other non-operating and non-recurring items
(Adjusted EBITDA) (1) (18.1)$ 31.3$ 44.4$ (5.4)$ 52.2$
(1) Adjusted EBITDA is a non-GAAP measure that should be considered in addition to, and not a substitute for, net (loss) income computed in accordance with U.S. GAAP.
Three months ended March 31, 2021
EURONET WORLDWIDE, INC.
Reconciliation Net Loss to Operating (Loss) Income and Adjusted EBITDA (unaudited - in millions)
28 April 2021 | Slide 20
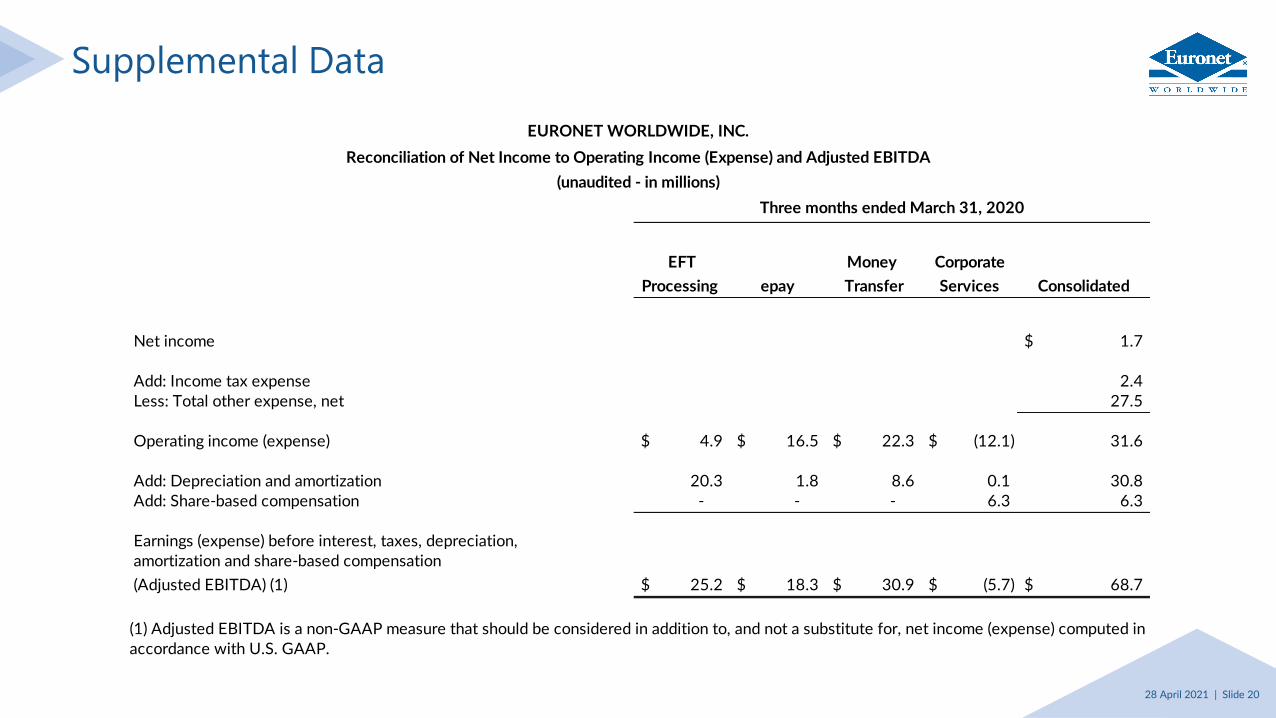
Supplemental Data
EFT Money Corporate
Processing epay Transfer Services Consolidated
Net income 1.7$
Add: Income tax expense 2.4 Less: Total other expense, net 27.5
Operating income (expense) 4.9$ 16.5$ 22.3$ (12.1)$ 31.6
Add: Depreciation and amortization 20.3 1.8 8.6 0.1 30.8 Add: Share-based compensation - - - 6.3 6.3
Earnings (expense) before interest, taxes, depreciation,amortization and share-based compensation
(Adjusted EBITDA) (1) 25.2$ 18.3$ 30.9$ (5.7)$ 68.7$
Three months ended March 31, 2020
EURONET WORLDWIDE, INC.
Reconciliation of Net Income to Operating Income (Expense) and Adjusted EBITDA
(1) Adjusted EBITDA is a non-GAAP measure that should be considered in addition to, and not a substitute for, net income (expense) computed in accordance with U.S. GAAP.
(unaudited - in millions)

28 April 2021 | Slide 21
Supplemental Data
Three months ended ended March 31, 2021
EFT Money CorporateProcessing epay Transfer Services Consolidated
Revenue 87.1$ 242.3$ 324.9$ (1.6)$ 652.7$
Add: Estimated foreign currency impact * (3.3) (12.9) (14.3) - (30.5)
Revenue - Constant Currency 83.8$ 229.4$ 310.6$ (1.6)$ 622.2$
Operating (loss) income (40.1)$ 29.2$ 35.3$ (14.0)$ 10.4$
Add: Estimated foreign currency impact * 3.3 (1.7) (2.6) 0.1 (0.9)
Operating (loss) - Constant Currency (36.8)$ 27.5$ 32.7$ (13.9)$ 9.5$
Adjusted EBITDA (reconciled on previous schedule) (18.1)$ 31.3$ 44.4$ (5.4)$ 52.2$
Add: Estimated foreign currency impact * 2.1 (1.8) (3.1) 0.1 (2.7)
Adjusted EBITDA - Constant Currency (16.0)$ 29.5$ 41.3$ (5.3)$ 49.5$
EURONET WORLDWIDE, INC.Reconciliation of Revenue, Operating Loss (Income) and Adjusted EBITDA to Constant Currency Amounts by Segment (unaudited - in millions)
(unaudited - in millions)

28 April 2021 | Slide 22
Supplemental Data
2021 2020
Net (loss) income attributable to Euronet Worldwide, Inc. (8.7)$ 1.9$
Foreign currency exchange loss 4.0 18.8
Intangible asset amortization 5.8 5.7
Share-based compensation 8.5 6.3
Non-cash interest accretion 3.9 3.7
Income tax effect of above adjustments (2.1) (6.2)
Non-cash GAAP tax expense 1.1 -
Adjusted earnings (1) 12.5$ 30.2$
Adjusted earnings per share - diluted (1) 0.23$ 0.55$
Diluted weighted average shares outstanding (GAAP) 52,762,845 54,779,321
Effect of anti-dilutive shares not included in GAAP calculation 1,147,911 -
Effect of unrecognized share-based compensation on diluted shares outstanding 455,087 201,873
Adjusted diluted weighted average shares outstanding 54,365,843 54,981,194
(1) Adjusted earnings and adjusted earnings per share are non-GAAP measures that should be considered in addition to,
and not as a substitute for, net income and earnings per share computed in accordance with U.S. GAAP.
To see how these adjustments correlate to the income statement please see the first quarter 2021 earnings press release.
EURONET WORLDWIDE, INC.
Reconciliation of Adjusted Earnings per Share
(unaudited - in millions, except share and per share data)
Three Months Ended
March 31,

Thank YouEURONET WORLDWIDE, INC.
28 April 2021 | Slide 23